


 , Mateusz Król 1,†, Emanuel Kolanko 1, Łukasz Limanówka 2, Agnieszka Prusek 1, Aleksandra Skubis-Sikora 1, Edyta Bogunia 1, Bartosz Sikora 1, Mateusz Hermyt 1, Marcin Michalik 1, Aniela Grajoszek 3, Jacek Pająk 4
1 Department of Cytophysiology, Chair of Histology and Embryology, Faculty of Medical Sciences in Katowice, Medical University of Silesia in Katowice, 40-752 Katowice, Poland
2 Students Scientific Society, Chair of Histology and Embryology, Faculty of Medical Sciences in Katowice, Medical University of Silesia in Katowice, 40-752 Katowice, Poland
3 Department of Experimental Medicine, Medical University of Silesia in Katowice, 40-752 Katowice, Poland
4 Department of Pathomorphology and Molecular Diagnostic, Faculty of Medical Sciences in Katowice, Medical University of Silesia in Katowice, 40-752 Katowice, Poland
†These authors contributed equally.
Abstract
Background: In humans, chronic liver disease (CLD) is a
serious clinical condition with many life-threatening complications. Currently,
there is no therapy to stop or slow down the progression of liver fibrosis.
Experimental mouse models of CLD, induced by repeated intraperitoneal injections
of carbon tetrachloride (CCL
Keywords
- experimental models of hepatotoxicity
- galactosoamine
- carbon tetrachloride
- chronic liver failure
- stem cell therapy
In humans, chronic liver disease (CLD) is a large group of clinical conditions
characterized by impairment of liver function and morphology lasting over 6
months. The most common causes of CLD are alcohol consumption and viral
infection. Less common etiological factors of CLD include nonalcoholic
steatohepatitis, biliary obstructive disorders, right sided heart failure,
Wilson’s disease, hemochromatosis, and chronic use of specific medications [1].
Regardless of the etiology, untreated CLD leads to cirrhosis, which is defined as
pathological remodeling of the liver parenchyma with fibrotic scar formation and
presence of regenerative nodules. The pathogenesis of this disease involves the
destruction of parenchymal cells by the causative agent. Apoptosis or necrosis of
hepatocytes induces an inflammatory reaction that activates hepatic stellate
cells (HSCs) via multiple cytokines such as IGF-1, TGF-
Animal models of hepatotoxicity induced by hepatotoxins, including carbon
tetrachloride (CCl
In the present study, we compared the development of histopathological changes
induced in Sprague Dawley rat and BALB/c mouse experimental models by repeated
injections of CCl
The study was performed on two-month-old male Sprague Dawley rats weighing
180–220 g, and six-week-old male BALB/c mice weighing 18–25 g, purchased from
the Animal House of the Center for Experimental Medicine (CMD) of the Medical
University of Silesia in Katowice. During the experiment, the animals were housed
in cages (six per cage) under standard conditions of temperature (22
°C
The study was approved by the Local Ethics Committee for Animal Experiments of the Medical University of Silesia (decision no. 18/2018). Rats and mice were treated in accordance with the Directive 2010/63/EU on animal experimentation.
The animals were randomly divided into 4 groups (18 individuals per group).
D-galactosamine hydrochloride (no. 22981; Cayman Chemical; Ann Arbor, Michigan,
USA) was dissolved in physiological saline. Carbon tetrachloride (no. 118804704;
Chempur; Piekary Śl
| Hepatotoxin | Control groups | Chronic liver injury | ||
|---|---|---|---|---|
| Rats | Mice | Rats | Mice | |
| Carbon tetrachloride | 200 |
25 |
100 |
12.5 |
| D-GalN hydrochloride | 250 |
125 |
25 mg/100 g bw, twice a week | 75 mg/100 g bw; twice a week |
During autopsy, 1 mL of orbital sinus blood was collected. Alanine transaminase (ALT), aspartate transaminase (AST), and alkaline phosphatase (ALP) activities and total protein (TP) were measured to assess liver injury by liver function tests. Blood tests were performed on a chemistry analyzer (AU480; Beckman Coulter, Brea, CA, USA) according to protocols provided by the manufacturer. In addition, blood smears stained with May Grunwald-Giemsa stain were done to assess cell morphology. Serum biochemistry tests and blood staining were performed in the Silesian Analytical Laboratory (Katowice; Poland).
The excised sections of the left liver lobe were fixed in 10% buffered formalin
solution, dehydrated, and embedded in paraffin. The obtained paraffin blocks were
cut into 4
The severity of hepatitis was assessed by a simple grading algorithm evaluating
parenchymal injury and interface hepatitis. Normal liver parenchyma was graded as
(0). Hepatitis was graded as follows: minimal (1), mild (2), moderate (3), and
marked and/or multiacinar bridging necrosis (4) [24, 25]. Liver steatosis was
graded as follows:
The progression of liver fibrosis was evaluated by Sirius red staining, which
was performed to visualize collagen fibers. Liver sections (4
To quantify the percentage area occupied by collagen fibers, fifteen random
fields of 0.0944 mm
The localization of cells expressing Ki-67, a marker of proliferation,
Before incubation with the primary antibody, the sections intended for Ki-67 visualization were incubated for 60 min with a citric acid-based antigen unmasking solution (Vector Laboratories; Newark, CA, USA) for antigen retrieval. Non-specific antibody binding was then blocked using 2.5% equine serum (Vector Laboratories; Newark, CA, USA) for 60 min. Subsequently, liver sections were incubated with anti-Ki67 (SP6) antibody (ab16667; Abcam, Cambridge, United Kingdom) diluted 1:400 for 20 h at 4 °C and with anti-rabbit secondary antibody conjugated with peroxidase (Vector Laboratories; Newark, CA, USA) at room temperature for 30 min. Appropriate positive controls were created as sections taken from human tonsils.
Liver sections intended for identifying apoptotic cells and, separately,
alpha-smooth muscle actin (
Final visualization was achieved by using diaminobenzidine (Vector Laboratories;
Newark, CA, USA). On each slide, ten random fields of 0.3779 mm
Small sections taken from the liver were homogenized using a Unidrive X 1000 homogenizer (CAT, Ballrechten-Dottingen, Germany). Total cellular RNA was isolated using the commercially available RNA Extracol reagent (Eurx, Gdańsk, Poland) according to the manufacturer’s instructions. Nucleic acid concentration and quality were measured with Nanodrop ND-2000 (Thermo Scientific, Waltham, MA, USA). RNA was stained with Simply Safe (Eurx, Gdańsk, Poland) and visualized after agarose gel electrophoresis.
Ribonucleic acid was reverse-transcribed into complementary deoxyribonucleic
acid (cDNA) using total RNA and random hexamer primers of the smART First Strand
cDNA Synthesis Kit (Eurx, Gdańsk, Poland) and
The expression of eight genes involved in liver fibrosis, angiogenesis,
oxidative stress, lipid metabolism, and carcinogenesis (Table 2, Ref. [32, 33, 34, 35, 36, 37])
was detected using FastStart Essential DNA Green Master (Roche, Basel,
Switzerland) in Light Cycler 96 (Roche, Basel, Switzerland). All samples were
tested in triplicate. The oligonucleotide primers used in the reactions were
purchased from Sigma Aldrich Company (St.Louis, MO, USA). Each run was
completed using melting curve analysis to confirm the specificity of the
amplification and absence of primer dimers. The relative expression of the
examined genes was calculated according to the 2
| Gene name | Gene abbreviation | Function | References |
|---|---|---|---|
| Type I collagen | COL1A1 | Liver fibrosis | [32] |
| Type III collagen | COL3A1 | ||
| Transforming growth factor beta | TGF- | ||
| Tyrosine-protein kinase Met | c-Met | Angiogenesis | [33, 34] |
| Hepatocyte growth factor | HGF | ||
| Cytochrome P450 2E1 | CYP2E1 | Oxidative stress | [35] |
| Peroxisome proliferator-activated receptor alpha | PPAR- |
Lipid metabolism | [36] |
| Growth arrest and DNA-damage-inducible protein alpha | Gadd45a | Carcinogenesis | [37] |
The data was analyzed using the Statistica 13 computer software (StatSoft
Polska, Kraków, Poland). Parametric analysis of the obtained results was
performed using one-way ANOVA with appropriate post-hoc tests. The Kruskal-Wallis
test was used if normal distribution could not be assumed. For independent
groups, Student’s t-test was also used where appropriate. Differences
were considered as significant if p
In rats intoxicated with CCl
| Time point | Leukocytes [10 |
Lymphocytes [%] | Monocytes [%] | Eosinophils [%] | Band neutrophils [%] | Segmented neutrophils [%] |
|---|---|---|---|---|---|---|
| Carbon Tetrachloride Rats | ||||||
| Control | 5.0 (3.0–5.2) | 74 (67–79) | 0 (0–0) | 0 (0–2) | 1 (0–3) | 20 (15–25) |
| 2 w | 6.9 (6.8–7.0) | 53 (50–55)* | 2 (1–2)* | 0 (0–0) | 1 (0–2) | 45 (43–47)* |
| 4 w | 6.2 (4.8–7.5) | 77 (69–85) | 0 (0–0) | 2 (1–2) | 2 (1–3) | 20 (12–27) |
| 6 w | 5.5 (5.0–9.0) | 67 (59–77) | 0 (0–0) | 1 (1–2) | 1 (1–3) | 31 (20–37) |
| 8 w | 6.0 (5.2–10.5) | 73 (28–84) | 0 (0–0) | 0 (0–1) | 2 (0–3) | 26 (14–69) |
| 10 w | 6.0 (2.3–6.7) | 54 (21–75) | 0 (0–1) | 2 (0–2) | 1 (0–4) | 43 (18–79) |
| 12 w | 1.7 (1.5–1.8) | 76 (76–76) | 0 (0–0) | 2 (1–2) | 3 (2–3) | 20 (19–21) |
| Carbon Tetrachloride Mice | ||||||
| Control | 4.5 (3.8–5.0) | 46 (42–47) | 0 (0–2) | 0 (0–1) | 0 (0–1) | 53 (50–58) |
| 2 w | 5.6 (4.5–6.7) | 19 (11–26)* | 5 (1–9) | 2 (0–3) | 2 (1–2) | 74 (68–79)* |
| 4 w | 3.4 (2.3–4.5) | 61 (59–62)* | 0 (0–0) | 1 (0–1) | 0 (0–0) | 39 (37–41)* |
| 6 w | 3.8 (1.8–6.0) | 44 (33–50) | 1 (0–2) | 0 (0–0) | 0 (0–0) | 55 (48–67) |
| 8 w | 4.8 (4.5–5.0) | 44 (42–46) | 1 (0–1) | 0 (0–0) | 0 (0–0) | 56 (53–58) |
| 10 w | 15.0 (12.0–18.0)* | 22 (18–24)* | 4 (4–5)* | 0 (0–0) | 0 (0–1) | 74 (72–76)* |
| 12 w | 4.5 (3.0–7.5) | 50 (34–56) | 2 (2–6) | 0 (0–0) | 0 (0–0) | 48 (42–60)* |
| D–Galactosamine Rats | ||||||
| Control | 2.5 (2.2–4.0) | 78 (76–88) | 0 (0–0) | 2 (2–6) | 2 (0–5) | 15 (8–18) |
| 2 w | 6.0 (5.8–8.5)* | 66 (64–71)* | 0 (0–1) | 2 (0–3) | 1 (0–3) | 31 (26–33)* |
| 4 w | 4.5 (3.5–7.5) | 78 (72–81) | 0 (0–0) | 1 (0–2) | 1 (0–3) | 21 (16–25) |
| 6 w | 3.8 (3.0–4.0) | 79 (67–90) | 0 (0–0) | 1 (1–7) | 1 (1–1) | 18 (8–25) |
| 8 w | 4.0 (3.0–5.7) | 86 (74–88) | 0 (0–0) | 1 (1–2) | 2 (0–2) | 11 (8–25) |
| 10 w | 4.2 (2.5–4.8) | 74 (45–75) | 0 (0–1) | 3 (1–4) | 1 (0–1) | 24 (22–49) |
| 12 w | 4.6 (3.8–5.3) | 78 (70–86) | 0 (0–0) | 4 (1–7) | 2 (2–2) | 16 (11–21) |
| D–Galactosamine Mice | ||||||
| Control | 4.5 (4.5–4.5) | 62 (48–62) | 3 (0–4) | 0 (0–2) | 0 (0–1) | 38 (31–49) |
| 2 w | 6.0 (3.8–12.0) | 57 (54–64) | 1 (0–3) | 1 (0–1) | 0 (0–3) | 36 (36–44) |
| 4 w | 2.5 (2.0–3.0)* | 71 (70–93) | 0 (0–1) | 0 (0–0) | 0 (0–1) | 29 (6–29) |
| 6 w | 2.5 (2.4–4.5) | 66 (61–74) | 0 (0–0) | 0 (0–0) | 0 (0–0) | 34 (26–39) |
| 8 w | 2.2 (1.8–2.5* | 71 (67–75) | 0 (0–0) | 1 (0–1) | 1 (0–1) | 29 (25–31) |
| 10 w | 4.5 (3.0–6.0) | 51 (49–58) | 0 (0–0) | 0 (0–0) | 0 (0–0) | 49 (42–51) |
| 12 w | 5.5 (5.0–6.0)* | 67 (53–74) | 1 (1–2) | 0 (0–0) | 1 (0–2) | 31 (22–46) |
| Data are presented as a median (min-max). No basophils were identified in blood
smears; n = 3. *p | ||||||
Changes in the percentage of blood cells in the group of CCl
The obtained data indicate that there are only minor changes in the percentage
of white blood cells, caused by long-term administration of CCl
We did not observe significant changes in ALT and AST activities in rats and
mice intoxicated with CCl
| Time point | Alanine transaminase (ALT) [U/L] | Aspartate transaminase (AST) [U/L] | Alkaline phosphatase (ALP) [U/L] | Total Protein [g/dL] |
|---|---|---|---|---|
| Carbon Tetrachloride Rats | ||||
| Control | 50.7 (49.3–66.2) | 201.6 (131.4–260.4) | 229.5 (172.5–289.4) | 6.2 (5.7–6.3) |
| 2 w | 106.4 (84.8–128) | 254.25 (230.3–278.2) | 234.05 (194.4–273.7) | 6 (5.8–6.2) |
| 4 w | 96.1 (78.4–113.8) | 197.9 (197.6–198.2) | 320.75 (316.4–325.1) | 5.9 (5.9–5.9) |
| 6 w | 65.3 (49.7–68.3) | 226.4 (214.3–272.6) | 211.5 (157.3–219.7) | 5.9 (5.3–6.3) |
| 8 w | 108.1 (66.5–113.2) | 215.5 (170–237) | 208.2 (198.3–272.1) | 5.5 (5.2–5.6) |
| 10 w | 82.3 (58.7–92.3) | 191.2 (188.8–229.3) | 384.3 (242.9–522.9) | 5.4 (5.2–6) |
| 12 w | 76.35 (62.5–90.2) | 212.15 (166.1–258.2) | 190 (175.9–204.1) | 5.6 (5.6–5.7) |
| Carbon Tetrachloride Mice | ||||
| Control | 137.1 (128.5–274) | 989 (923.3–1054.7) | 65.5 (54–79.3) | 4.7 (4.6–5) |
| 2 w | 117.85 (117.7–118) | 694.85 (666.2–723.5) | 108.65 (93.9–123.4) | 5.4 (4.7–6.1) |
| 4 w | 95.9 (78.8–113) | 1070.55 (611.6–1529.5) | 132.95 (131.5–134.4)* | 5.25 (5–5.5) |
| 6 w | 174 (77.3–194.7) | 1325.5 (599.9–1459) | 121.8 (117–127.9)* | 5.5 (5.3–6) |
| 8 w | 195.35 (163.2–227.5) | 779.5 (538.8–1020.2) | 110.95 (97.6–124.3)* | 5.25 (5.2–5.3) |
| 10 w | 393.6 (322.1–594.8) | 1430.3 (968.9–1791.2) | 128.2 (118.8–134.5)* | 5.6 (5–6.4) |
| 12 w | 100.1 (99.6–180) | 512.2 (446.3–1276.7) | 94 (93.3–105.4)* | 4.6 (4.4–5) |
| D–Galactosamine Rats | ||||
| Control | 51.6 (48.7–61.5) | 198.4 (178–220.2) | 202 (154.3–268.9) | 6.2 (6–6.3) |
| 2 w | 62.5 (53–66.9) | 228.5 (172.6–245.6) | 303.2 (245.2–340.6) | 5.8 (5.7–6.1) |
| 4 w | 77.9 (67.8–87.4)* | 220.3 (203.1–299.2) | 276.7 (235–319.2) | 6 (5.7–6.3) |
| 6 w | 59 (41.2–69.5) | 211.6 (195.8–233.8) | 343.3 (247.3–357.2) | 5.9 (5.7–6) |
| 8 w | 60.8 (54.4–83.9) | 194.6 (188.4–199.4) | 283.7 (261.9–327.5) | 5.6 (5.2–5.8)* |
| 10 w | 64.7 (58.8–73.4) | 243.8 (193.2–262.5) | 260.9 (195.8–335.8) | 5.8 (5.5–5.9)* |
| 12 w | 58.2 (52.5–84.2) | 253.5 (212.2–348.7) | 333.5 (239.1–381.9) | 6.1 (5.9–6.2) |
| D–Galactosamine Mice | ||||
| Control | 143.6 (134.6–206.8) | 1049.6 (636–2328.7) | 114.3 (105.6–119.6) | 4.5 (4.4–5.1) |
| 2 w | 103.5 (76.5–183.9) | 560.8 (453.1–1571.8) | 125.3 (119–130) | 4.7 (4.4–4.8) |
| 4 w | 195.2 (111.9–232) | 1033.9 (279.7–1431) | 121.8 (98.6–144.5) | 5.1 (5–5.2) |
| 6 w | 155.05 (130–180.1) | 1403 (780.5–2025.5) | 117.25 (112.4–122.1) | 5.3 (5.1–5.5) |
| 8 w | 124.4 (65.8–167.1) | 626.8 (198.5–1672.2) | 105.8 (86.1–107.2) | 4.6 (4.5–5) |
| 10 w | 145 (92.6–153.5) | 675.7 (504.8–1141.6) | 105 (102.2–106) | 4.7 (4.4–5) |
| 12 w | 94.1 (92.2–106) | 605.3 (559.2–703) | 98.7 (84.7–104.7) | 4.5 (4.3–5) |
| Data are presented as median (min-max); n = 3. *p | ||||
Similarly to blood smears, we did not observe a clear pattern of long-term changes in serum parameters, reflecting toxic effects of both toxic compounds.
Most CCl
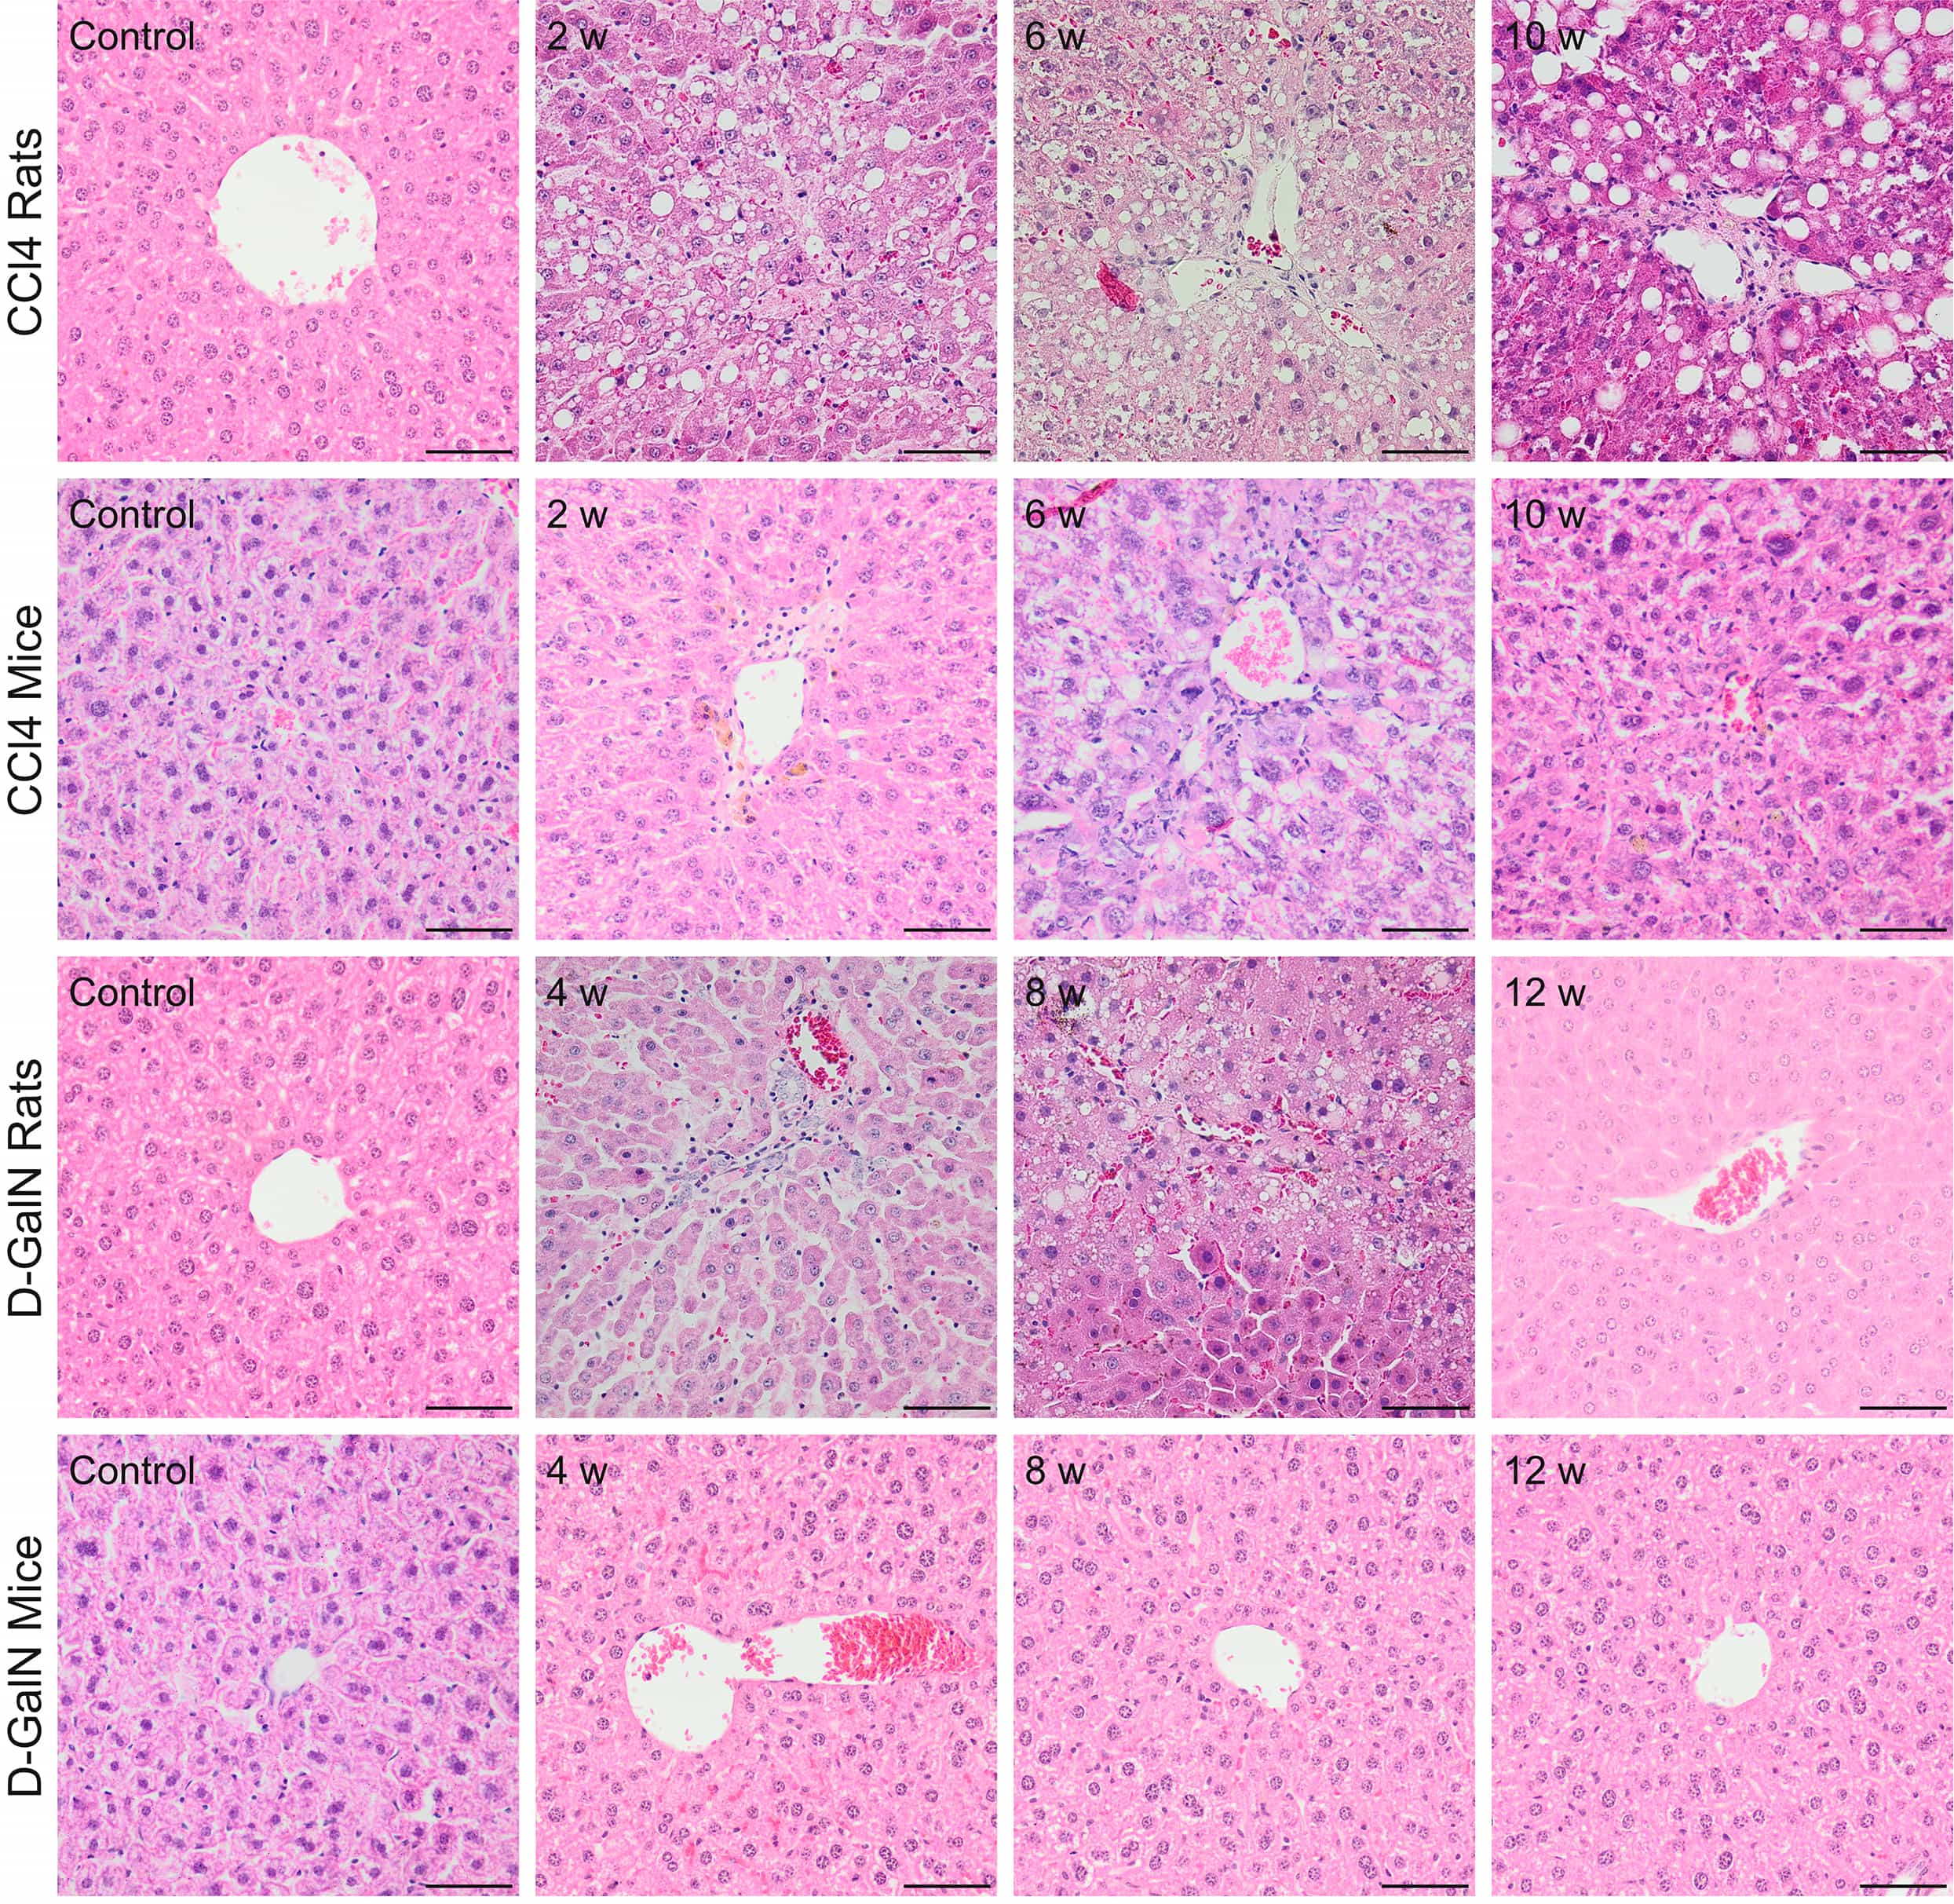 Fig. 1.
Histopathological changes in zone 3 (pericentral) of the hepatic
acinus in rats and mice after repeated CCl
| Histopathological grading (0–4) | Steatosis (0–3) | Fibrosis: Ishak score (0–6) | ||||
| Carbon tetrachloride | ||||||
| Rats | Mice | Rats | Mice | Rats | Mice | |
| Control | 0 | 0 | 0 | 0 | 0 | 0 |
| 2 w | 0 | 1 | 1 | 0 | 2 | 3 |
| 4 w | 1 | 1 | 2 | 0 | 3 | 3 |
| 6 w | 1 | 1 | 0 | 0 | 4 | 3 |
| 8 w | 1 | 3 | 1 | 0 | 4 | 3 |
| 10 w | 2 | 4 | 1 | 0 | 4 | 4 |
| 12 w | 1 | 1 | 1 | 0 | 5 | 4 |
| D-Galactosamine | ||||||
| Rats | Mice | Rats | Mice | Rats | Mice | |
| Control | 0 | 0 | 0 | 0 | 0 | 0 |
| 2 w | 0 | 0 | 0 | 0 | 0 | 0 |
| 4 w | 2 | 1 | 0 | 0 | 1 | 0 |
| 6 w | 2 | 0 | 0 | 0 | 1 | 0 |
| 8 w | 1 | 0 | 0 | 0 | 3 | 0 |
| 10 w | 1 | 2 | 0 | 0 | 3 | 1 |
| 12 w | 0 | 0 | 0 | 0 | 3 | 1 |
| Histopathological grading is the median of three animals. n = 3. | ||||||
In mice treated with CCl
In D-GalN-intoxicated rats, we observed mild hepatitis at weeks 4 and 6 of intoxication. During this period, we observed inflammatory infiltration in zone 1 of the hepatic acini (around portal areas) and ballooning degeneration around the central veins in zone 3. At a later time point, hepatitis slowly decreased (Fig. 1, Table 5).
We did not observe any histopathological changes in the livers of D-GalN-treated mice (Fig. 1, Table 5).
To sum up, in CCl
In animals of the control groups representing normal parenchymal architecture of the liver without fibrous expansion, the area of fiber deposition was 1% in rats and 0.37% in mice (Table 5, Figs. 2,3,4,5).
In the groups of CCl
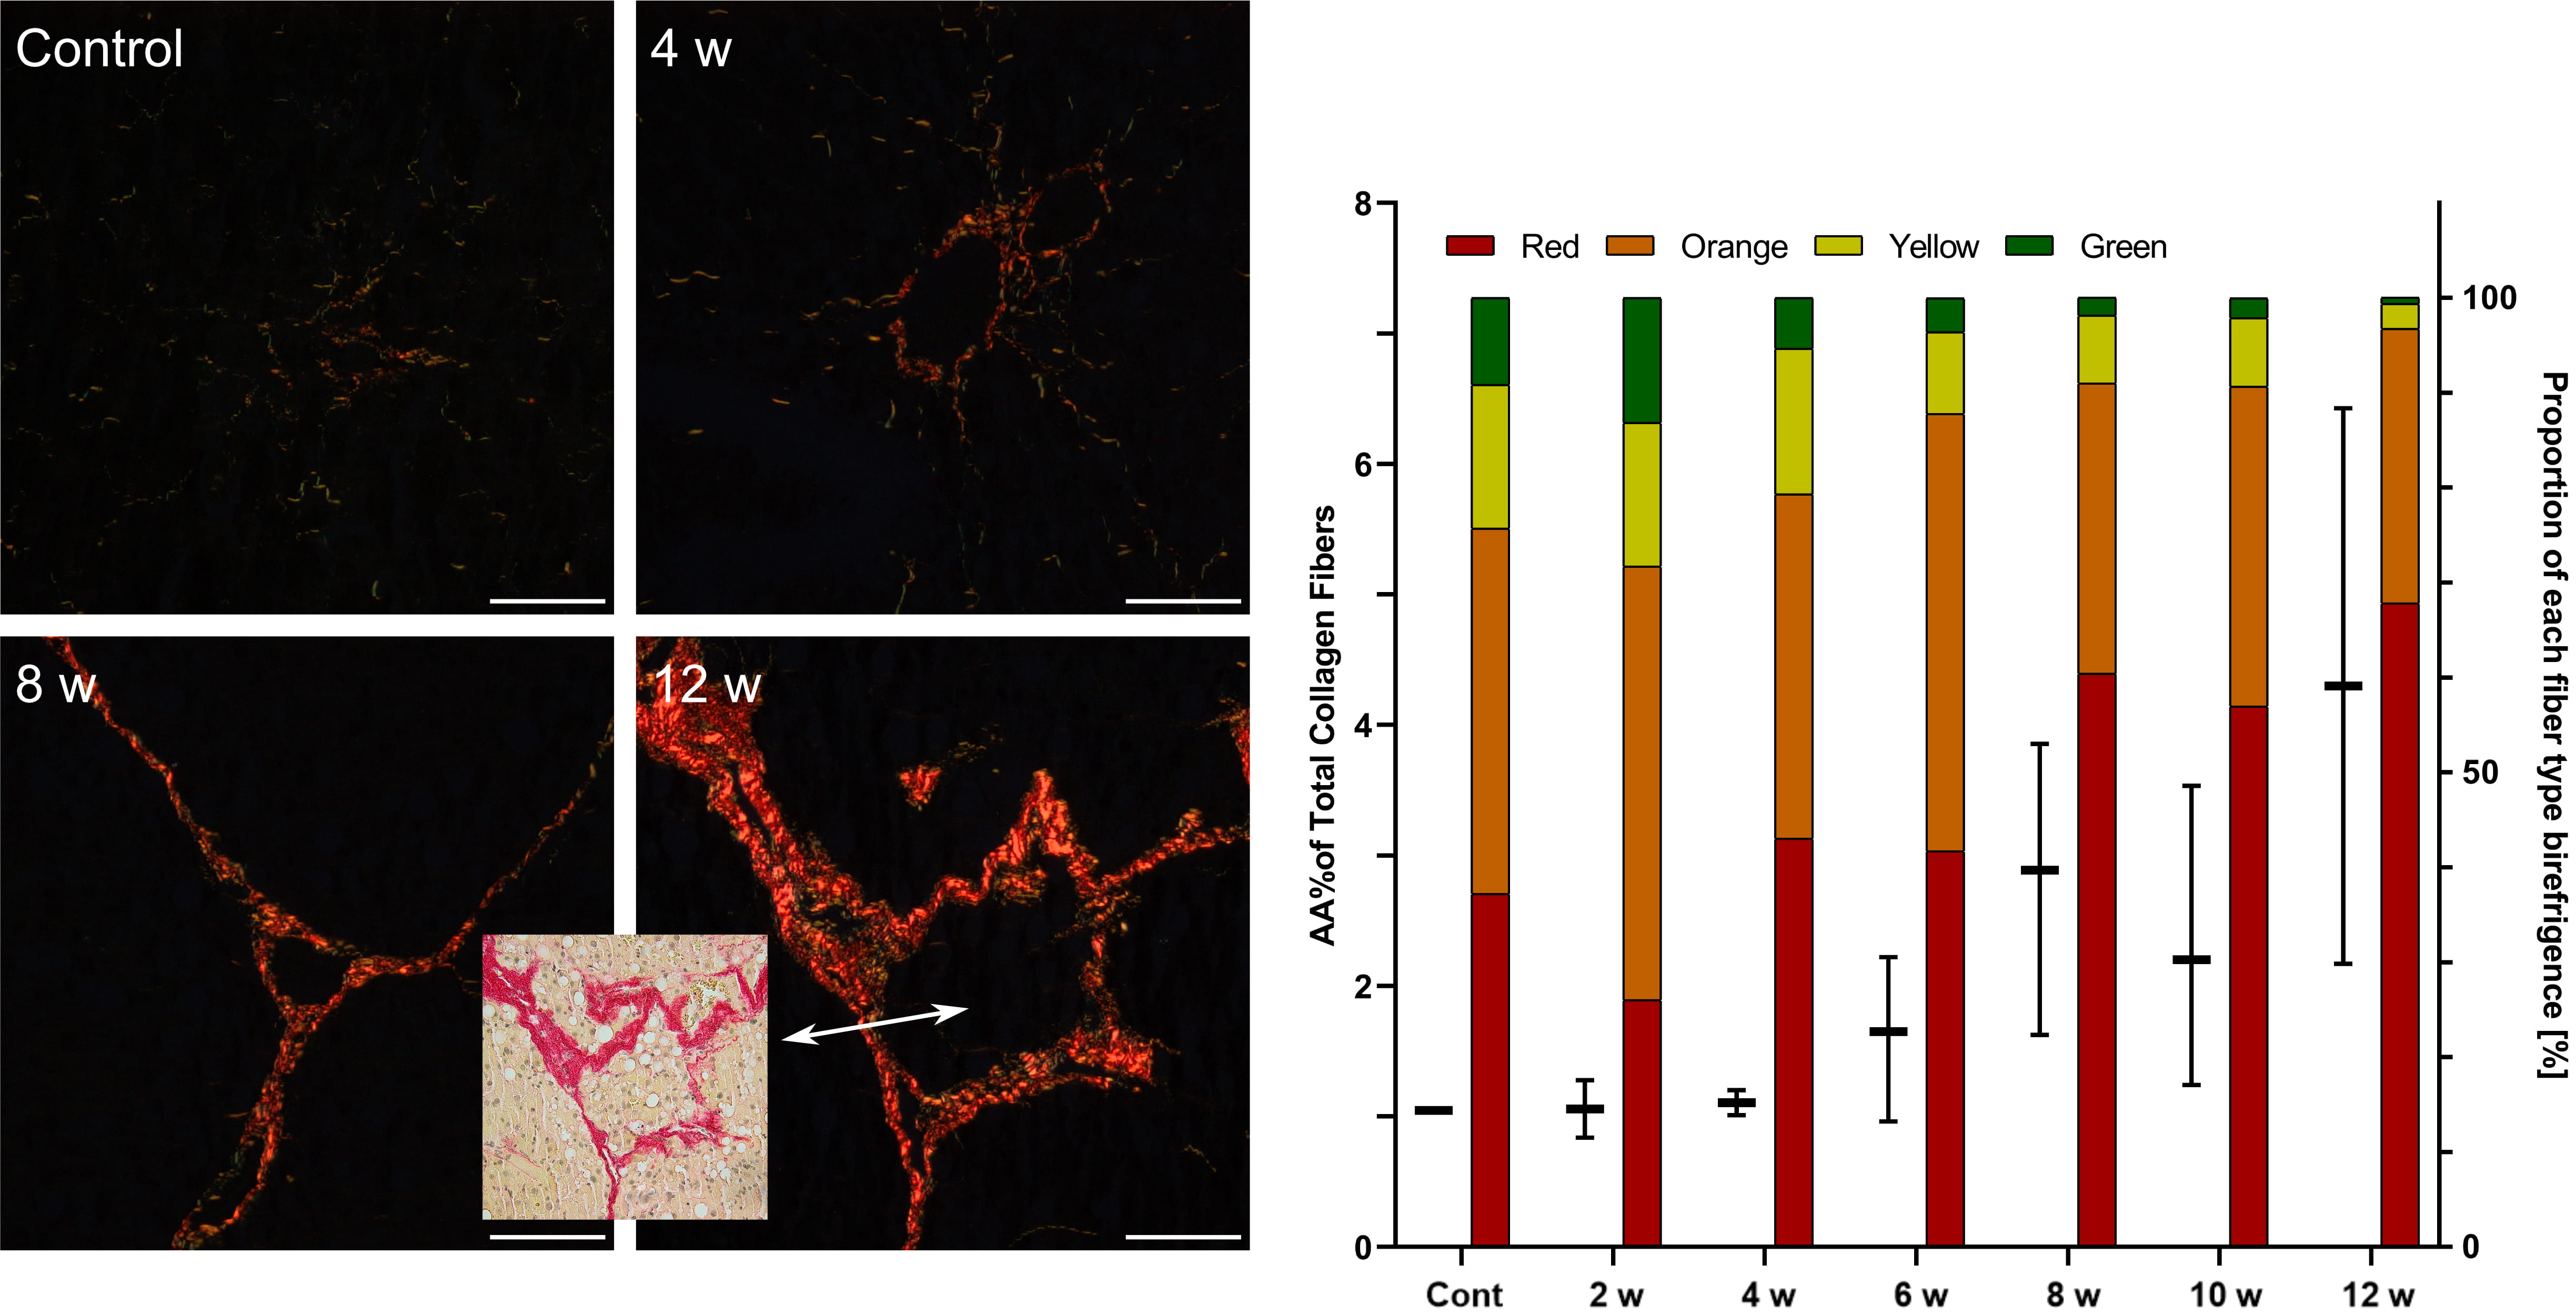 Fig. 2.
Assessment of fibrosis in the livers of rats after repeated
CCl
In CCl
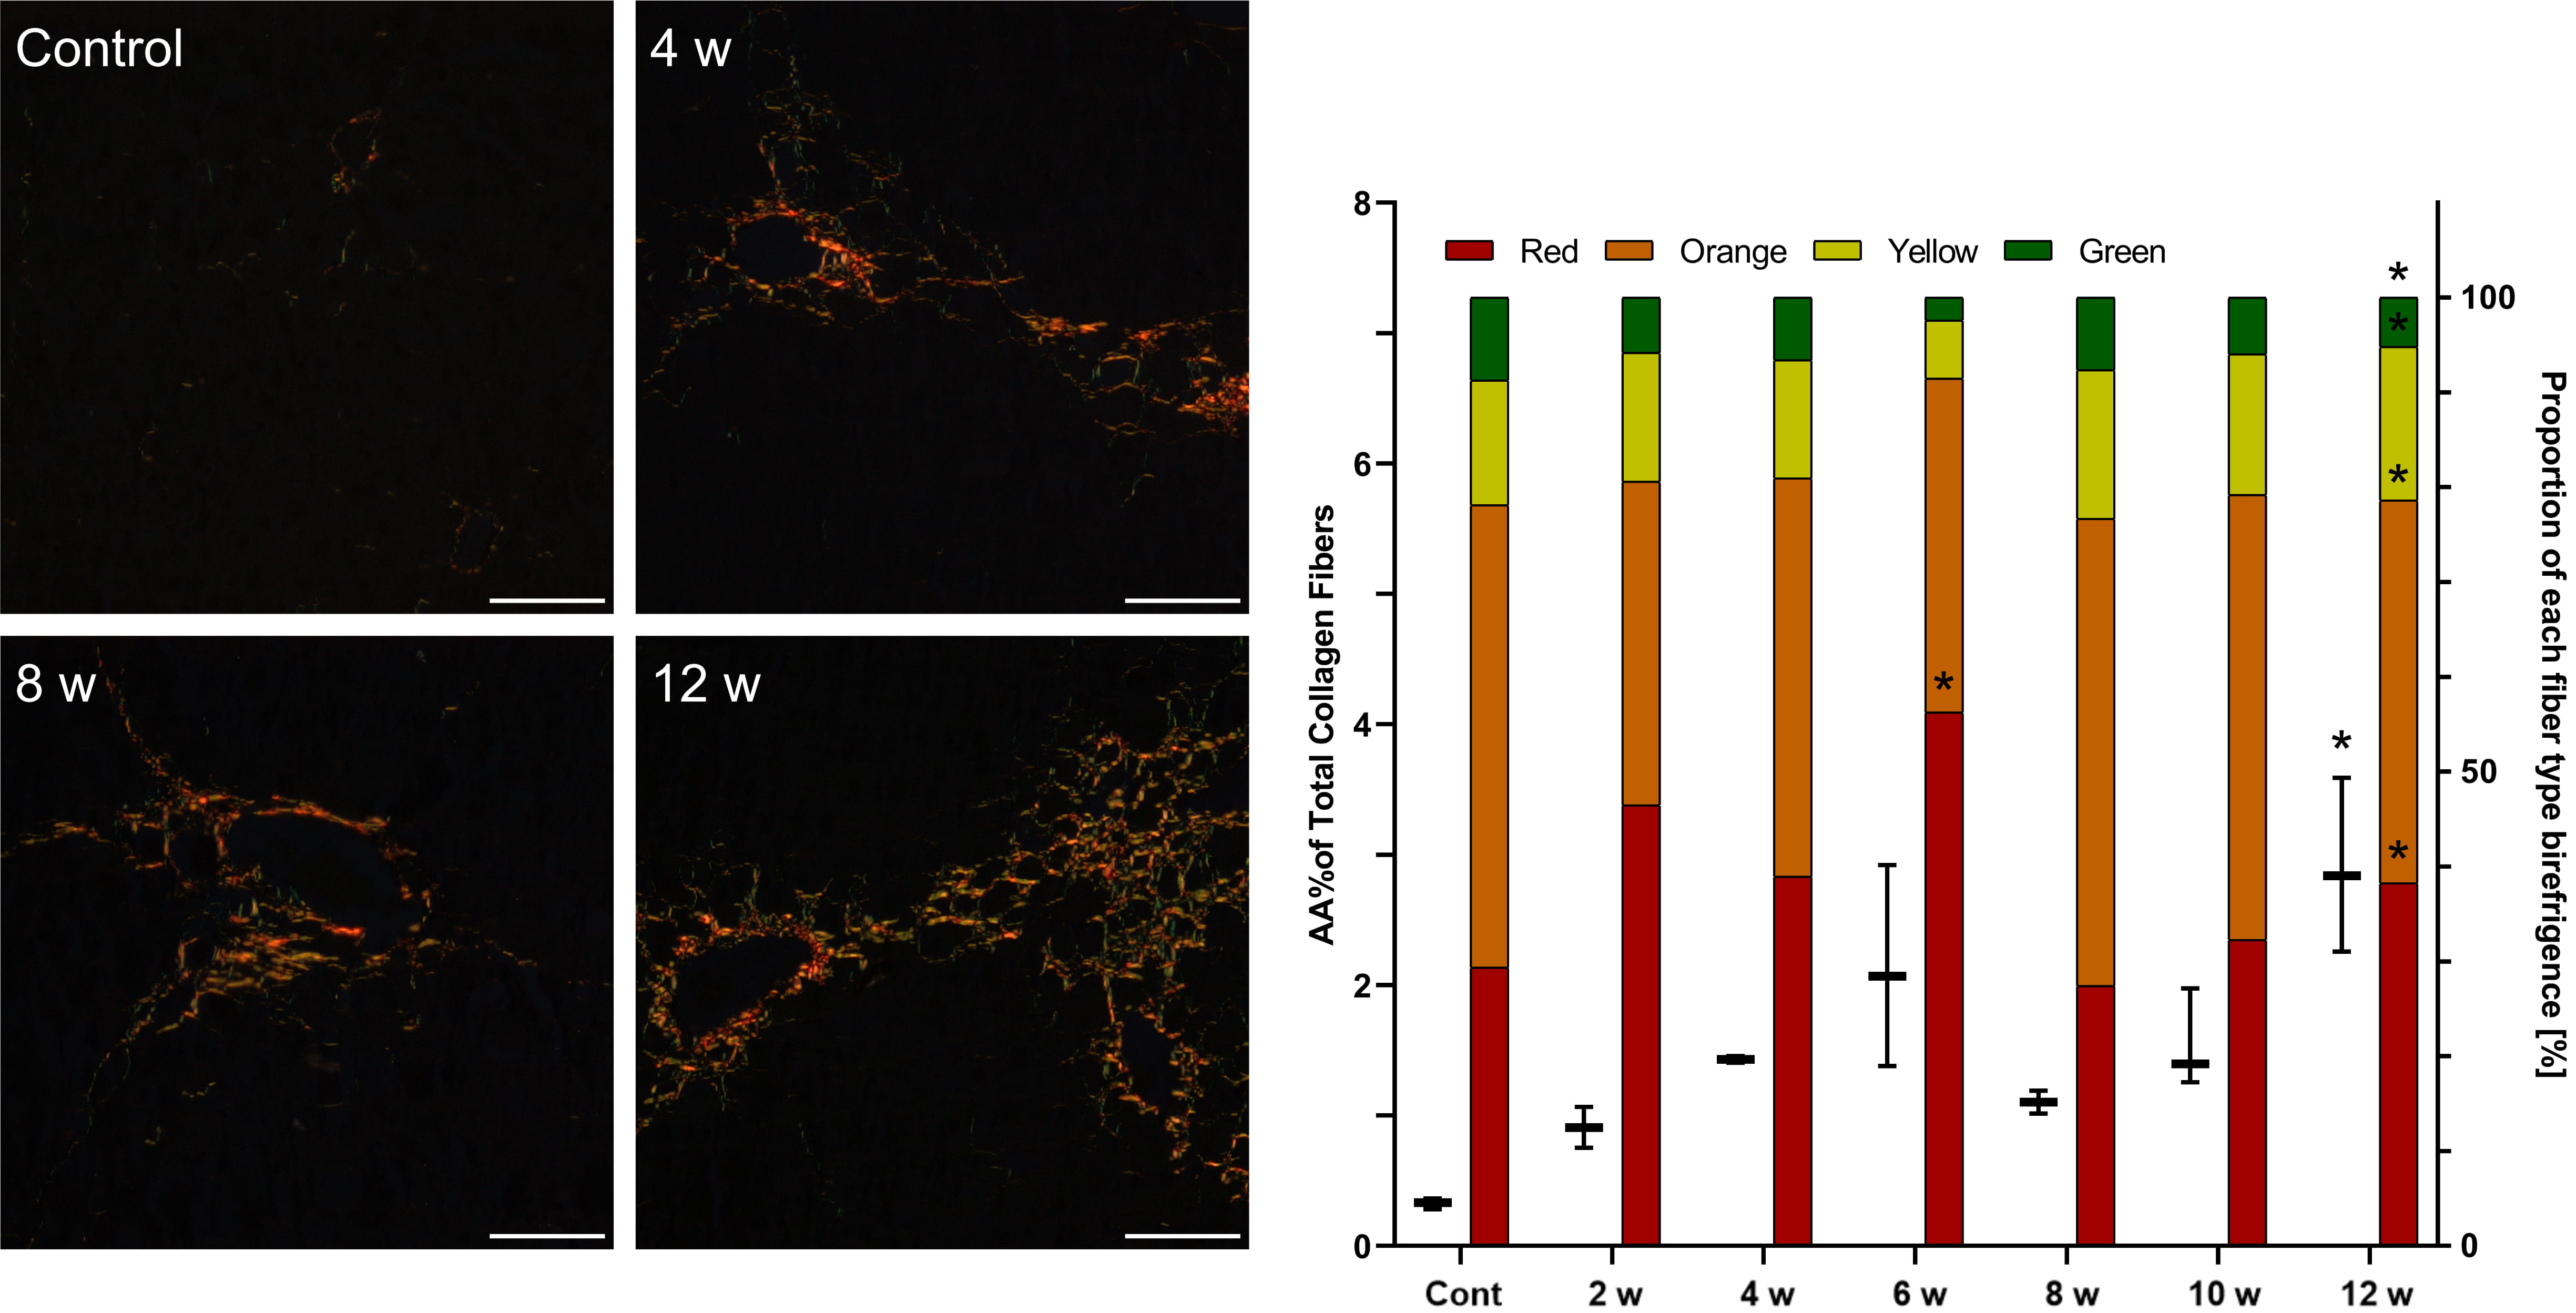 Fig. 3.
Assessment of fibrosis in the livers of mice after repeated
CCl
In D-GalN-treated rats, the first collagen depositions were observed at week 4. Polarizing microscopy showed fibrous expansion from some portal and pericentral areas and short septa corresponding to Ishak score 1 but no increased collagen area. After 8 weeks of intoxication, we noted moderate fibrosis with collagen deposition and an increasing number of thick red fibers (Table 5, Fig. 4).
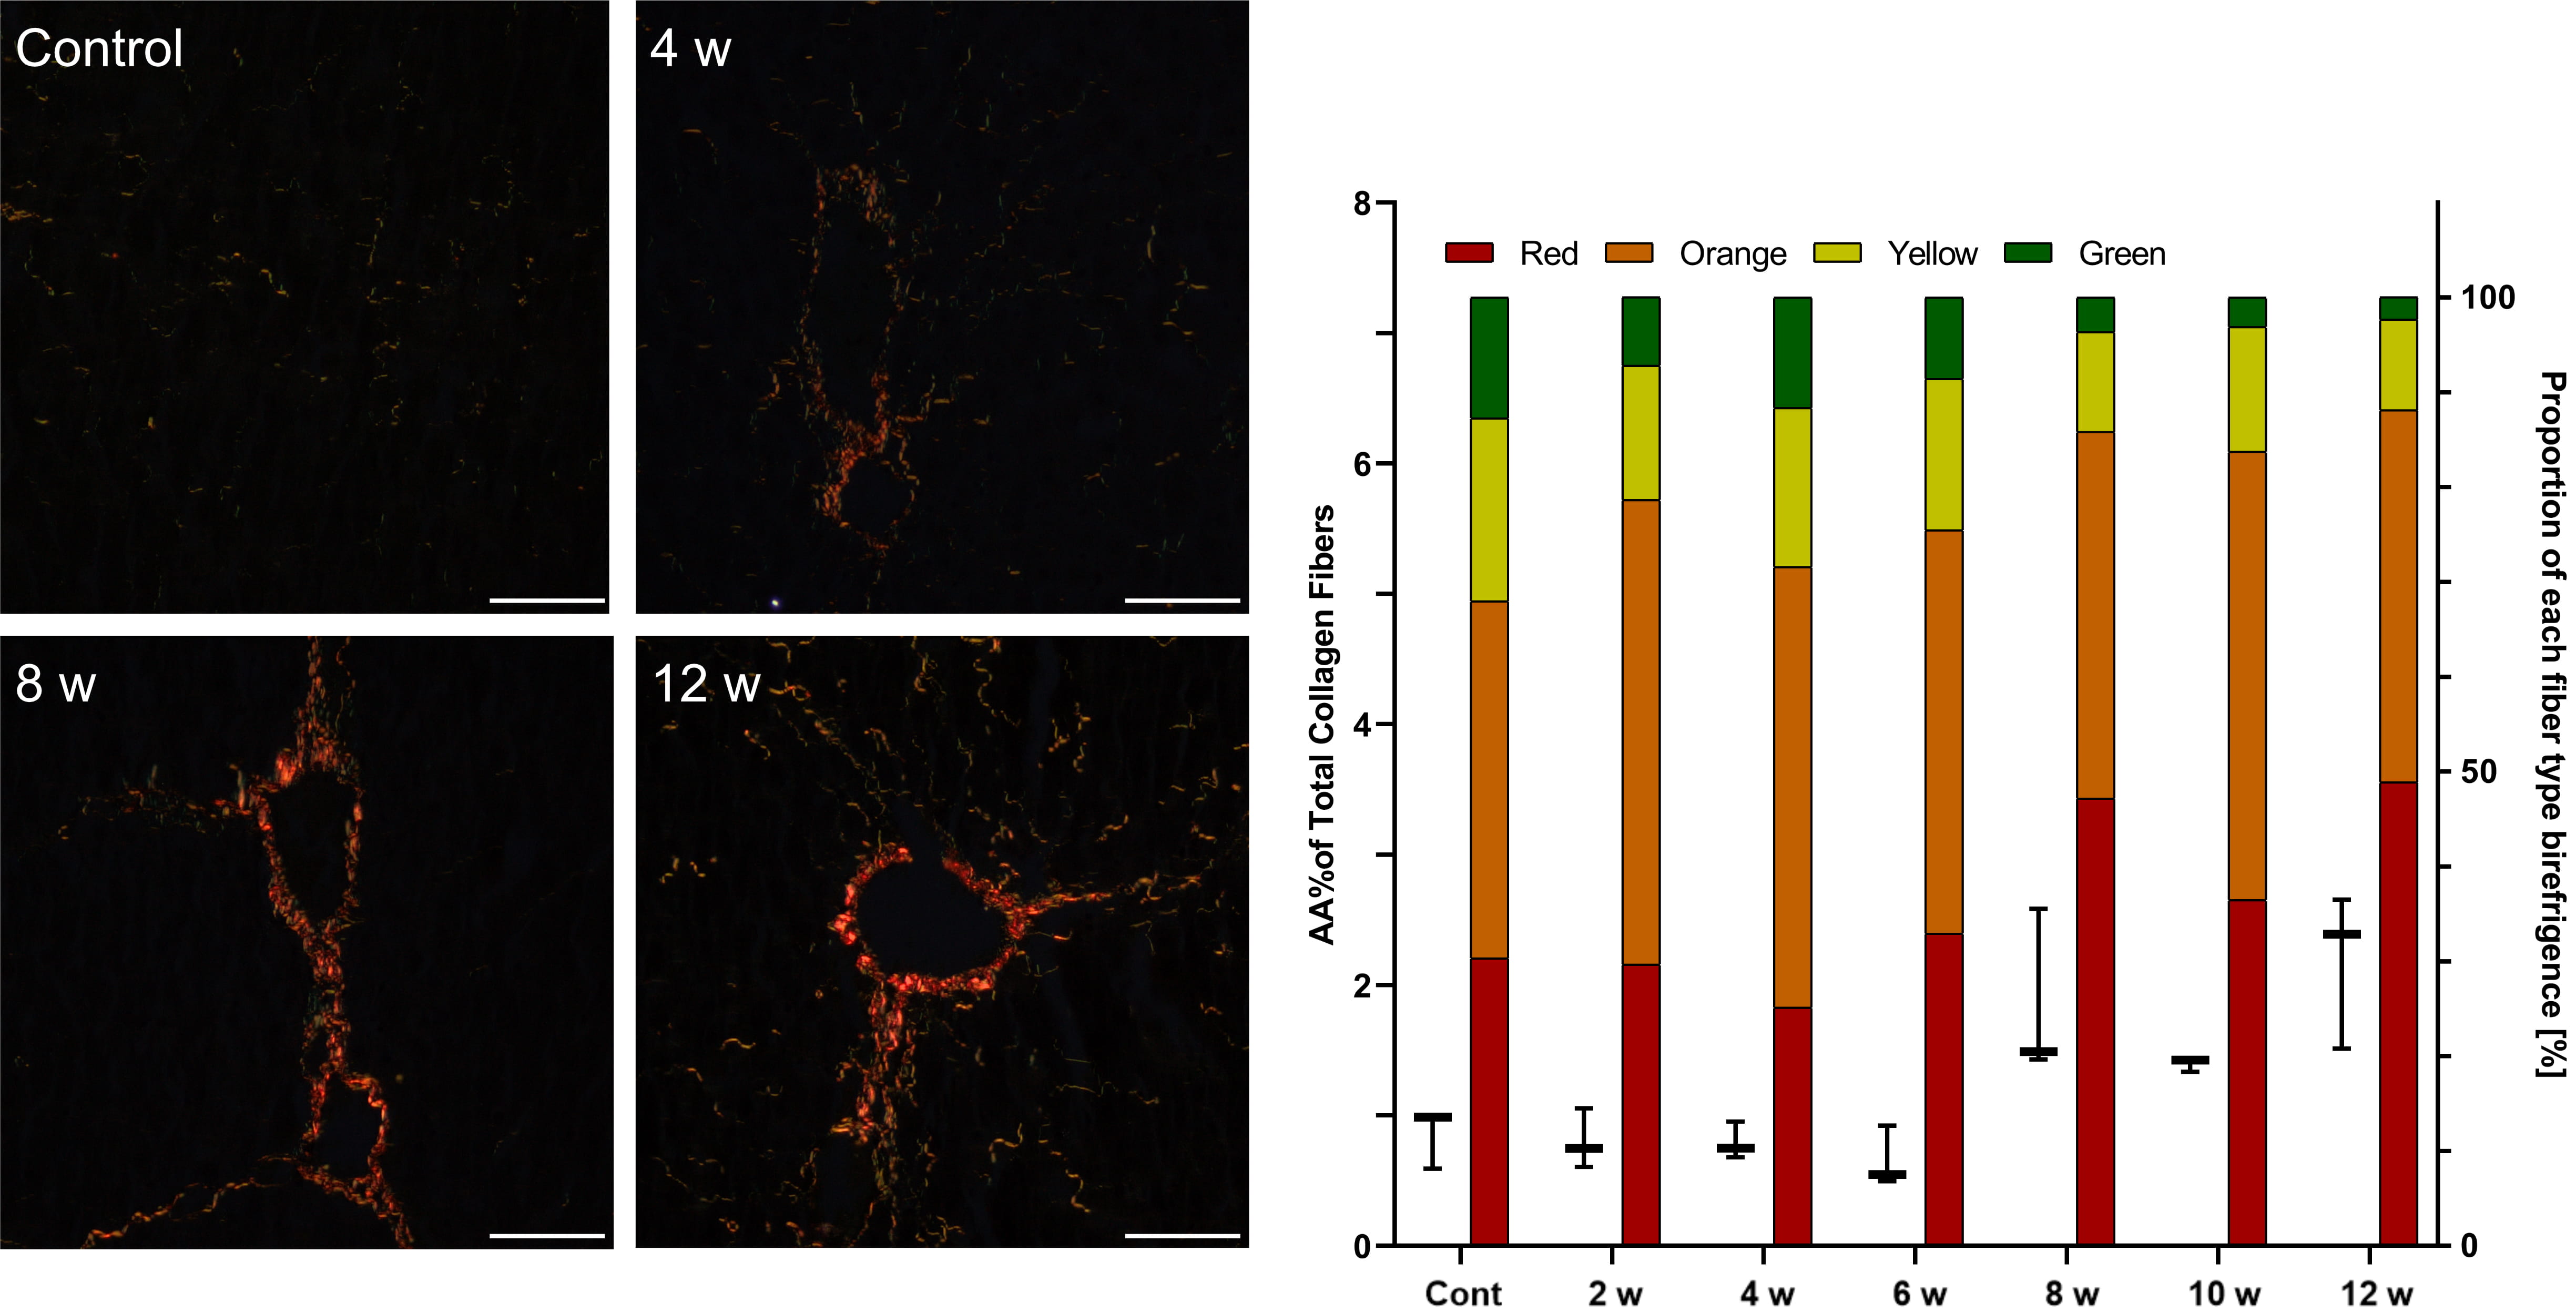 Fig. 4.
Assessment of fibrosis in the livers of rats after repeated
D-GalN injections. Sirius red staining under polarized light.
Mag. 200
In D-GalN-treated mice, minor liver fibrosis began at week 10. The semi-quantitative scale showed early fibrosis without a significant increase in collagen deposition at any time point (Table 5, Fig. 5).
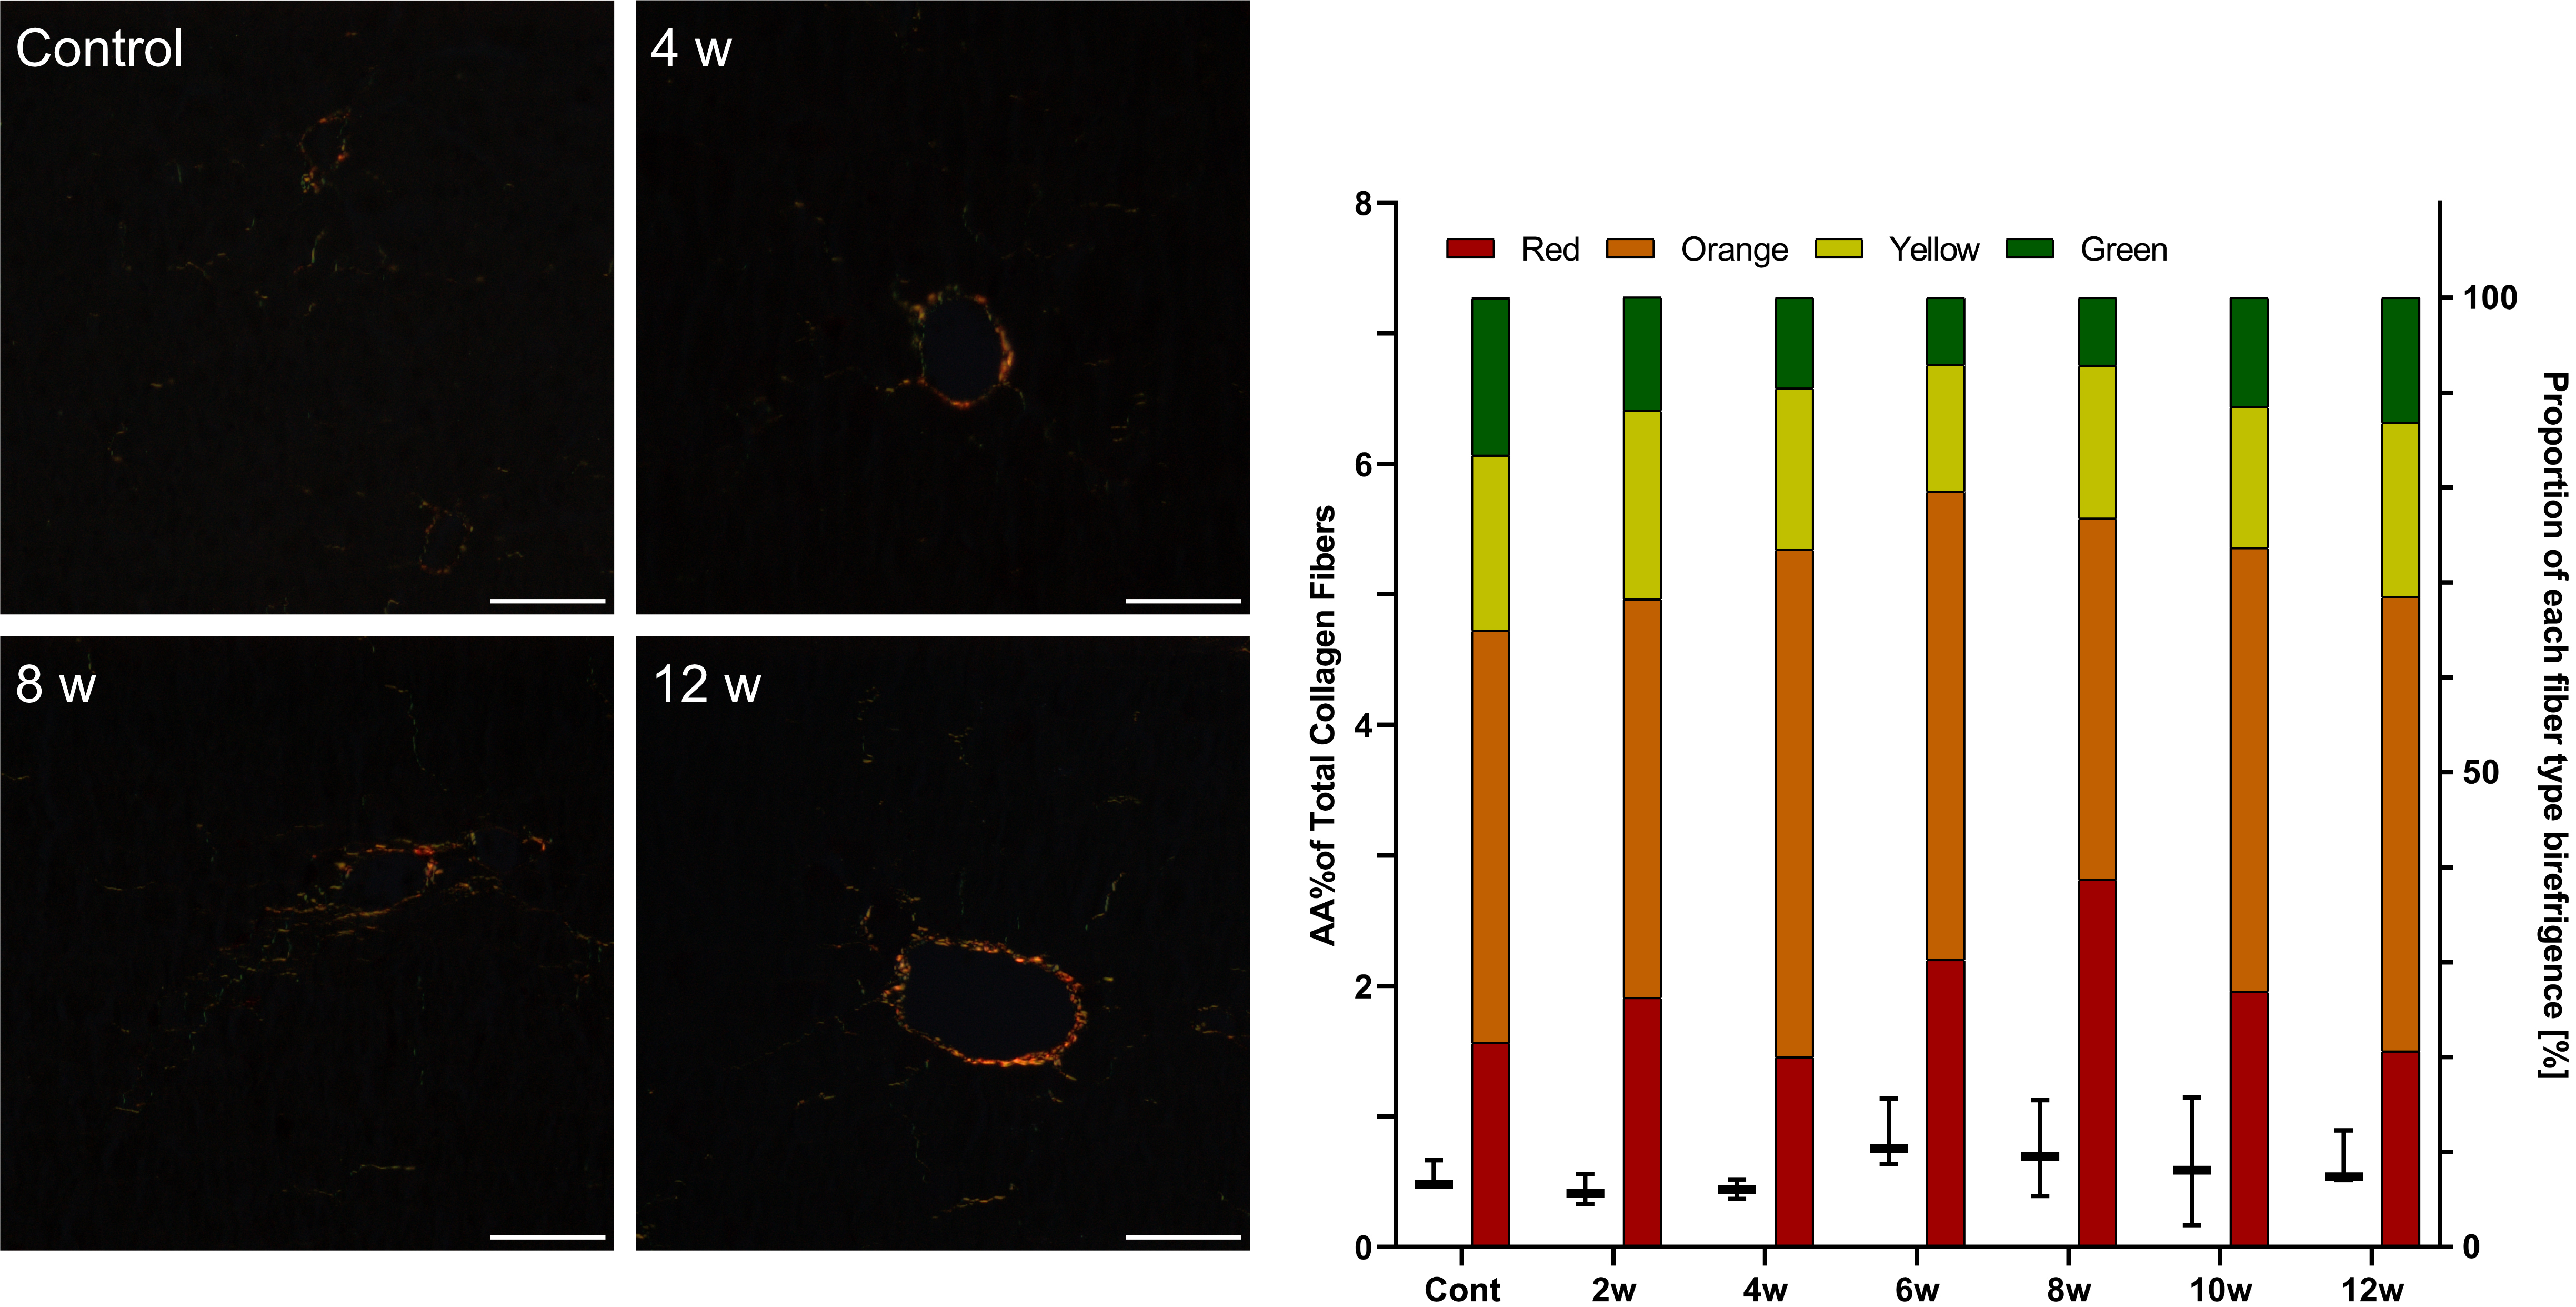 Fig. 5.
Assessment of fibrosis in the livers of mice after repeated
D-GalN injections. Sirius red staining under polarized light. Mag.
200
The onset of the different stages of liver fibrosis in the studied models is
presented in Table 6. At week 12 of CCl
| First sign of liver fibrosis | Early fibrosis | Established fibrosis | Incomplete cirrhosis | |
| CCl |
- | 2nd week | 6th week | 12th week |
| CCl |
- | 2nd week | 6th week | - |
| GalN rats | 4th week | 8th week | - | - |
| GalN mice | 10th week | - | - | - |
| The criteria for each stage of liver fibrosis were as follow: first sign of liver fibrosis (Ishak score 0–1 and no increased in the area of collagen fibers); early fibrosis (Ishak score 2–3 or increased in the area of collagen fibers); established fibrosis (Ishak score 4 and increased in the area of collagen fibers); and incomplete cirrhosis (Ishak score 5 and increased in the area of collagen fibers). | ||||
To summarize the stages of liver fibrosis in both experimental models, we found
that in CCl
After repeated CCl
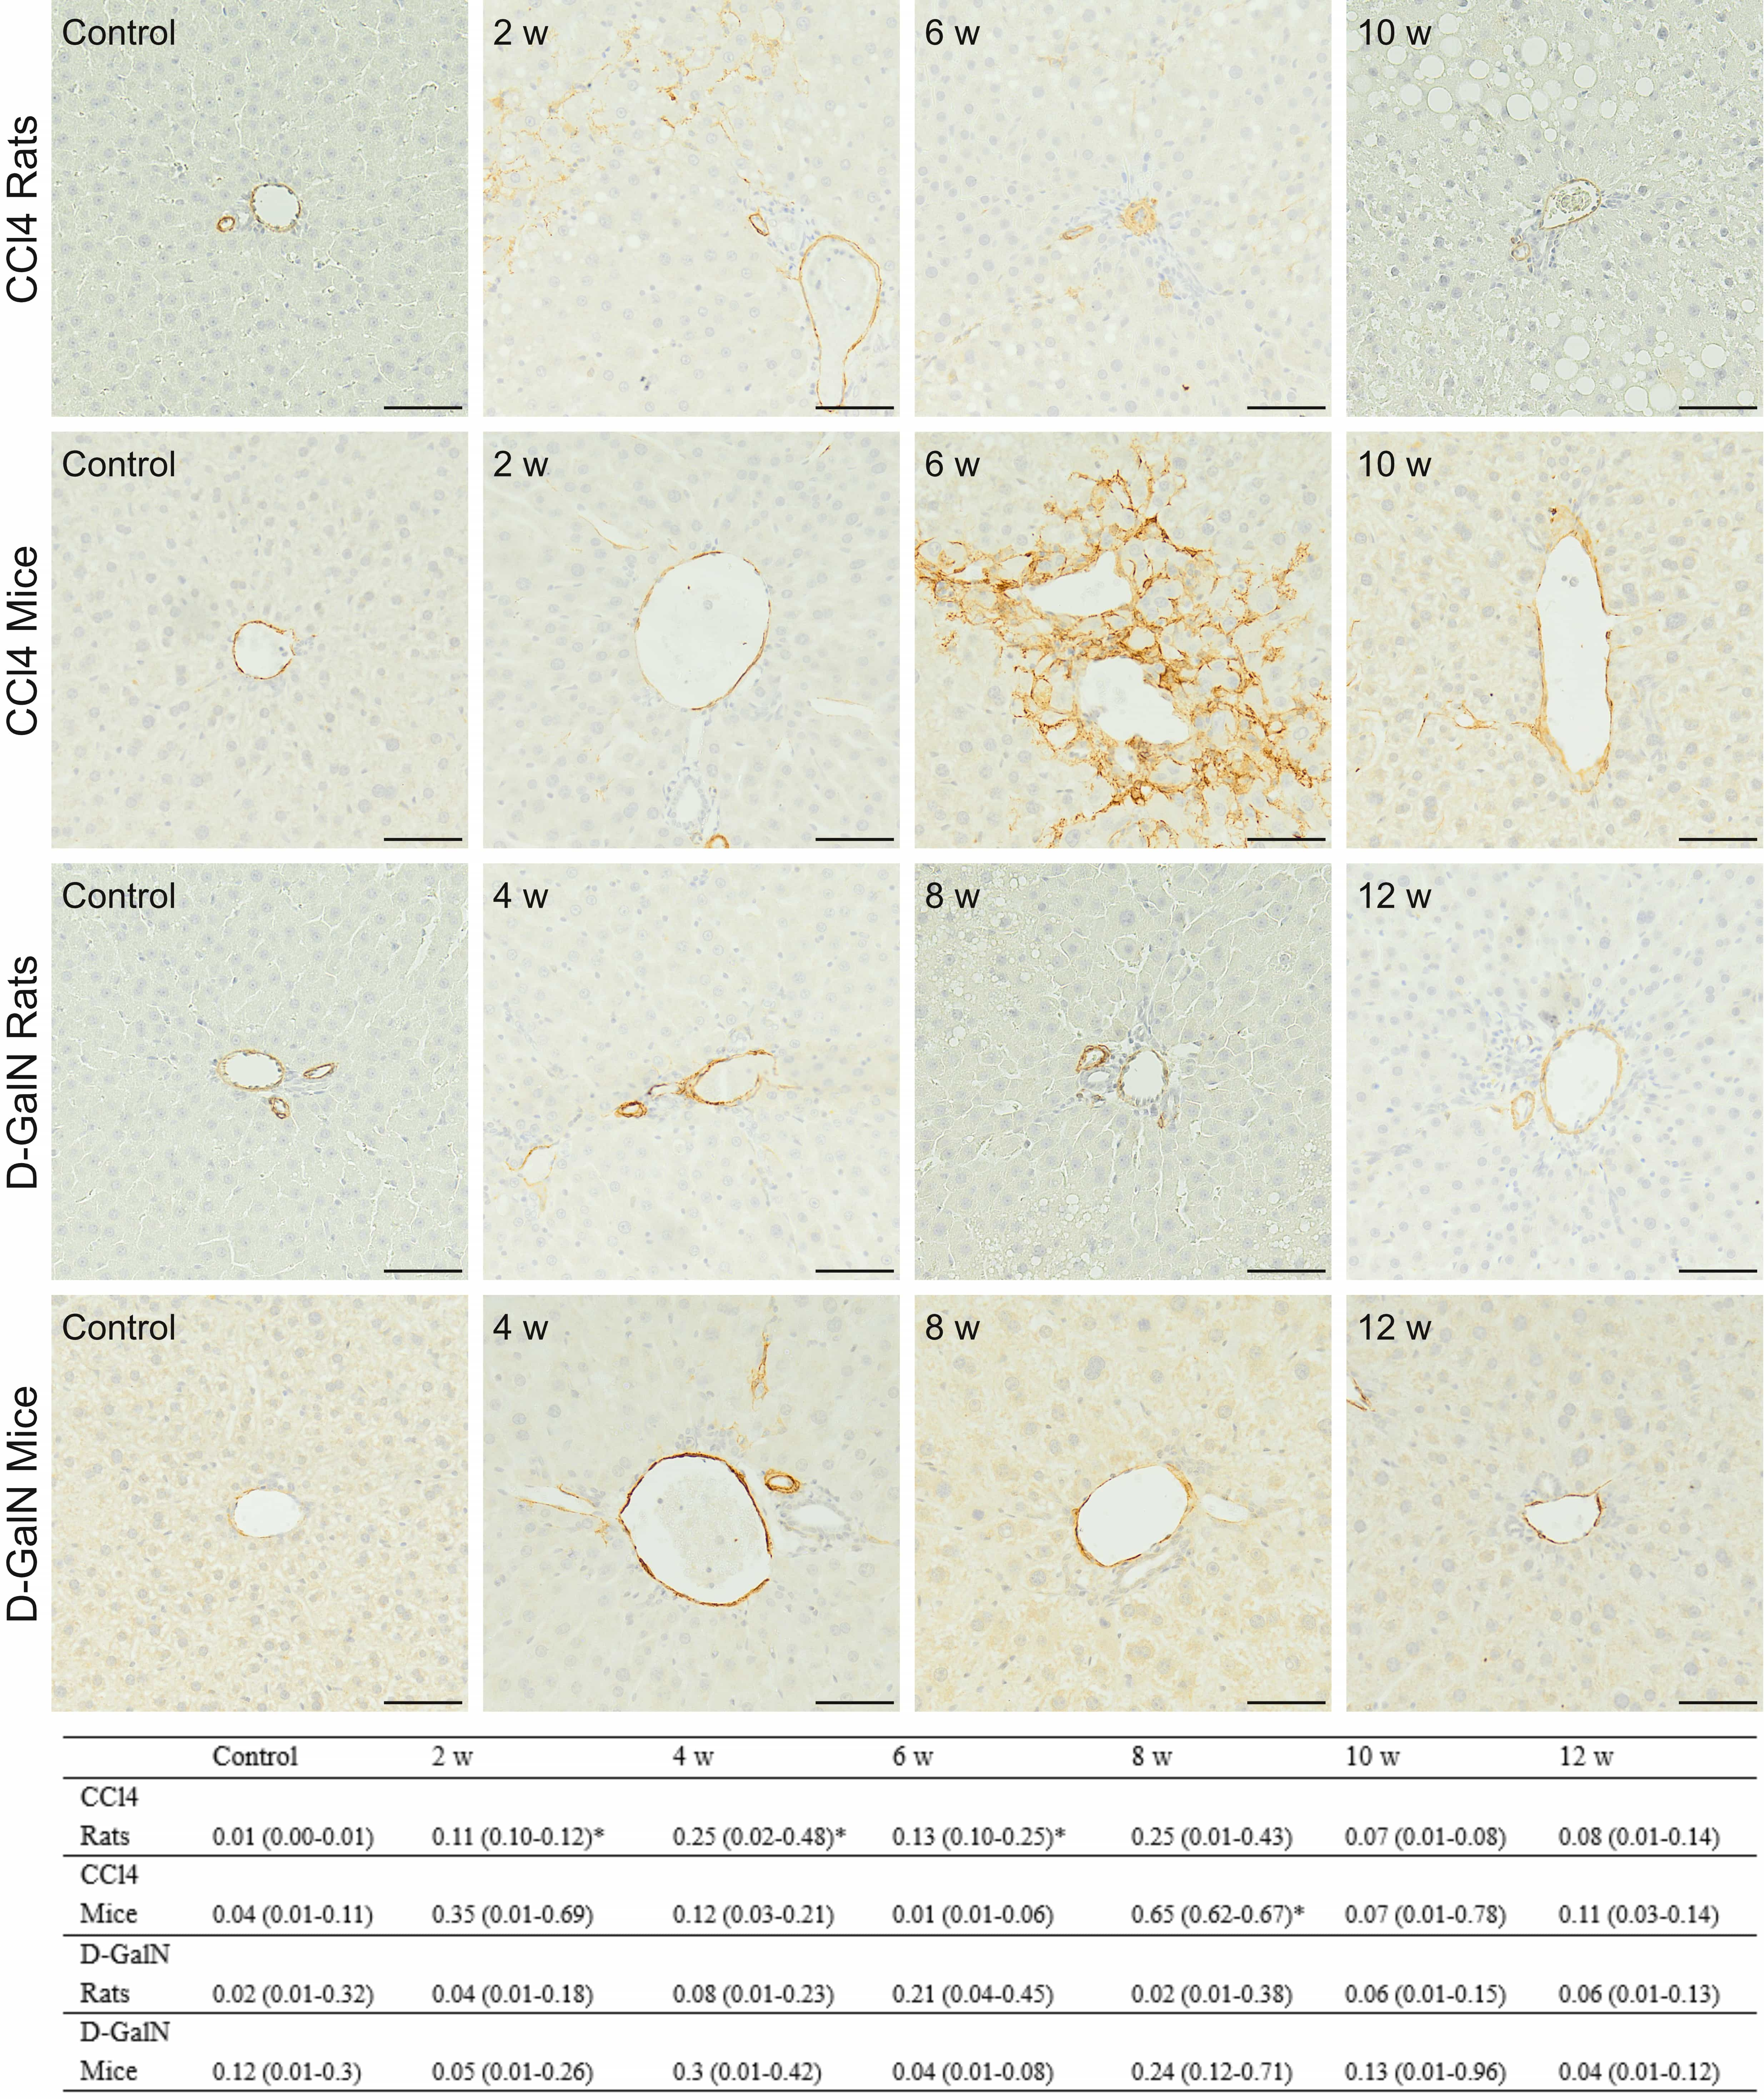 Fig. 6.
Immunodetection of
The results indicated the stronger hepatic stellate cells activation in
CCl
Rats repeatedly injected with CCl
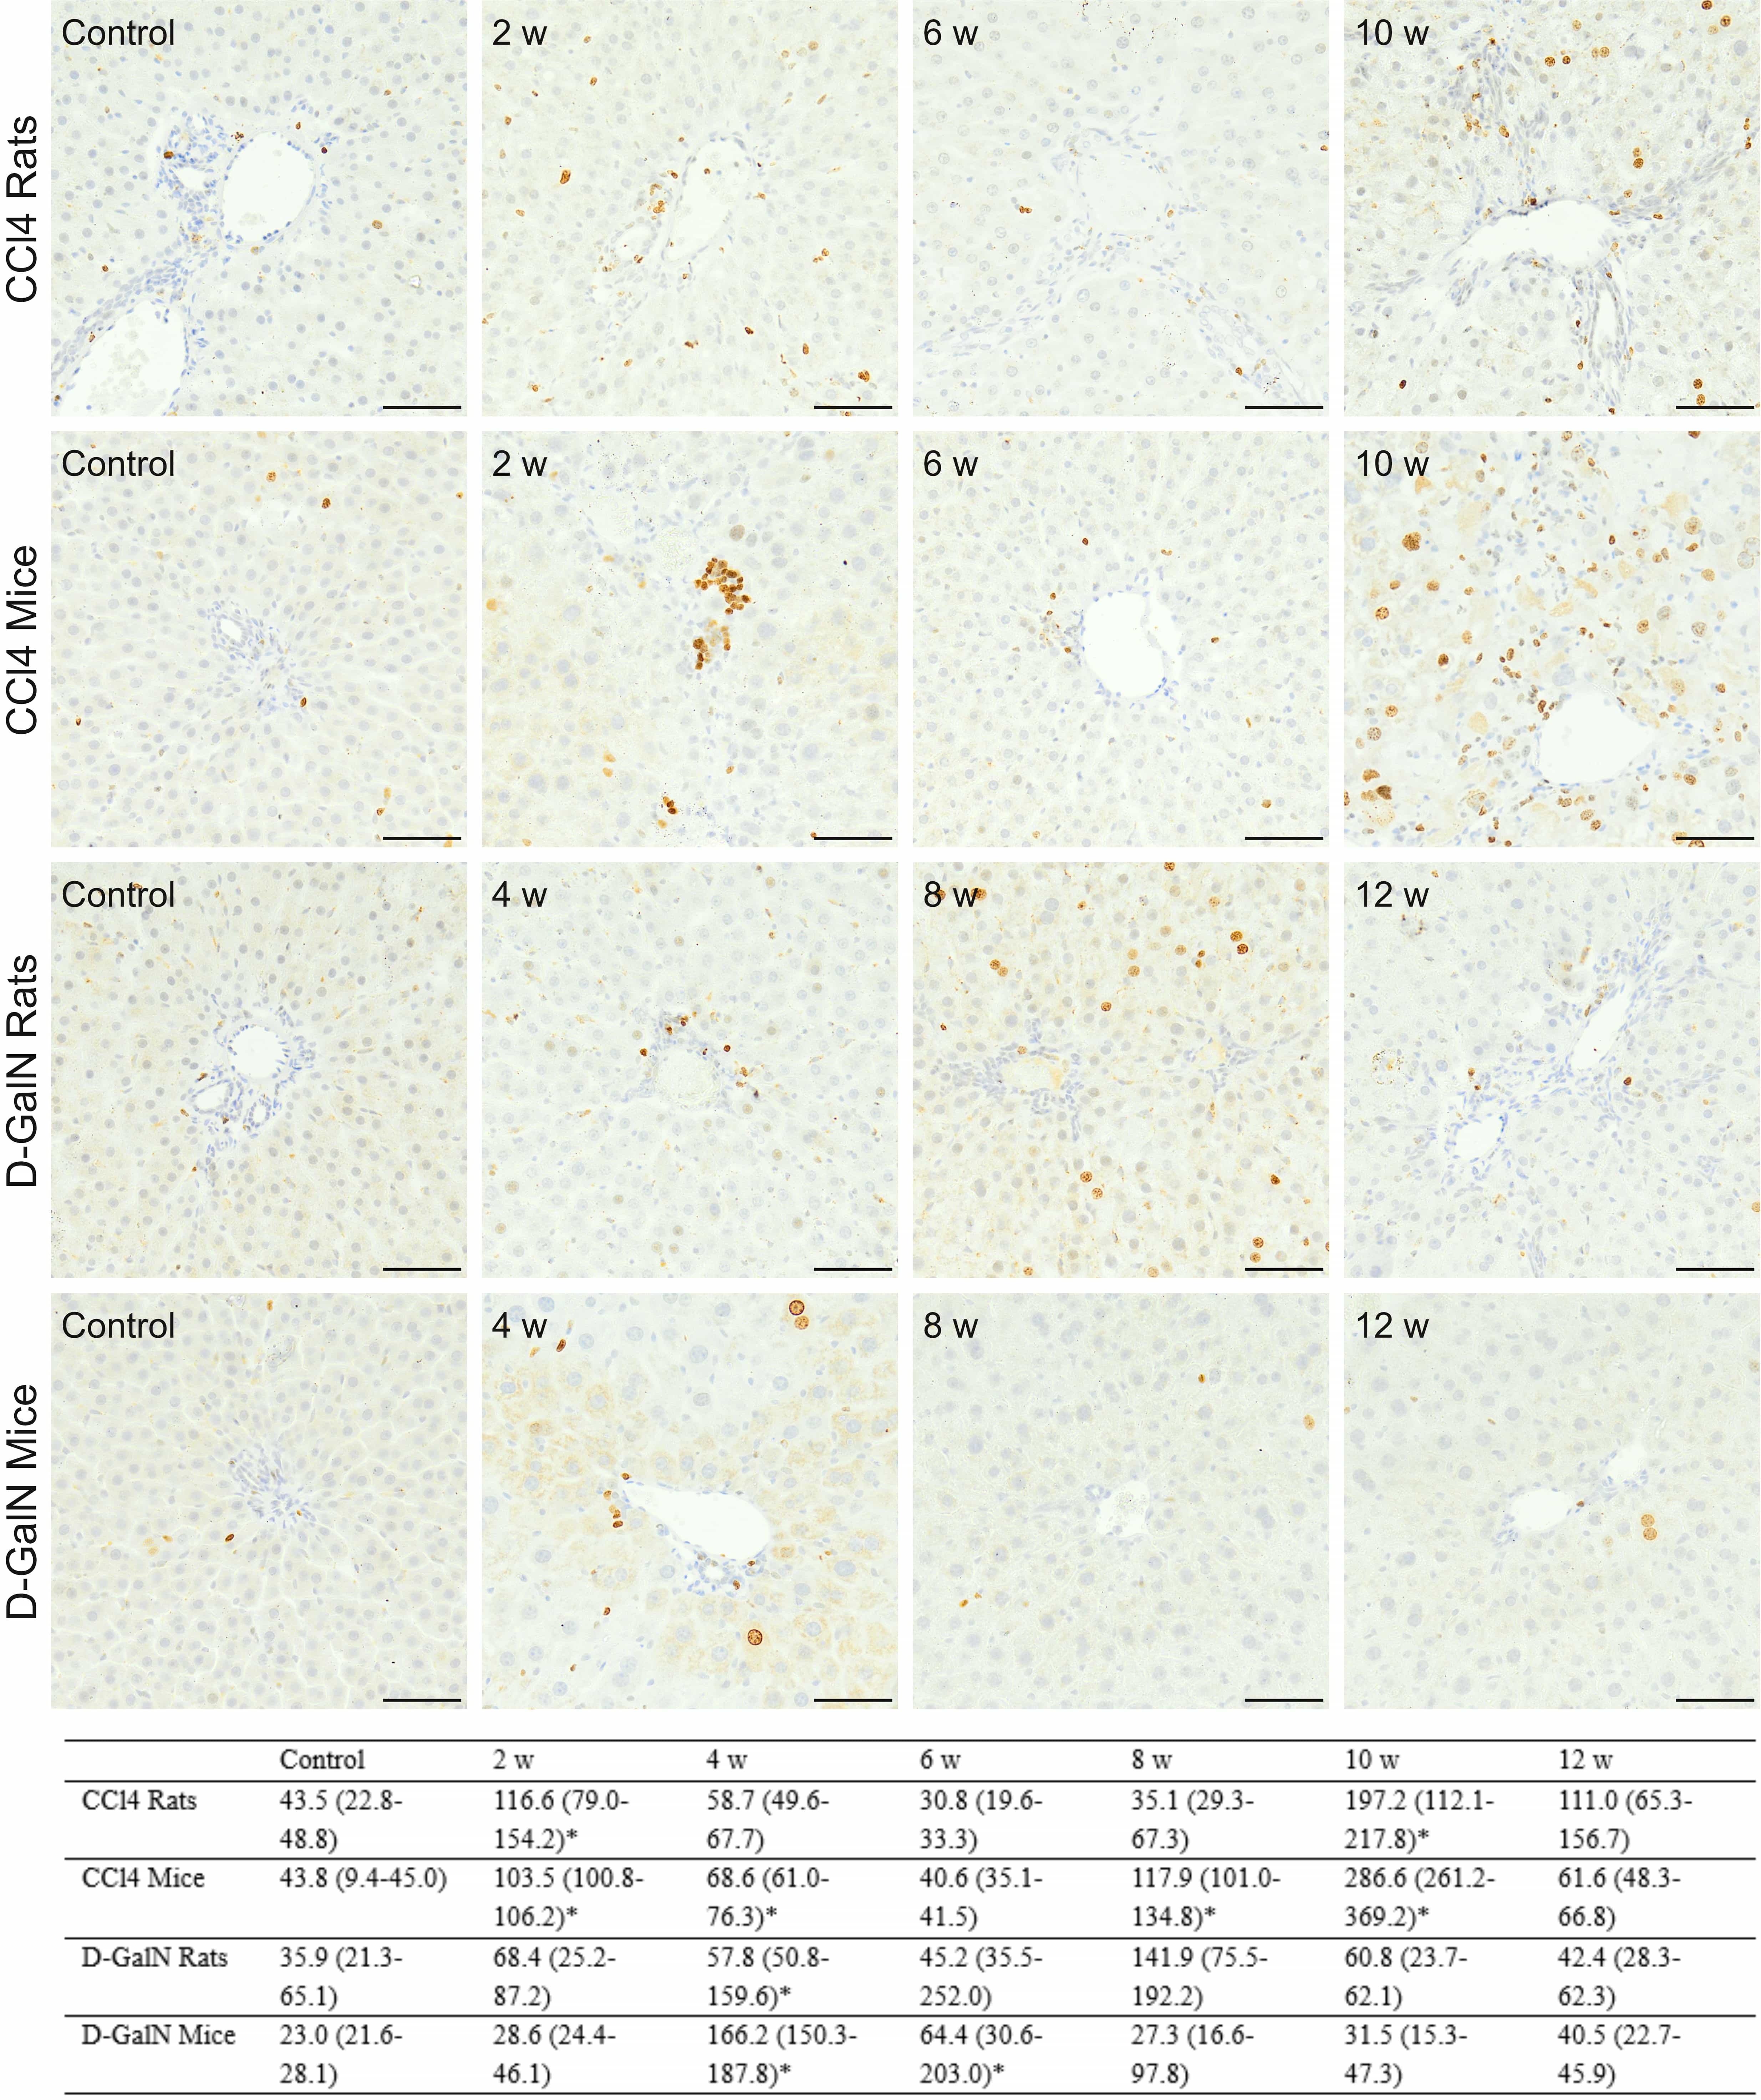 Fig. 7.
Immunodetection of Ki67
Minimal and moderate numbers of Cas3
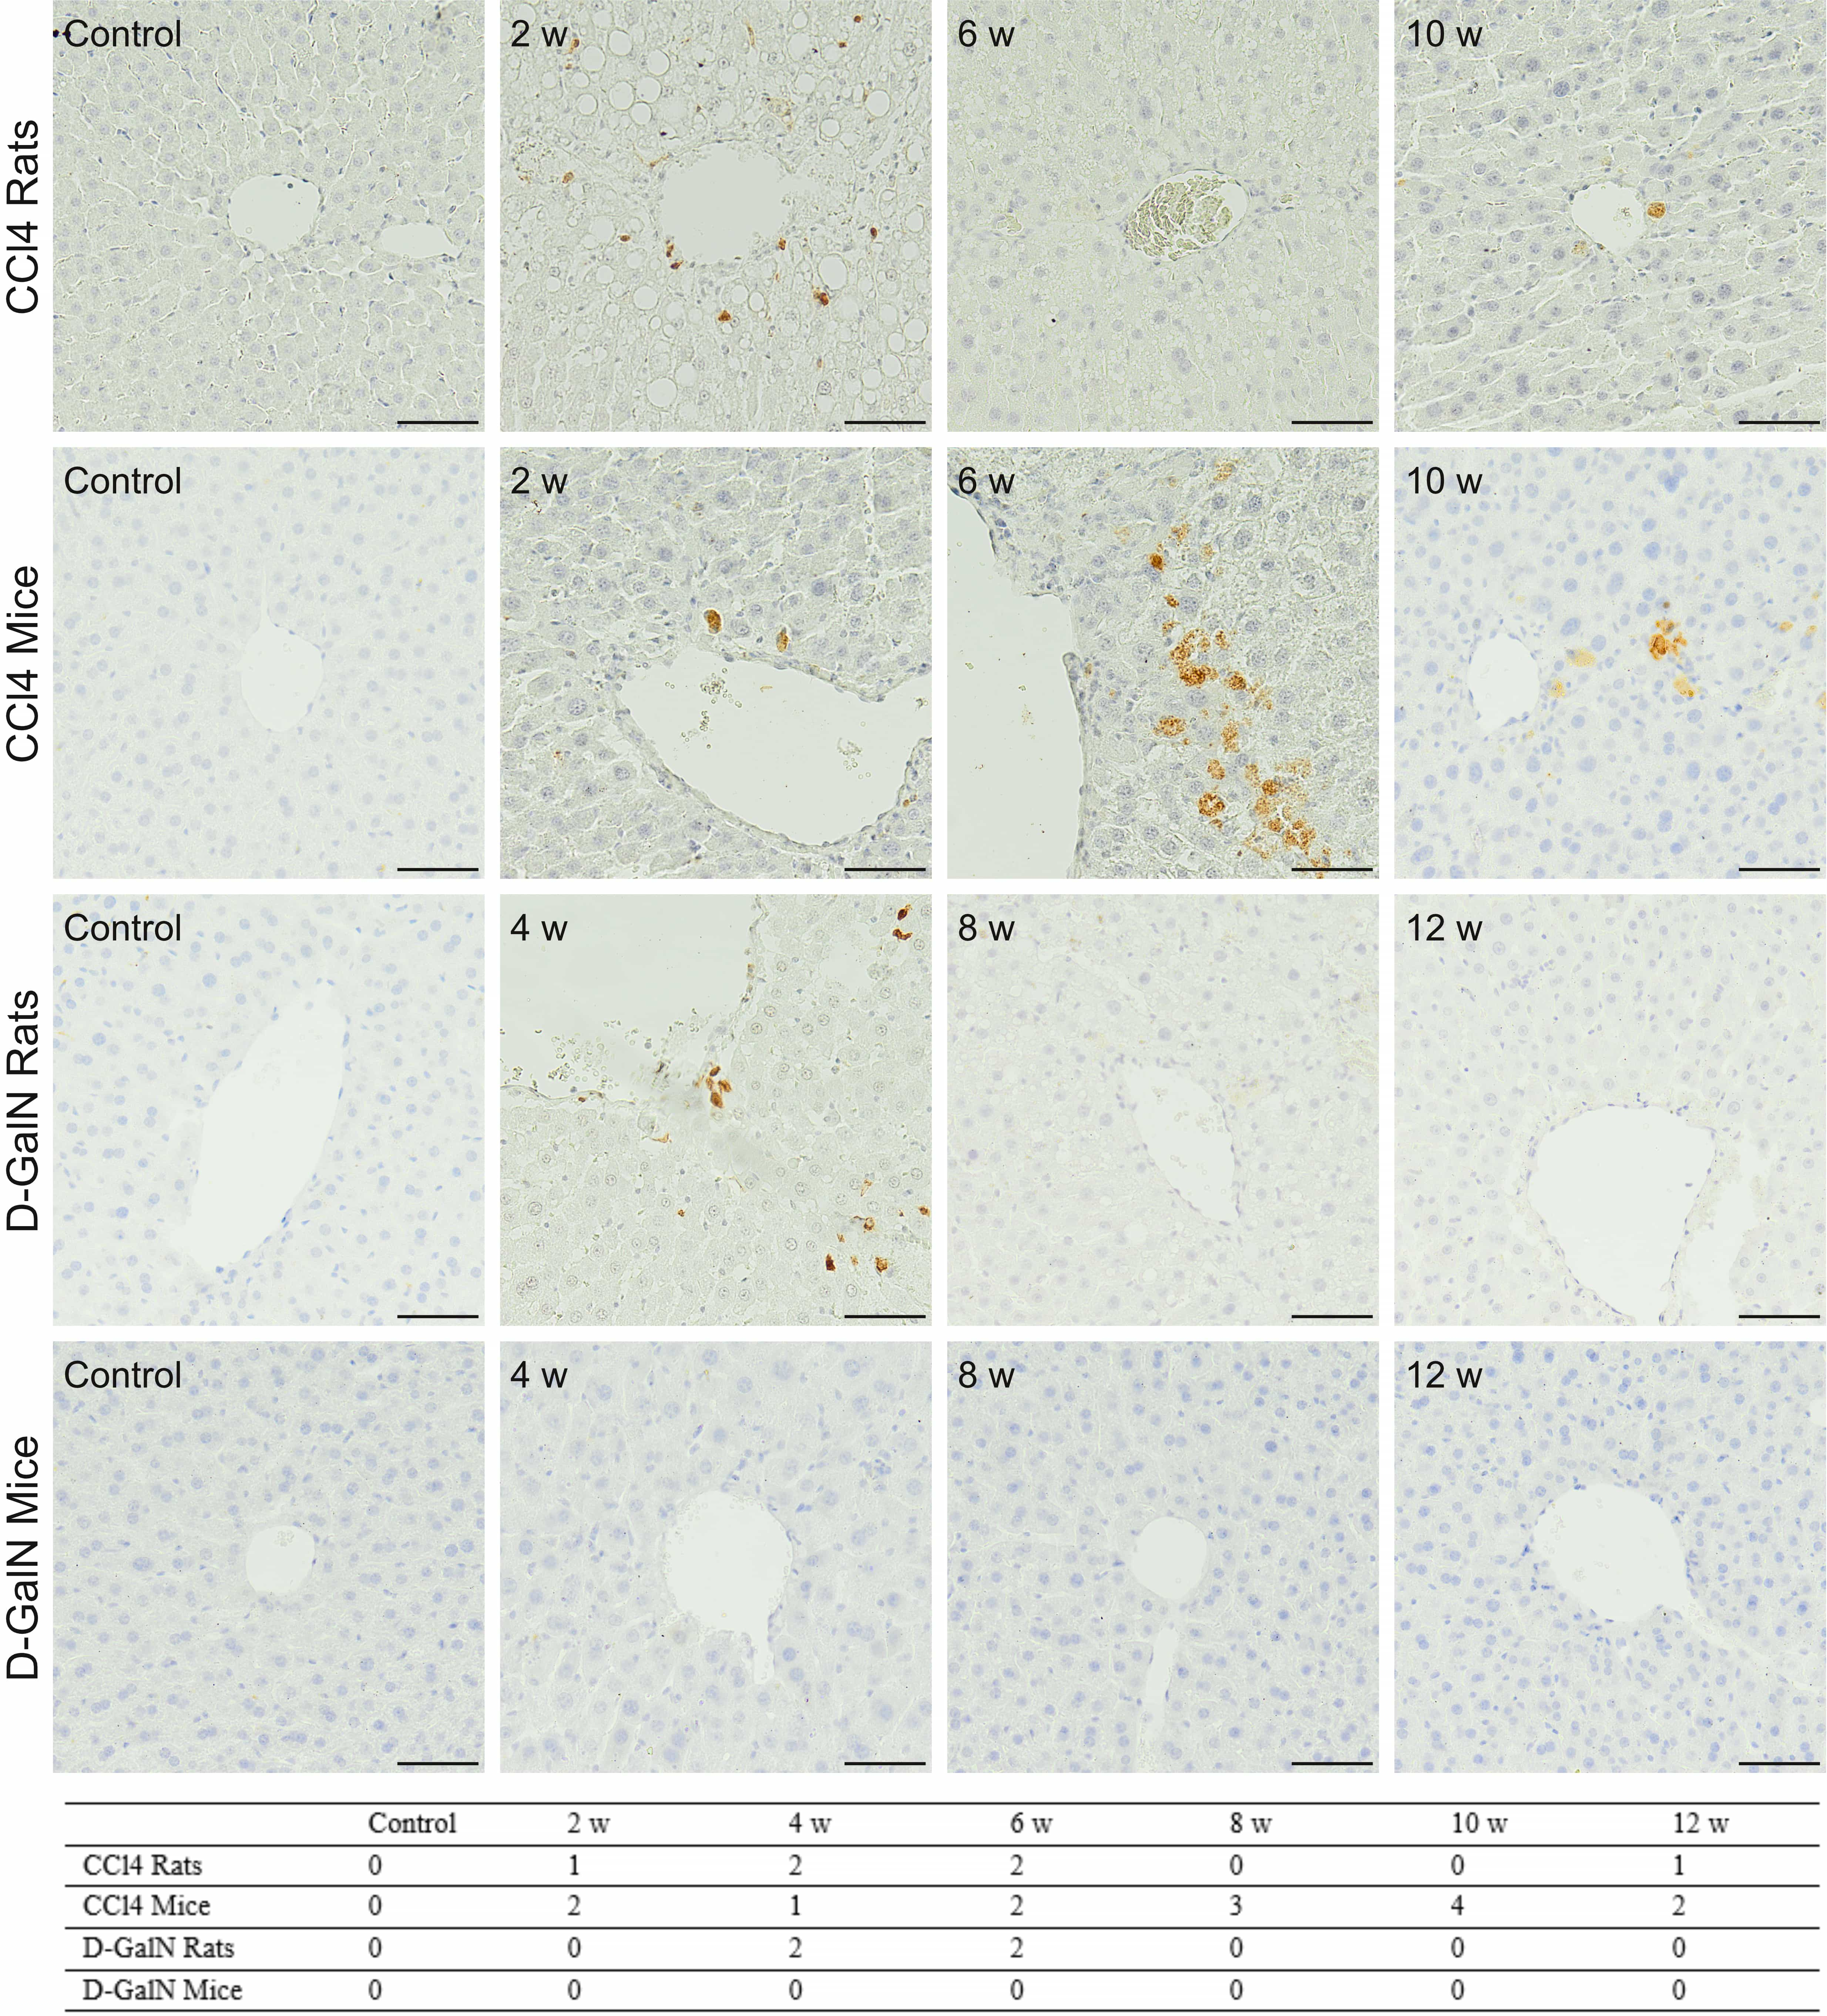 Fig. 8.
Immunodetection of Cas-3
The results indicated the coincidence of changes in apoptotic and proliferative
activities in livers, especially of CCl
We observed very low expression of Gadd45a, COL1A1,
IL-6, and TNF
Gene expression of COL3A1 in CCl
| Time point | COL3A1 | CYP2E1 | PPAR | c-Met | HGF |
|---|---|---|---|---|---|
| Carbon Tetrachloride Rats | |||||
| Control | 0.103 (0.067–0.263) | 1.974 (1.381–3.826) | 0.178 (0.081–0.231) | 0.079 (0.013–0.132) | 0.048 (0.038–0.100) |
| 2 w | 0.180 (0.121–0.233) | 1.069 (0.782–2.372)* | 0.125 (0.104–0.152) | 0.103 (0.007–0.155) | 0.021 (0.016–0.026)* |
| 4 w | 0.028 (0.013–0.242) | 2.021 (1.564–2.151) | 0.376 (0.143–0.690) | 0.051 (0.015–0.094) | 0.036 (0.011–0.052) |
| 6 w | 0.120 (0.018–0.327) | 0.657 (0.255–1.590)* | 0.103 (0.032–0.143) | 0.039 (0.020–0.128) | 0.063 (0.029–0.510) |
| 8 w | 0.115 (0.097–0.184) | 0.967 (0.508–1.743)* | 0.097 (0.067–0.222) | 0.066 (0.063–0.083) | 0.069 (0.037–0.128) |
| 10 w | 0.137 (0.050–0.234) | 1.454 (0.663–2.261)* | 0.314 (0.069–0.513) | 0.053 (0.012–0.066) | 0.050 (0.026–0.110) |
| 12 w | 0.146 (0.074–0.171) | 2.255 (0.744–3.846) | 0.276 (0.077–0.29) | 0.019 (0.005–0.037)* | 0.035 (0.011–0.043)* |
| Carbon Tetrachloride Mice | |||||
| Control | 0.046 (0.031–0.062) | 28.052 (19.226–34.896) | 0.771 (0.189–1.106) | 0.156 (0.106–0.309) | 0.070 (0.048–0.152) |
| 2 w | 0.397 (0.179–0.485)* | 32.391 (15.313–39.854) | 0.611 (0.397–0.691) | 0.133 (0.095–0.189) | 0.161 (0.054–0.255) |
| 4 w | 0.251 (0.172–0.312)* | 15.665 (10.438–52.482)* | 0.387 (0.233–0.743) | 0.049 (0.014–0.117)* | 0.223 (0.137–0.290)* |
| 6 w | 0.145 (0.133–0.231)* | 26.709 (26.067–35.119) | 0.660 (0.446–1.16) | 0.099 (0.090–0.155) | 0.092 (0.078–0.127) |
| 8 w | 0.300 (0.244–0.309)* | 8.253 (6.737–36.560) | 0.285 (0.126–0.883) | 0.266 (0.192–0.340) | 0.019 (0.016–0.021)* |
| 10 w | 0.388 (0.327–0.420)* | 9.302 (5.936–12.812)* | 0.149 (0.125–0.208)* | 0.097 (0.061–0.133) | 0.166 (0.071–0.268) |
| 12 w | 0.161 (0.114–0.236)* | 48.001 (37.923–70.767)* | 1.035 (0.671–2.723) | 0.097 (0.023–0.223)* | 0.077 (0.023–0.132) |
| D–Galactosamine Rats | |||||
| Control | 0.091 (0.06–0.161) | 4.766 (1.331–6.203) | 0.501 (0.308–0.617) | 0.061 (0.032–0.079) | 0.183 (0.062–0.242) |
| 2 w | 0.096 (0.062–0.124) | 3.382 (3.108–3.962) | 0.290 (0.262–0.459) | 0.029 (0.017–0.043)* | 0.093 (0.045–0.15) |
| 4 w | 0.226 (0.143–0.346)* | 8.344 (6.684–14.527)* | 0.600 (0.415–1.320) | 0.028 (0.014–0.212) | 0.160 (0.127–0.483) |
| 6 w | 0.250 (0.052–0.361)* | 12.197 (10.618–28.413)* | 1.751 (0.840–2.054)* | 0.059 (0.017–0.140) | 0.092 (0.066–0.341) |
| 8 w | 0.056 (0.025–0.089)* | 6.326 (3.227–8.282) | 0.255 (0.143–0.287)* | 0.036 (0.023–0.042)* | 0.052 (0.027–0.106)* |
| 10 w | 0.063 (0.030–0.088)* | 7.122 (1.03–16.248) | 0.369 (0.056–0.698) | 0.029 (0.016–0.059)* | 0.093 (0.088–0.098)* |
| 12 w | 0.070 (0.030–0.107) | 6.928 (5.867–10.074)* | 0.522 (0.326–0.652) | 0.028 (0.014–0.044) | 0.152 (0.078–0.276) |
| D–Galactosamine Mice | |||||
| Control | 0.052 (0.023–0.082) | 34.028 (13.817–55.267) | 1.041 (0.682–1.432) | 0.258 (0.067–0.373) | 0.167 (0.009–0.187) |
| 2 w | 0.107 (0.059–0.229)* | 77.442 (57.083–102.893)* | 0.495 (0.066–1.306) | 0.263 (0.143–0.319) | 0.179 (0.067–0.185) |
| 4 w | 0.096 (0.077–0.209)* | 89.884 (33.121–127.972)* | 0.757 (0.253–1.264) | 0.236 (0.126–0.338) | 0.032 (0.015–0.054) |
| 6 w | 0.127 (0.049–0.199)* | 58.541 (40.530–172.545) | 0.319 (0.295–1.671) | 0.115 (0.048–0.406) | 0.098 (0.032–0.255) |
| 8 w | 0.087 (0.033–0.105)* | 15.291 (12.719–26.518) | 0.994 (0.181–0.992) | 0.040 (0.038–0.060)* | 0.013 (0.002–0.160)* |
| 10 w | 0.035 (0.031–0.038) | 18.319 (12.084–26.264) | 0.235 (0.132–0.462)* | 0.080 (0.073–0.098)* | 0.024 (0.003–0.057)* |
| 12 w | 0.062 (0.053–0.110) | 41.135 (30.376–47.368) | 0.673 (0.523–0.740) | 0.108 (0.093–0.248) | 0.117 (0.092–0.368) |
| Data are presented as a median of 2 | |||||
In CCl
We observed an increase in CYP2E1 gene expression in rats between weeks
4 and 12 and a temporary increase in mice at weeks 2 and 4, both treated with
D-GalN. In rats, it was statistically significant at weeks 4, 6, and 12
(p
There were noticeable but (at most time points) not statistically significant
differences in PPAR
In D-GalN-intoxicated rats, we observed a significantly increased
PPAR
In CCl
We observed small but statistically significant decreases in HGF gene
expression in rats treated for 2 and 12 weeks with CCl
In D-GalN-treated rats and mice, we observed a decrease in HGF expression after weeks 6 and 4, respectively, followed by a return to control values at week 12.
In this study, we assessed the progression of histopathological changes in the livers of experimental animals, in the chronic liver injury model, to select the best time for potential pharmaceutical or stem cell therapy. During long-term intoxication, in response to parenchymal inflammatory reaction, stellate cells produce collagen and other extracellular matrix components. Collagen fibers enter the perisinusoidal space of Disse and, as it were, seal the permeable barrier between the sinusoids and the liver parenchyma, effectively inhibiting the flow of substances and migration of administered cells that could leave the vascular bed. It has been observed that in people without liver fibrosis, this organ is a frequent site of metastasis of malignant tumors from other organs due to the favorable hemodynamic conditions of flowing blood, permeability of the sinusoidal wall, and the small diameter of sinusoids, which favors the formation of microemboli from circulating cells. The resulting emboli retain cells within the vascular network of the organ, promoting their migration into the liver parenchyma, which would be impossible if the cells were suspended in the flowing bloodstream [38]. In contrast, metastases from distant organs are found very rarely in patients with developed cirrhosis.
Nevertheless, cirrhosis itself requires treatment which, in addition to eliminating etiological factors, involves slowing down the progression of the disease, including fibrosis, and supporting the functioning of the liver. Failures of CLD cell therapies were most likely due to unfavorable biodistribution of the administered cells caused by advanced fibrosis [39, 40]. So far, no detailed model studies have been conducted to analyze how the duration of the intoxication, and thus the degree of fibrosis, affects the biodistribution of stem cells administered for therapeutic purposes [11, 14, 41, 42, 43, 44].
Experimental models used to induce liver injury include intoxication with
CCl
D-GalN is a highly hepatospecific compound. Unlike other hepatotoxins, D-GalN does not directly damage other organs and does not cause irritation when injected. In hepatocytes, D-GalN is eliminated by the galactose metabolic pathway, including D-GalN phosphorylation to galactosamine-1-phosphate (GalN-1-P), followed by its conversion to UDP-galactosamine, which has a higher affinity for uridine diphosphate (UDP) than for galactose. The trapping effect leads to uridine deficiency, inhibition of RNA and protein synthesis, and apoptotic cell death [51].
The primary lasting effect of our intoxication procedures was the progressive
liver fibrosis. The mechanism of fibrosis in models using CCl
The data obtained by us and other research teams suggest that the onset of
fibrosis in the models using CCl
At the molecular level, the process of fibrosis is influenced by a number of
factors, and in particular depends on the expression of the genes
TGF
We observed morphological features of liver injury accompanying the fibrosis
resulted from chronic liver injury [12], where the CCl
An additional effect of liver injury in the CCl
In the liver fibrosis models using repeated injections of D-GalN (25 mg/100 g bw in rats and 75 mg/100 g in mice), we observed the slow dynamics of fibrosis progression over time. Microscopic changes were accompanied by a transient increase in COL3A1 gene expression. Similar changes, especially in mice, have been previously noted by other researchers. In the rat models using repeated injections of 25 mg/100 g D-GalN bw, the presence of early or established fibrosis was demonstrated at week 12 of intoxication [14, 62]. In order to induce irreversible cirrhosis in the rat model, the duration of the intoxication should be extended to up to 6 months [67]. In the mouse model, an attempt to induce cirrhosis with a relatively high dose of 150 mg/100 g D-GalN bw administered regularly once a week for 13 weeks failed [68]. Overall, our results and literature data suggest that the rat and mouse models of CLD using repeated D-GalN injections offer significantly less opportunity to achieve established liver fibrosis and cirrhosis within a predictable and defined period of frame.
Fibrosis observed in D-GalN-intoxicated rats was accompanied by a relatively small inflammatory reaction and weakly pronounced visible histopathological changes, such as hepatocyte edema and ballooning degeneration. In the mouse model of chronic D-GalN administration, we did not observe any significant histopathological changes. In both rat and mouse models of D-GalN-induced CLD, other researchers observed little or no damage to the liver parenchyma [14]. Also, the increase in apoptotic activity only at certain time points after intoxication in rats, lack of apoptotic activity in mice, and temporary tendency to increase in proliferative activity observed in both rats and mice indicate relatively low potential of the D-GalN doses administered chronically to induce CLD. The scant literature data indicate a small effect of repeated low-dose injections of D-GalN on the induction of apoptosis [14, 62]. Increased apoptotic activity in the liver parenchyma is much more pronounced in the acute or fulminant injury model, where a single injection of high doses of D-GalN is used [69, 70]. Nevertheless, the decrease in the expression of the HGF gene and its receptor c-Met, found in animal groups studied by us, mostly those treated with D-GalN, coincides partially with literature data, which describe an increase in HGF expression in the initial stage of chronic hepatitis and a decrease in the expression of this gene in the advanced stage of the disease [66].
It should be noted that the histopathological changes recorded in the rat and
moue livers in both intoxication models were not clearly reflected in the results
of tests carried out on the blood of the test animals. In the models using
CCl
To sum up, the used doses of hepatotoxins allowed to show subtle differences in their effects over time, while avoiding too abrupt and advanced changes without the possibility of tracing intermediate stages. We assessed the severity of reversible and irreversible structural and functional changes in the liver in individual CLD models to determine the potentially optimal time of therapeutic intervention. Such CLD models might apply to different types of pharmaceutical treatments and to stem cell therapy. However, it should be noted that stem cell therapy has much more variables that might completely render the “timing” a less important limiting factor. For instance, the type of transplanted cells, their number, the pre-treatment/pre-genetic engineering of injected cells, the route of injection, the co-transplantation of more than one cell type, and many others are very powerful limiting factors that might influence its effectiveness. Based on this preclinical study, we can expect that in experimental rodents with established fibrosis large amount of collagen fibers which seal the sinusoids barrier, might prevent implanted cells homing process.
Summarizing the results obtained in the mouse and rat models using CCl
In mice, and rats CCl
We do not recommend rodent models of D-GalN-induced liver fibrosis due to the long incubation period, poor effect, and high costs.
CCl
All data generated or analyzed during this study are included in this published article.
PC and MK designed the research study. PC supported the studies financially (grands), provided help and advice. MK, EK, ŁL, AP, AS-S, EB, BS, MH, MM, AG, JP performed the research. PC, MK, ŁL, AS-S, BS, AP analyzed the data. PC and MK wrote the manuscript. All authors contributed to editorial changes in the manuscript. All authors read and approved the final manuscript.
Animal experiments were approved by the Animal Experiments Ethical Committee of Medical University of Silesia, Katowice, Poland (decision no. 18/2018).
We thank the Silesian Analytical Laboratory (Katowice; Poland) for performing serum biochemistry analysis and blood morphology assessment.
The studies were supported by institutional grants (SUM Katowice) no: KNW-1-103/N/8/0 and KNW-1-100/K/9/0.
The authors declare no conflict of interest.
References
Publisher’s Note: IMR Press stays neutral with regard to jurisdictional claims in published maps and institutional affiliations.