


 , Zhiyong Zhang 1, Yangyang Tu 1, Haibin He 1, Feng Qiu 1, Hailong Qian 1, Chunshu Pan 2,*
1 Department of Gastrointestinal Surgery, Ningbo Medical Center Lihuili Hospital, The Affiliated Lihuili Hospital, Ningbo University, 315000 Ningbo, Zhejiang, China
2 Department of Radiology, Ningbo No.2 Hospital, 315000 Ningbo, Zhejiang, China
Abstract
Background: Gastric cancer (GC) is the most commonly diagnosed digestive system malignancy with a dismal survival outcome. The prognostic value of ubiquitination-related genes (URGs) in GC has yet to be discovered. Methods: Two GC cohort datasets were obtained from the Cancer Genome Atlas Program (TCGA) and Gene Expression Omnibus (GEO) databases. Stepwise Cox analysis was employed to generate a signature. Then, we applied unsupervised clustering analysis to determine subclusters in GC based on URGs. Single-cell analysis was carried out to depict the cellular location of model genes. The CIBERSORT method was performed to estimate the immune landscape. Finally, preliminary wet lab work was utilized to disclose the potential effect of OTULIN. Results: Our proposed signature was set up based on five URGs (OTULIN, UBE2C, USP1, USP2, and MAPT) which could serve as a risk classifier to categorize GC cases. In addition, it was demonstrated that the ubiquitination-associated model could depict the immune landscape and forecast immunotherapy response for GC patients. Furthermore, in vitro experiments determined the function and effect of OUTLIN in GC. We observed that the knockdown of OUTLIN could suppress cell viability and metastatic ability of GC cell lines. Conclusions: Our data lays the groundwork for a comprehensive investigation into the role of URGs in GC and determined OTULIN as a candidate GC biomarker.
Keywords
- gastric cancer
- ubiquitination
- prognosis
- immunotherapy response
- OTULIN
Gastric cancer (GC) is a common malignant neoplasm of the digestive system. It has the fourth-highest incidence and the second-highest mortality rate in the world. With the continuous improvement of treatment, the mortality rate of GC has decreased worldwide [1]. However, the survival outcome of GC cases is dismal as the mechanisms affecting prognosis are still unclear. Consequently, the further investigation of molecular mechanisms involved in the occurrence, development, and prognosis of gastric cancer and the search for valuable molecular markers is critical.
Recent studies have shown that the tumor microenvironment (TME) plays a central role in the development of tumors. The TME is a complex system consisting of low oxygen, low pH, high pressure, and a large number of growth factors and protein hydrolases, which regulate a variety of tumor biological behaviors [2]. The TME consists of tumor cells, stromal cells, and an extracellular matrix. The local homeostatic environment, composed of fibroblasts, immune cells, some endothelial cells, and an extracellular matrix, allows for tumor development, invasion, and metastasis [3]. A suitable microenvironment is the “soil” for tumor growth, which can cause genomic instability, provide scaffolds and barriers, generate immune regions, induce bidirectional differentiation and form a permissive microenvironment, and promote the formation and development of tumors [4, 5]. Therefore, it is crucial to focus on the TME to illuminate the mechanisms of GC tumorigenesis.
Post-translational modification (PTM) refers to the covalent processing of proteins during or after translation, where a modification group is attached to one or several amino acid residues or removed by protein hydrolysis, thereby changing the properties of the protein. PTM is widely found in eukaryotic cells and is second only to replication, transcription, and translation as an important regulatory mechanism with biological functions [6]. Several hundred post-translational modifications have been identified, including phosphorylation, ubiquitination, crotonylation, glycosylation, carboxylation, acetylation, lactylation, and ribosylation. The ubiquitin system consists of a complex cascade of reactions, mainly ubiquitin-activating enzyme (E1), ubiquitin-conjugating enzyme (E2), and ubiquitin ligase enzyme (E3), which are involved in the regulation of protein activity, eukaryotic cell cycle, DNA repair, and apoptosis [7, 8].
The development and evolution of malignant tumors is a multifactorial induced multi-stage evolutionary process involving numerous mutational accumulations of genes; by activating proto-oncogenes and inactivating oncogenes, their temporal, spatial, quantitative, and qualitative abnormal expression products act on cell growth, differentiation, and apoptosis. It is well known that cells are the basic units of life, and the dynamic changes of protein networks and their related functions are important for life processes [9]. The ubiquitin-proteasome system (UPS) and the lysosomal system are the two major modes of protein degradation and quality control. The ubiquitin-mediated protein degradation system is an important protein quality control system in cells, which regulates cell viability, signaling, and other cellular physiological processes [10].
Numerous studies have demonstrated that ubiquitination-related genes (URGs) are significantly associated with tumorigenesis. For example, in melanoma, the ubiquitination of galectin-3 by RNF8 via K48-linked polyubiquitin chains. Inhibiting galectin-3 restored cytokine levels and immune cell infiltration, providing a potential option for the management of melanoma [11]. Tian et al. [12] revealed that USP46 could facilitate cell migration by upregulating ENO1 in esophageal cancer. Nevertheless, the association between UGRs and the prognosis of GC is unknown, making it challenging to exploit ubiquitination-related therapy for GC.
Our study aims to provide insight into the expression pattern of URGs and their regulatory mechanisms in GC in order to determine novel and powerful prognostic biomarkers of GC.
The expression profiling and clinical traits of 375 GC samples were downloaded from the TCGA website (https://portal.gdc.cancer.gov/). Another GC-independent dataset (GSE84437) containing transcriptome data and survival information was obtained from the Gene Expression Omnibus (GEO) database (https://www.ncbi.nlm.nih.gov/geo/). All raw data were pre-processed with the limma package in R software (4.1.3, R Foundation for Statistical Computing, Vienna, Austria). The exclusion criteria were set as follows: (1) histologic diagnosis was not GC; (2) samples without completed data for analysis; and (3) overall survival (OS) time of less than 30 days. We screened the list of UGRs using a relevance score greater than 10.0 from the GENECARDS database website (https://www.genecards.org/). Detailed information on these URGs is shown in Supplementary Table 1.
Firstly, we selected the TCGA dataset as a training set for model establishment.
All UGRs were analyzed by univariate Cox regression to screen out
prognosis-related URGs (p
We applied unsupervised clustering through the ‘ConsensusClusterPlus’ package [13]. The optimal cluster value was determined based on the similarity between the expression matrix of UAGs and the fuzzy clustering measurement ratio.
We obtained scRNA data (GSE167297) of GC from the GEO database. The scRNA-seq
matrix for individual samples was analyzed using the Read10
GSEA was conducted using GSEA software (version 4.0.1, Massachusetts Institute
of Technology, and Regents of the University of California, CA, USA) with 1000
rows. Hallmark and KEGG terms were selected as the target gene sets from MSigDB.
Total GC cases were divided into two groups based on risk and enriched for the
above gene sets. Any gene set with FDR
CIBERSORT (https://cibersort.stanford.edu/) is an algorithm that estimates the abundance of cell types infiltrated by patients with tumors based on gene expression data [15]. Moreover, single sample gene set enrichment analysis (ssGSEA) was employed to immune activity and function between two risk groups. The drug sensitivity analysis was conducted by the ‘pRRophetic’ package to detect which drugs presented different sensitivities among the two risk groups. The half-maximal inhibitory concentration (IC50) was calculated to evaluate the drug sensitivity [16].
Two human GC cell lines (SGC7901 and BGC823) and one normal
gastric epithelium cell line (GES-1) were purchased from the Cell Center of
Shanghai Institutes. All cell lines were cultured in RPMI 1640 medium
(Invitrogen) containing 10% fetal bovine serum and 1% antibiotics (100 U/mL
penicillin G and 100 mg/mL streptomycin) at 37 °C with 5% CO
Total RNA was extracted from cells using RNA easy reagent (Vazyme, Nanjing,
China) based on the manufacturer’s instructions. RNA was then synthesized to cDNA
by Primerscript Mix (Takara Bio, Kusatsu, Shiga, Japan). RT-PCR was applied on a
Steponeplus system with SYBR Green Regent (Takara Bio, Japan). The relative
expression was calculated using the 2
A total of 10,000 cells per well were seeded into a 96-well plate. After 24 hours of incubation at 37 °C, cell viability was determined by detecting ATP levels in cell lysates using the CellTiter-Glo (CTG) Assay.
A total of 200 cells/well were seeded into six-well plates and incubated for 1-week. Clones were fixed with methanol and stained with 0.1% crystal violet (Servicebio, Wuhan, China) when visible to the naked eye. Image-J (version 1.5b, LOCI, University of Wisconsin, Madison, WI, USA) was used for colony counting.
EdU assay was performed to evaluate cell proliferation. The cells were cultured
in 96-well plates (5000 cells per well) with complete medium for 24 h. After a 2
h incubation with EdU solution (50 µM), all cells were fixed and stained
with 1
All bioinformatics data were analyzed by R software (version 4.0, Lucent Technologies, Murray Hill, NJ, USA). and wet lab experimental data were analyzed using GraphPad 9.4 (GraphPad Software, Inc., San Diego, CA, USA). Survival curves were used to compare survival differences between the two groups using the Kaplan-Meier (KM) method. The discrepancies in clinical outcomes between groups were examined using the Kaplan-Meier survival analysis. Receiver operator characteristic (ROC) curves were plotted to confirm the accuracy of UAS. Cox regression was utilized to detect the independent performance of UAS in GC.
A flowchart of the present research is shown in Fig. 1. Firstly, univariate Cox
analysis was employed to obtain eight potential URGs with significant prognosis
values, which were then enrolled into the multivariate Cox method (Fig. 2A).
Using stepwise Cox methods, we set up the UAS including five URGs
(OTULIN, UBE2C, USP1, USP2, and MAPT) (Fig. 2B). The risk model equation was: (0.2508
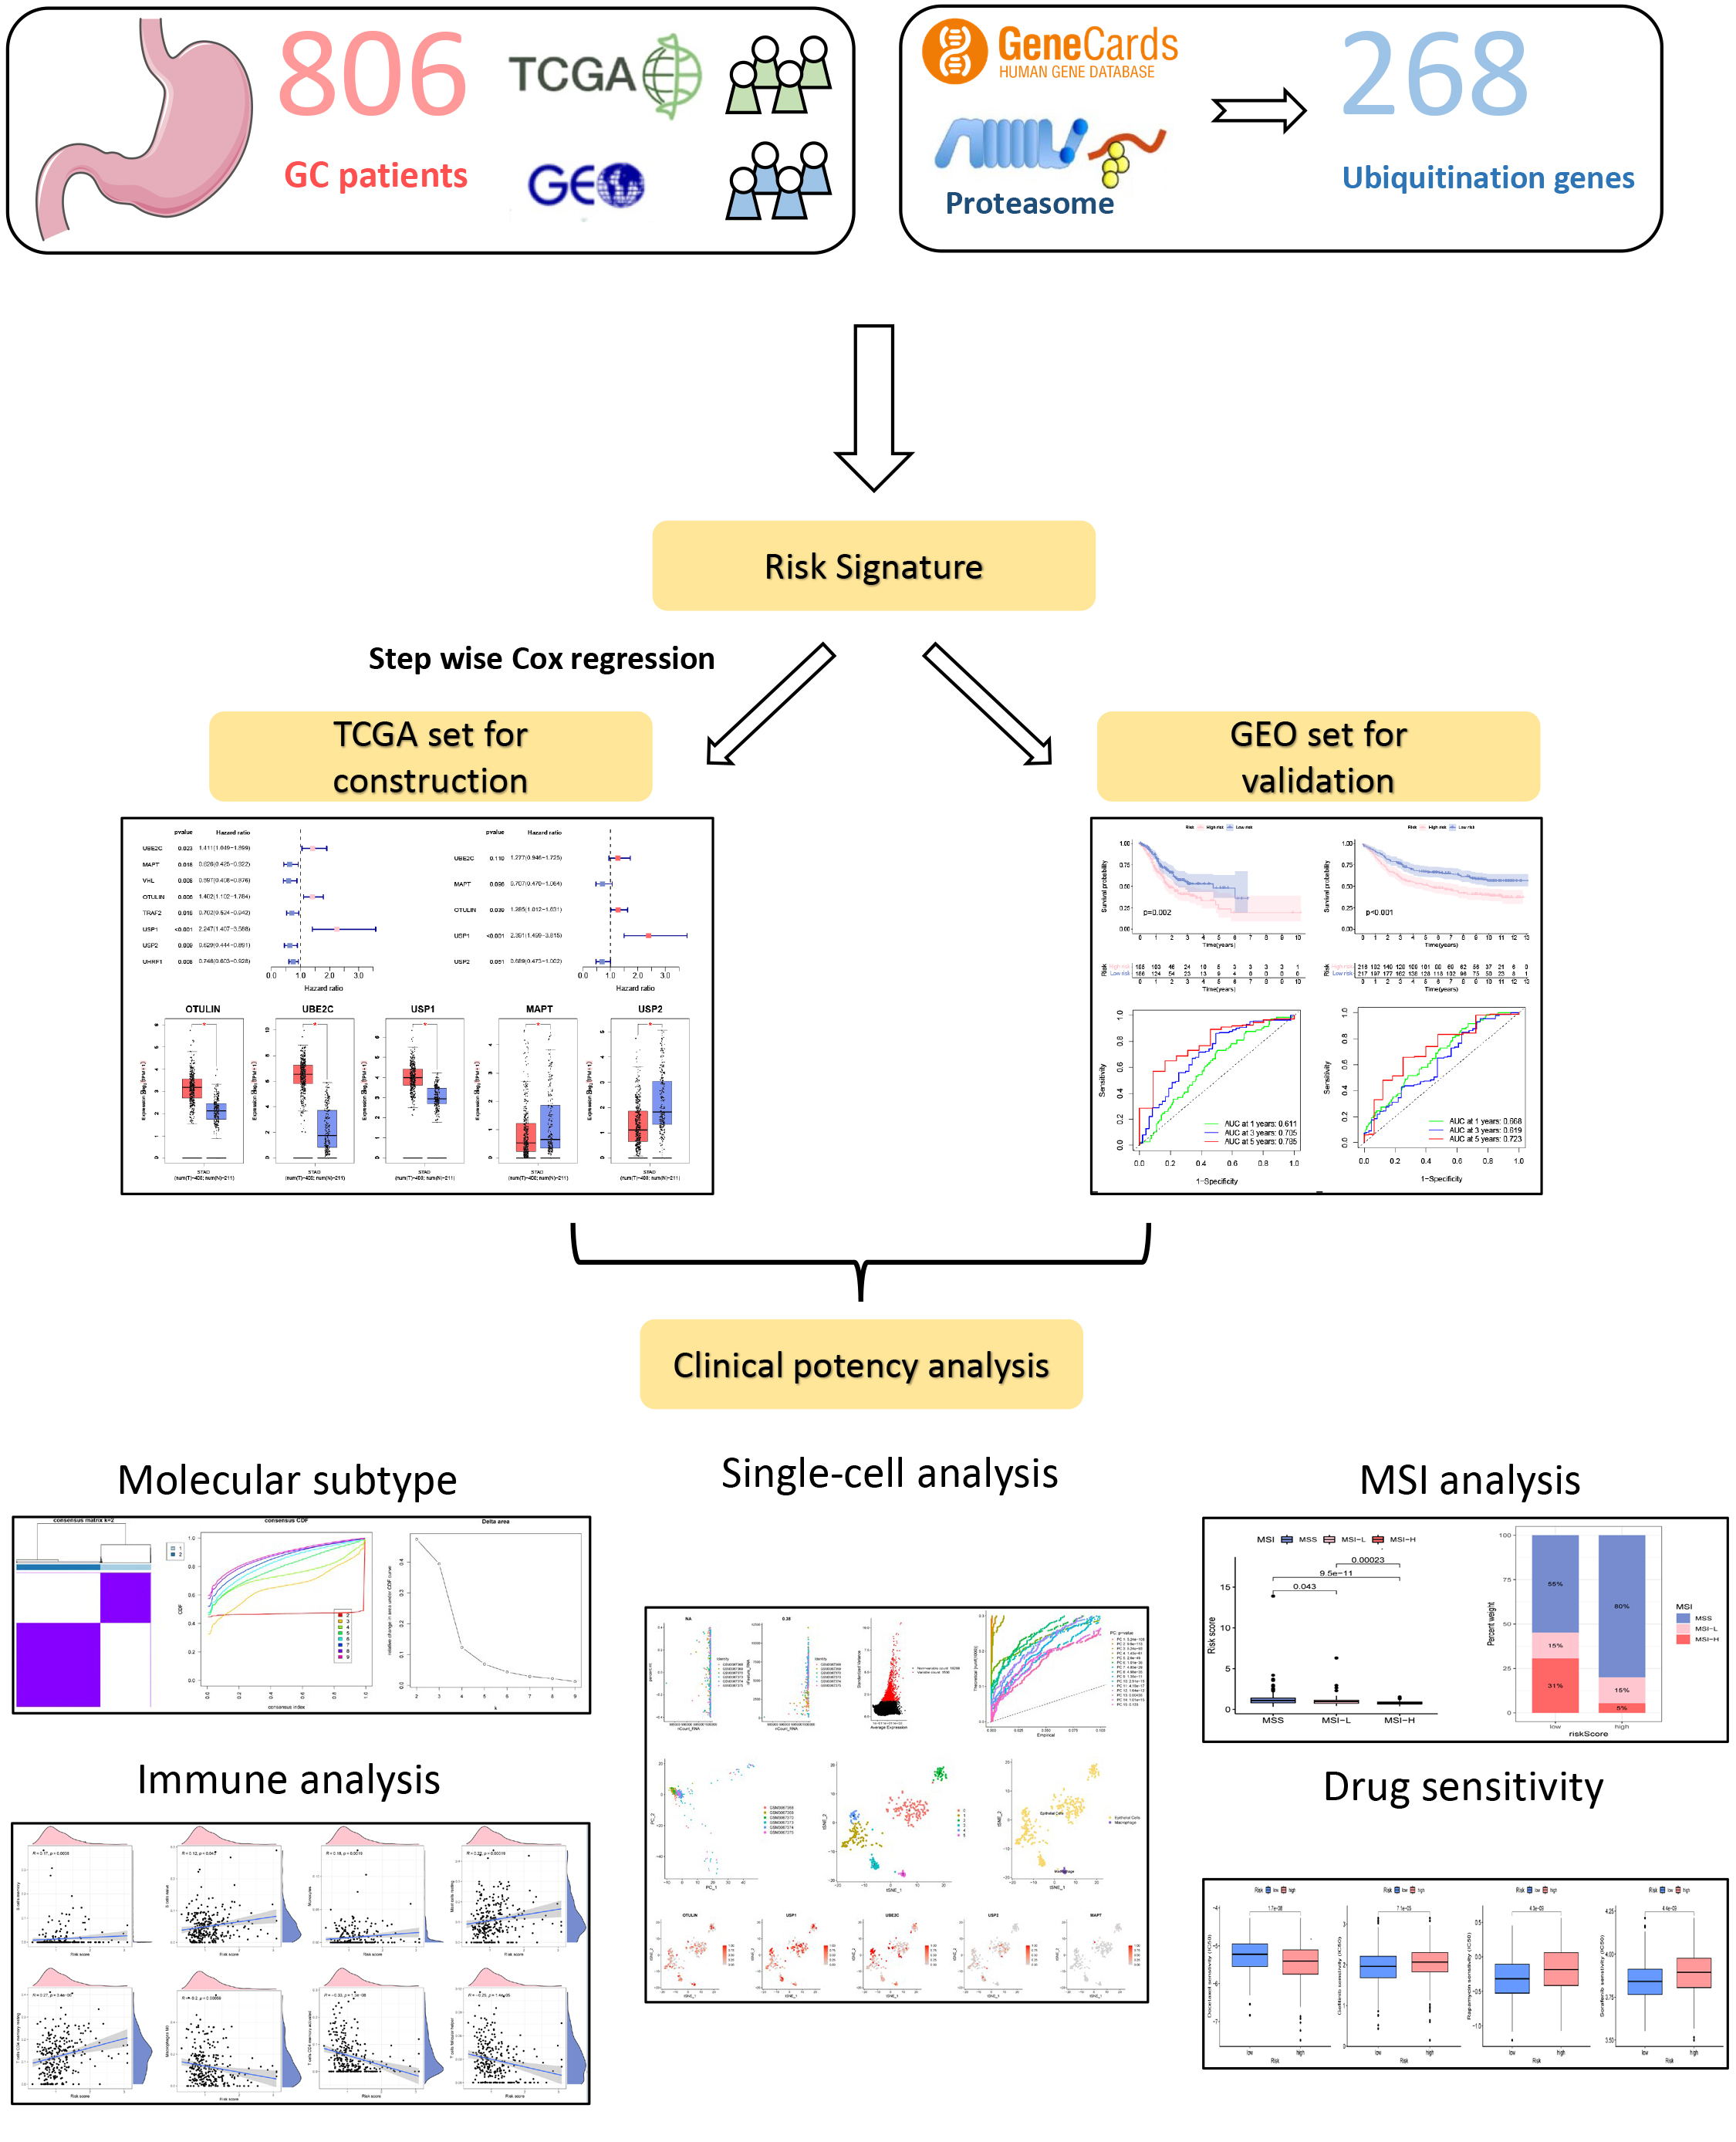 Fig. 1.
A flowchart of the present research. Gastric cancer (GC), The Cancer Genome Atlas Program (TCGA), Gene Expression Omnibus (GEO), microsatellite instability (MSI).
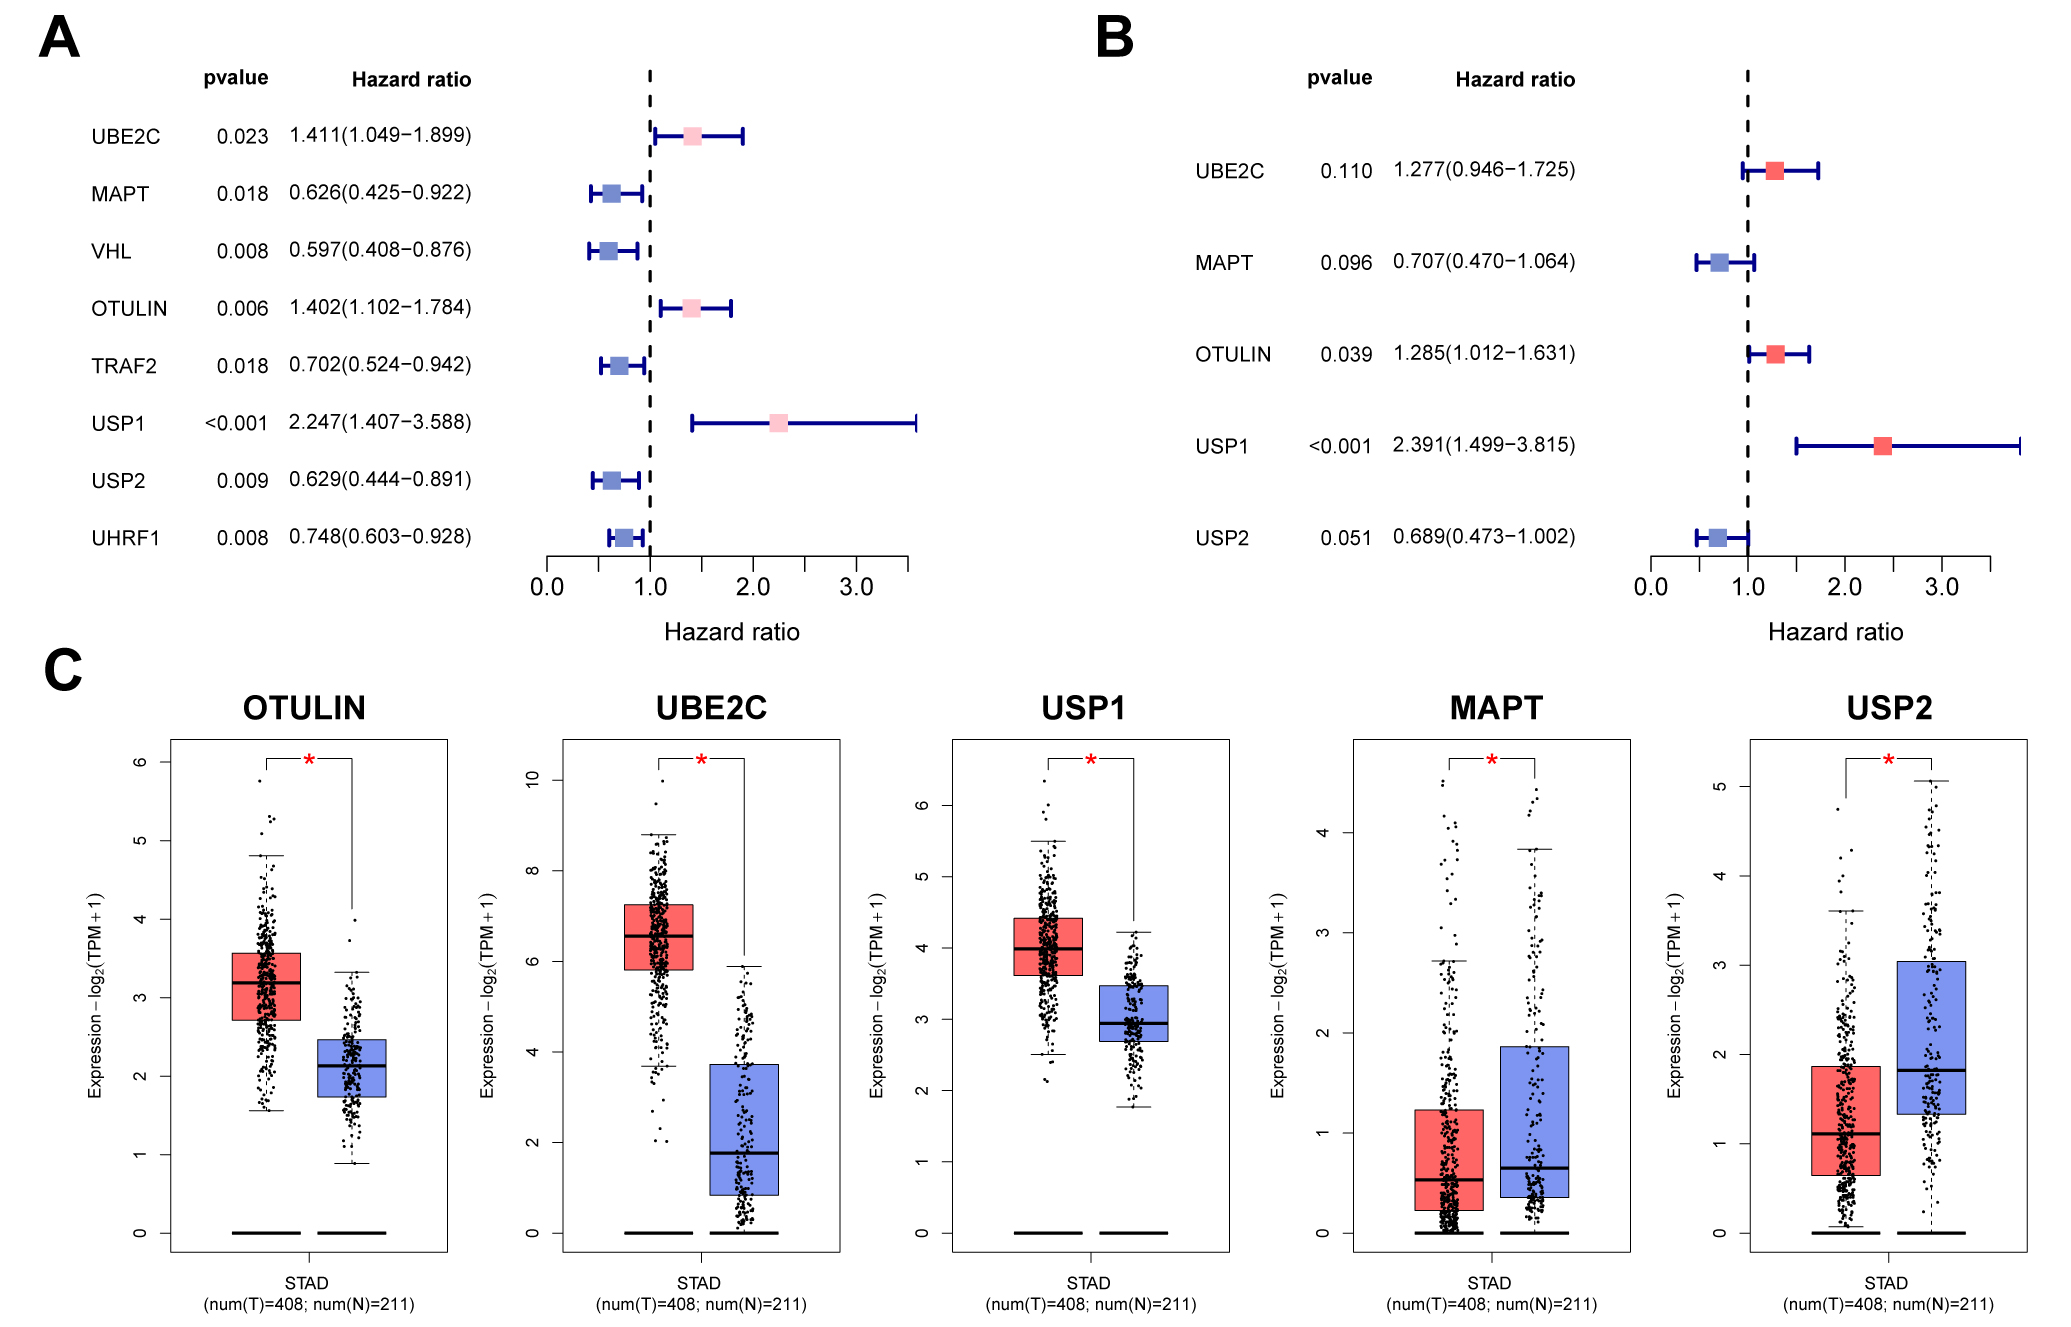 Fig. 2.
Construction process of the ubiquitination-associated signature
(UAS). (A) Univariate Cox analysis. (B) Multivariate Cox analysis for screening
model genes. (C) The expression patterns of UAS genes in gastric cancer (GC) and
normal specimens. *p
Based on model risk scores constructed from five URGs, we divided GC cases into high- and low-risk groups, showing good predictive ability of the model in both the training and validation groups, and defined them as a USA-high cohort and UAS-low cohort. Survival curves demonstrated that high-risk score was associated with dismal OS in the training set (TCGA cohort), which was confirmed by the verification set (GSE84437) (Fig. 3A,B). The 1-, 3- and 5-year area under the curves (AUCs) were 0.611, 0.705, and 0.785 for the training set (Fig. 3C), 0.668, 0.619, and 0.723 for the verification set (Fig. 3D), respectively, indicating the beneficial predictive ability of our constructed UAS. Fig. 3E,F illustrates the relationship between risk scores and the pattern of patient survival status (alive or dead) distribution. Mortality was significantly decreased in the UAS-low cohort than in the USA-high cohort; both were independent datasets (Fig. 3G,H).
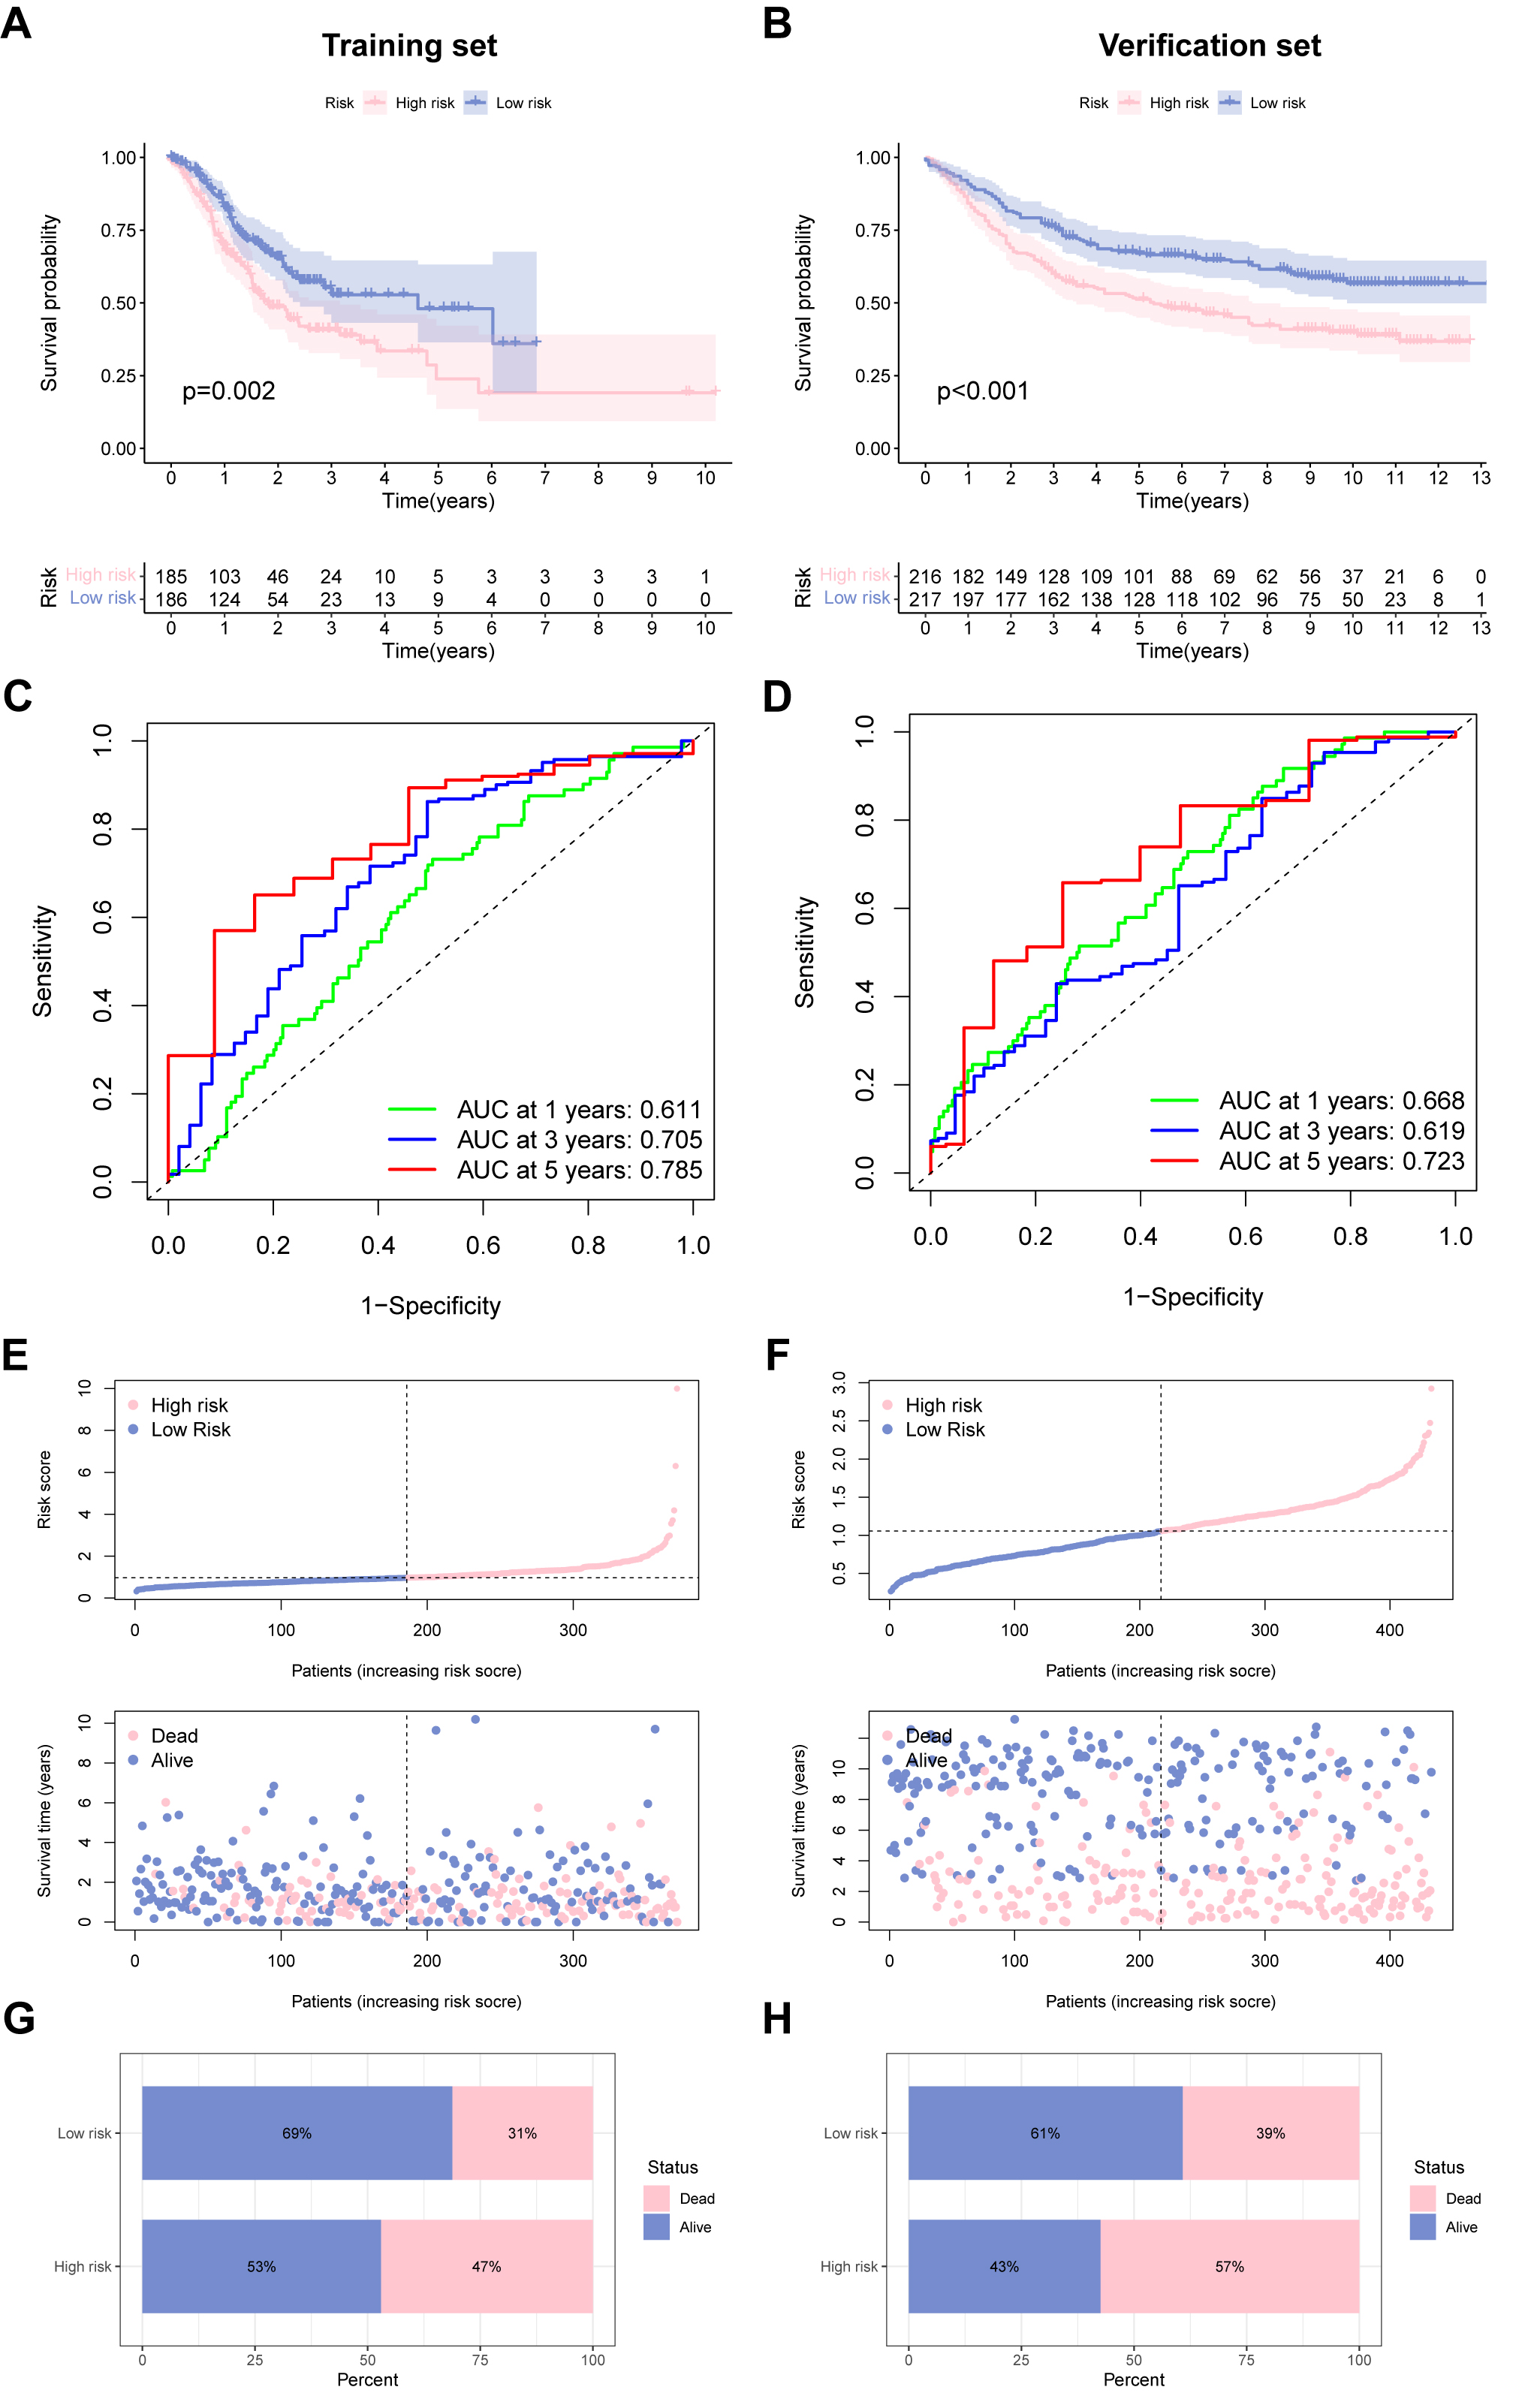 Fig. 3.
Performance of the ubiquitination-associated signature. (A,B) Survival curves of survival outcome of GC cases between two groups in the training and verification sets. (C,D) Receiver operating characteristic (ROC) curves to predict the performance of UAS in the two GC cohorts. (E,F) Demonstration of the UAS based on the risk score of the training and verification sets, respectively. (G,H) The proportion of deaths and survival in two subgroups. ROC, receiver operator characteristic.
We employed Cox regression to detect the independent prognostic score of UAS in
GC patients. Fig. 4A revealed that univariate analysis remarkably associated the
UAS-high score with dismal survival outcomes. Multivariate Cox indicated that the
UAS score remained meaningful for forecasting prognosis. In addition, the
prognostic independence of UAS was confirmed in the test cohort (Fig. 4C,D).
Additionally, we observed that UAS could forecast survival outcomes of different
clinical subgroups in terms of age (
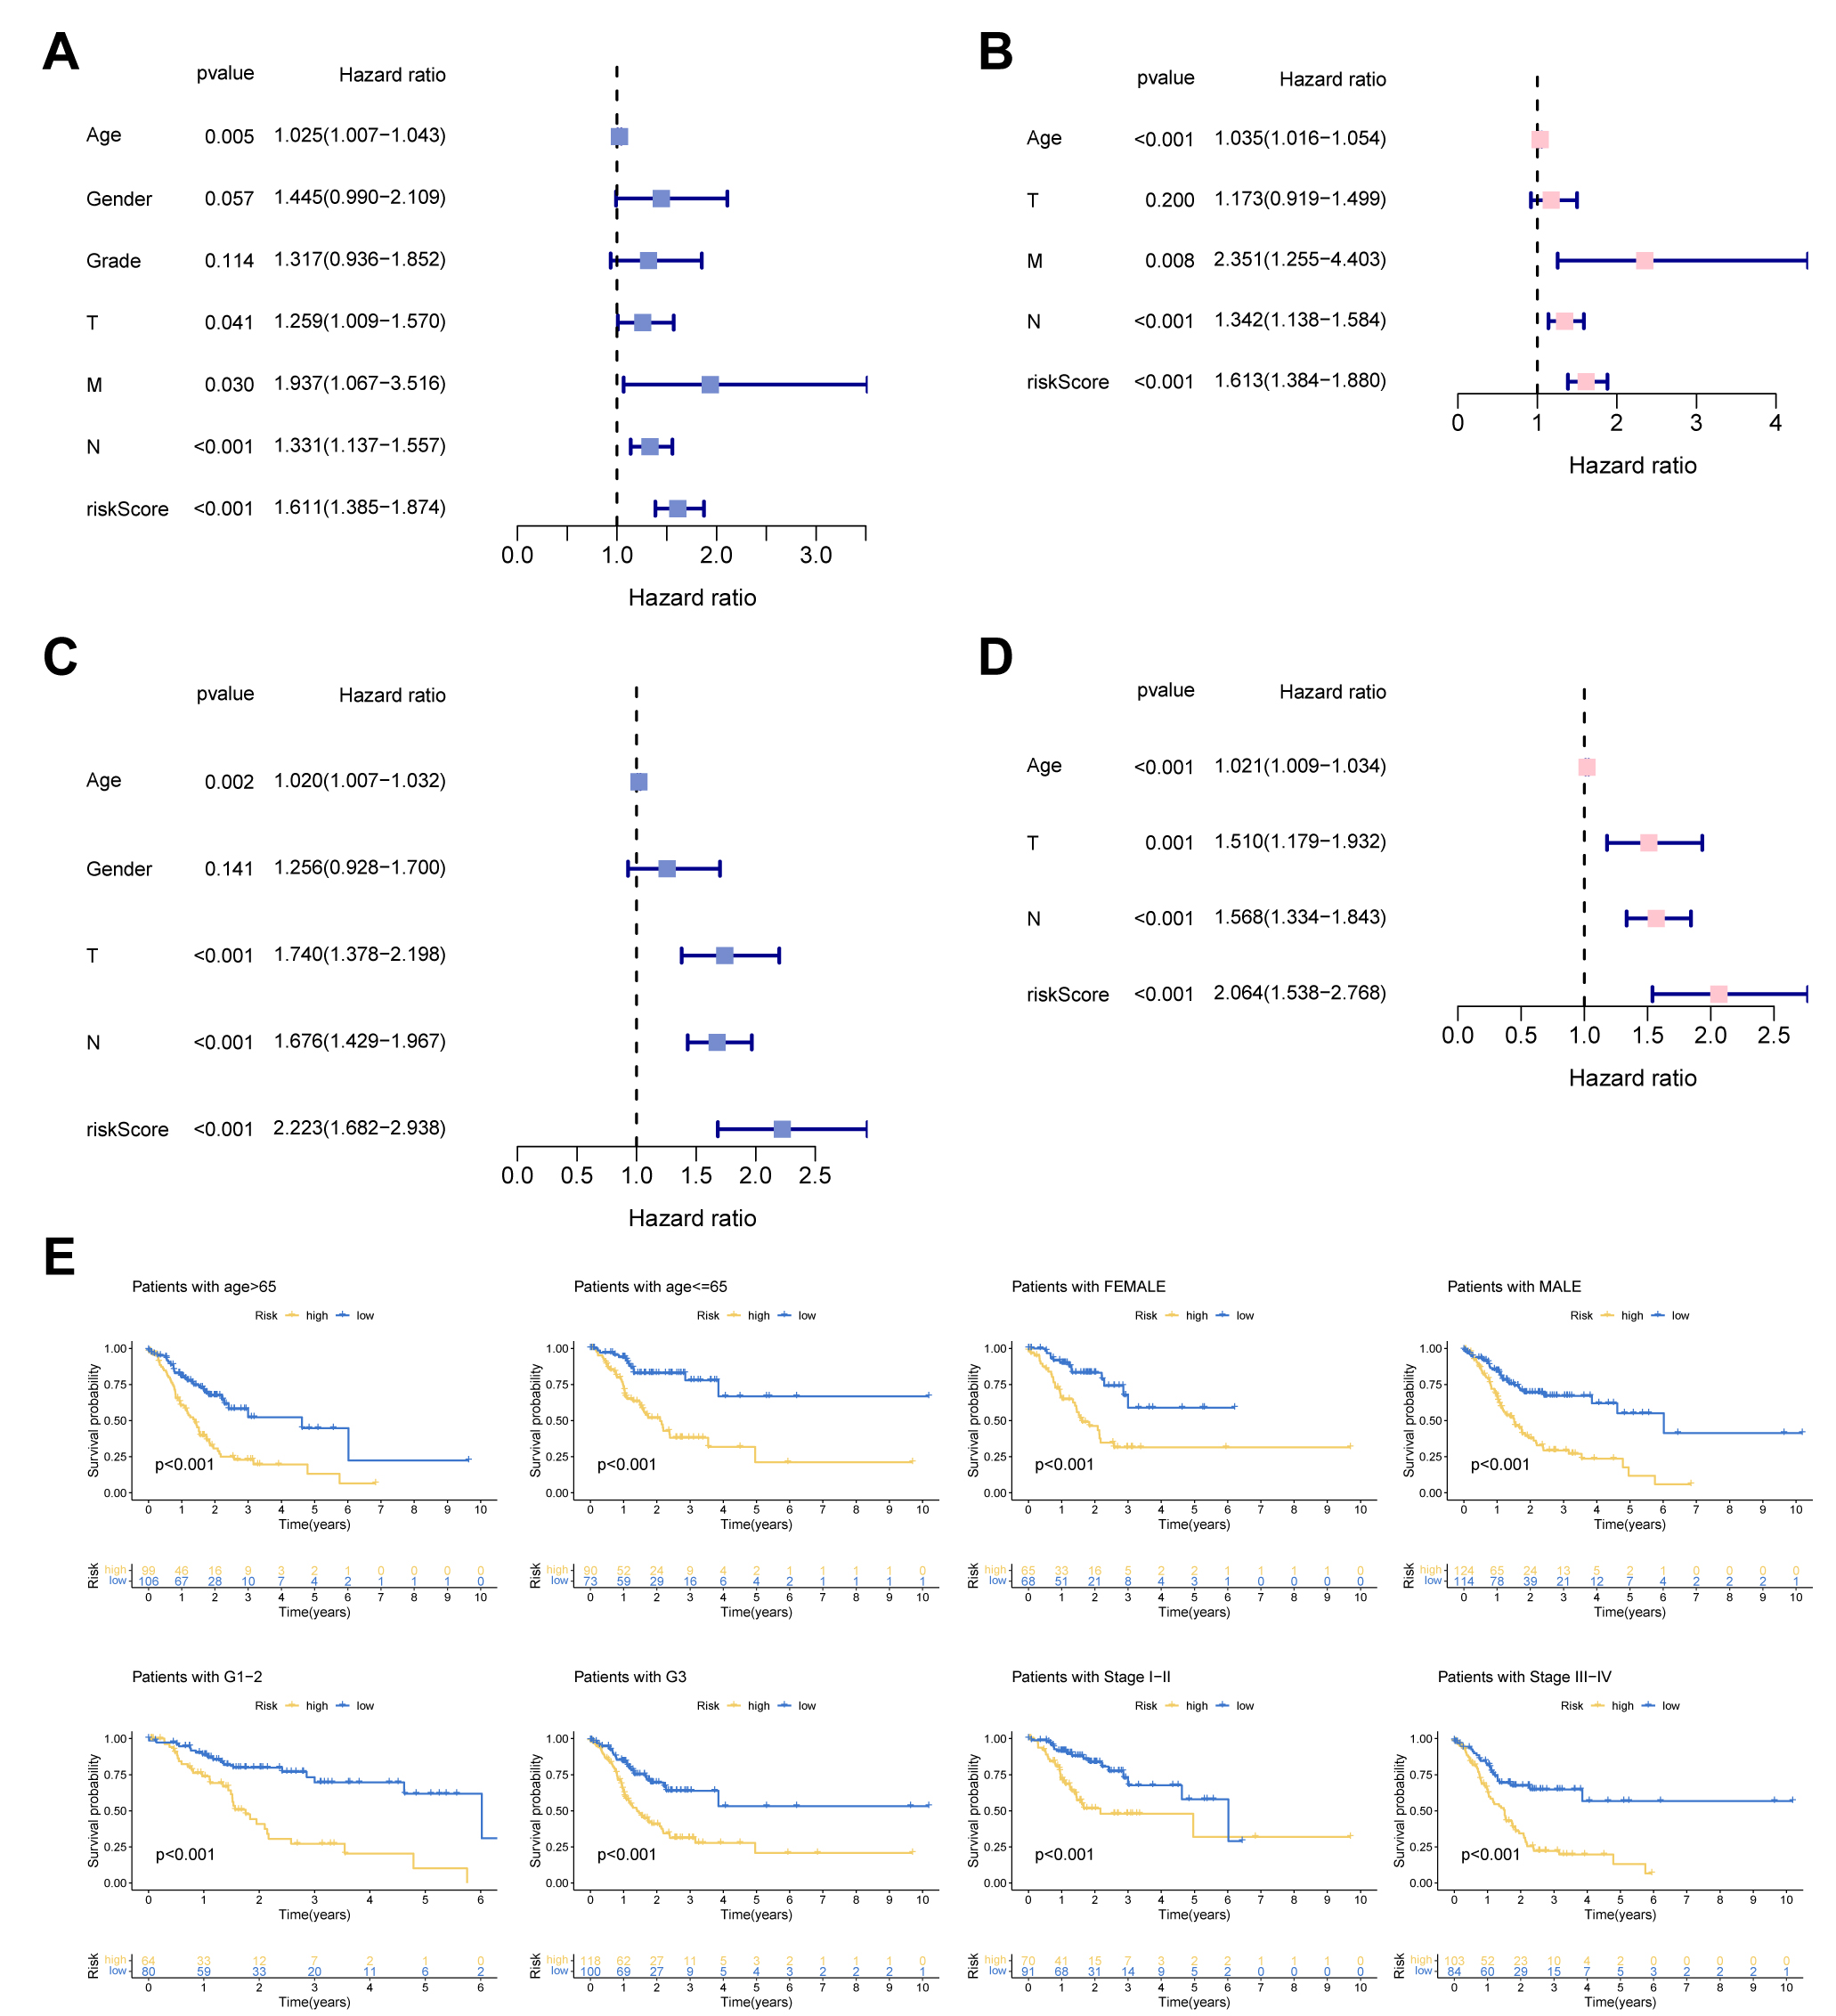 Fig. 4.
Independent prognosis analysis. (A,C) Univariate Cox analysis. (B,D) Multivariate Cox analysis. (E) Subgroup survival analysis of the UAS in terms of age, gender, grade, and stage.
To develop a novel molecular subtype in GC, consensus clustering analysis was employed based on 268 URGs. According to the cumulative distribution function (CDF), we conducted the tracking plot from k = 2 to 9, where k = 2 was identified as the cluster number to divide patients into cluster A (n = 304) and cluster B (n = 504) (Fig. 5A). Principal component analysis (PCA) indicated that two clusters of GC cases could be effectively distinguished by our proposed novel molecular subtype (Supplementary Fig. 1A). Cluster B had a better outcome than cluster A. There was an obvious difference discrepancy in immunocyte infiltration between the two subgroups (Fig. 5B,C). Supplementary Fig. 1B summarizes the relationship between UAS-based molecular clusters and different clinical traits. We then identified potential pathways (ubiquitination, DNA repair, and cell cycle) in which clusters might be involved by KEGG enrichment analysis (Fig. 5D).
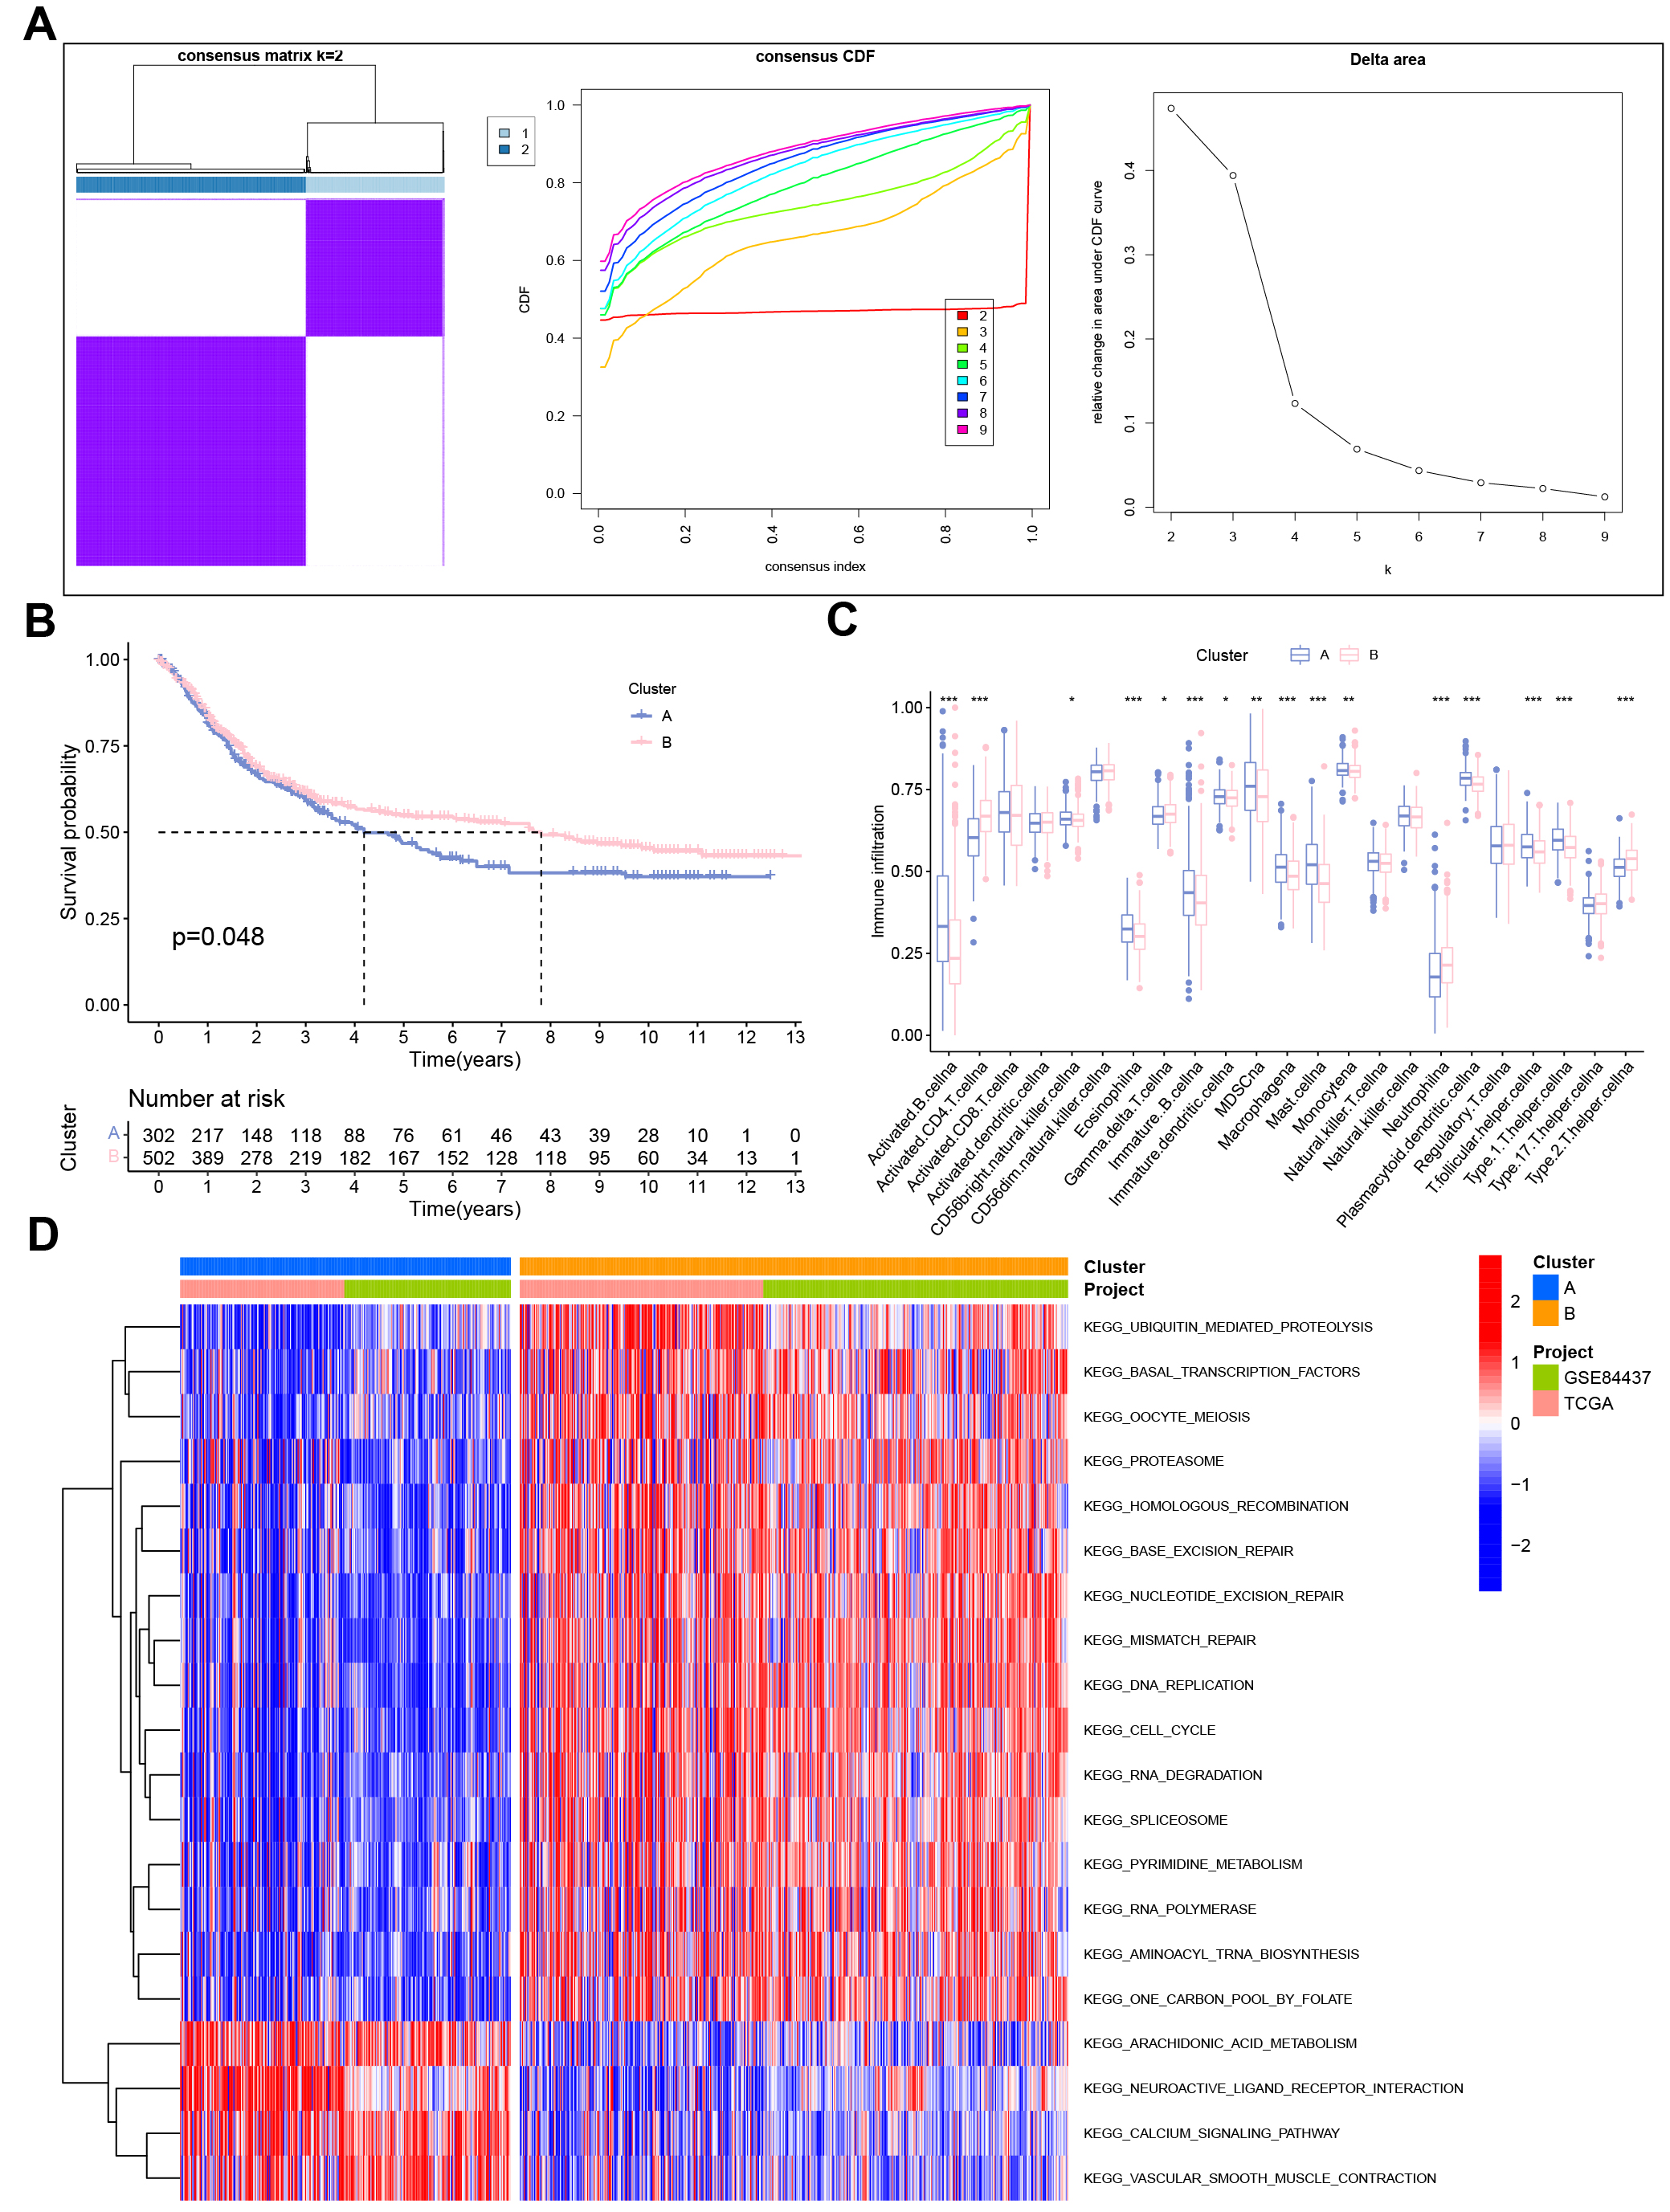 Fig. 5.
Cluster analysis for determination of URGs-based molecular
subtype. (A) Consensus clustering results. (B) Survival analysis and (C) immune
infiltration analysis between two clusters. (D) Gene set variation analysis (GSVA) based on Kyoto Encyclopedia of Genes and Genomes (KEGG)
pathway enrichment. *p
Next, we applied CIBERSORT and ssGSEA analyses to explore the ability of the model to predict the immune microenvironment of GC patients. In Fig. 6A, B cells memory, B cells naive, monocytes, mast cells resting, and T cells CD4 memory resting positively correlated with risk score, whereas macrophages M0, T cells CD4 memory activated, and T cells follicular helper were negatively correlated with risk score. The results from ssGSEA revealed that immune functions such as CCR, major histocompatibility complex (MHC) class I, and type II interferon (IFN) response differed significantly among the two groups (Fig. 6B). Fig. 6C shows the expression patterns of classical immune checkpoints among two groups. It was shown that CD86, CD200, CD40, NRP1, CD48, CD27, and TNFSF15 were upregulated in the UAS-high group, whereas in the UAS-high group, other immune checkpoints exhibited a decreased expression level.
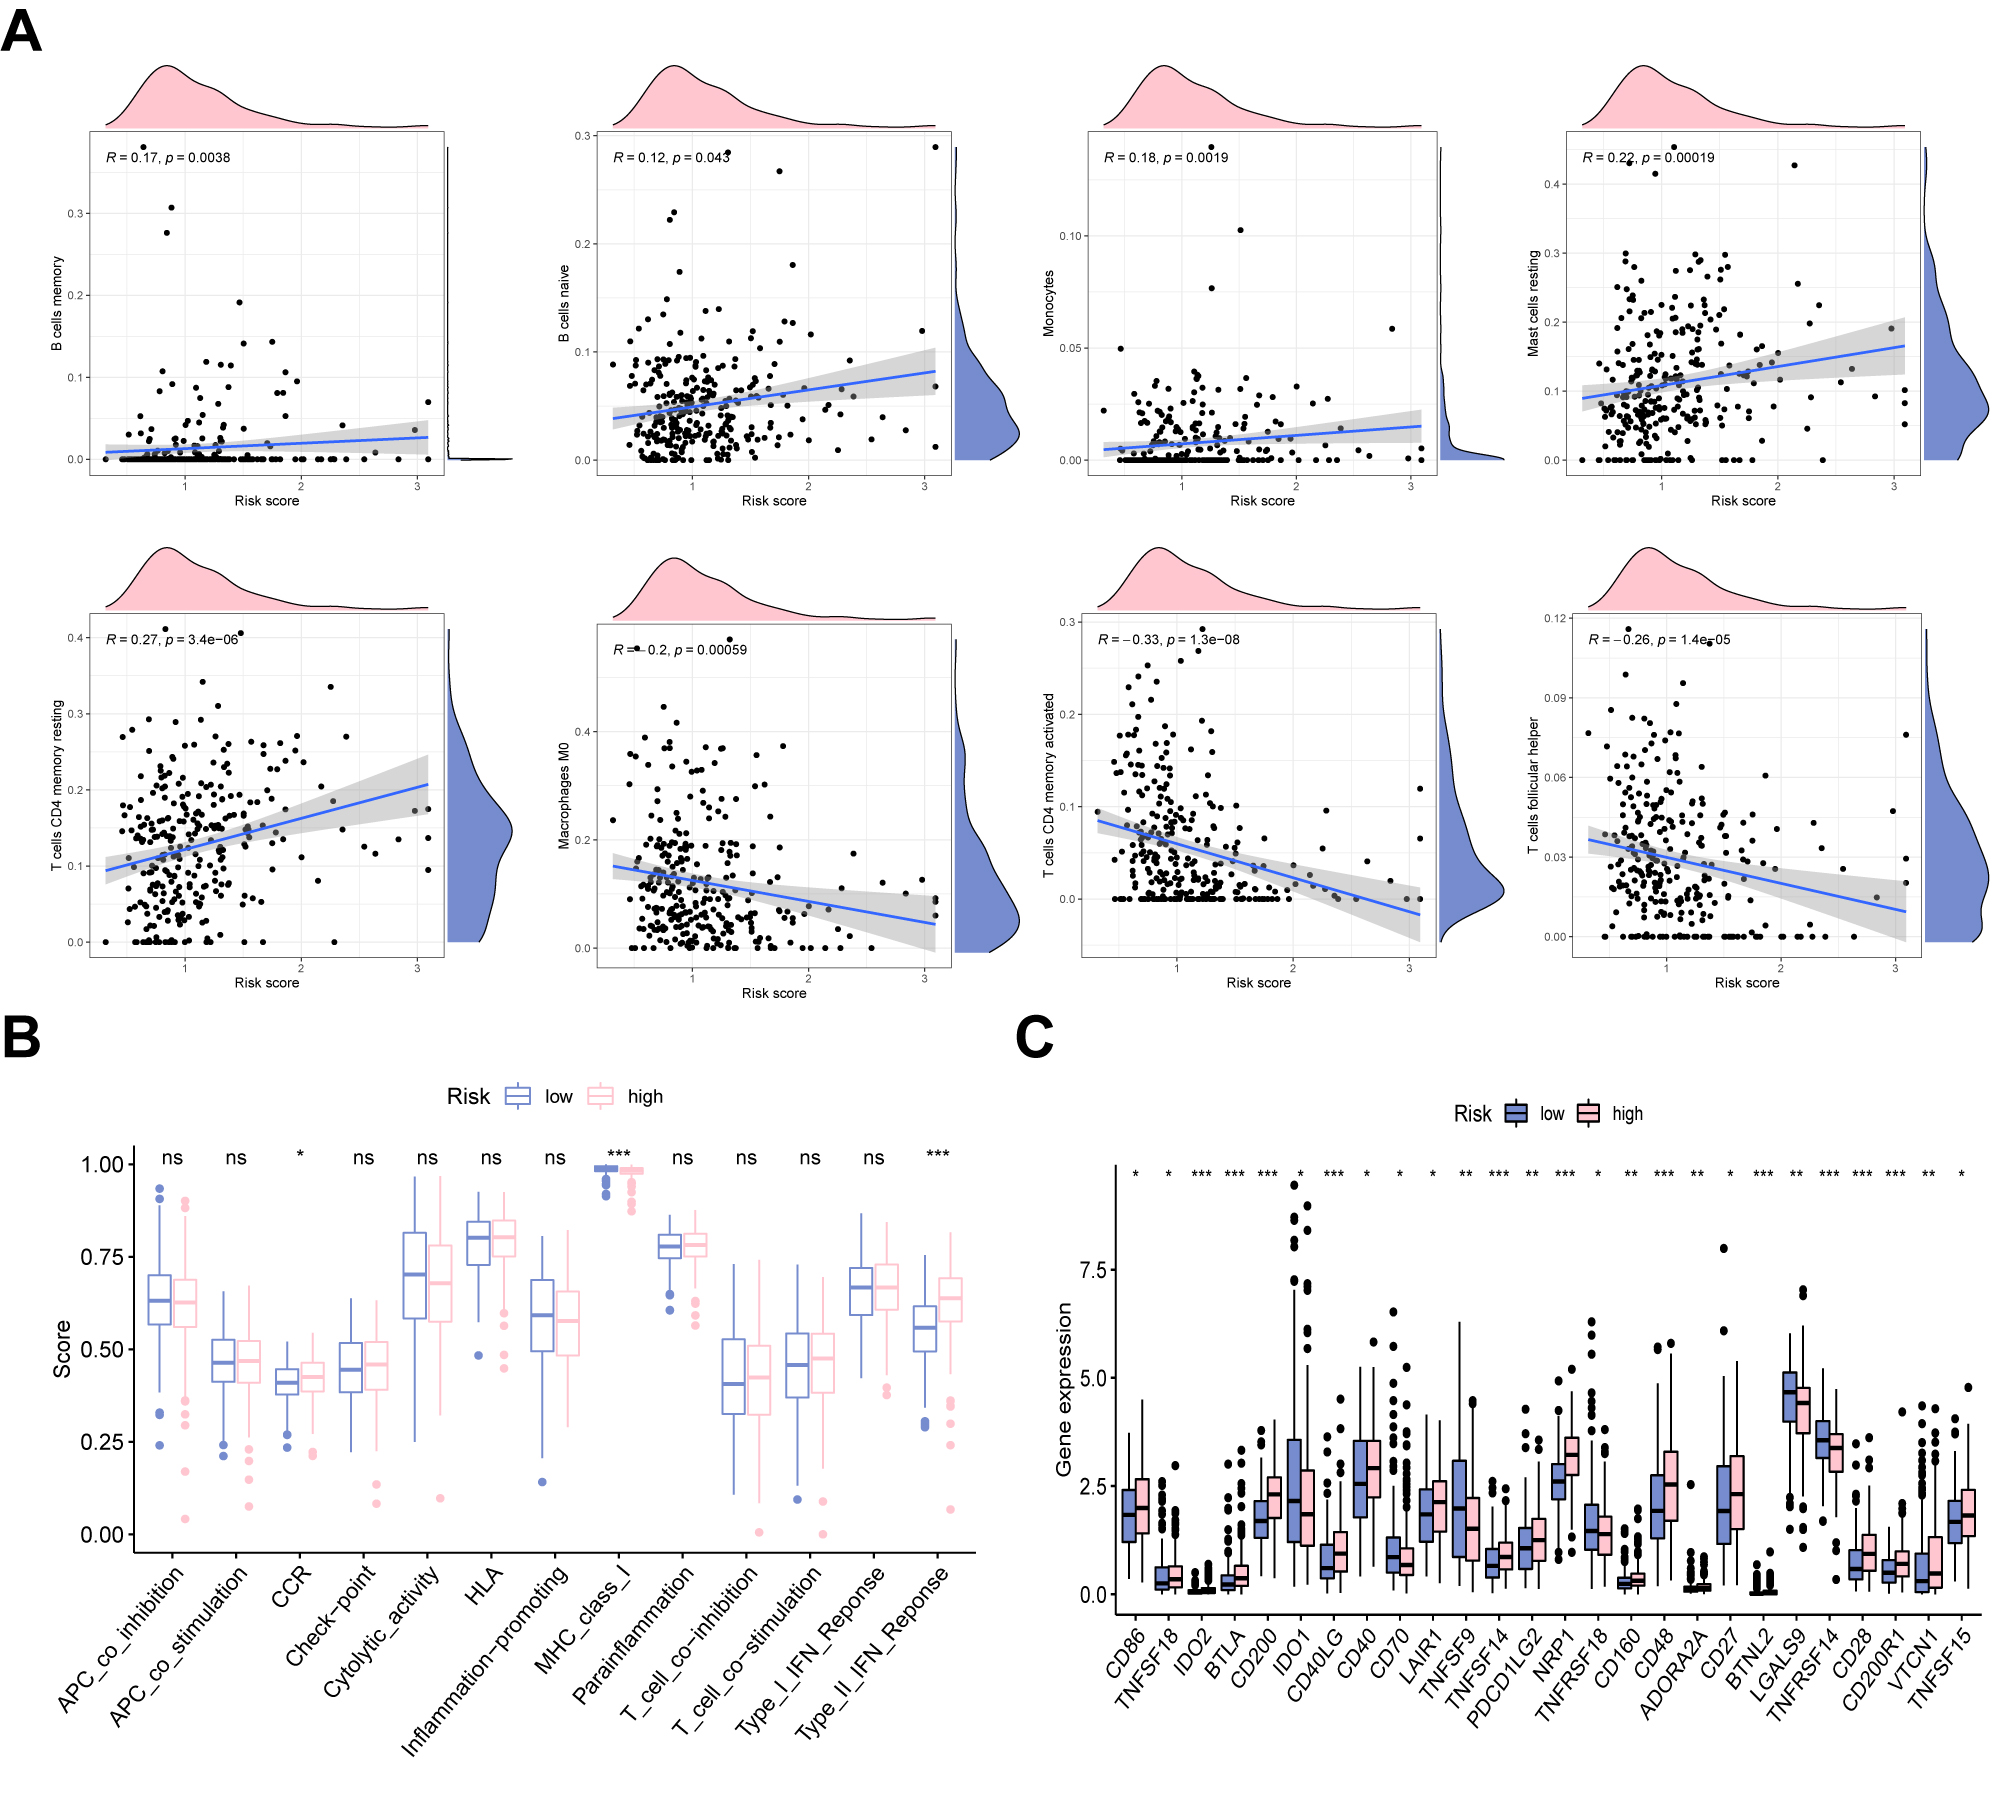 Fig. 6.
Immune landscape analysis. (A) The correlation between risk
score and immune cells. (B) The difference in immune functions in two risk
groups. (C) Immune checkpoints analysis of the UAS. *p
Considering the crucial regulatory role of m6A regulators in GC progression, we
determined the relationship between risk score and the expression of m6A
regulators. We found that ZC3H13 and FTO were highly expressed in the UAS-high
group. In contrast, HNRNPC, ALKBH5, YTHDF2, RBM15, YTHDF1, and METTL3 were
downregulated in the UAS-high group (Fig. 7A). There were significant differences
in the expression of chemoradiotherapy sensitivity-related genes between the two
groups. As shown in Fig. 7B, AKR1C1, EGFR, FLT3, and KIT were significantly
overexpressed in the UAS-high group (Fig. 7B). The proportion of patients with
MSS was significantly lower in the UAS-low cohort than in the UAS-high cohort. In
comparison, the proportion of MSI-H was significantly higher in UAS-high cohort
(Fig. 7C). In addition, the risk score was negatively correlated with RNA
stemness score (RNAss) (Fig. 7D). Drug sensitivity analysis revealed that
docetaxel (p = 1.7
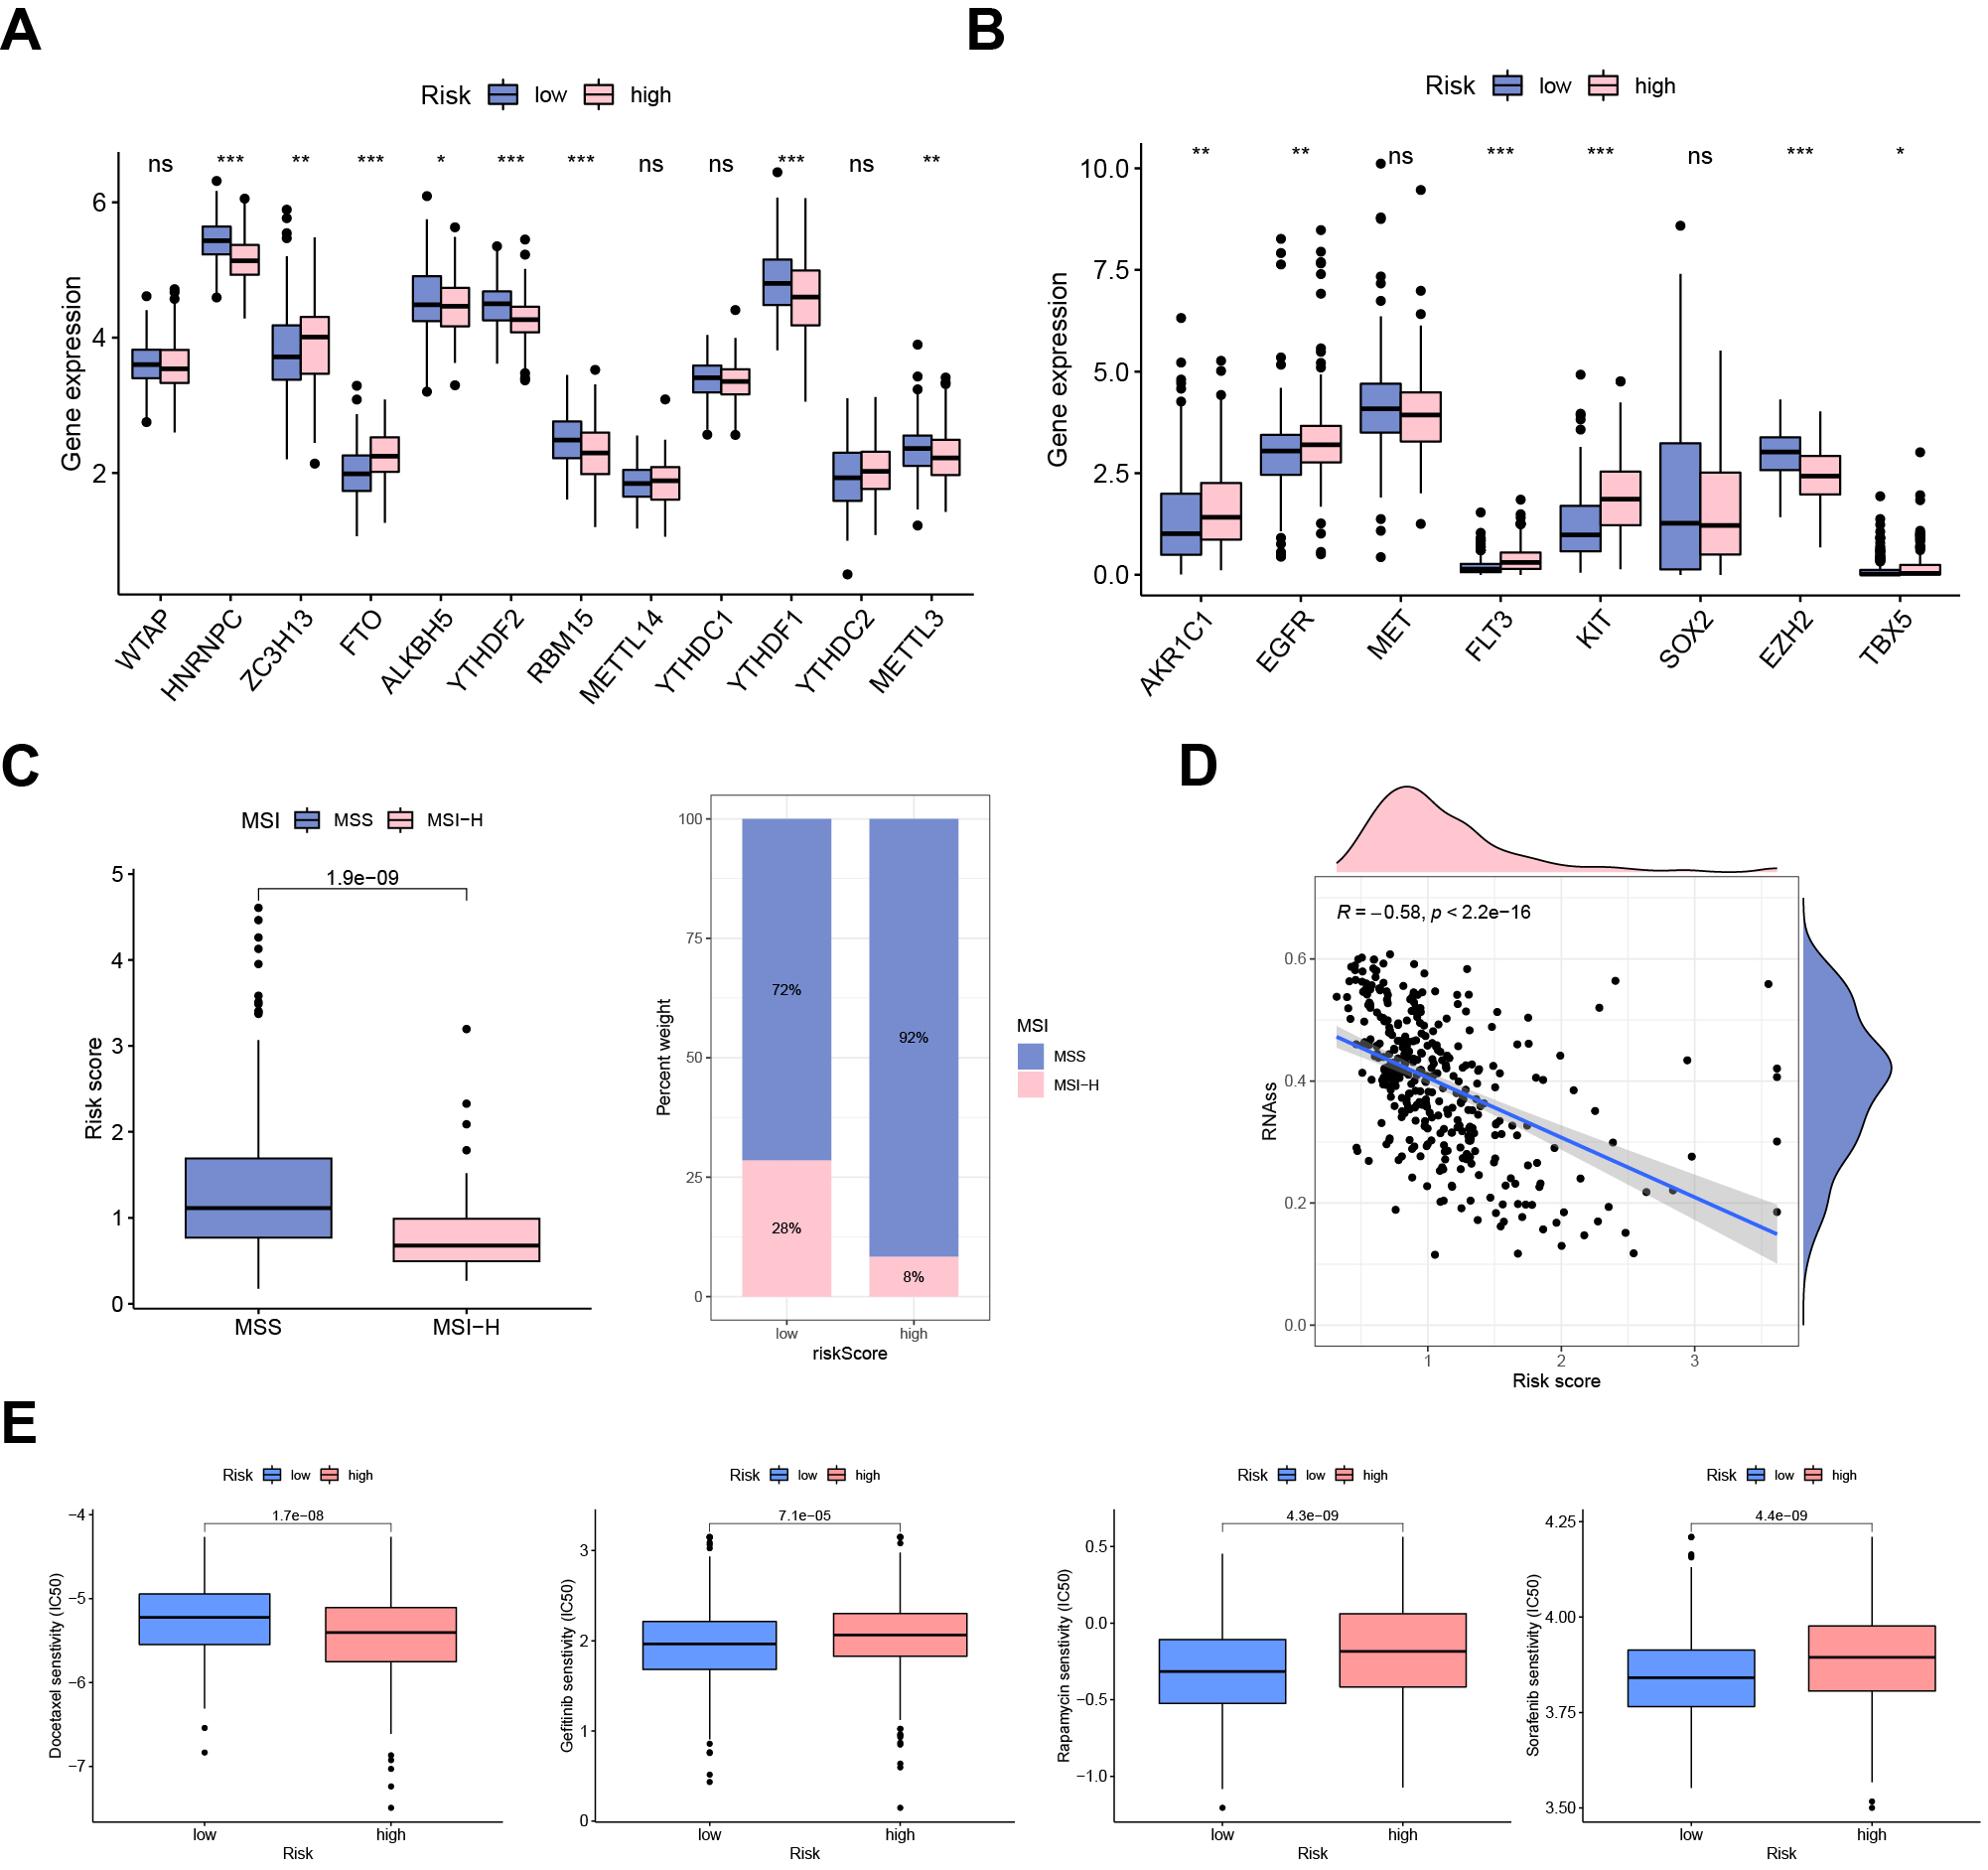 Fig. 7.
Clinical potency of the UAS. (A) The expression patterns of
m6A regulators and (B) chemosensitivity-related genes between risk groups. (C)
Correlation between MSI and risk score. (D) Cancer stemness analysis. (E) Drug
sensitivity analysis (docetaxel, gefitinib, rapamycin, and sorafenib).
*p
Subsequently, we detected the expression pattern of five model genes at the single-cell level. A total of 14 GC samples from GSE167297 were enrolled into single-cell analysis (Supplementary Fig. 2A). The top 1500 variable genes with red labels were collected (Fig. 8A). Fig. 8B revealed a favorable integration effect between cluster all samples and 50 PC groups. PCA analysis showed the distribution of all GC cases with no significant batch effects (Supplementary Fig. 2B). Using t-SNE diagrams, a total of 30,365 cells were identified and further clustered into 20 different subpopulations (Fig. 8C). Based on the surface marker, we determined 8 cell population types including B cells, dendritic cells (DCs) endothelial cells, epithelial cells, monocytes, NK cells, smooth muscle cells and T cells (Fig. 8D). Next, the cellular location of five URGs was detected. We observed that OTULIN, USP1, and UBE2C were enriched in malignant epithelial cells, whereas USP2 and MAPT were downregulated in malignant epithelial cells (Fig. 8E).
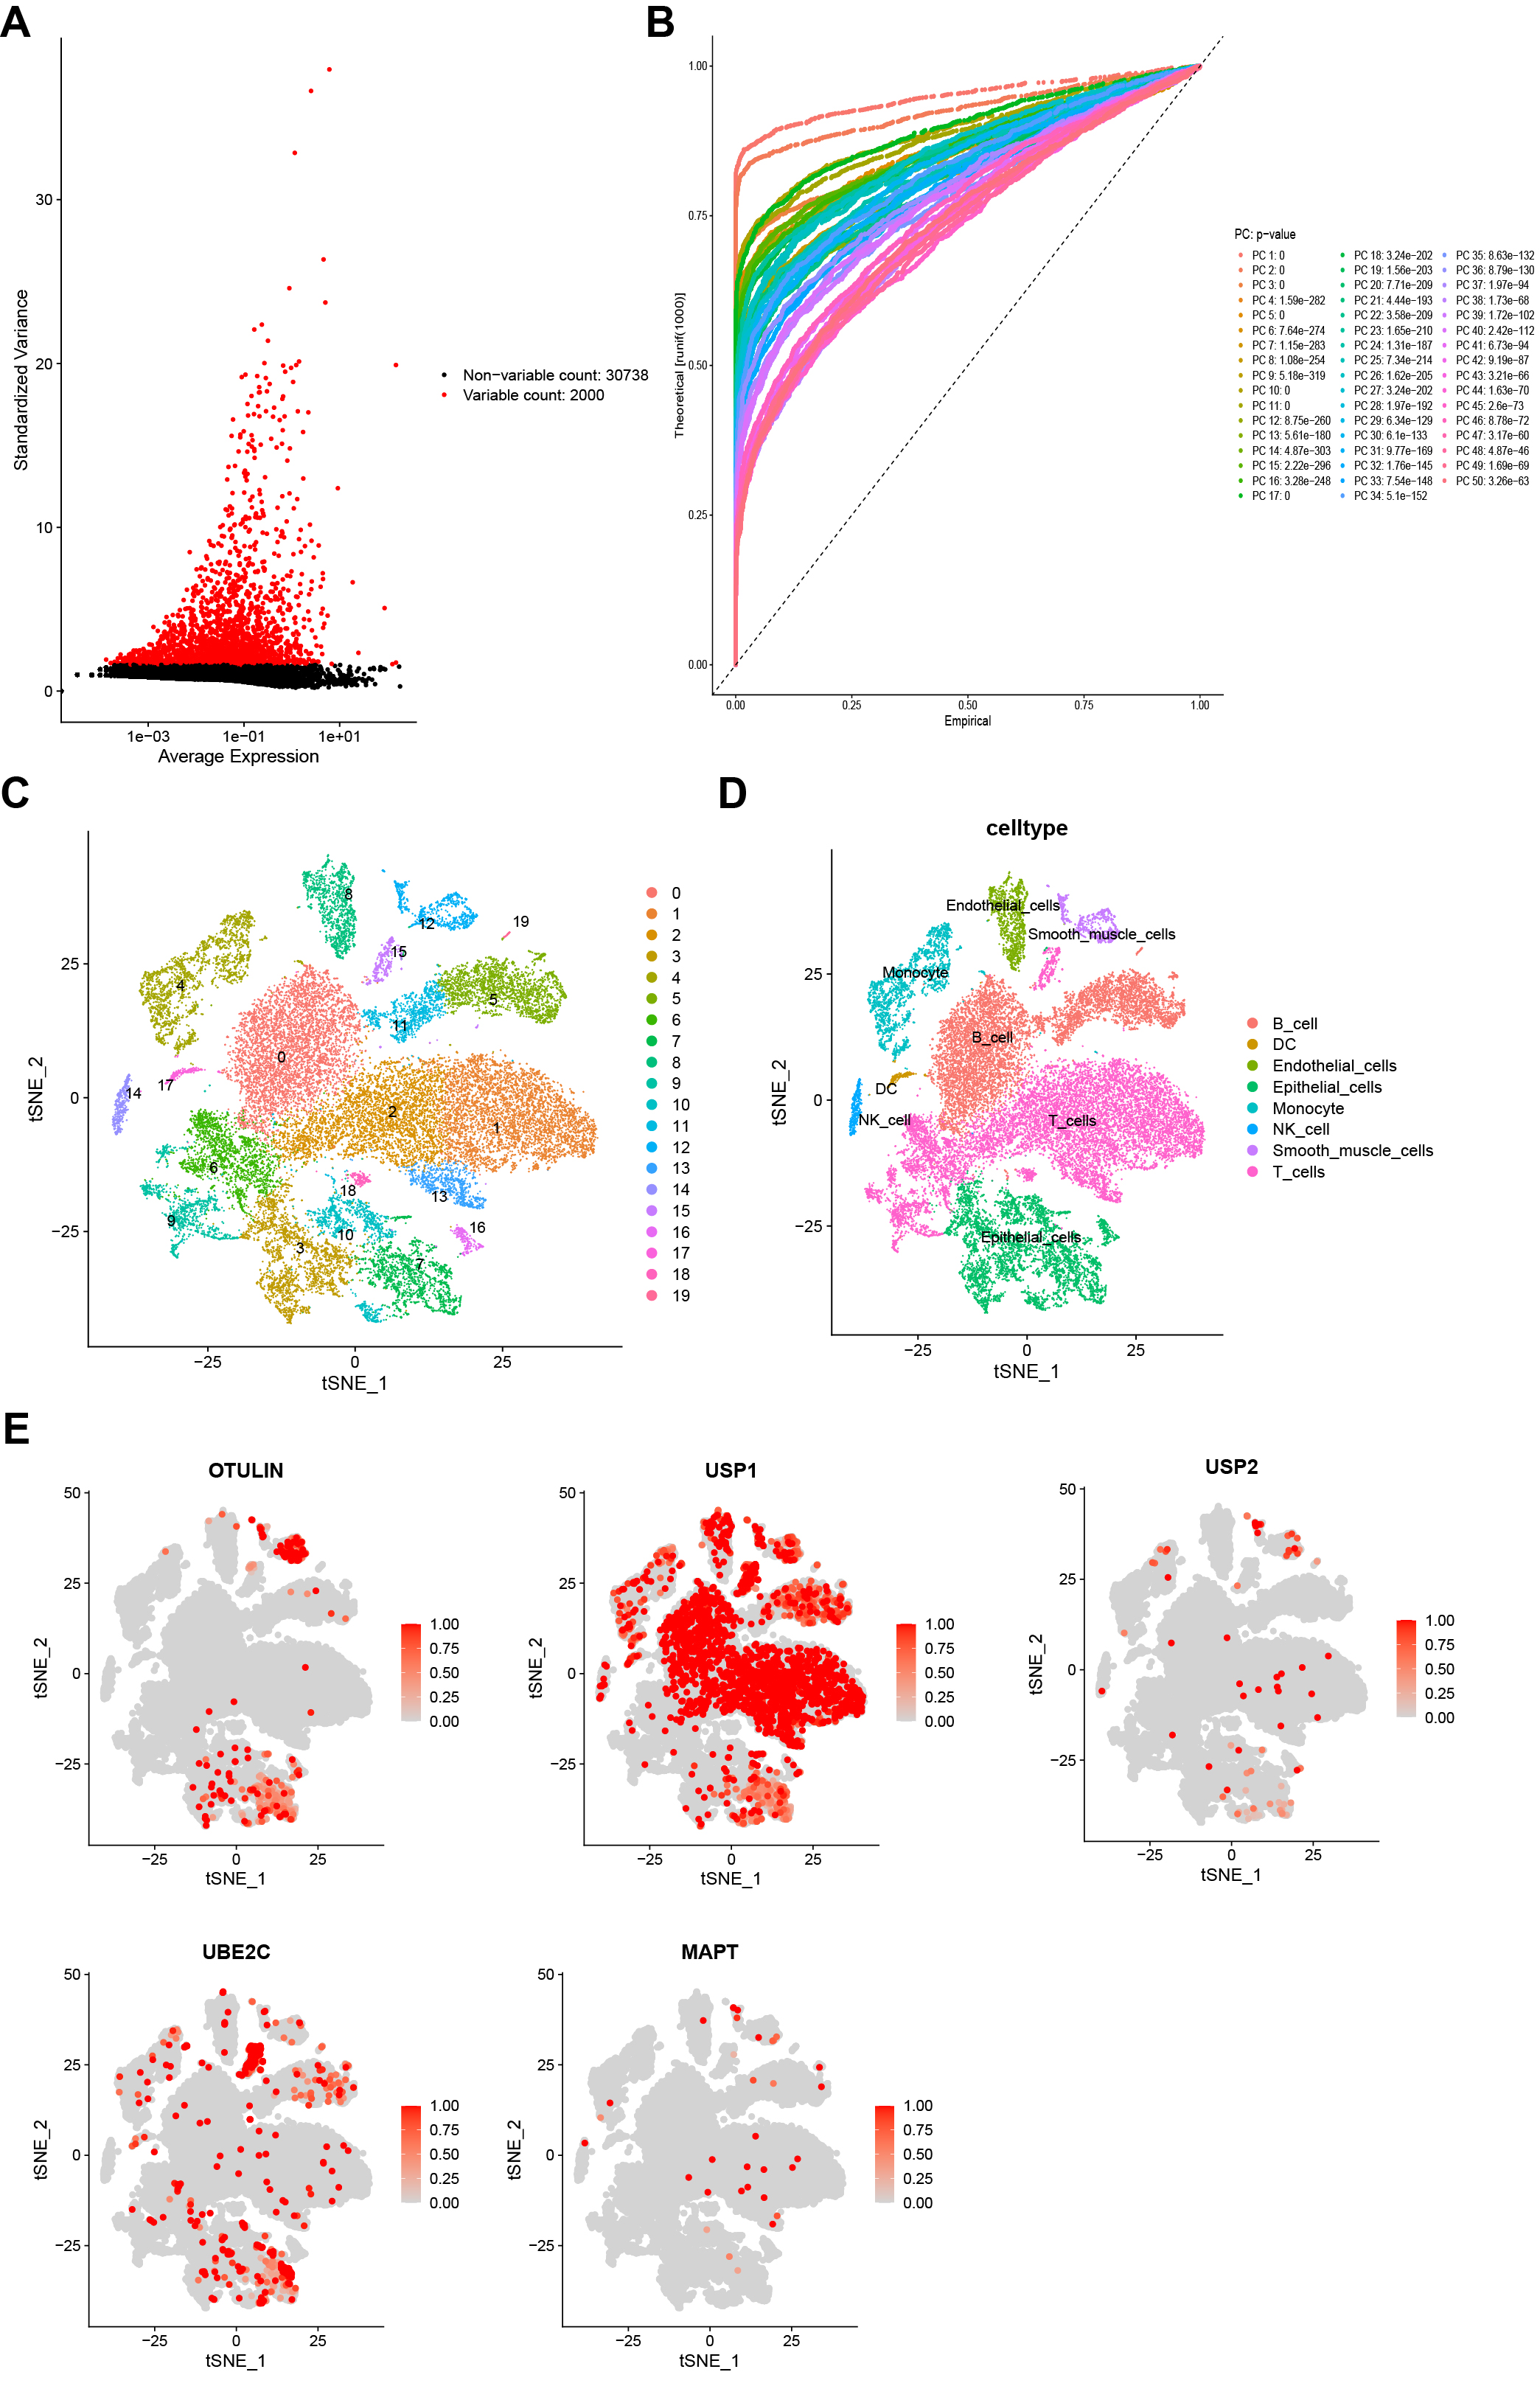 Fig. 8.
Single-cell sequencing analysis. (A) A total of the top 1500 variable genes with red labels. (B) Data integration and dimensionality reduction. (C) All cells were clustered into 20 subclusters. (D) Classification of all cells into B cells, dendritic cells (DCs), endothelial cells, epithelial cells, monocytes, NK cells, smooth muscle cells, and T cells. (E) Cellular location of five URGs (OTULIN, USP1, USP2, UBE2C, and MAPT).
We selected OTULIN to verify our proposed model by various in vitro experiments. Fig. 9A shows that OTULIN, USP1, and UBE2C were highly expressed in GC cell lines, whereas USP2 and MAPT were highly expressed in the GES-1 cell line. A PCR assay was carried out to confirm the transfection efficiency of siRNA-OTULIN and OTULIN (Fig. 9B). CTG assay, colony formation, and EdU assay were applied to evaluate the cell viability in GC cells. Cell proliferation was significantly inhibited following the silencing of OTULIN in SGC7901 cells (Fig. 9C–E).
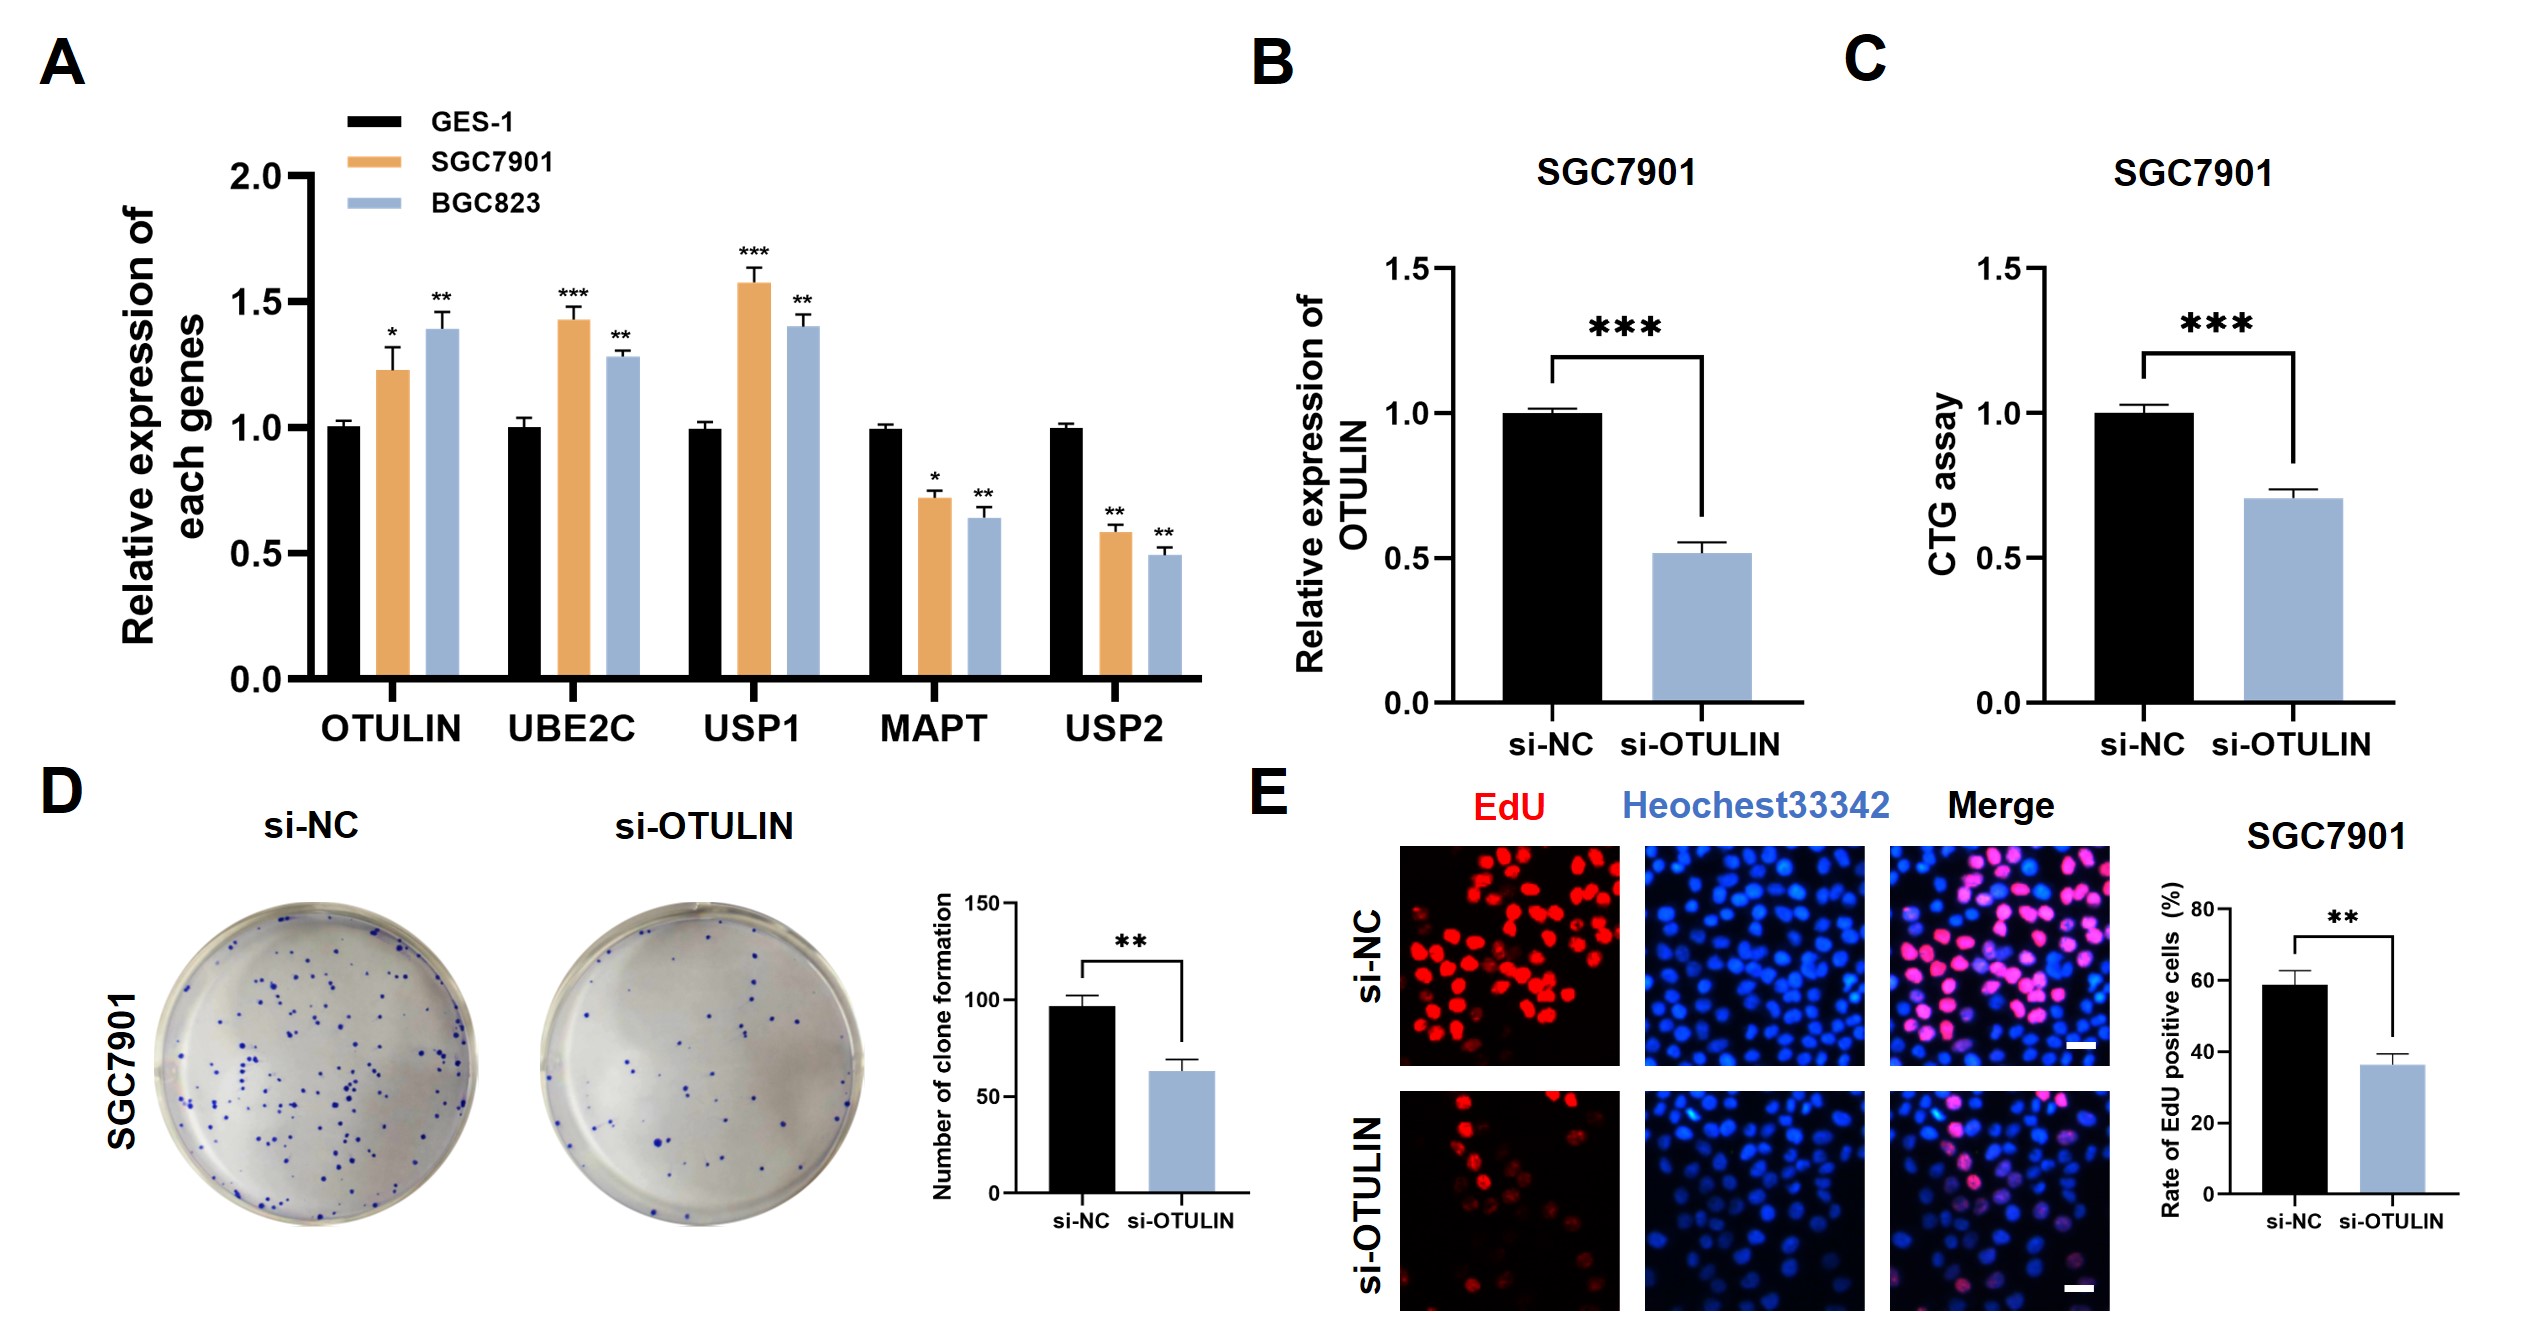 Fig. 9.
Identification of OUTLIN as a novel oncogenic player in GC. (A)
Expression patterns of five model genes in different cell lines were detected by
Real-Time Quantitative Reverse Transcription PCR (qRT-PCR) assay. (B) PCR assay indicates the favorable transfection efficiency in
GC cell lines. Cell proliferation in different treatment groups was evaluated by
(C) CTG assay, (D) colony formation, and (E) EdU assay. Scale bar = 200 µm.
*p
Ubiquitination is a common post-translational protein modification that serves an important role in tumor development and progression. Ubiquitination is a double-edged sword in regulating cancer progression, as the substrate protein might be either an oncogene or a tumor suppressor [17]. For instance, RNF139 was reported to induce cell apoptosis and block glioma cell survival by targeting the AKT pathway [18]. However, OTUD6A, as a tumor driver, could boost cell growth and progression of prostate cancer by stabilizing c-Myc [19]. The dual role of different ubiquitination members in tumors deserves a comprehensive analysis and exploration in GC. Multigene-based signatures have gained more attention due to their robust predictive accuracy over traditional clinical scores [20, 21]. Nevertheless, biomarkers with prognosis values based on URGs expression data were not well studied in GC.
Our project aimed to develop a prognostic model based on URGs. We first screen out eight prognostic URGs and further establish a risk model containing five URGs by step Cox analysis. Survival curves illustrated that GC cases in the high-UAS group presented a dismal survival outcome compared to the low-UAS group. The AUC value of ROC curves verified the favorable predictive power of the UAS. Moreover, the results were further verified in the verification cohort. Subsequently, our proposed UAS was demonstrated to be an independent prognostic factor associated with unfavorable OS in different GC subgroups.
Our constructed model was composed of five URGs (UBE2C, MAPT,
OTULIN, USP1, and USP2), all of which have previously
been shown to be associated with tumor survival and progression [22, 23]. UBE2C,
a key component of the ubiquitin-proteasome system, was demonstrated to promote
ubiquitination and degrade cyclins. Together with E3 ligases, it acts in the
anaphase-promoting complex (APC/C) to regulate the spindle assembly test site
[24]. As revealed by Zhang et al. [25], UBE2C was highly expressed in GC
specimens at both mRNA and protein levels. Meanwhile, UBE2C expression was
observed to be associated with lymphatic metastasis and TNM stage. Moreover,
Cox-relevant analyses indicated that UBE2C presented prognostic independence in
GC [25]. In breast cancer (BC), silencing UBE2C could significantly inhibit cell
survival by targeting the mTOR signaling pathway, suggesting UBE2C is expected to
be a potential target for the management of BC [26]. OTULIN, a linear
deubiquitinating enzyme, plays a central part in pathophysiological effects,
including cancer, cell death, vascular regeneration, and neuroinflammation [27].
Wang et al. [28] demonstrated that OTULIN could facilitate cell
migration and invasion and confer drug resistance to BC by triggering
Wnt/
Immune checkpoints (ICPs) are a group of immunosuppressive molecules expressed on immunocytes that play an important role in protecting against autoimmune effects through modulation of immune activation [34]. ICP molecule overexpression contributes to the suppression of immune function and thus encourages the immune escape of tumors. Our data revealed that the majority of ICPs were upregulated in the high-UAS group, which may be an important contributor to their poor prognosis.
In addition to expressing specific antigens that the immune system can recognize, tumor cells also express a variety of immunosuppressive ligands that can bind to inhibitory receptors expressed by T cells. BTLA, like other immune checkpoint molecules (e.g., PD1, CTLA-4, Tim3), inhibits T-cell activity upon binding to the corresponding ligands, leading to tumor immune escape [35]. According to the available experimental analysis, anti-PD1/PD-L1 tumor immunotherapy is effective in specific patients only, with an overall response rate of about 30%. In contrast, the combination of anti-BTLA immunotherapy can improve tumor control and promote cytokine secretion in the body. This may indicate that BTLA, as a suppressive immune checkpoint, is also involved in tumor immune escape [36, 37]. NRP1 operates in various tumor cell functions and microenvironments and is an important promoter of tumor development. NRP1, as a member of the NRP family, is mainly expressed in vascular endothelial tissue and interacts with vascular endothelial growth factor (VEGF) to regulate tumor cell invasion, proliferation, promote tumor cell inflammatory response, immune response, and stem cell proliferation processes [38]. CD200, also known as OX2, is a transmembrane glycoprotein with two extracellular immunoglobulin structural domains and an intracellular structure consisting of an unknown signaling domain of 19 amino acids. In addition to familiar hematologic tumors, it was upregulated in multiple solid tumors, including solid tumors such as ovarian cancer, kidney cancer, head and neck tumors, and other solid tumors. CD200R, the homologous receptor for CD200, is also a member of IgSF. Inhibiting the binding of CD200, a potential immune checkpoint molecule, to CD200R could theoretically lead to tumor immunotherapy [39].
To further exploit the predictive power of the UAS in clinical potency, we further examined the relationship between scores and chemoradiotherapy signature (AKR1C1, EGFR, MET, FLT3, KIT, SOX2, EZH2, and TBX5). These genes inhibit the radiotherapy sensitivity of tumor cells by promoting DNA damage repairing and restraining cell death [40, 41, 42]. Upregulation of AKR1C1 can diminish the production of reactive oxygen species and remove free radicals, resulting in reduced DNA damage, which confer chemotherapy resistance to cancer cells [42]. EGFR has been reported to reduce cellular sensitivity to radiotherapy in various solid tumors, thereby promoting tumor recurrence and metastasis [43].
OUTLIN has not been previously reported in GC; therefore, we chose it for experimental validation. The results from a set of functional experiments indicated that silencing OUTLIN could inhibit GC cell growth and cell viability, suggesting OUTLIN may be a potential target for GC treatment.
There were several limitations within our study. First, our proposed UAS was generated using public databases; therefore, additional large-scale prospective and multicenter clinical studies are necessary to verify our data. Furthermore, we only validated OTULIN in the UAS using in vitro experiments. Further in vivo or molecular experiments are required to confirm the role of UAS in the future.
In this research, a prognostic signature based on five ubiquitination-associated genes was generated for the first time; the signature could serve as an independent prognostic factor for GC cases and mirror the immune landscape of GC. Our proposed signature can adequately forecast survival outcomes and evaluate the immunotherapy response of GC cases. Our data provide a valuable reference for GC detection and treatment.
The public datasets to support the results of this subject can be gained from TCGA (https://portal.gdc.cancer.gov/) and GEO (https://www.ncbi.nlm.nih.gov/geo/).
ZH and CP designed the study. ZZ collected the data. YT and HH analyzed the datasets and interpreted the results. ZH and CP performed experiments. FQ and HQ were responsible for conceptualization, synthesizing findings and drawing conclusions. All authors contributed to editorial changes in the manuscript. All authors read and approved the final manuscript. All authors have participated sufficiently in the work and agreed to be accountable for all aspects of the work.
Not applicable.
Not applicable.
This research received no external funding.
The authors declare no conflict of interest.
References
Publisher’s Note: IMR Press stays neutral with regard to jurisdictional claims in published maps and institutional affiliations.