
- Academic Editor
†These authors contributed equally.
Background: Pyroptosis-related genes (PRG) are closely associated with the progression and metastasis of hepatocellular carcinoma (HCC). The predictive power of PRGs could be used to assess the clinical outcomes of HCC. Methods: The Cancer Genome Atlas (TCGA) RNA-seq data and clinical information from patients with liver hepatocellular carcinoma (LIHC) were used to identify PRG with differentially expressed between HCC and normal samples. Univariate Cox regression, least absolute shrinkage and selection operator (LASSO) Cox method, and multivariate Cox regression analysis were used to develop a prognostic model that included three PRGs. Gene set enrichment analysis (GSEA) was performed to identify differential immune cells and their associated pathways. The expression of Gasdermin C (GSDMC) in the HCC samples was detected by western blotting, and the function of GSDMC in HCC proliferation and metastasis was detected by the Cell Counting Kit-8 (CCK-8), colony formation, cell invasion, and wound healing assays. Results: Of 52 PRGs, GSDMC, Bcl-2 homologusantagonist/ killer 1 (BAK1), and NOD-like receptor thermal protein domain associated protein 6 (NLRP6) were selected to establish a prognostic model. The model successfully differentiated HCC patients with varied survival in the TCGA training and test cohorts, as well as the International Cancer Genome Consortium (ICGC) validation cohorts. The risk score was proven to be an independent prognostic factor. In addition, we also reported a marked upregulation of GSDMC in HCC tissues, which could be induced by CD274 (PD-L1). Overexpression of GSDMC contributes to HCC cells invasion, proliferation, and migration. Conclusions: The three PRGs signatures containing GSDMC independently predicted HCC prognosis. As a new driver molecule, GSDMC could play a tumor-promoting role by facilitating HCC growth and metastasis.
Hepatocellular carcinoma (HCC) has a poor prognosis throughout world [1]. Patients with Hepatocellular carcinoma (HCC) often lose the opportunity for surgery because of the advanced-stage disease diagnosis. Even in patients undergoing radical surgery, metastasis and relapse still pose a threat to survival. Therefore, useful biomarkers are indispensable for predicting the prognosis and guiding therapy [2].
Immune checkpoint inhibitors (ICI) offers a new perspective for the treatment of HCC. Since HCC cells can evade immune surveillance and induce immune tolerance to facilitate the development of cancer, immunotherapy such as ICI can reprogram the immunosuppressive tumor microenvironment (TME) to enhance anti-tumor immunity [3]. The response to immunotherapy is highly variable among individuals. Therefore, there is an urgent need for new combination therapeutic strategies to activate tumor immunity. Pyroptosis has gradually entered the public eye as one of many targets.
Pyroptosis was initially found to participate in the defense
against infection. It is a unique form of cytolytic cell death that is triggered
by the activation of inflammatory caspases. The GSDM family consists of Gasdermin
A-E (GSDMA-GSDME), and Pejvakin (PJVK) in humans
[4, 5, 6, 7, 8]. All GSDMs contain two arrangements: a N-terminal domain and a C-terminal
domain. The GSDM full-length protein does not generally induce cell death because
the existing inhibitory C-terminal domain is connected to the N-terminal, which
protects the N-terminal domain from being overactivated. GSDM can be cleaved by
activated caspases to release the GSDM-N fragment that associates with the plasma
membrane. The cells then swell and form vesicles originating from the plasma
membrane [9]. Consequently, cytolysis leads to the release of cellular contents,
triggering strong inflammation [10]. The hallmark of pyroptosis, distinct from
apoptosis, is the activation and secretion of a variety of signaling molecules
and cytokines associated with danger, leading to robust inflammation and immune
system remodeling [10, 11, 12, 13, 14]. Given its proinflammatory effect, it is reasonable
that pyroptosis can modulate the TME, thereby contributing to tumor growth and
progression. Numerous studies have revealed that key components of pyroptosis,
including inflammatory vesicles, gasdermin proteins, and cytokines, are involved
in tumorigenesis, invasion, and metastasis. Zhang et al. [15] revealed
that GSDME may serve as a tumor suppressor through activation of
pyroptosis. Enhancing the function and increasing the frequency of
tumor-infiltrating NK and CD8
This study systematically analyzed 42 PRGs with differential expression between HCC and normal samples. A PRG-related model was established based on mRNA expression and clinical information obtained from patients with HCC. We validated the model in the The Cancer Genome Atlas (TCGA) and International Cancer Genome Consortium (ICGC) test cohorts. The risk score in the model was an independent prognostic factor in univariate and multivariate Cox regression analyses. Kaplan-Meier survival curves revealed a notably different Overall Survival (OS) between the two groups. In addition, a new driver molecule GSDMC was proposed for the first time, which could be a promising target in HCC therapy.
The Cancer Genome Atlas (TCGA) website (https://portal.gdc.cancer.gov/repository) was used to gather RNA sequencing data and associated clinical information for 374 patients with HCC and 50 normal samples. We excluded 4 patients who did not have complete follow-up information. In addition, transcriptomic counts and FPKM data with clinical features from 231 patients with HCC were obtained from the ICGC database (https://dcc.icgc.org/projects/LIRI-JP). Standardization for gene expression was performed using the “limma” tool.
Mutation data corresponding to 370 patients with HCC were from TCGA, and four incomplete information patients were excluded. The remaining patients were divided into two risk groups and the mutational spectrum was analyzed using the MAftools package, with measurement of tumor mutational burden (TMB) [17].
Data for CNV corresponding to 370 HCC patients also were from TCGA. The lolipop plot was generated to show the gain and loss function of genes in the HCC database.
The STRING database (http://string-db.org) provides the integration of protein interactions, including direct and indirect associations. The STRING database was used to show the correlation between the PRGs.
There were 52 PRGs identified in the earlier literature. 42 PRGs showed differential expression between tumors and normal tissues. The “limma” R package was used to analyze the differentially expressed genes (DEGs) in the TCGA cohort and a p value of 0.05 was used to construct a heatmap or volcano plot paragraph. In addition, a network of protein-protein interactions was also created by the tool GENEMANIA (http://genemania.org/) for the PRGs.
TCGA-LIHC were divided into two groups of the 42 DEGs by using the “ConsensusClusterPlus” R program [18].
A Univariate Cox analysis was performed to eliminate nine survival related PRGs
for further investigation. The prognostic model was constructed using the
LASSO-Cox method and multivariate Cox analysis to reduce overfitting. Three genes
were ultimately retained with their coefficients, and the
penalty parameter was calculated using the minimum criteria. The Equation 1: risk
score
The prognostic model was based on dividing patients with HCC into two risk clusters according to their median risk score. We then used the “limma” and “scatterplot3d” packages in R to generate a principal component analysis (PCA) for both risk groups on the basis of gene expressions. The R package “survminer” was used for survival analysis comparing the prognosis between the two risk groups, and the R packages “survival” and “timeROC” were used to construct the ROC curve. A signature of three genes was constructed using the LASSO-Cox method and the multivariate Cox regression analysis, and then to assess efficacy in the patients from the TCGA test or ICGC external validation cohort. The pyroptosis-related gene (PRG) mRNA level and the risk score was normalized using the “scale” function. Using the risk score, patients in the TCGA test or ICGC cohorts could be divided into two risk groups.
The GSEA 4.0.1 (Broad institute, Boston, MA, USA) was utilized to carry out GSEA analysis between two risk groups to determine the differential and enrichment studies performed in the “clusterProfiler” R package [19].
To examine the correlation between immune cell infiltration and PRG scores, 28 infiltrating immune cells in each case of HCC were calculated using the ssGSEA algorithm [20]. In addition, the “GSVA” R package was also used to perform a ssGSEA using gene-specific markers from the TCGA cohort in order to determine immune function between the PRG subsets. The Spearman correlation test was conducted to determine whether the PRG score was significantly correlated with immunosuppressive molecules or immune scores.
The tissue samples were approved by the Zhongshan Hospital. The patients signed an informed consent form before undergoing surgical resection. Protein was extracted from cancer and adjacent tissues from 12 patients with HCC for validation by western blotting.
Huh7 and Hep3B cells were cultured in complete DMEM medium (D5796, sigma)
containing 10% FBS (16140071, Gibco) and 1% penicillin/streptomycin (3810-74,
Sigma) and used in the present study. IFN-
Cells were lysed for extract total protein extraction and pelleted at 95 °C for 8 min. Electrophoretic separation was performed by 10% sodium dodecyl sulfate - polyacrylamide gel electrophoresis (SDS-PAGE) at a 100 V constant voltage, and at 330 mA, protein was transferred to polyvinylidene difluoride (PVDF) membrane and then incubated with 1:2000 diluted GSDMC (ab225635, Abcam, Cambridge, UK), PD-L1 (CST, 13684S, Boston, MA, USA), caspase-8 (ab119809, Abcam, Cambridge, UK) and Actin (AA128, Beyotime, Shanghai, China) antibodies for 12 h at 4 °C. The PVDF membrane was incubated with a 1:10000 diluted secondary antibody. Finally, chemiluminescence was performed.
The cDNA or shRNA (Genepharma, Shanghai, China) targeting CD274 or GSDMC was recombined into lentiviral vectors to overexpress or knockdown GSDMC. The recombinant plasmid was transfected into 293T cells, and the mature infectious lentivirus was collected after three days. Stable CD274 or GSDMC-overexpressing Hep3B and CD274 or GSDMC-knockdown Huh7 cell lines were constructed and verified by western blotting.
Cells were seeded in 96-well plates (10
The 6-well plates were used to seed the HCC cells (800 cells/well), and then were placed at 37 °C incubator for 2 weeks. After the culture medium was discarded, the cells were fixed with 4% paraformaldehyde, then the cells were stained using crystal violet (C0121, Beyotime, Shanghai, China), washed with phosphate buffered saline (PBS) (P1020, Solarbio, Beijing, China), and dried.
After 10 h, HCC cells were seeded in 6-well plates to form a dense monolayer. Lines were drawn with the tip of a pipette size 20 µL pipette perpendicular to the cell layer to form straight cell wounds. The width of the cell wound width was then washed with PBS and recorded under a microscope (Olympus, Japan) by taking photograph. Plates were placed at 37 °C incubator for 48 h, then the wound width was recorded again.
About 100 µL BD Matrigel mixture (diluted 1:5 with DMEM) was pre-coated in
a chamber (3513, Corning, Corning, NY, USA) at 37 °C incubator for
5 h. DMEM without serum was used to dilute the HCC cells and 4
The DEGs between HCC and normal liver tissue were analyzed by a one-way ANOVA.
The Mann-Whitney test was used to calculate the ssGSEA scores using the adjusted
p-value from the BH method. The whole statistical investigations were
performed using R 4.0.1 (Auckland, New Zealand). A p
Fig. 1 shows the detailed protocol. A total of 52 PRGs selected from the KEGG database were included in this study. To find gene alterations of PRGs in patients with HCC, we downloaded data from the TCGA-LIHC databases. At the genetic level, 157 of the 364 samples (43.13%) showed mutations in regulatory genes linked to pyroptosis. Of these, TP53 had the highest mutation frequency (30%) followed by NLRP2 (2%). No mutations were found in other PRGs such as BAK1, CASP1, CASP5, CHMP2A, CHMP3, CHMP4A, CHMP4B, CYCS, GSDME, IL1A, CASP6, CASP9, GPX4, GSDMA, PJVK as well as SCAF11 (Fig. 2a). Our results indicated that most PRGs, except TP53, have no significant changes in gene variation.
 Fig. 1.
Flow chart of the whole study. LIHC, liver hepatocellular carcinoma; TCGA, The Cancer Genome Atlas; ICGC, International Cancer Genome Consortium; GSEA, gene set enrichment analysis; GSDMC, Gasdermin C.
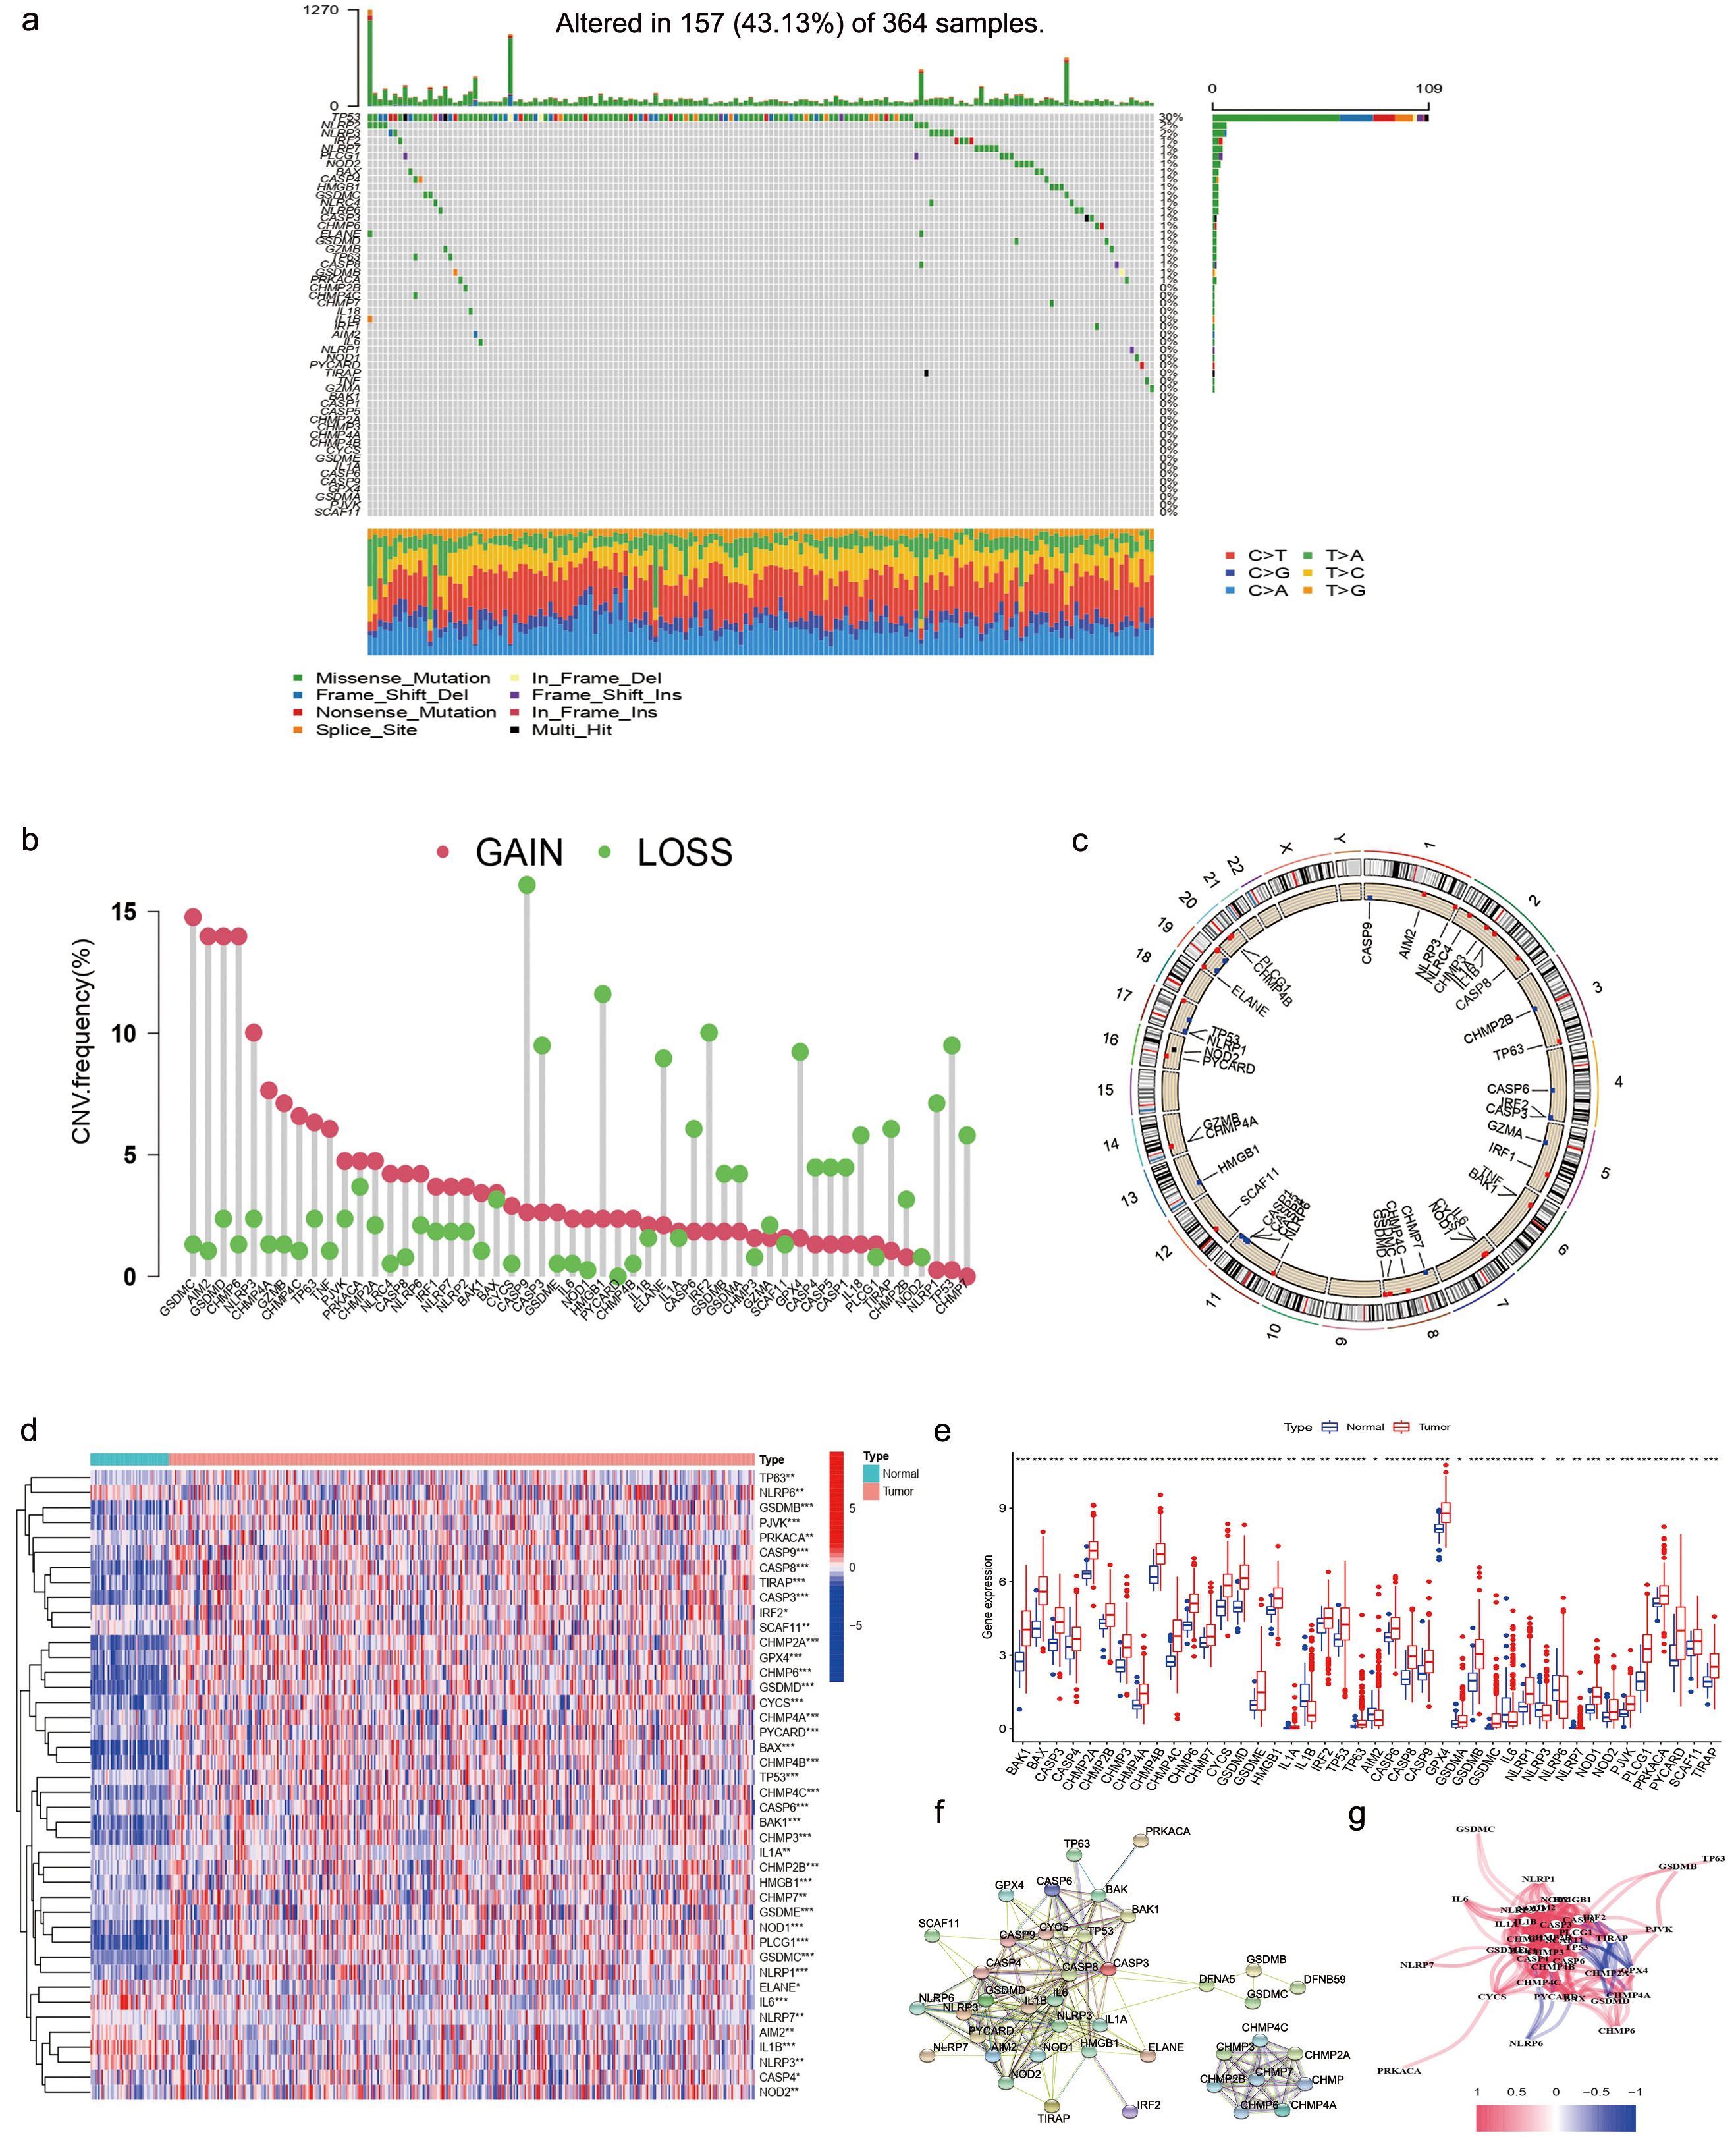 Fig. 2.
Pyroptosis-related genes (PRGs) Screening of patients with hepatocellular carcinoma (HCC). (a) The mutation frequency of PRGs in 370 HCC patients. Each column represented a patient. The proportion of each variant type was showed by right-hand bar plots, while stacked bar plots show the conversion fractions in each sample. (b) TCGA-LIHC cohort’s CNV variation frequency for pyroptosis-related genes. A column’s height represents the frequency of alteration. Green dot: deletion frequency; red dot: amplification frequency. (c) Based on the LIHC cohort, the Copy Number Variation (CNV) alteration location of PRGs is shown. (d) The differential expression of PRGs were showed by heatmap. (e) The differential PRGs expressed showed by box plot. (f) Protein-protein interaction network. (g) Gene association network (Blueline: negative correlations; Redline: positive correlations. The depth of color reflects the relevance’s strength).
We also found copy number variation (CNV) alteration in 7 of the 52 PRGs, which showed that CASP9, HMGB1, and TP53 had a significant frequency of CNV deletions (Fig. 2b), whereas GSDMC, AIM2, GSDMD, and CHMP6 had a significant frequency of CNV amplifications (Fig. 2b). Fig. 2c showed the CNV alterations location on the chromosomes.
The expression levels of 52 PRGs were compared based on 50 normal samples and
374 HCC samples in TCGA data. Forty-two DEGs were identified (all p
| Gene | Con mean | Treat mean | Log FC | p-value |
| BAK1 | 2.43296064 | 7.45717126 | 1.61591549 | 1.55 |
| BAX | 7.3216181 | 21.1009946 | 1.52707658 | 7.52 |
| CASP3 | 4.1860116 | 8.44081184 | 1.01180546 | 1.98 |
| CASP4 | 4.20085128 | 5.10681863 | 0.28174311 | 0.03286059 |
| CHMP2A | 33.2191982 | 65.2138897 | 0.97316202 | 9.02 |
| CHMP2B | 7.37121326 | 9.87610132 | 0.42203954 | 1.91 |
| CHMP3 | 2.05397496 | 4.19803902 | 1.03129698 | 4.04 |
| CHMP4A | 0.44395801 | 0.76114955 | 0.77775671 | 4.87 |
| CHMP4B | 32.0528566 | 59.5627723 | 0.89395797 | 6.59 |
| CHMP4C | 2.54545884 | 6.03191047 | 1.24468928 | 2.37 |
| CHMP6 | 7.38079992 | 13.8223234 | 0.90515105 | 7.64 |
| CHMP7 | 4.30753654 | 5.45855639 | 0.34165642 | 0.00610607 |
| CYCS | 12.623064 | 25.3375992 | 1.0052177 | 1.71 |
| ELANE | 0.08227496 | 0.08760968 | 0.09063689 | 0.03218088 |
| GSDMD | 12.9530553 | 31.0751544 | 1.26246913 | 2.96 |
| GSDME | 0.42152436 | 1.12730849 | 1.41919444 | 0.00054835 |
| HMGB1 | 11.3255013 | 15.9875838 | 0.49737702 | 2.20 |
| IL1A | 0.01072757 | 0.02485794 | 1.21238333 | 0.00735294 |
| IL1B | 0.87439016 | 0.41835073 | –1.0635642 | 2.07 |
| IRF2 | 7.4236917 | 8.64728488 | 0.22011042 | 0.02426076 |
| TP53 | 4.95454942 | 8.22316697 | 0.73094026 | 5.80 |
| TP63 | 0.03249136 | 0.12194168 | 1.90806327 | 0.00237048 |
| AIM2 | 0.25001586 | 0.37839679 | 0.59788023 | 0.00972577 |
| CASP6 | 5.03020808 | 6.86427733 | 0.44848976 | 3.49 |
| CASP8 | 1.37688528 | 2.83142406 | 1.04011948 | 1.52 |
| CASP9 | 1.78856694 | 2.52060221 | 0.49496435 | 3.54 |
| GPX4 | 118.53575 | 188.693886 | 0.67072544 | 1.28 |
| GSDMB | 1.34402605 | 3.63674743 | 1.43608764 | 1.66 |
| GSDMC | 0.00830341 | 0.2340813 | 4.81716107 | 8.32 |
| IL6 | 0.86703163 | 0.3207223 | –1.43476 | 3.10 |
| NLRP1 | 0.40595995 | 1.07178314 | 1.40060373 | 1.31 |
| NLRP3 | 0.35190932 | 0.27927313 | –0.333527 | 0.00231316 |
| NLRP6 | 1.07212382 | 1.19241641 | 0.15341661 | 0.00113618 |
| NLRP7 | 0.01351051 | 0.0204933 | 0.60106999 | 0.00202789 |
| NOD1 | 0.3254706 | 0.66369271 | 1.02798821 | 4.82 |
| NOD2 | 0.19403987 | 0.34029517 | 0.81043355 | 0.0077925 |
| PJVK | 0.24180884 | 0.4645166 | 0.94186313 | 1.21 |
| PLCG1 | 1.26078037 | 3.99551069 | 1.66406294 | 1.77 |
| PRKACA | 14.1108017 | 18.2172065 | 0.36850179 | 0.00340267 |
| PYCARD | 3.24194386 | 9.79743175 | 1.59554451 | 7.65 |
| SCAF11 | 3.499931 | 4.37598781 | 0.32228224 | 0.00655423 |
We then utilized the STRING platform to analyze the network of protein-protein interactions of 52 PRGs’ regulators (Fig. 2f). The PRGs correlation network is shown in Fig. 2g (blue: negative correlations; red: positive correlations).
Our next step was to use consensus cluster analysis to explore the association
of all 370 HCC subtypes in the TCGA cohort with these prognostic genes
(Supplementary Fig. 1a). When κ = 2, the intragroup correlation was the
smallest (Supplementary Fig. 1b,c), indicating that it was appropriate
to split 370 patients into two clusters on the basis of 42 DEGs obtained
previously (Cluster 1 = 160, Cluster 2 = 210). Then we found that patients in
cluster 1 survived for a shorter period than those in cluster 2 (p
Through univariate Cox regression analysis, we identified nine genes
(BAK1, BAX, CHMP4B, CASP8, GSDMC,
NLRP6, NOD1, NOD2, and PLCG1). The curves in
Fig. 3b represent the trajectories of each independent variable coefficient. The
two dashed lines in Fig. 3c indicate two special
| ID | Coef | HR | HR.95L | HR.95H | p value |
| BAK1 | 0.3112626 | 1.36514766 | 0.95773656 | 1.94586717 | 0.08521836 |
| GSDMC | 1.14322035 | 3.13685387 | 1.18639121 | 8.29393552 | 0.02119485 |
| NLRP6 | –0.4026137 | 0.66857032 | 0.41686883 | 1.07224681 | 0.09481449 |
HR, Hazard Ratio
 Fig. 3.
TCGA-LIHC risk signature construction. (a) Univariate analysis
showed nine DEGs (p
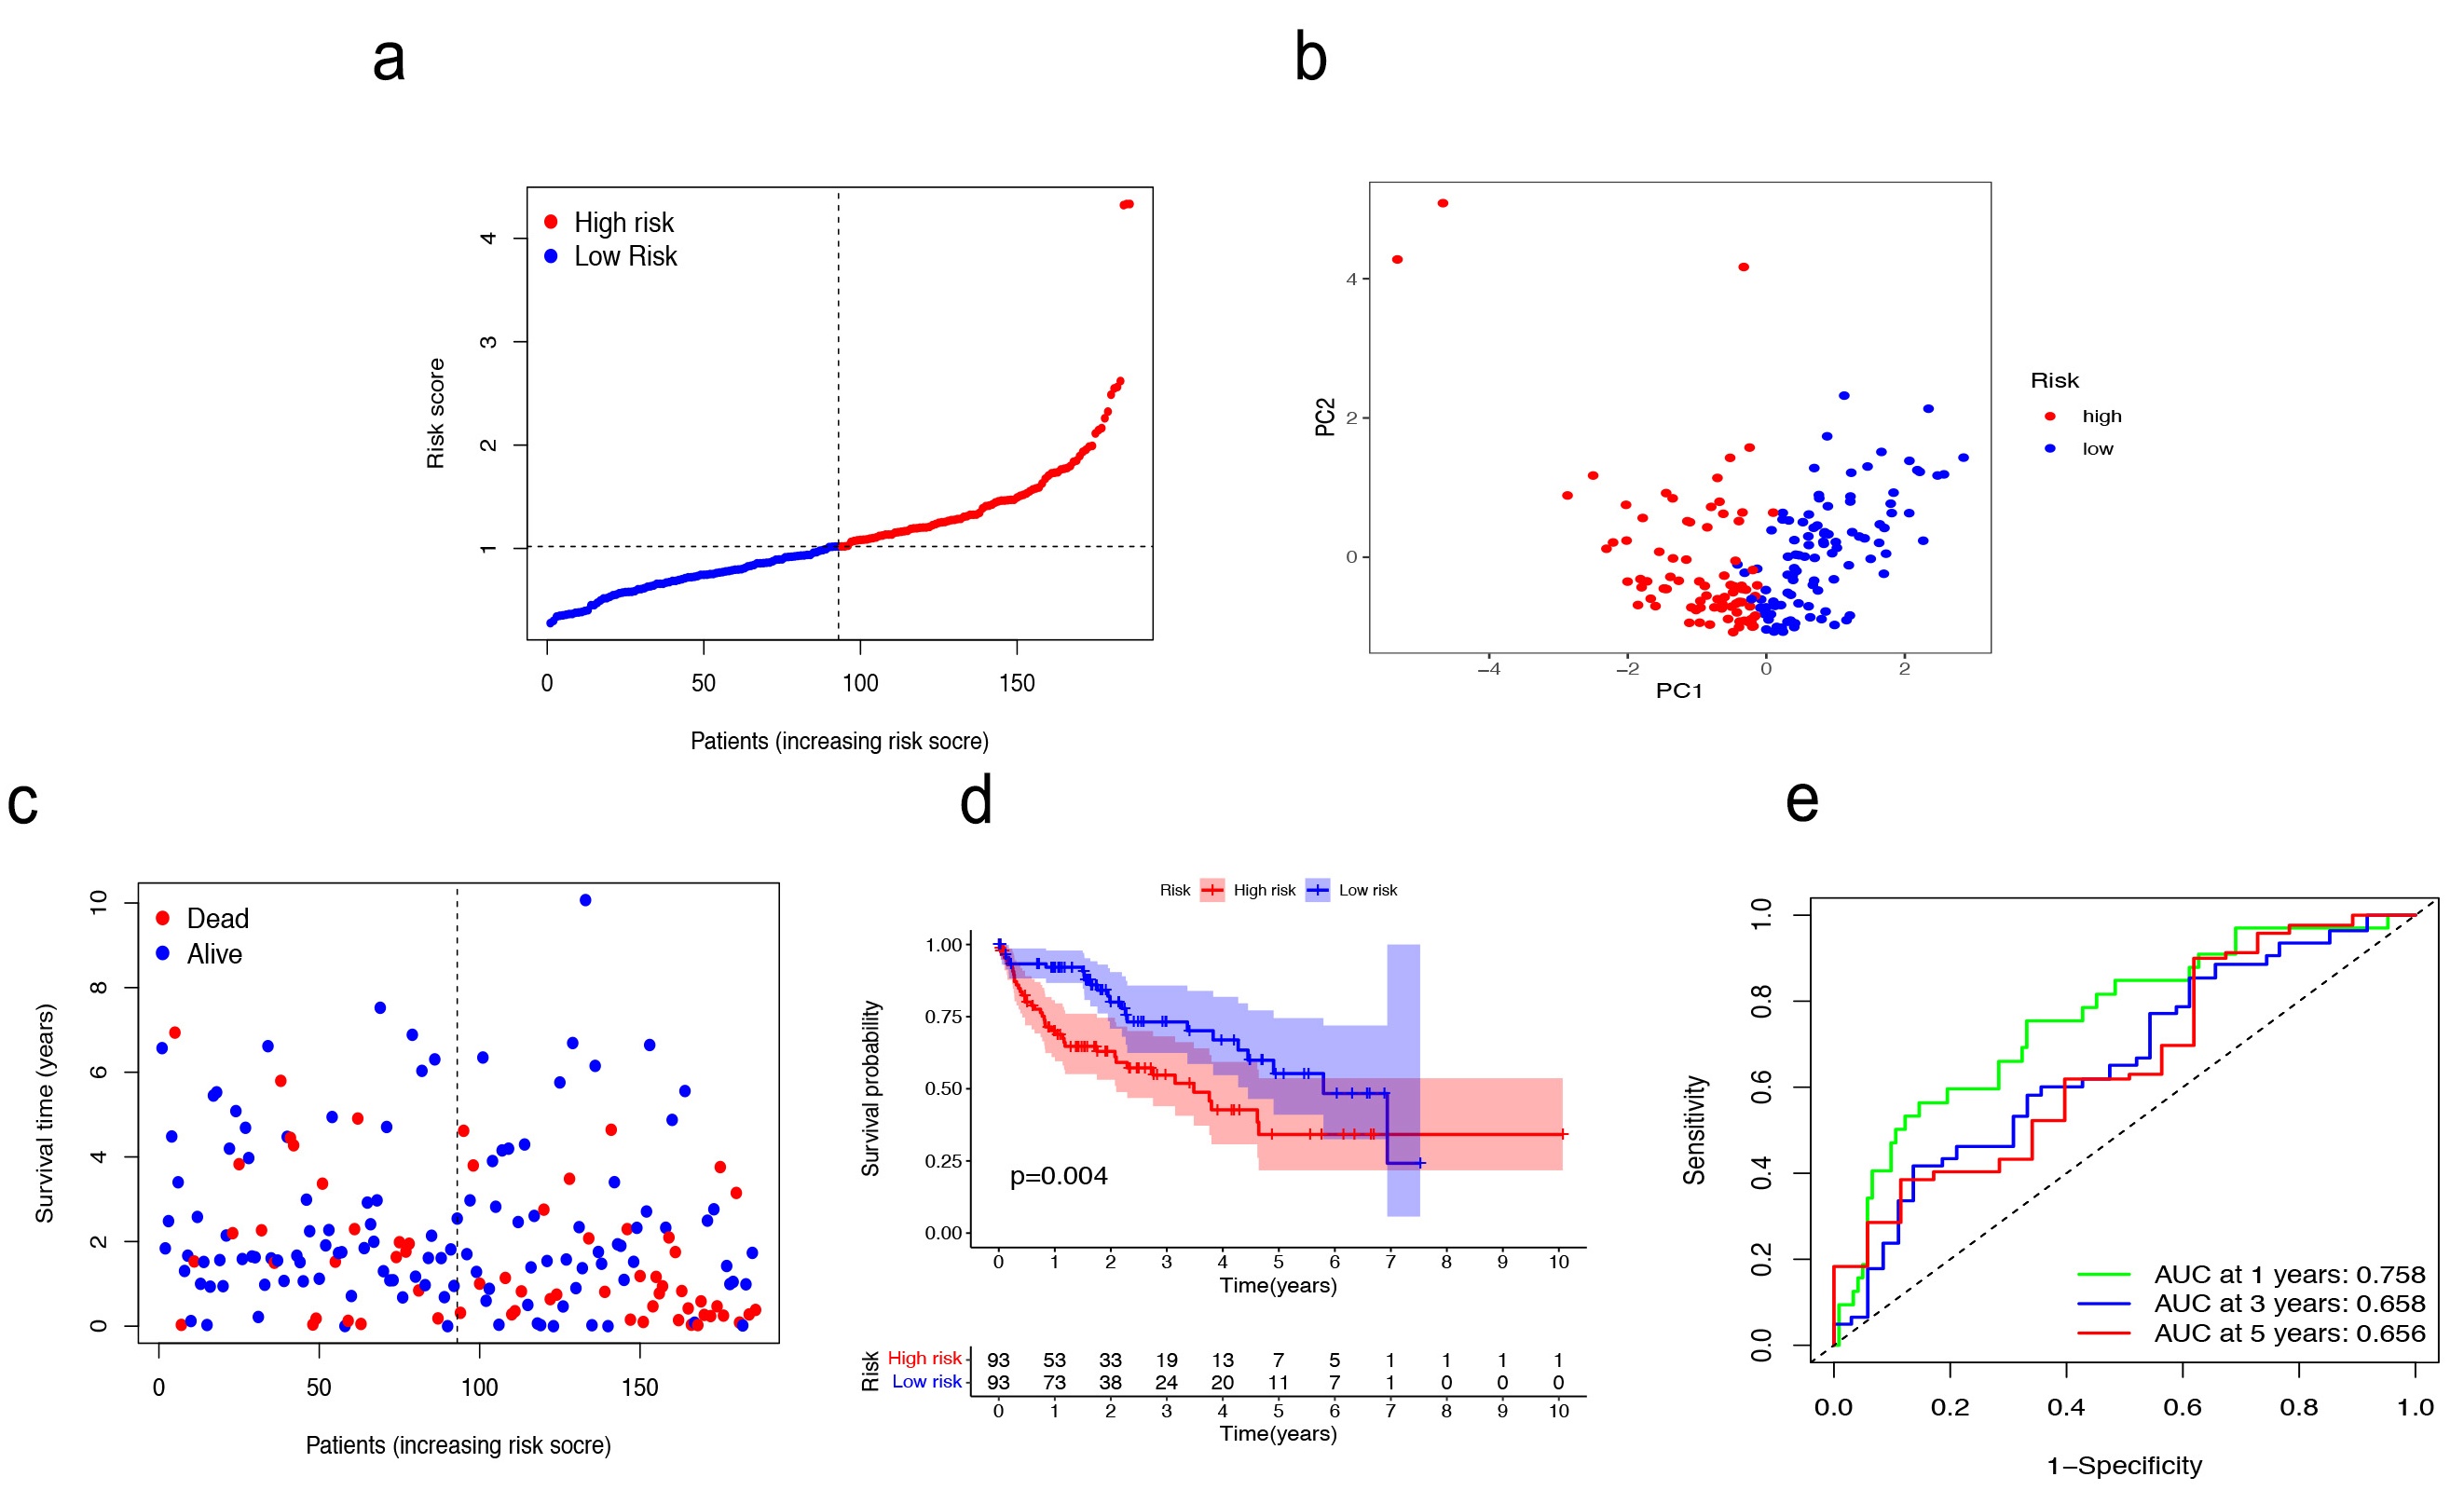 Fig. 4.
Validation in TCGA training cohort. (a–c) Patients were classified as baseline on the basis of their risk scores in the training cohort. (d) The Kaplan–Meier curve (KM) survival curve. (e) Analysis of time-dependent Receiver operating characteristic (ROC) scores.
We then assessed the predictive power of the risk signature in both the TCGA
test cohort (n = 184) and the external cohort (ICGC, n = 231). In the TCGA test
cohort, the high-risk (n = 83) and low-risk (n = 101) subgroups were well
differentiated into two clusters using PCA (Supplementary Fig. 2a–c). A
notably different OS was demonstrated by the KM survival curves of the two groups
(p = 0.022) (Supplementary Fig. 2d). Based on the risk score,
the ICGC cohort was classified into high-risk (n = 115) and low-risk (n = 116)
subgroups using PCA (Supplementary Fig. 3a–c). There was a marked
difference in the OS between the two groups, as represented by the KM survival
curves (p
Cox regression analysis was used to assess whether the risk score could
independently predict OS. The findings suggested that the risk score may be a
promising hazard factor both in the univariate Cox regression analysis
(p
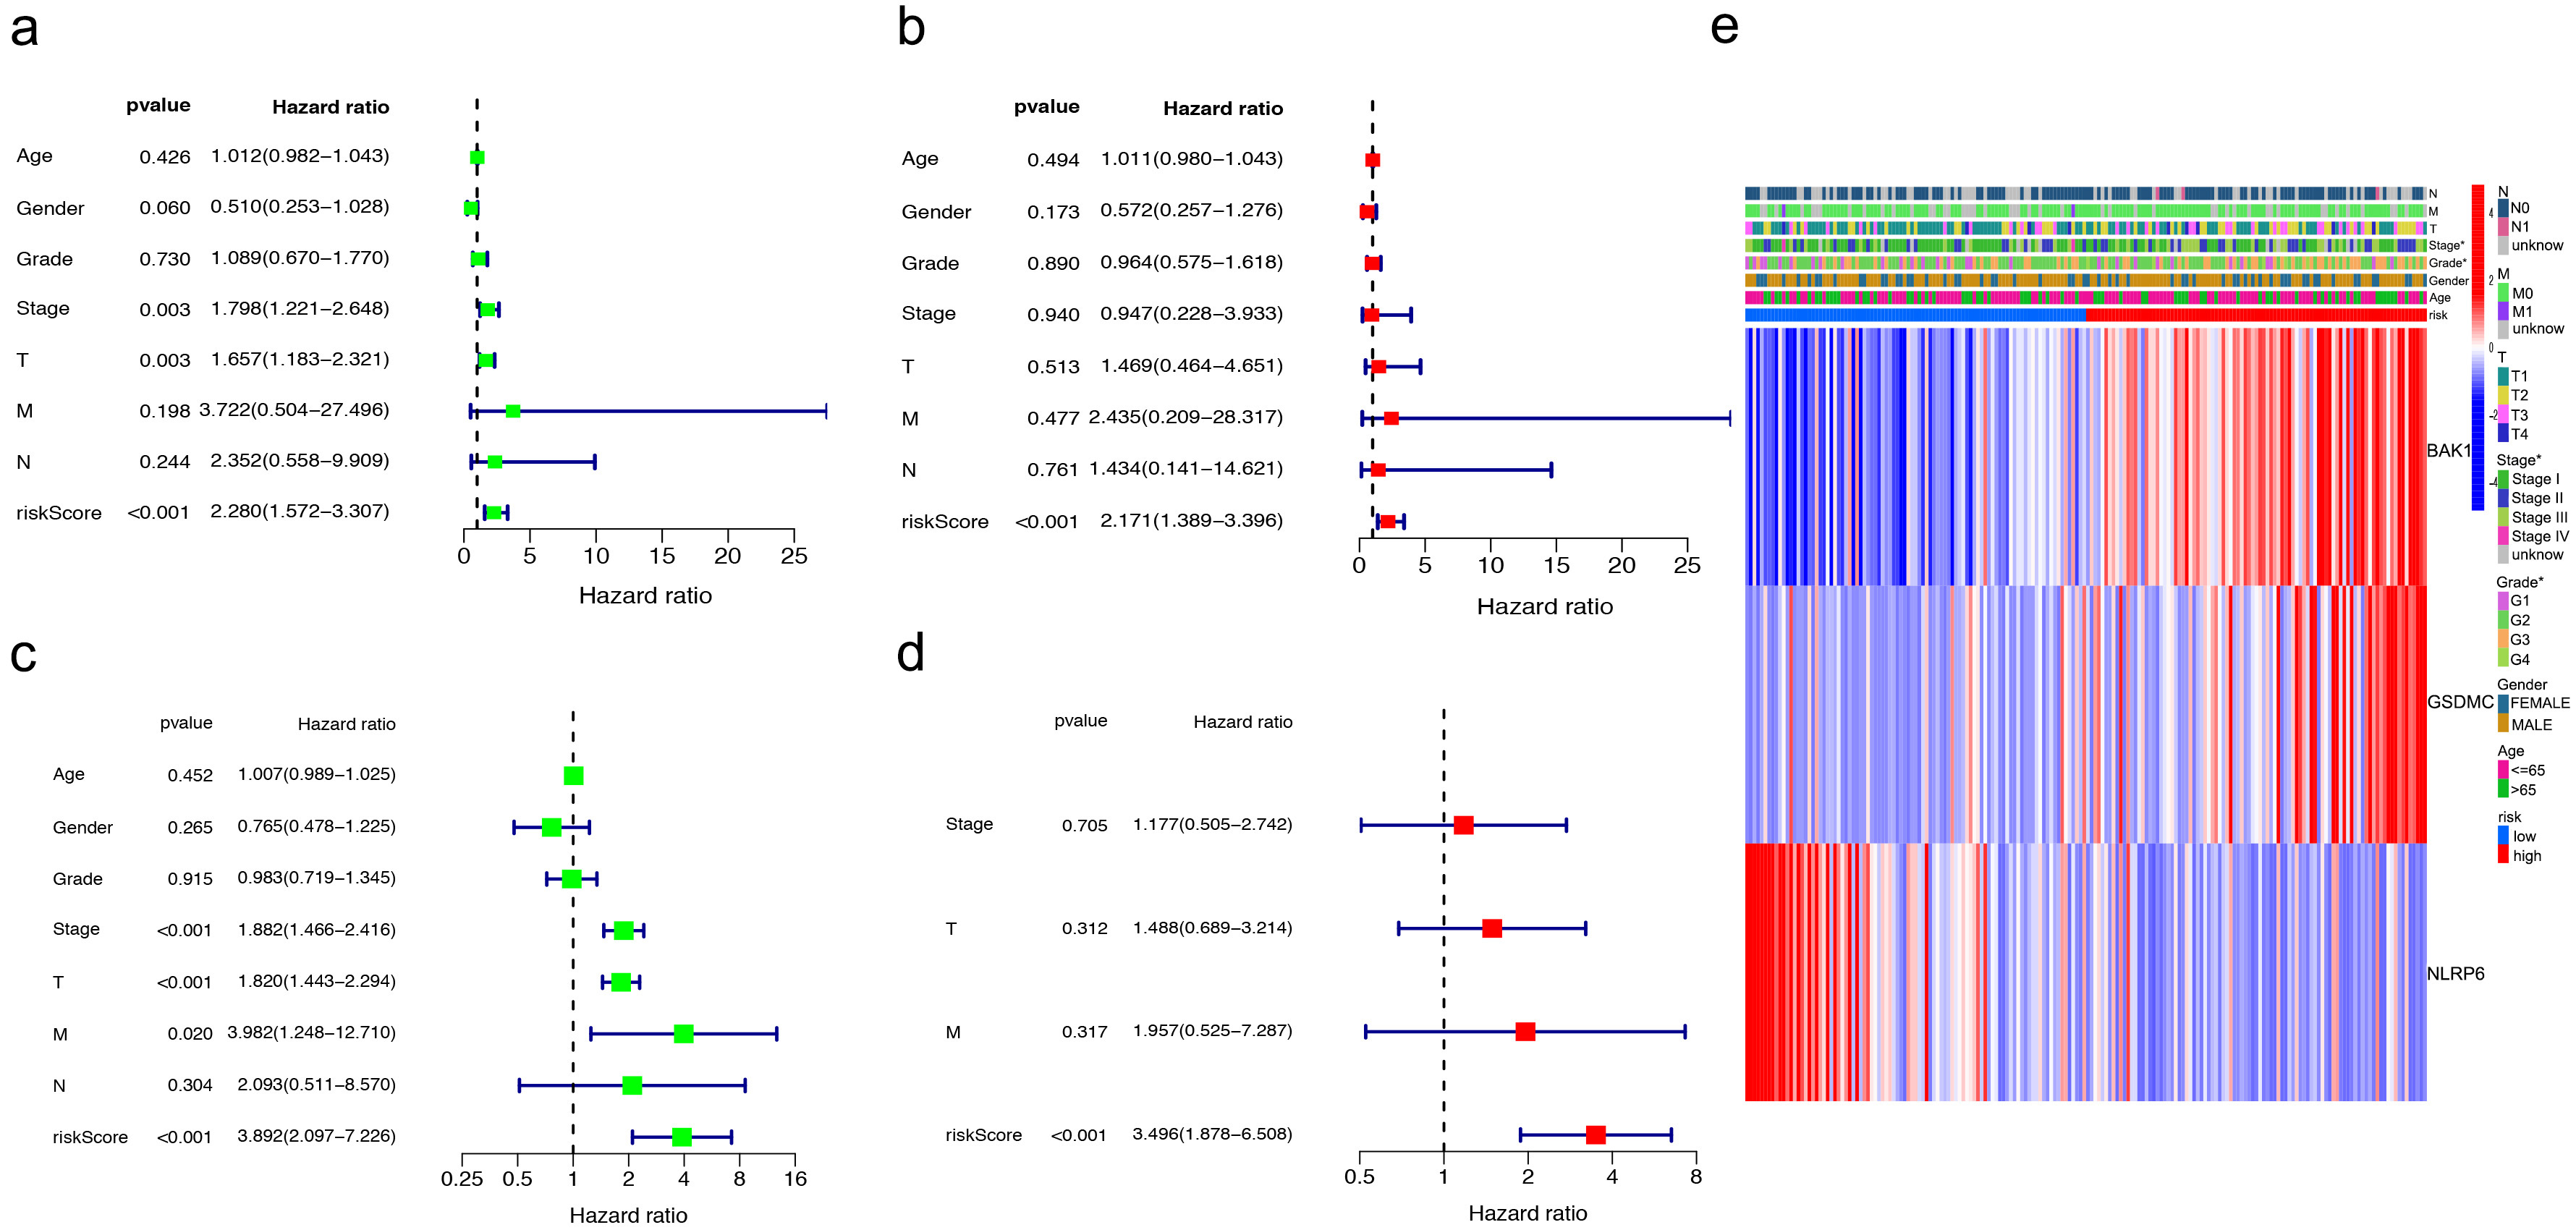 Fig. 5.
Independent prognostic value assessment of risk scores. (a,b) Univariate and multivariate analysis in training cohorts. (c,d) Test cohorts by univariate and multivariate analysis. (e) The correlation of gene heatmap with between the different risk groups.
To assess the predictive power of the risk score in HCC, we performed univariate
and multivariate Cox regression analyses in the TCGA test cohort of 184 patients
(Fig. 5c,d). Similar to the results in previous cohorts, the risk score was
proved to be a strong prognostic predictor (p
GSEA was used to explore the role of PRGs in HCC. Most of the genes were
enriched in the apoptosis, IL-6-JAK-STAT3, P53, and TGF-
On the basis of the functional analyses, GSEA analysis was performed to compare 16 enriched immune cell types between the two risk clusters in the TCGA cohorts. In the TCGA cohort, CD56 bright cells, CD4 T cells, dendritic cells (DC), NK cells, Plasmacyloid DC, CD56 dim cells, and Memory CD4 T cells showed a positive correlation, while eosinophils, neutrophils, T helper (Th)1 cells, macrophages, mast cells, memory B cells, activated CD8 T cells, Th17, activated B cells and monocytes were negatively correlated with the risk signature (Supplementary Fig. 4b).
We explored changes in the protein levels of three PRGs using the Human Protein Atlas (HPA) database. The results indicated that BAK1 and GSDMC were upregulated in tumor tissues, whereas NLRP6 expression was lower level in HCC than in normal tissues (Supplementary Fig. 5).
PD-L1 is an immune inhibitor, that can upregulates GSDMC expression to transform
apoptosis to pyroptosis in breast cancer [21]. Using the TCGA-LIHC database, we
found that PD-L1 and GSDMC were positively correlated (Cor = 0.3, p
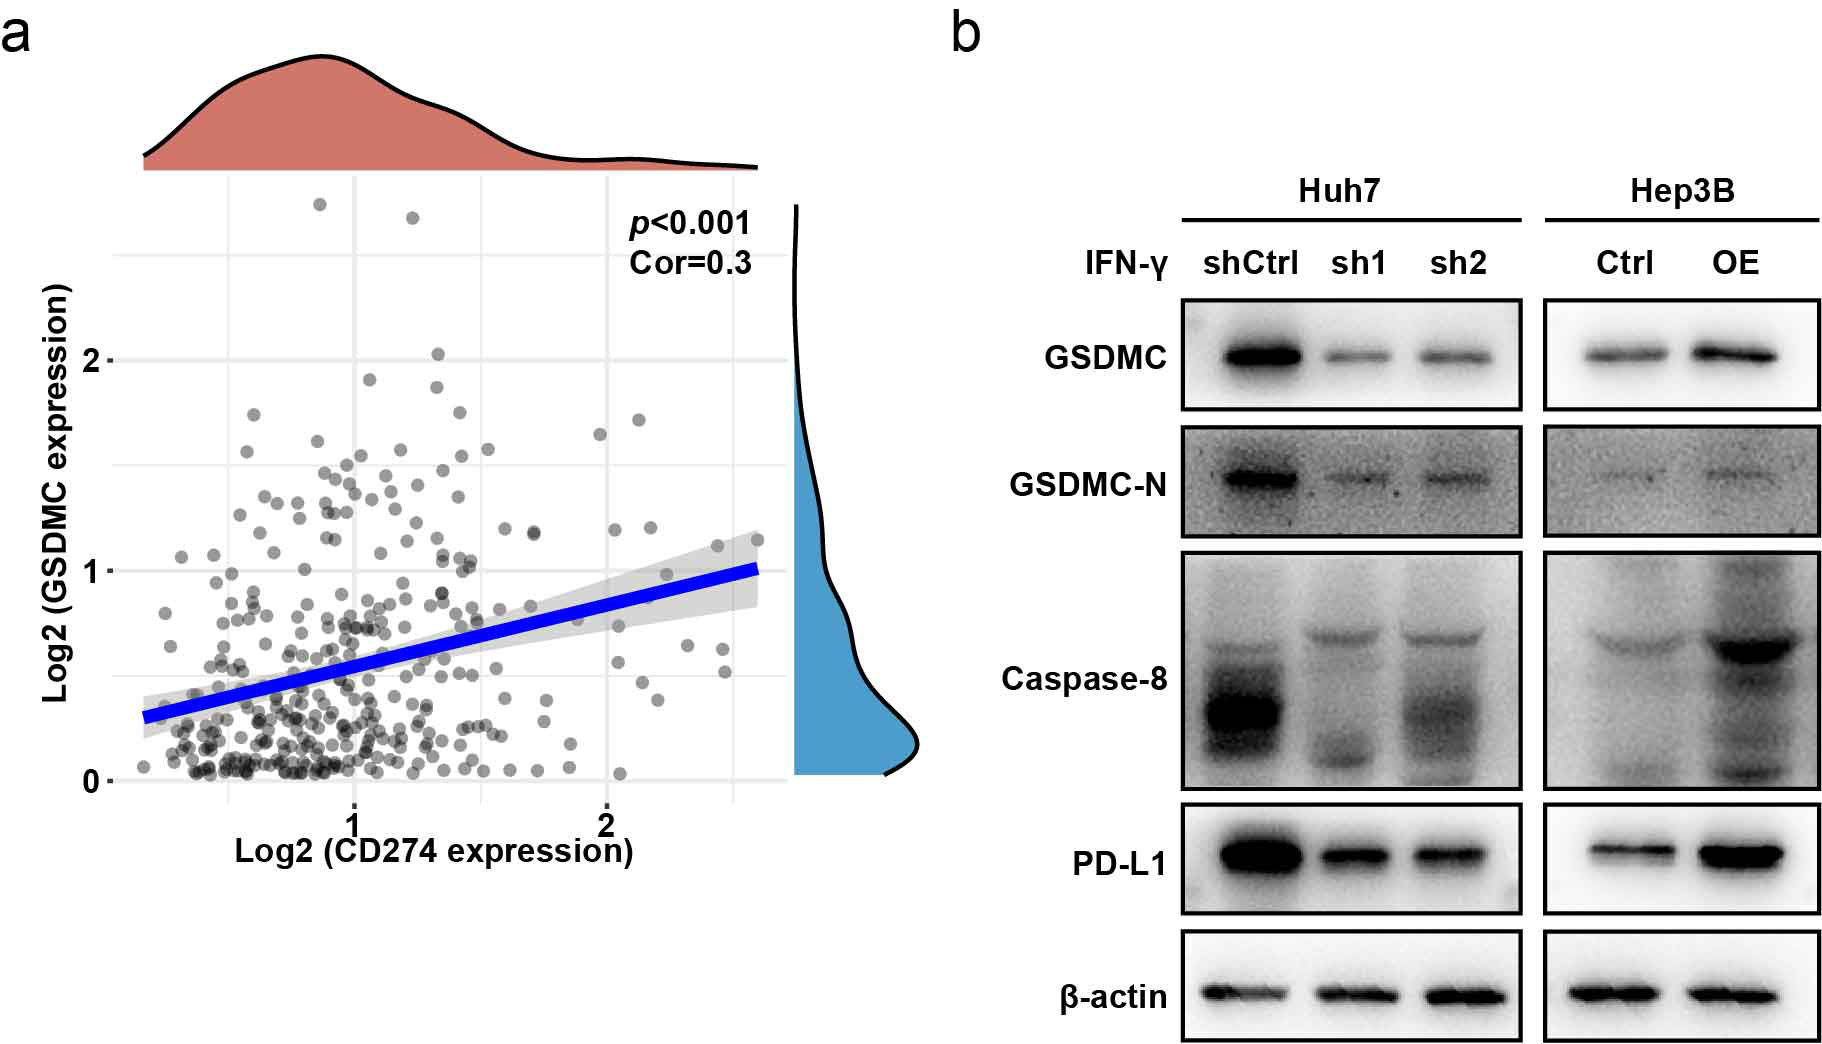 Fig. 6.
GSDMC is upregulated by CD274 (PD-L1). (a) CD274 showed
positive correlation with GSDMC (Cor = 0.3, p
A previous study has reported that GSDMC was increased in lung adenocarcinoma, colon adenocarcinoma and breast cancer and correlated with reduced overall survival [22, 23]. However, the role of GSDMC in HCC has not yet been investigated. We wondered whether GSDMC is upregulated in HCC and contributes to the malignant biological behaviors of tumors. Twelve pairs of HCC samples and adjacent tissues were collected for western blot analysis. Compared with adjacent liver tissues, GSDMC was significantly upregulated in HCC tissues (Fig. 7a). Then stable GSDMC-overexpressing Hep3B (Fig. 7b) cell line was successfully constructed. The proliferation ability was enhanced in GSDMC-overexpressing Hep3B cells, as shown by the CCK-8 proliferation assay and colony formation assay (Fig. 7c,d). Wound healing and invasion experiments demonstrated that the cell motility and invasion ability were substantially enhanced in GSDMC-overexpressing Hep3B cells (Fig. 7e,f).
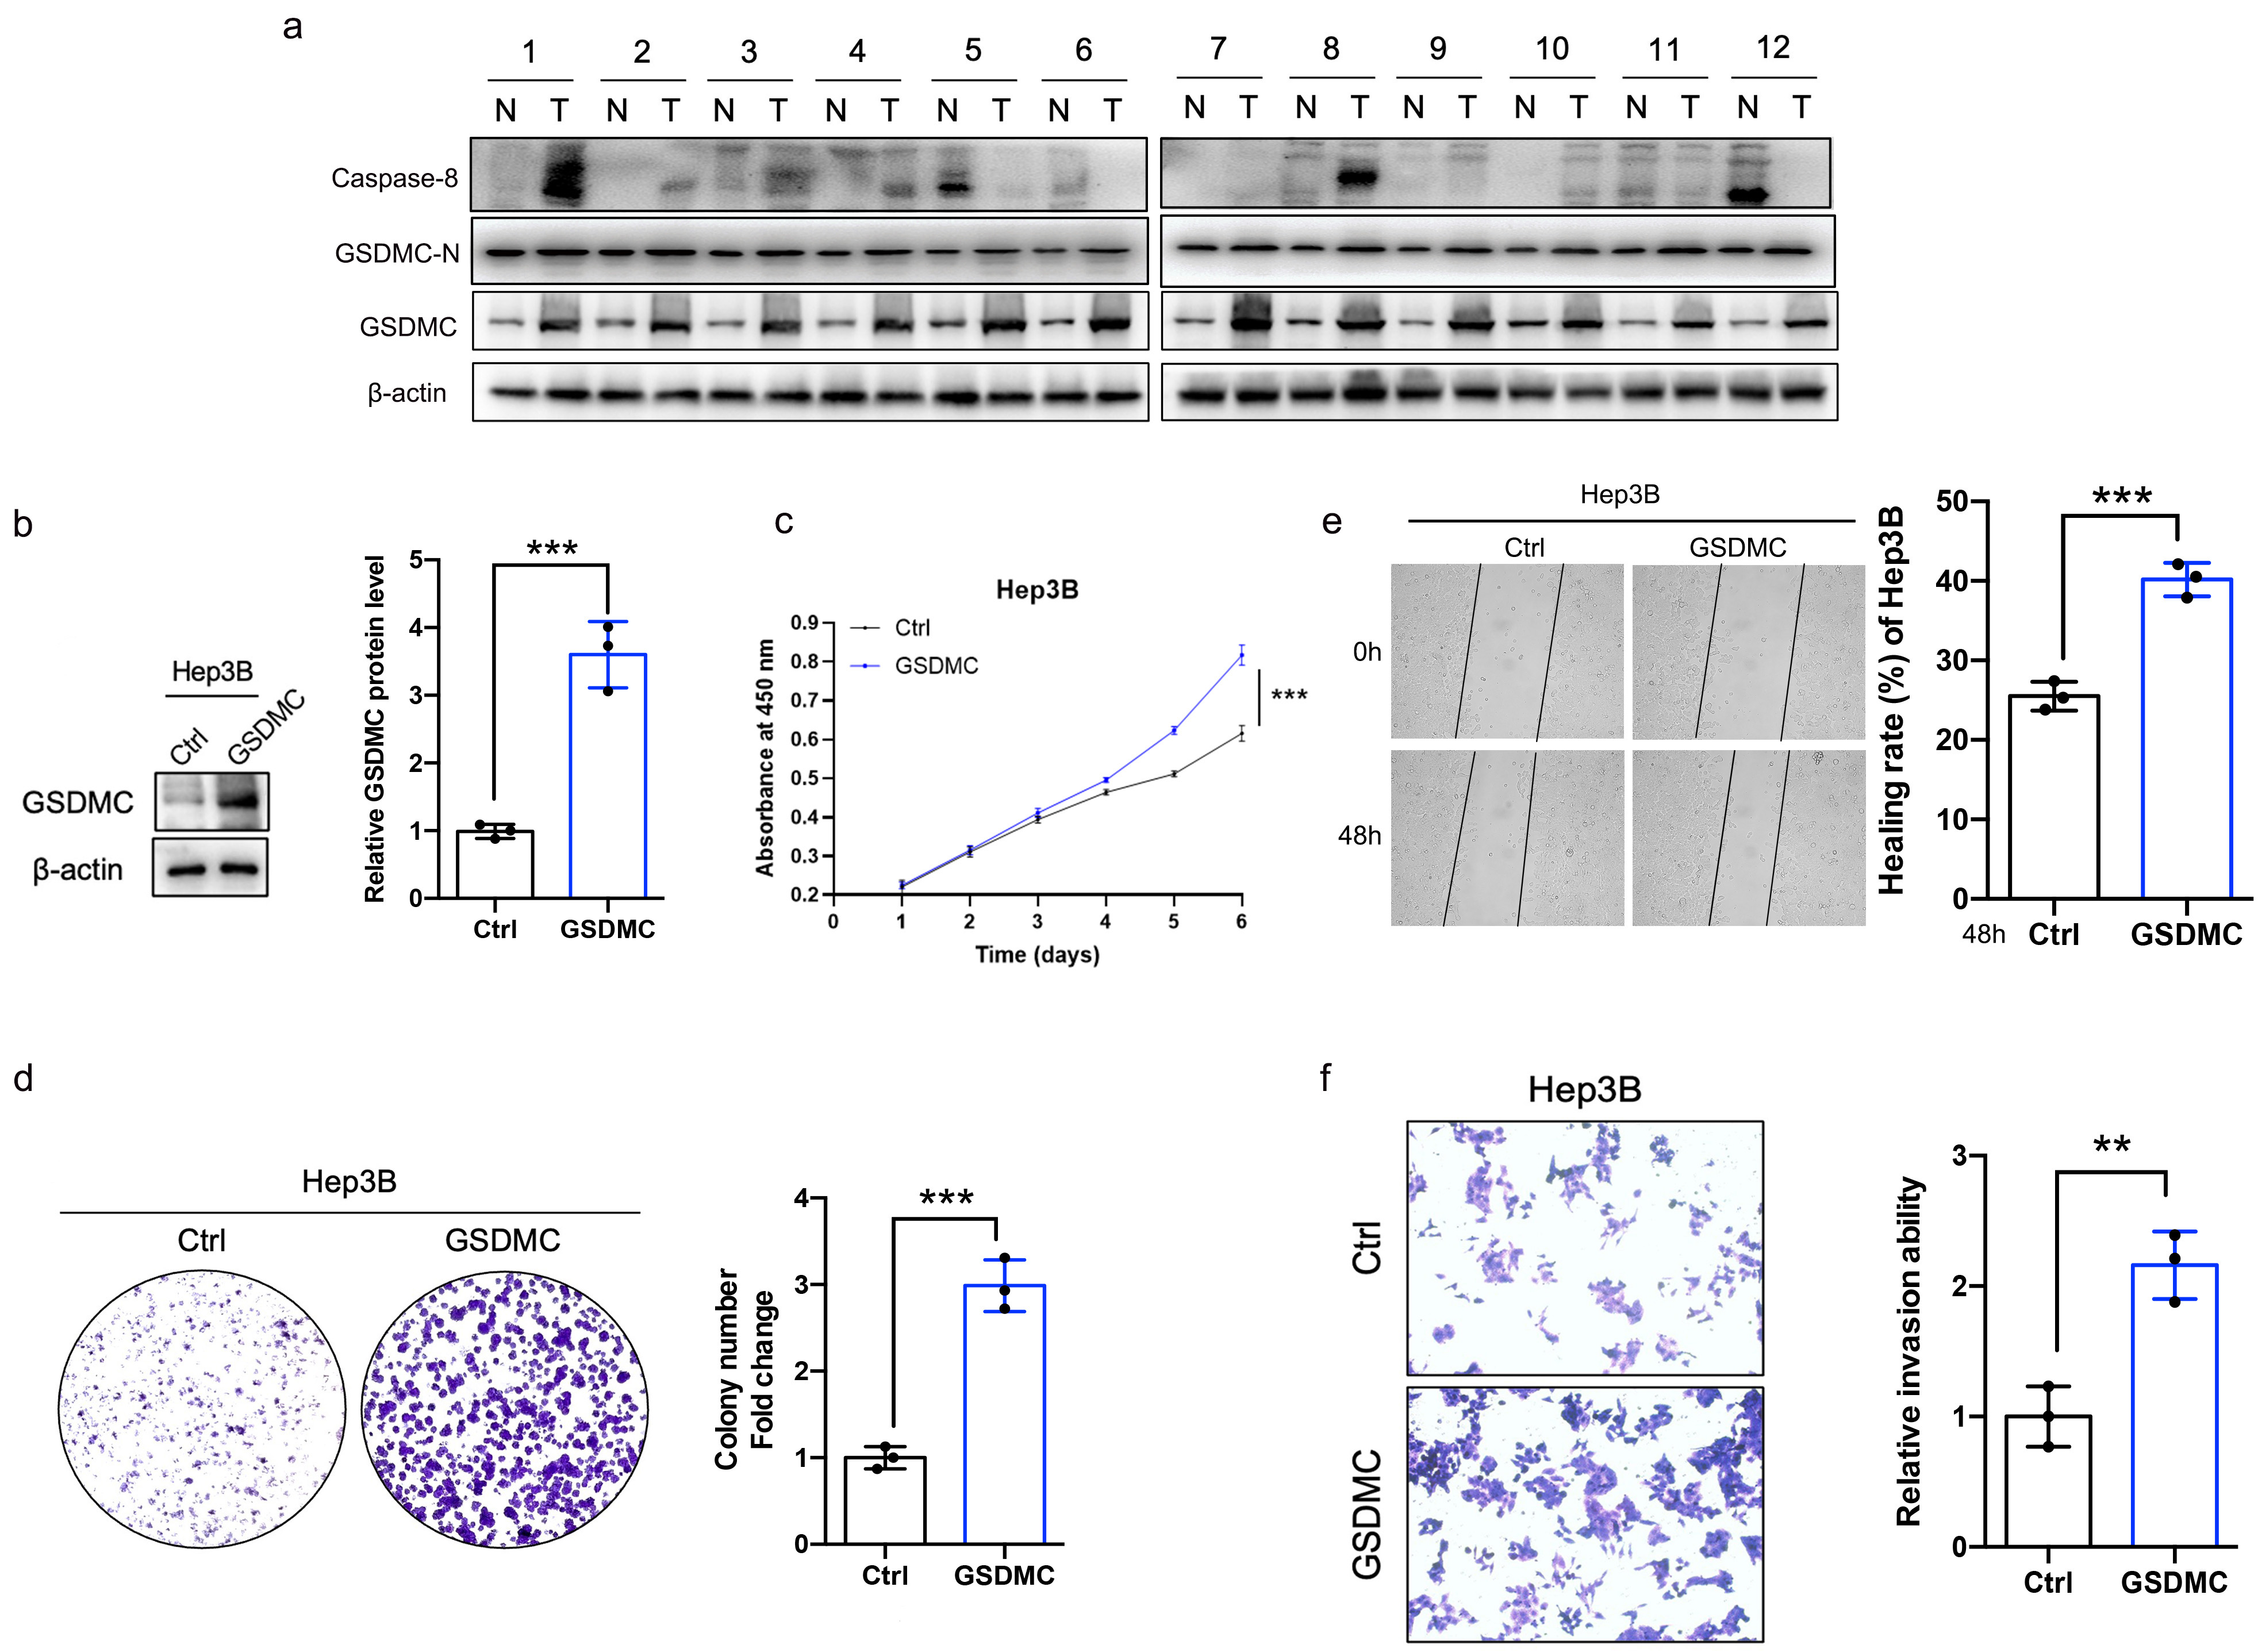 Fig. 7.
Overexpression of GSDMC significantly promotes the proliferation
and invasion of HCC cell. (a) The full length GSDMC, GSDMC-N, and caspase-8
expression levels in HCC and adjacent hepatic tissues. n = 12. (b) Validation of
GSDMC-overexpressing Hep3B cell lines, n = 3. (c) Effects of overexpression of
GSDMC on the proliferation of HCC cells, n = 3. (d) Representative plot and
quantitation of colony formation assay in HCC cells overexpressing GSDMC, n = 3.
(e,f) Effects of GSDMC overexpression on HCC cell motility (e) and invasion (f),
n = 3. **p
Next, we constructed a GSDMC knockdown Huh7 cell line (Fig. 8a). The results showed that the proliferative capacity was decreased (Fig. 8b,c), and cell motility and invasion ability were impaired in GSDMC-knockdown Huh7 cells (Fig. 8d,e).
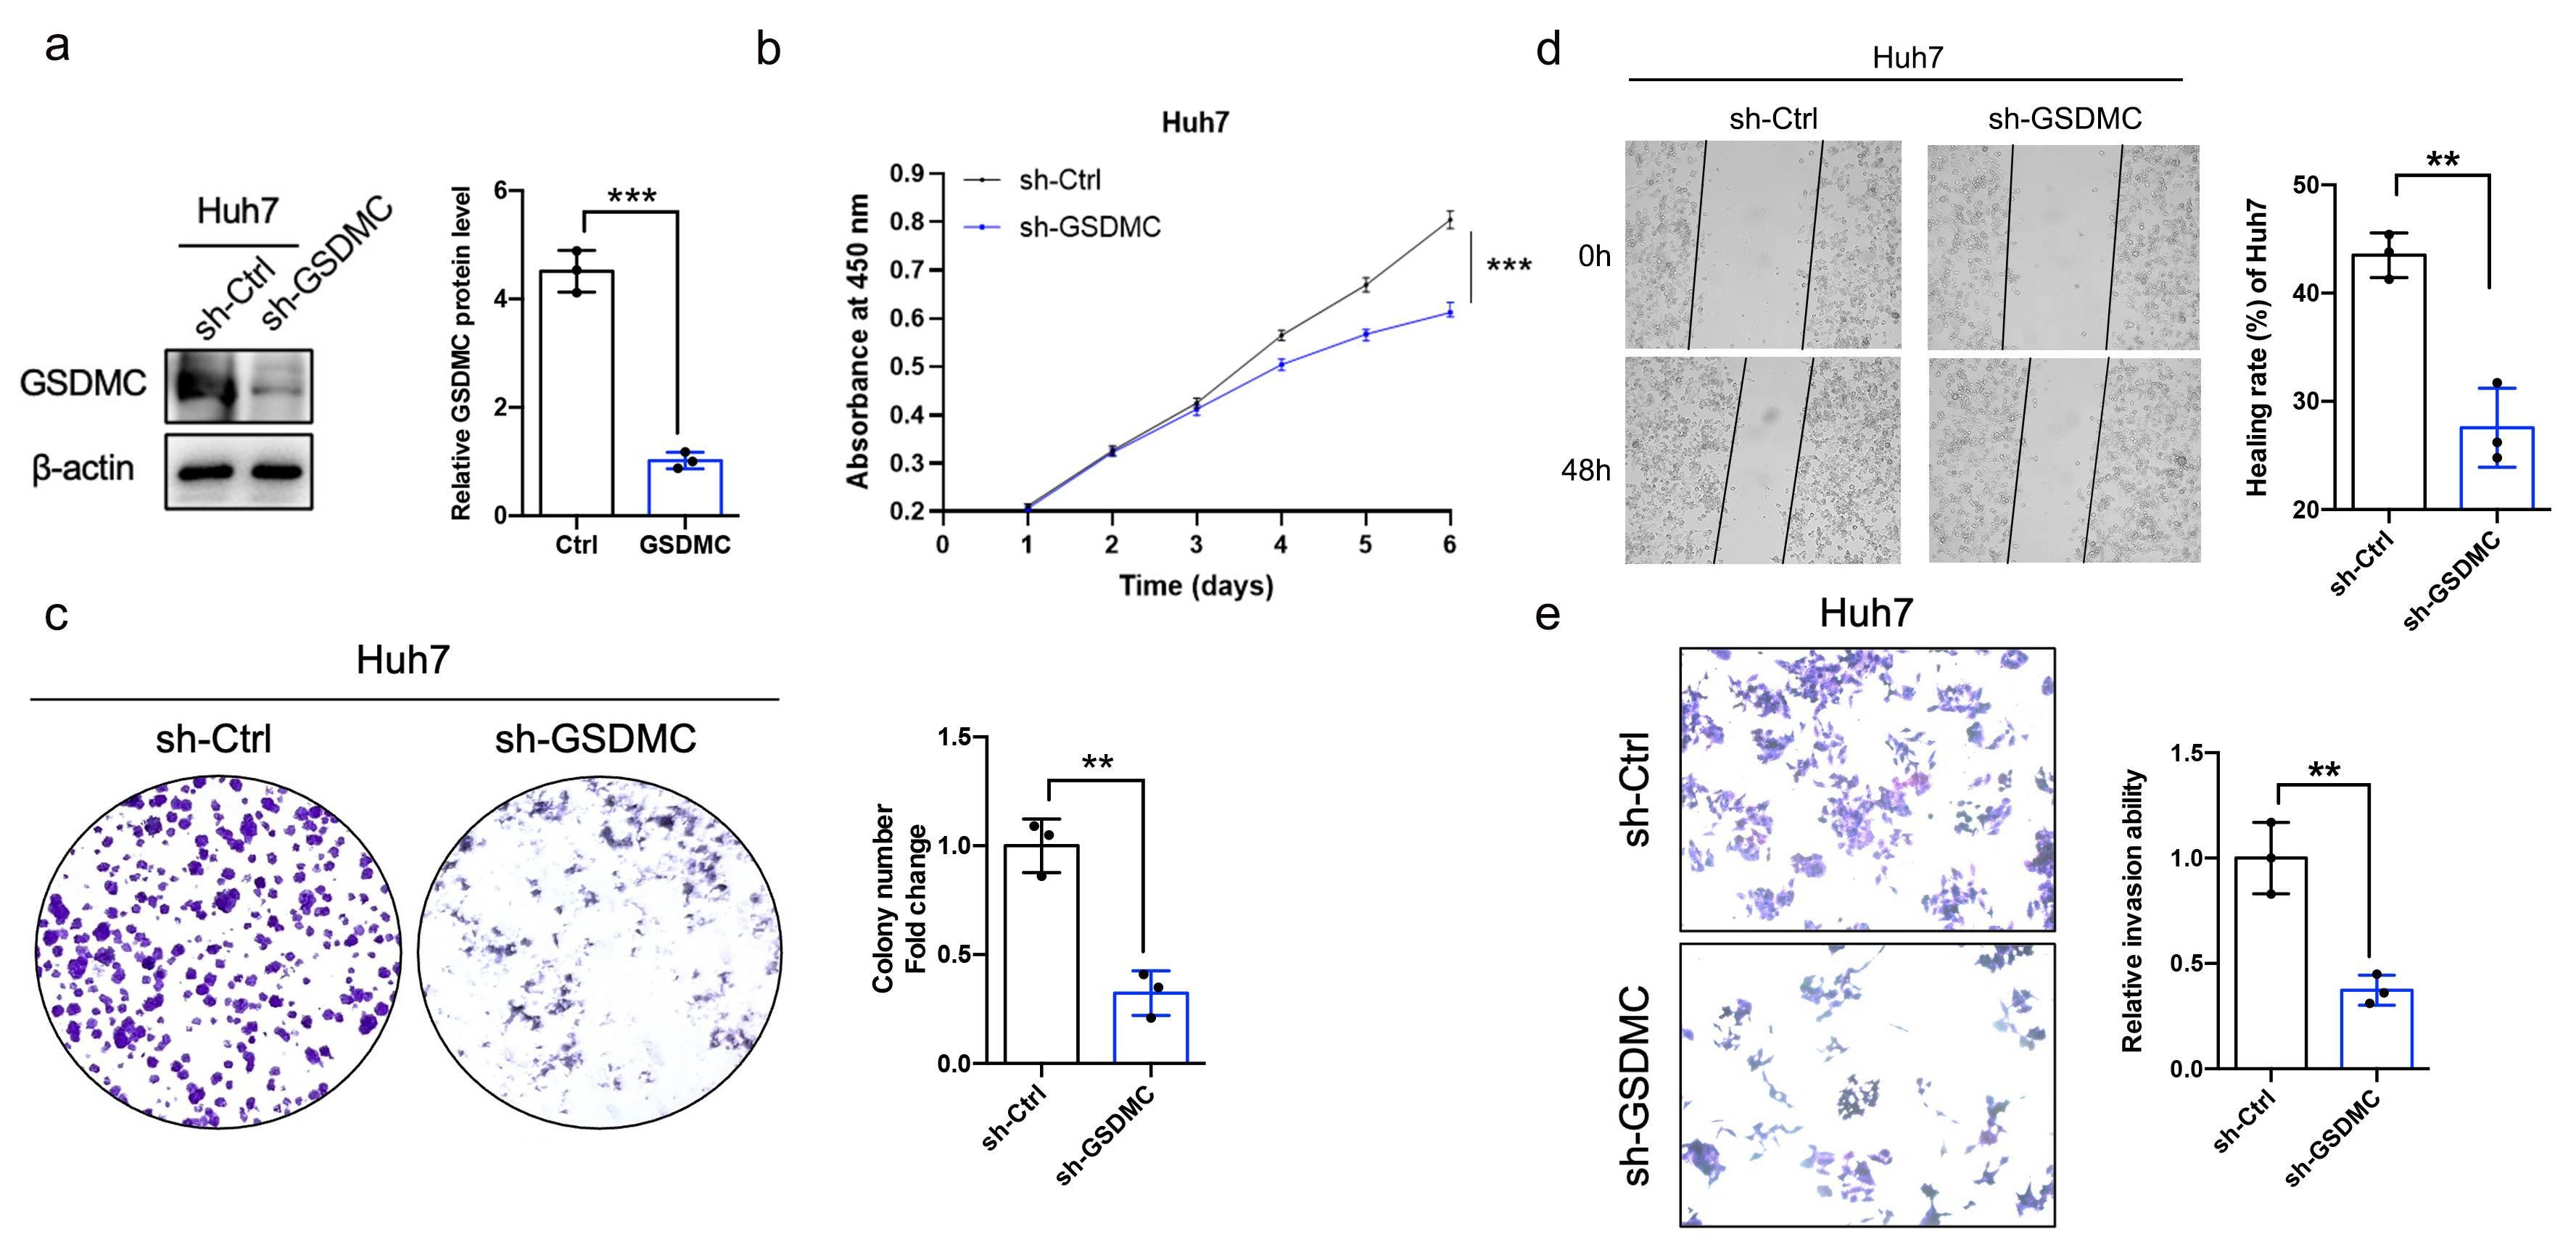 Fig. 8.
Knockdown of GSDMC significantly inhibits the proliferative and
invasive ability of HCC cell. (a) Validation of GSDMC-knockdown Huh7 cell lines
(sh-GSDMC), n = 3. (b) Effects of knockdown of GSDMC on the proliferation of HCC
cells, n = 3. (c) Representative plot and quantification of colony formation
assay in HCC cells knockdown by GSDMC, n = 3. (d,e) Effects of GSDMC knockdown
on HCC cell motility (d) and invasion (e), n = 3. **p
Taken together, these findings revealed a novel tumorigenic function of GSDMC in HCC.
Since GSEA analysis revealed an enrichment of immune cell-related pathways, we
hypothesized that infiltration of immune cells plays a critical role in the
tumorigenic effect of GSDMC in HCC. GSDMC expression showed a positive
correlation with immune cells and stromal cells (Fig. 9a). Furthermore, we
investigated the association between GSDMC expression and 24 types of
tumor-infiltrating immune cells by using the TIMER database. It is demonstrated
that GSDMC was strongly correlated with macrophages and Th2 cells (Cor
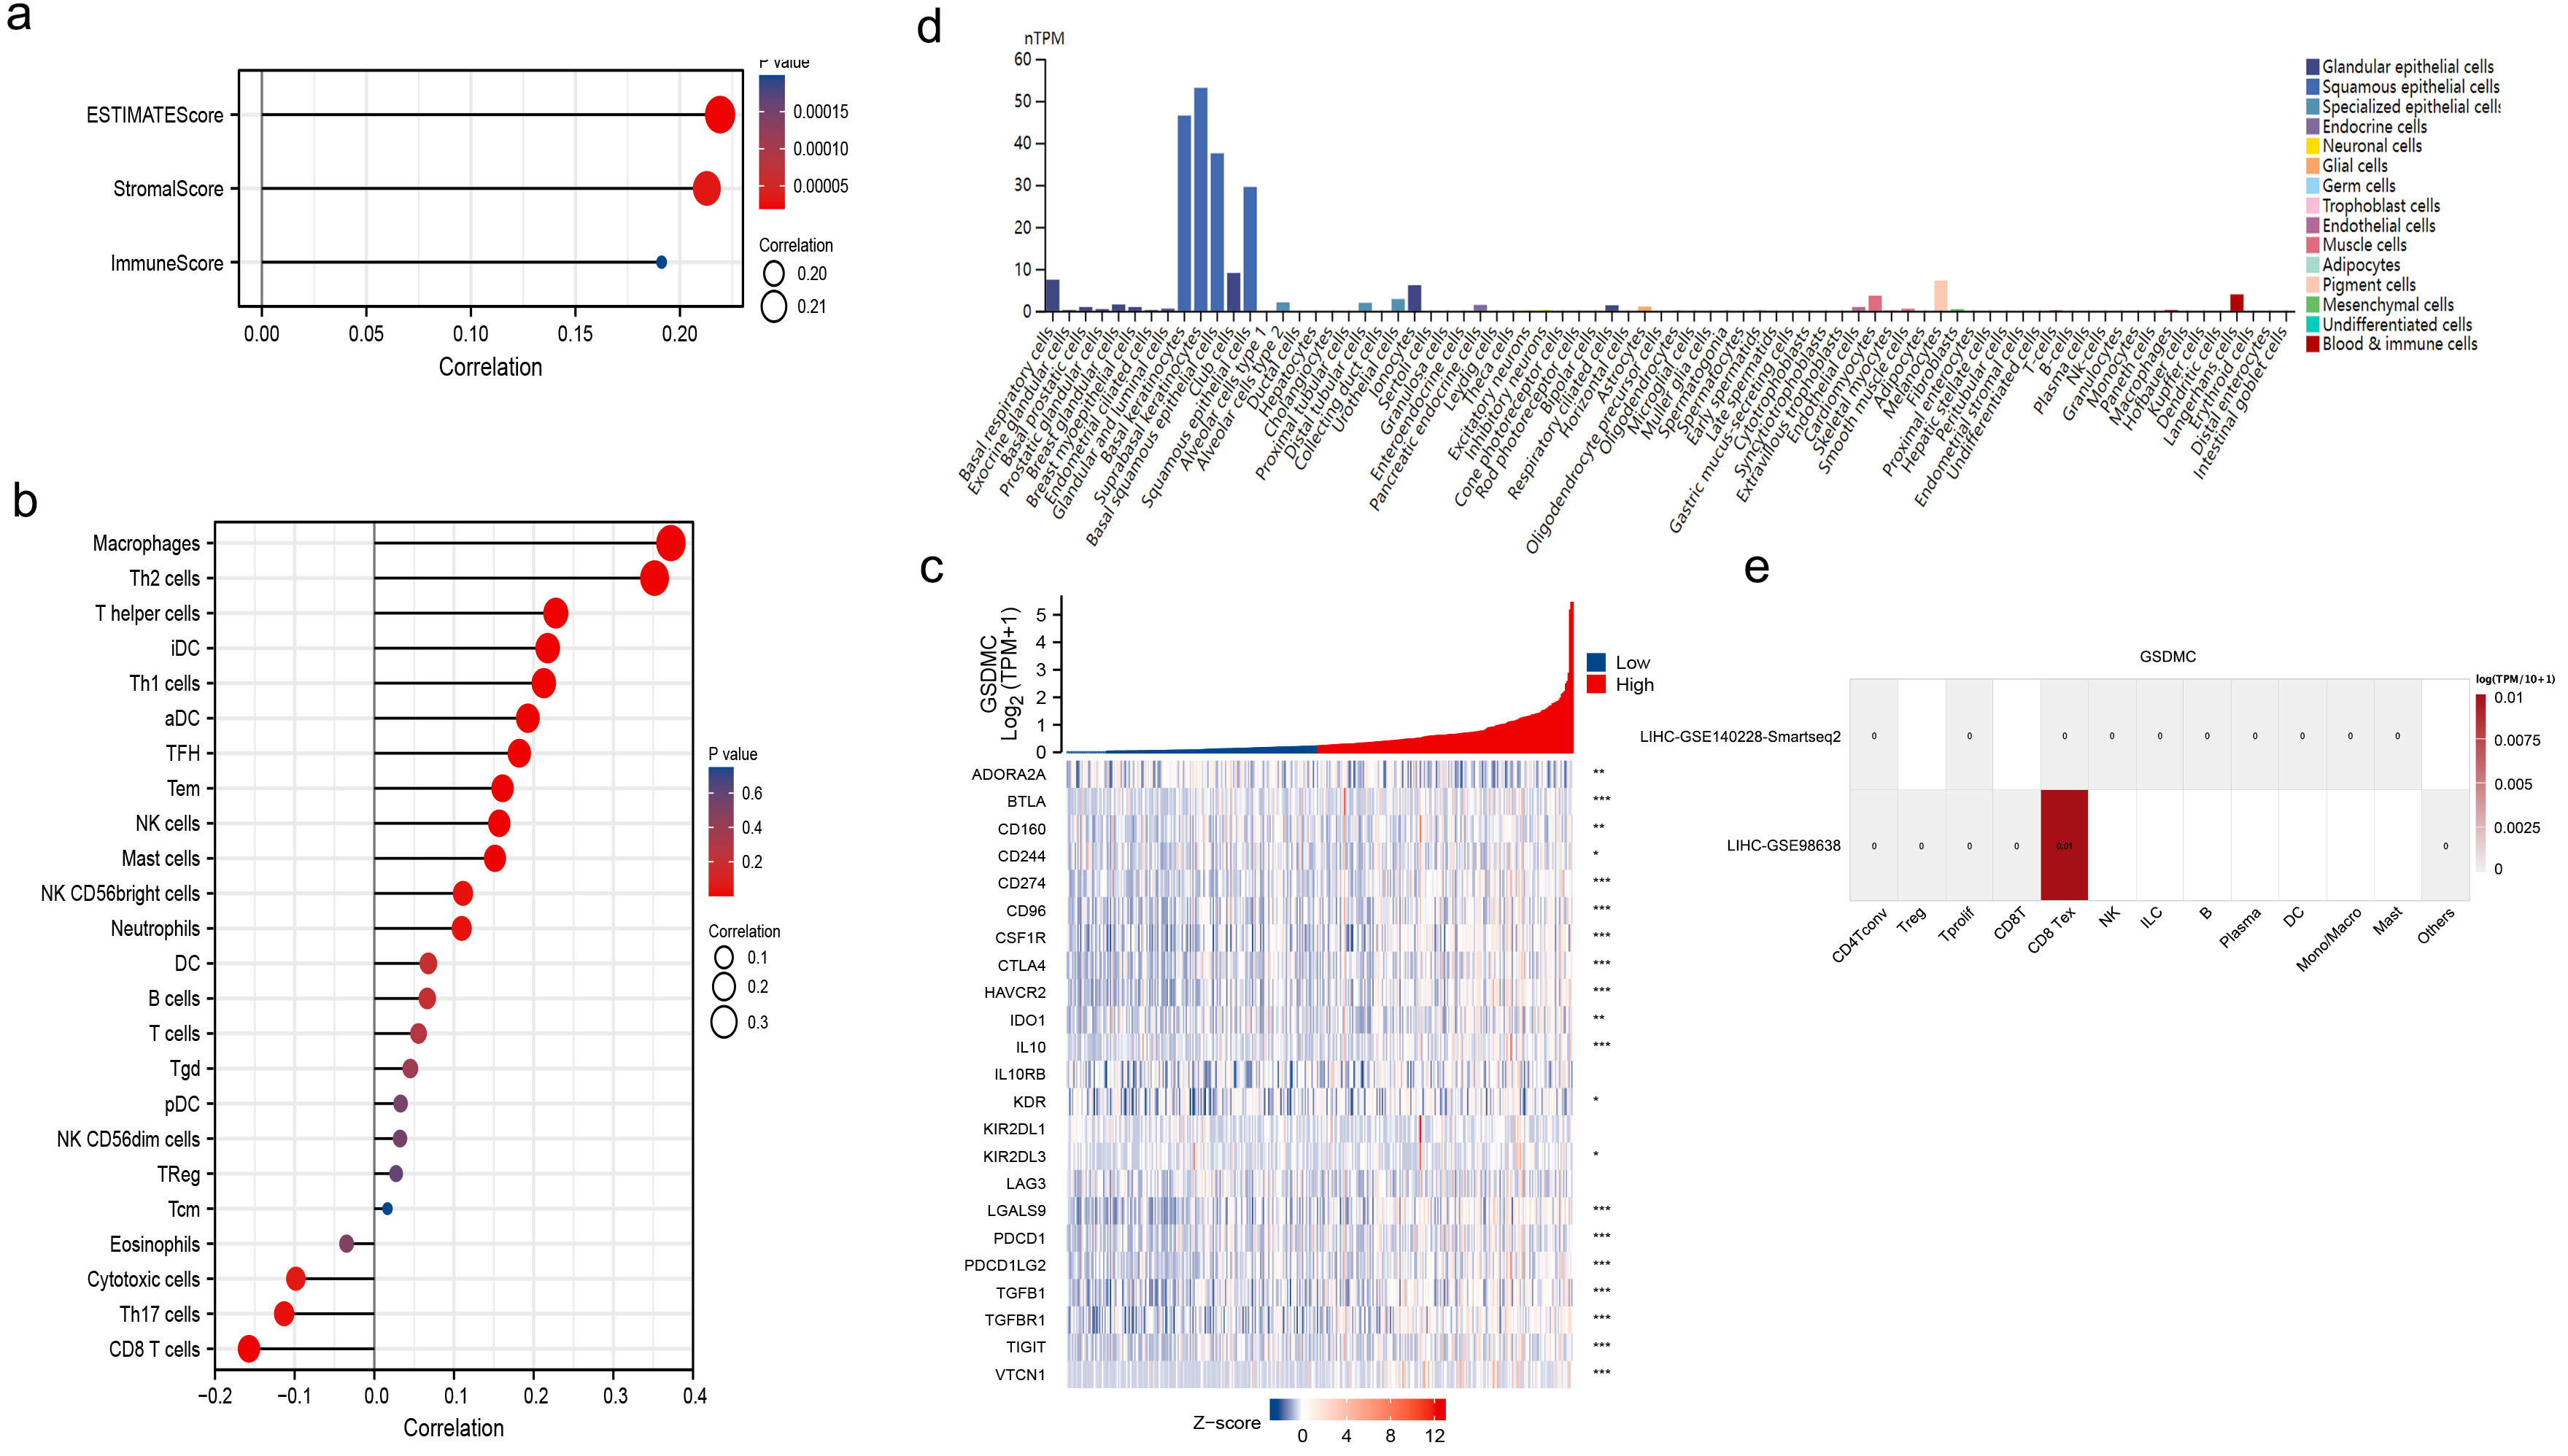 Fig. 9.
The relationship between GSDMC expression and tumor
microenvironment (TME) in HCC. (a) GSDMC was positively correlated with both
immune cells and stromal cells. (b) High GSDMC expression had the strongest
correlation with macrophages and Th2 cells (cor
Next, we explored the correlation between GSDMC and immunosuppressive checkpoint. As shown in the heatmap, GSDMC is correlated with various immune inhibitor proteins such as CD274 (PD-L1), IL-10, and IDO1 in the TISIDB database (Fig. 9c). We further examined the expression pattern of GSDMC. It is mainly expressed in keratinocytes and epithelial cells (Fig. 9d), according to the HPA dataset. GSDMC was not expressed in immune cells in HCC single-cell sequencing datasets (GSE140228 and GSE98638, Fig. 9e) using TISCH database.
To date, the prognostic evaluation of HCC is mostly based on the pathology, staging and grading of the American Joint Committee on Cancer (AJCC), Tumor Node Metastasis (TNM), and Bandwidth Constrained Least Cost (BCLC), which are not sensitive enough. Improving the survival of patients with HCC, more accurate and less invasive prognostic models based on novel biomarkers are urgently needed.
As an embodiment of programmed cell death, pyroptosis can release cellular
content and inflammatory cytokines, which occur in cells infected by pathogens.
Recent studies have suggested that pyroptosis also contributes to oncogenesis and
cancer development. Pyroptosis is a double-edged sword, which could be either
pro-tumorigenic or antitumorigenic. On one side, pyroptosis can promote
inflammatory death of tumor cells and release chemokines that recruit immune
cells to the TME, therefore suppressing tumor growth [24]. On the other side,
pyroptosis-produced IL-1
Tumor cells can induce a suppressive TME to promote immune evasion and
facilitate HCC progression. ICIs activate immune attack against tumor cells by
specifically blocking immune checkpoints, such as PD-1/PD-L1 (CD274/CD274L).
However, responses to ICIs vary among individuals. An important reason for this
poor response is the scarcity of immune cells within TME. Pyroptosis-induced
inflammation may increase the number of tumor-infiltrating immune cells, thereby
improving therapeutic sensitivity [25]. Previous studies have suggested that
pyroptosis is closely related to PD-1/PD-L1 [25]. GSDME and
GSDMD can serve as biomarkers for PD-1 inhibitor [25]. Moreover,
PD-L1 was able to regulate GSDMC transcription and switch
apoptosis to pyroptosis induced by TNF
The function of GSDMC in tumors is less known [27]. In a previous study, GSDMC upregulation was associated with melanoma metastatic [28], GSDMC overexpression promoted tumorigenesis and cell proliferation by inhibiting TGFBR activity in colorectal cancer. In addition, it has been shown to be an indicator of poor prognosis in lung adenocarcinoma patients [23]. In contrast, GSDMC acted as a tumor suppressor and exerted an inhibitory effect on cell growth in esophageal and gastric cancer [29]. We found that GSDMC was upregulated in HCC tissues. Furthermore, overexpression of GSDMC contributed to the proliferation, invasion, and migration of HCC cell lines, whereas silencing GSDMC showed the opposite effect. These findings revealed the pro-tumorigenic role of GSDMC in HCC. Determining the function of GSDMC in HCC will facilitate its future use as a therapeutic target in clinical practice.
Pyroptosis is a form of cell death that affects the prognosis of cancer patients by modulating tumor cell migration, proliferation and invasion. Some related studies have shown that PRGs played important roles in predicting the prognosis of hepatocellular carcinoma patient [30, 31, 32, 33, 34, 35, 36, 37, 38]. Li et al. [31] constructed a three-PRG prognostic model comprising CHMP4A, HMGB1 and PLK1. Further the author validate the differential expression of the three prognostic genes in HCC model and in vitro. He et al. [35] constructed five PRGs (CASP8, GSDMC, NLRP6, NOD2, and PLCG1) signatures to predict HCC prognosis. It could precisely predict survival outcomes, reveal the composition of the immune microenvironment, and strengthen the argument for more credible clinical and functional research in HCC patients. In addition, qRT-PCR analysis also demonstrated that the PRGs in HCC cell lines were differentially expressed in the prognostic signature. Zhang et al. [36] identified a 7-PRGs signatures (BAK1, CHMP4B, GSDMC, NLRP6, NOD2, PLCG1, SCAF11) for predicting the prognosis of HCC. This novel PRGs signature can predict the prognosis of patients with HCC and provide insight into new cell death-targeted therapies. The pyroptosis-related risk model developed by Xing et al. [37] can predict the prognosis of HCC, evaluate immune cell infiltration status in the tumor microenvironment and assess the efficacy of immunotherapy to guide immunotherapy. All these studies established a strong correlation between pyroptosis and the clinical risk of HCC patients, however, these studies did not focus on the genes function in HCC.
Our study aimed to identify PRGs with differential expression between HCC and normal samples in order to construct a prognostic model, that can distinguish HCC patients with varied clinical outcomes. The three PRGs signatures containing GSDMC could predict HCC prognosis. In addition, we focused on GSDMC molecules and probed the GSDMC biology in both patient samples and hepatocellular carcinoma cell lines, which could demonstrated that increased GSDMC levels contribute to cell proliferation, invasion and migration in HCC. Although we had performed verifications in multiple databases, our research still has some limitations. First of all, the validation of prognostic models was mainly based on public databases. The predictive value needs to be verified using additional clinical data. Second, this article does not have an in-depth investigation on the molecular pathway behind these pyroptosis-related biomarkers. More efforts are needed to determine how pyroptosis regulates the TME in HCC.
Our findings indicated that the 3-PRGs signature which contained GSDMC could predict the prognosis of patients with HCC. In addition, GSDMC exerted a pro-tumorigenic role by promoting the growth and metastasis in HCC.
All the data included in this article are available from the corresponding author upon reasonable request.
RX, SC designed the study. ML and QJ performed the project. ML and XL organized the data and wrote the manuscript. QJ and LH provided help and advice on the cell function experiments. XL revised the manuscript. All authors contributed to editorial changes in the manuscript. All authors read and approved the final manuscript. All authors have participated sufficiently in the work and agreed to be accountable for all aspects of the work.
The study was carried out in accordance with the guidelines of the Declaration of Helsinki and approved by the Ethics Committee of Zhongshan Hospital, Fudan University (No. B2017-134).
We thank TCGA and other databases for uploading meaningful datasets.
The National Natural Science Foundation of China (Grant number 81972294) were used for supporting this work.
The authors declare no conflict of interest.
Publisher’s Note: IMR Press stays neutral with regard to jurisdictional claims in published maps and institutional affiliations.