


1 School of Traditional Chinese Medicine, Jinan University, 510632 Guangzhou, Guangdong, China
Abstract
Background: Antigen presentation may be an important factor contributing to immune evasion in cancer. This study investigated antigen-presenting prognostic related genes (APPGs) and their potential mechanisms in hepatocellular carcinoma (HCC). Methods: We constructed a score built upon the core APPGs (APP.Score) through nonnegative matrix factorization (NMF) clustering, weighted gene co-expression network analysis (WGCNA), random forest (RF), and least absolute shrinkage and selection operator (LASSO) methods. We also compared the clinical and molecular characteristics of different APP.Score. Furthermore, in vitro experiments were conducted to validate the expression of core APPGs and investigate the effects of phospholipase A2, group 7 (PLA2G7) knockdown on HCC cell development and programmed death-ligand 1 (PD-L1) expression. Results: APP.Score was positively correlated with immune cell infiltration and levels of immune checkpoint inhibitor-related genes, and negatively correlated with overall survival (OS). The area under the curve values were 0.734, 0.747, and 0.679 for survival periods of 1, 2, and 3 years, respectively, indicating that APP.Score could be an independent prognostic factor for patients with HCC. OS of the high expression group of these genes, including PLA2G7, musculin, heat shock protein family A, secreted phosphoprotein 1, and neutrophil cytosolic factor 2 (NCF2) was lower than that of their low expression group. Moreover, the upregulation of key components of APPGs, except NCF2, was observed in HCC. The inhibition of PLA2G7 suppressed HCC progression and reduced PD-L1 and phosphorylated signal transducer and activator of transcription 1 (p-STAT1)/STAT1 levels in HepG2 and Huh-7 cells. Remarkably, the decrease in PD-L1 expression caused by PLA2G7 silencing was reversed upon treatment with a STAT1 activator. Conclusion: The results of this study show that APP.Score could be an independent prognostic factor for patients with HCC, and that PLA2G7 silencing inhibits cancer cell development and PD-L1 expression. We provide a new perspective and potential target for immune research on antigen presentation in HCC.
Keywords
- liver cancer
- antigen presentation
- antigen-presenting prognostic related genes
- PLA2G7
- APP.Score
Hepatocellular carcinoma (HCC) is a lethal malignancy globally with a low survival rate [1, 2]. It has been estimated that the incidence of HCC has tripled in the last 30 years [3], and the incidence and mortality rates continue to increase [4]. Chemotherapy and immunotherapy are currently the best treatment options for HCC patients [1]. Although preclinical and clinical studies have shown that immune checkpoint inhibitor (ICI) therapy provides survival benefits to a larger population of HCC patients, including those with cholangiocarcinoma [5], most cancer patients still exhibit resistance to ICI blockade [6]. The molecular mechanisms underlying the immune response and evasion in HCC are not fully understood and thus need to be further researched.
There are many predictive biomarkers of immunotherapy in HCC patients, such as
tumor mutation burden, the tumor microenvironment (TME), and T cell inflammation.
However, these markers have limitations that hinder their clinical application
[7, 8, 9]. Antigen presentation is essential for triggering the T cell immune
response, serving as a link between nonspecific and specific immunity [10].
Antigen-presenting cells (APCs), such as dendritic cells (DCs) and macrophages
(MACs), present peptides on major histocompatibility complex class I or II (MHC-I
or MHC-II) to naive T cells (CD8
Currently, bioinformatics analyses such as nonnegative matrix factorization (NMF) clustering, weighted gene co-expression network analysis (WGCNA), random forest (RF) models, and least absolute shrinkage and selection operator (LASSO) have been widely applied to data mining, genomics, proteomics, and other research fields related to disease [15, 16, 17, 18]. NMF clustering, a matrix decomposition method, has been widely used in prognosis-related gene studies of various cancers [15, 19]. For example, Gao et al. [16] utilized NMF clustering to analyze m6A RNA methylation regulators, revealing that the methylation-mediated TME regulates intercellular communication in tumor growth and antitumor immune regulation processes. WGCNA can describe the interaction between genes by constructing a gene co-expression network. For instance, Tian et al. [17] identified core modules and central genes associated with breast cancer using WGCNA. RF, an ensemble learning algorithm, can be used to screen prognostic markers for various cancers such as prostate, breast, and lung cancers [20, 21, 22]. LASSO is a linear regression model and bioinformatics algorithm commonly used for data analyses in cancer. For example, Kang et al. [23] used a LASSO model combined with other indicators to predict lymph node metastasis in patients with T1 rectal cancer.
Here, we screened the APPGs of HCC using public datasets and bioinformatics analysis to predict the prognosis of patients with HCC. Furthermore, we conducted preliminary in vitro experiments to explore the impact of key APPGs on HCC cells. Our study lays the foundation for HCC diagnosis and immunotherapy.
The Cancer Genome Atlas Liver Hepatocellular Carcinoma (TCGA-LIHC) and Gene set enrichment 14520 (GSE14520) datasets were obtained from TCGA (https://tcga-data.nci.nih.gov/tcga/) and Gene Expression Omnibus (GEO, https://www.ncbi.nlm.nih.gov/geo/) datasets. APPGs were obtained through ImmPort (https://www.immport.org/home).
Based on the TCGA-LIHC dataset, prognosis-related APPGs were obtained by
univariate Cox analysis (p
The R package limma (version 3.6.1) was utilized to process the processing of gene expression matrix data. With the addition of APP.Score, immune scores and immune cell infiltration were assessed by the ESTIMATE algorithm and TIMER database, respectively [24, 25]. In addition, we analyzed the expression of immune cell marker genes with different APP.Scores of LIHC samples using the TIMER database. The Gene Set Variation Analysis (GSVA) package was used for analyzing the Kyoto Encyclopedia of Genes and Genomes (KEGG, https://www.genome.jp/kegg/) pathway via GSVA [26]. Additionally, correlation analyses were conducted among prognostic scoring, gene scoring, and functional enrichment pathways. Subsequently, the ClusterProfiler R package was utilized for performing GSE analysis (GSEA) based on the APP.Score.
The mutated genes in the high and low APP.Score groups were analyzed using the “maftools” R package [27]. The copy number variation (CNV) landscape and the assessment of copy number gains or losses at amplified or deleted peaks, was evaluated using GISTIC 2.0 analysis (https://gatk.broadinstitute.org) [28].
The somatic mutations and CNV profiles were collected from the TCGA-LIHC dataset. The drug sensitivity of the high APP.Score and low APP.Score groups was analyzed using the oncoPredict package (version 0.2) [29].
Human normal hepatic stellate cells (LX-2, AW-CNH008; Abiowell Biotechnology
Co., Ltd., Changsha, China) and HCC lines, including HepG2 (AW-CCH024; Abiowell)
and Huh-7 (AW-CCH089; Abiowell), were cultured in a humidified incubator at 37
°C and 5% CO
The six selected genes were validated by quantitative real-time PCR (qRT-PCR)
using a fluorescence qRT-PCR instrument (PIKOREAL96, Thermo, Waltham, MA, USA).
Primer sequences were designed utilizing primer 5 software, with
The cells were lysed, centrifuged, and concentrated. Then the proteins were
separated by electrophoresis and electrotransferred to a nitrocellulose membrane.
The membrane was incubated overnight at 4 ℃ with the following primary
antibodies: killer cell lectin like receptor B1 (KLRB1), PLA2G7, musculin (MSC),
heat shock protein family A (HSPA6), secreted phosphoprotein 1 (SPP1), neutrophil
cytosolic factor 2 (NCF2), programmed death-ligand 1 (PD-L1), phosphoinositide
3-kinase (PI3K), AKT, phosphorylated signal transducer and activator of
transcription 1 (p-STAT1), STAT1, phosphorylated nuclear factor kappa B
(p-NF-
The Cell Counting Kit-8 (CCK-8) assay was used to measure cell proliferation. Cells were separately cultured for different time points (12, 24, 48 h) and then added to medium containing 10% CCK-8 (NU679, DOJINDO Laboratories, Kumamoto, Japan). The cells were incubated at 37 ℃ for an additional 4 h, and their optical density values were analyzed at 450 nm.
The cells were digested into single cells, and 200 cells/per well were seeded and maintained for 10 days. After the cells were fixed in 4% paraformaldehyde and stained with crystalline violet, photographs were taken for observation.
As previously described [30], a monolayer of cells was scratched. The cells were rinsed three times with phosphate-buffered saline to remove the scratched cells, and serum-free medium was added. Cell healing was observed under an optical microscope (DSZ2000X, Beijing Zhongyantaihe Medical Instrument Co., Ltd., Beijing, China) at 0 and 48 h.
Matrigel (354262, Becton Dickinson and Co., Franklin, NJ, USA) that had been
prediluted was added to the upper chamber, followed by the addition of a cell
suspension of 2
Cell apoptosis was detected using an apoptosis detection kit (KGA1030, KeyGEN BioTECH, Jiangsu, China) through the instructions. After incubation, the results were immediately evaluated using FCM (A00-1-1102, Beckman, Brea, CA, USA).
Cells were fixed, permeabilized, and closed. Then cells were incubated overnight at 4 °C with primary antibody against PD-L1 (1:50, 28076-1-AP, Proteintech, Chicago, IL, USA), followed by incubation for 90 min at 37 °C with anti-rabbit IgG secondary antibody (1:200, SA00013-4, Proteintech). Finally, the cell nuclei were stained and visualized under a fluorescence microscope (BA210T, Motic Microscopes, Chautauqua County, NY, USA).
We conducted our statistical analysis and data visualization by utilizing R version 3.6.1 along with the ggplot2 package. Additionally, for variables that were not normally distributed, we employed both Wilcoxon and Kruskal-Wallis tests as part of our analytical approach. To calculate correlation coefficients, we used Pearson correlation. To generate and display survival curves for our subgroups, we used the Kaplan-Meier method. All of our tests were two-sided. To determine statistical significance, we used GraphPad Prism software package version 8.0 to perform analysis of variance (ANOVA) or unpaired Student’s t tests. Statistical significance was determined by a p-value less than 0.05.
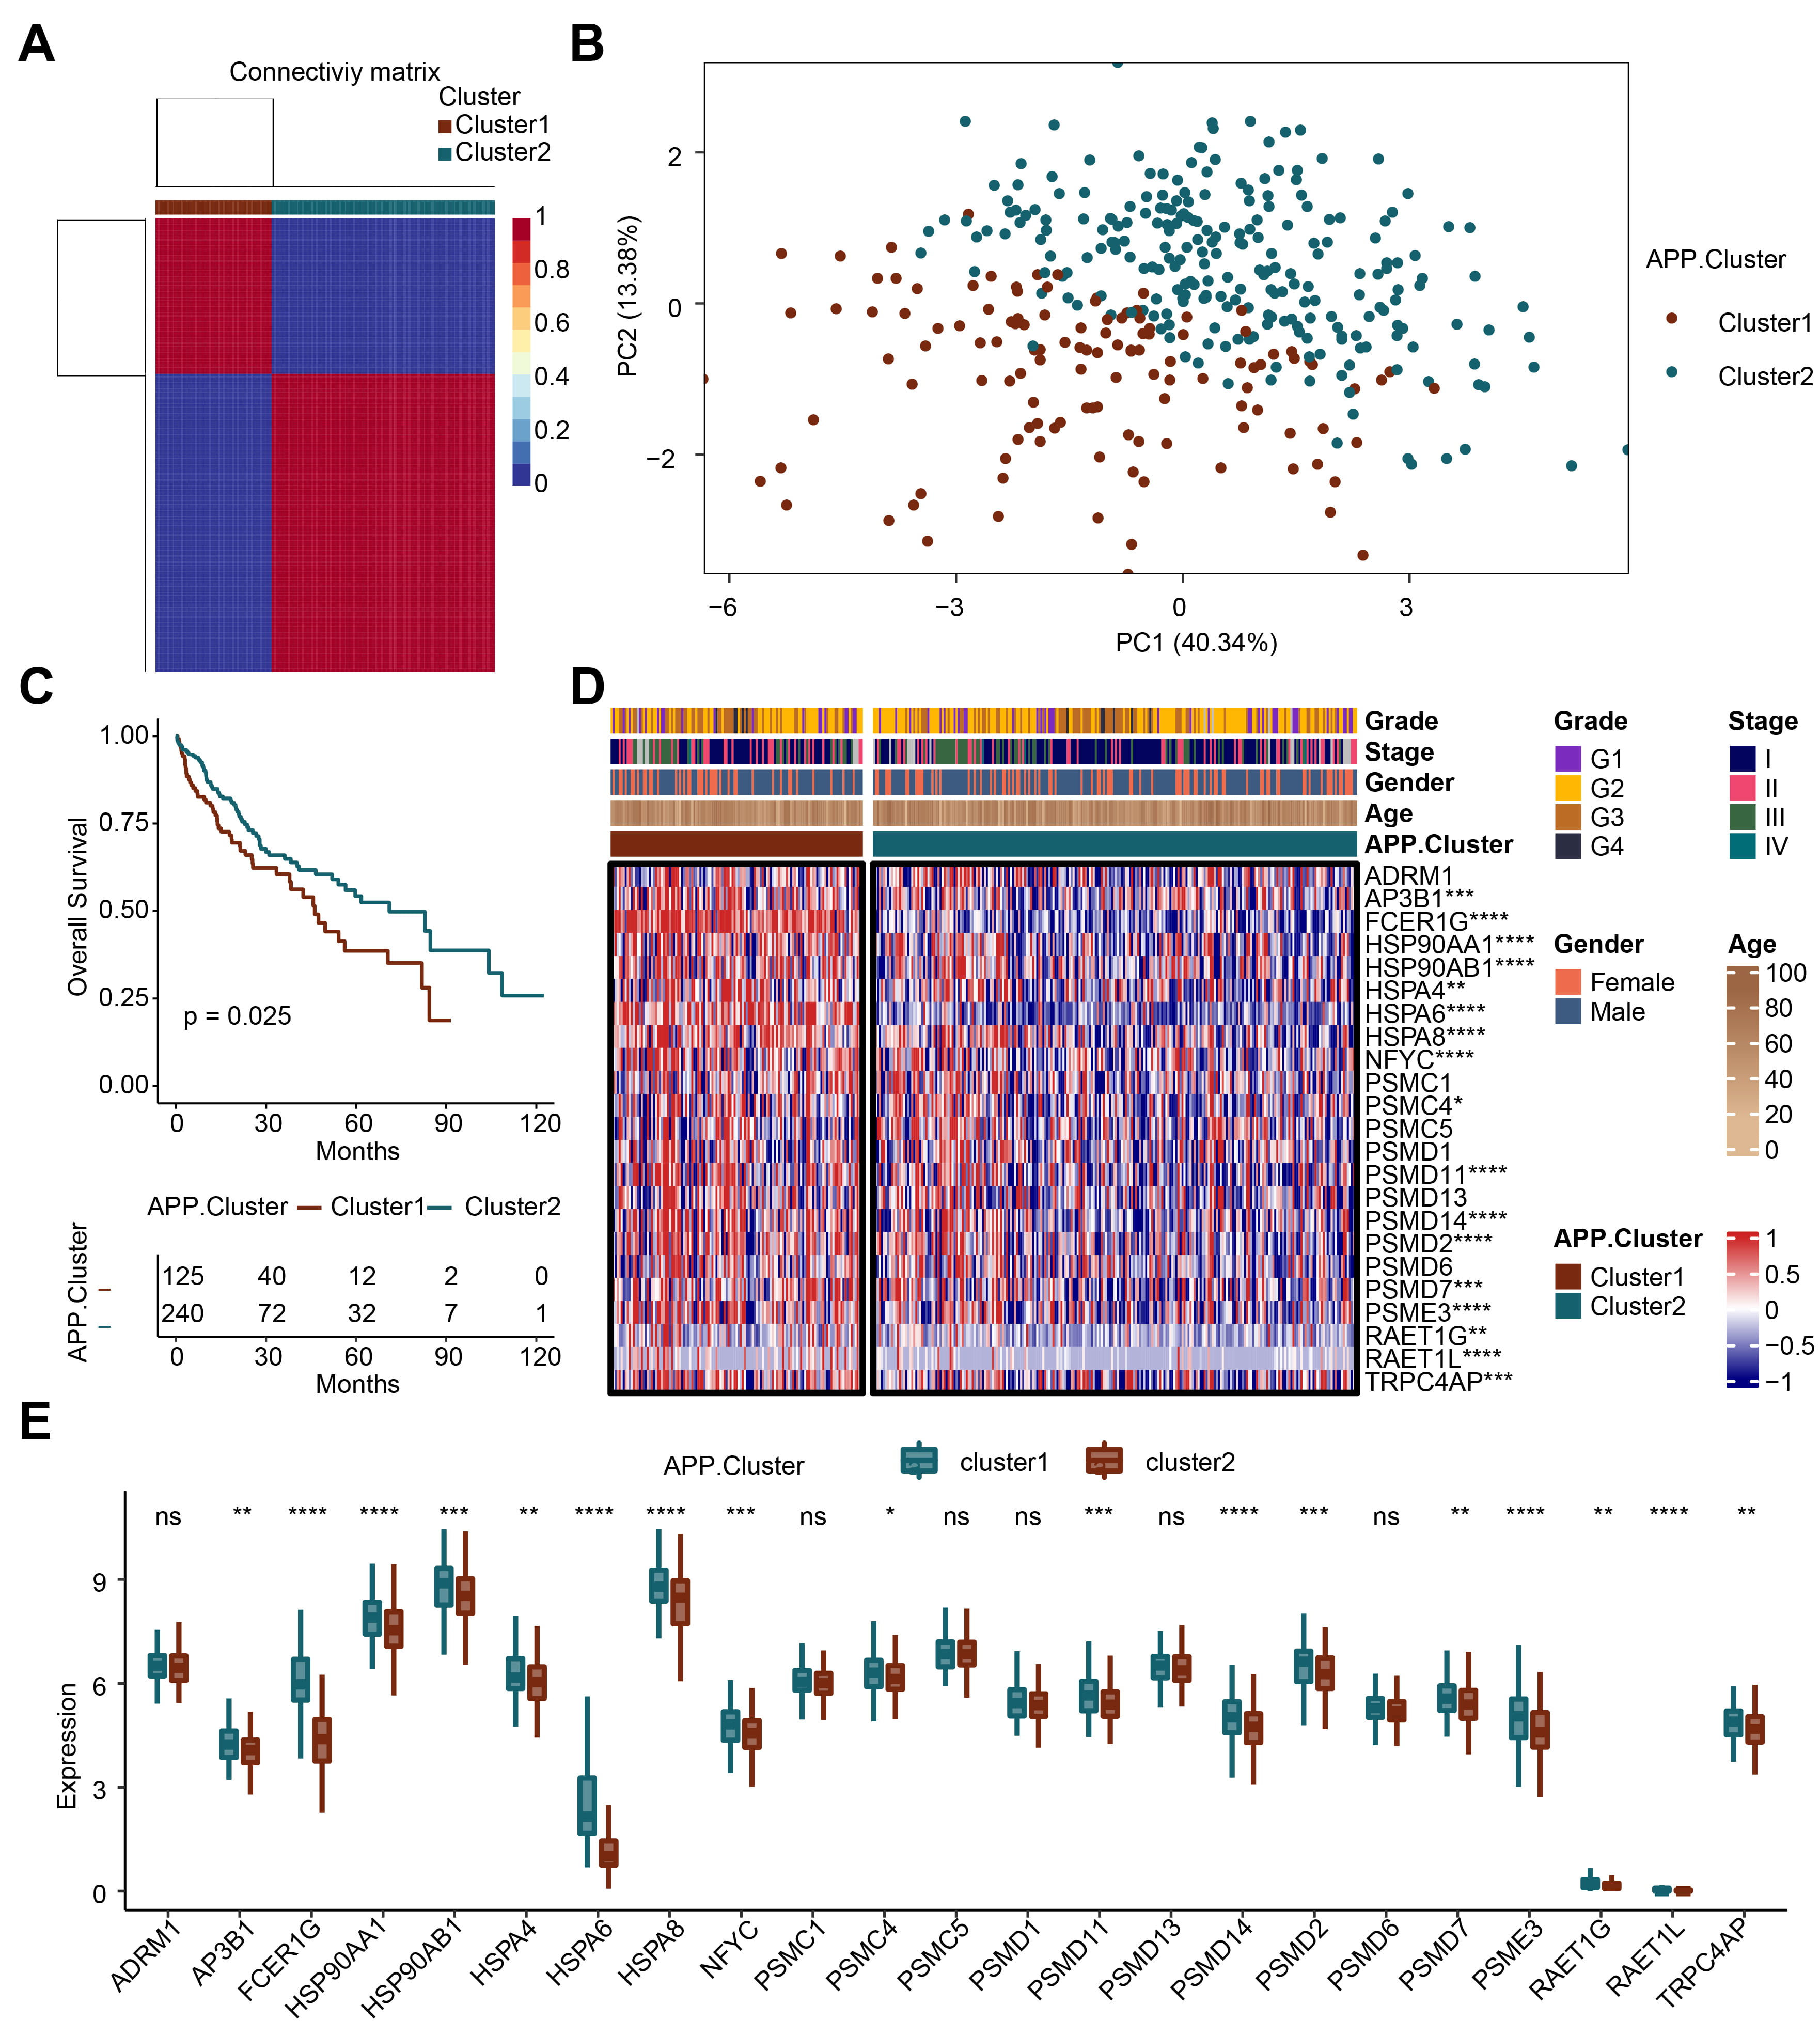
Based on the 23 APP genes, we obtained two genotypes through cluster analysis: APP cluster 1 and APP cluster 2 (Fig. 1A). The principal component analysis plot showed that APP cluster 1 and APP cluster 2 had good dispersion (Fig. 1B). We conducted survival analysis on the two clusters. When the survival rate was 0.5, the survival time of cluster 2 was longer than that of cluster 1 (Fig. 1C). Subsequently, the differential expression of the 23 APP genes in cluster 1 and cluster 2 was analyzed (Fig. 1D,E). The results showed that compared with cluster 1, 17 genes including adaptor-related protein complex 3 subunit beta 1, Fc Fragment of IgE Receptor Ig (FCER1G), HSP90AA1, HSP90AB1, HSPA4, HSPA6, HSPA8, nuclear transcription factor Y subunit gamma, proteasome 26S subunit ATPase 4, proteasome 26S subunit, non-ATPase 11 (PSMD11), PSMD14, PSMD2, PSMD7, proteasome activator complex subunit 3, retinoic acid early transcript 1G (RAET1G), RAET1L, and transient receptor potential cation channel, subfamily C, member 4 associated protein were downregulated in cluster 2. The above results reveal that the APP-related genotyping analysis is reasonable.
 Fig. 1.
Recognition of antigen-presenting prognostic (APP)-related
genotyping. (A) Cluster analysis. (B) Principal component analysis (PCA) analysis. (C) Survival analysis. (D)
Heatmap. (E) Bar plot. *p
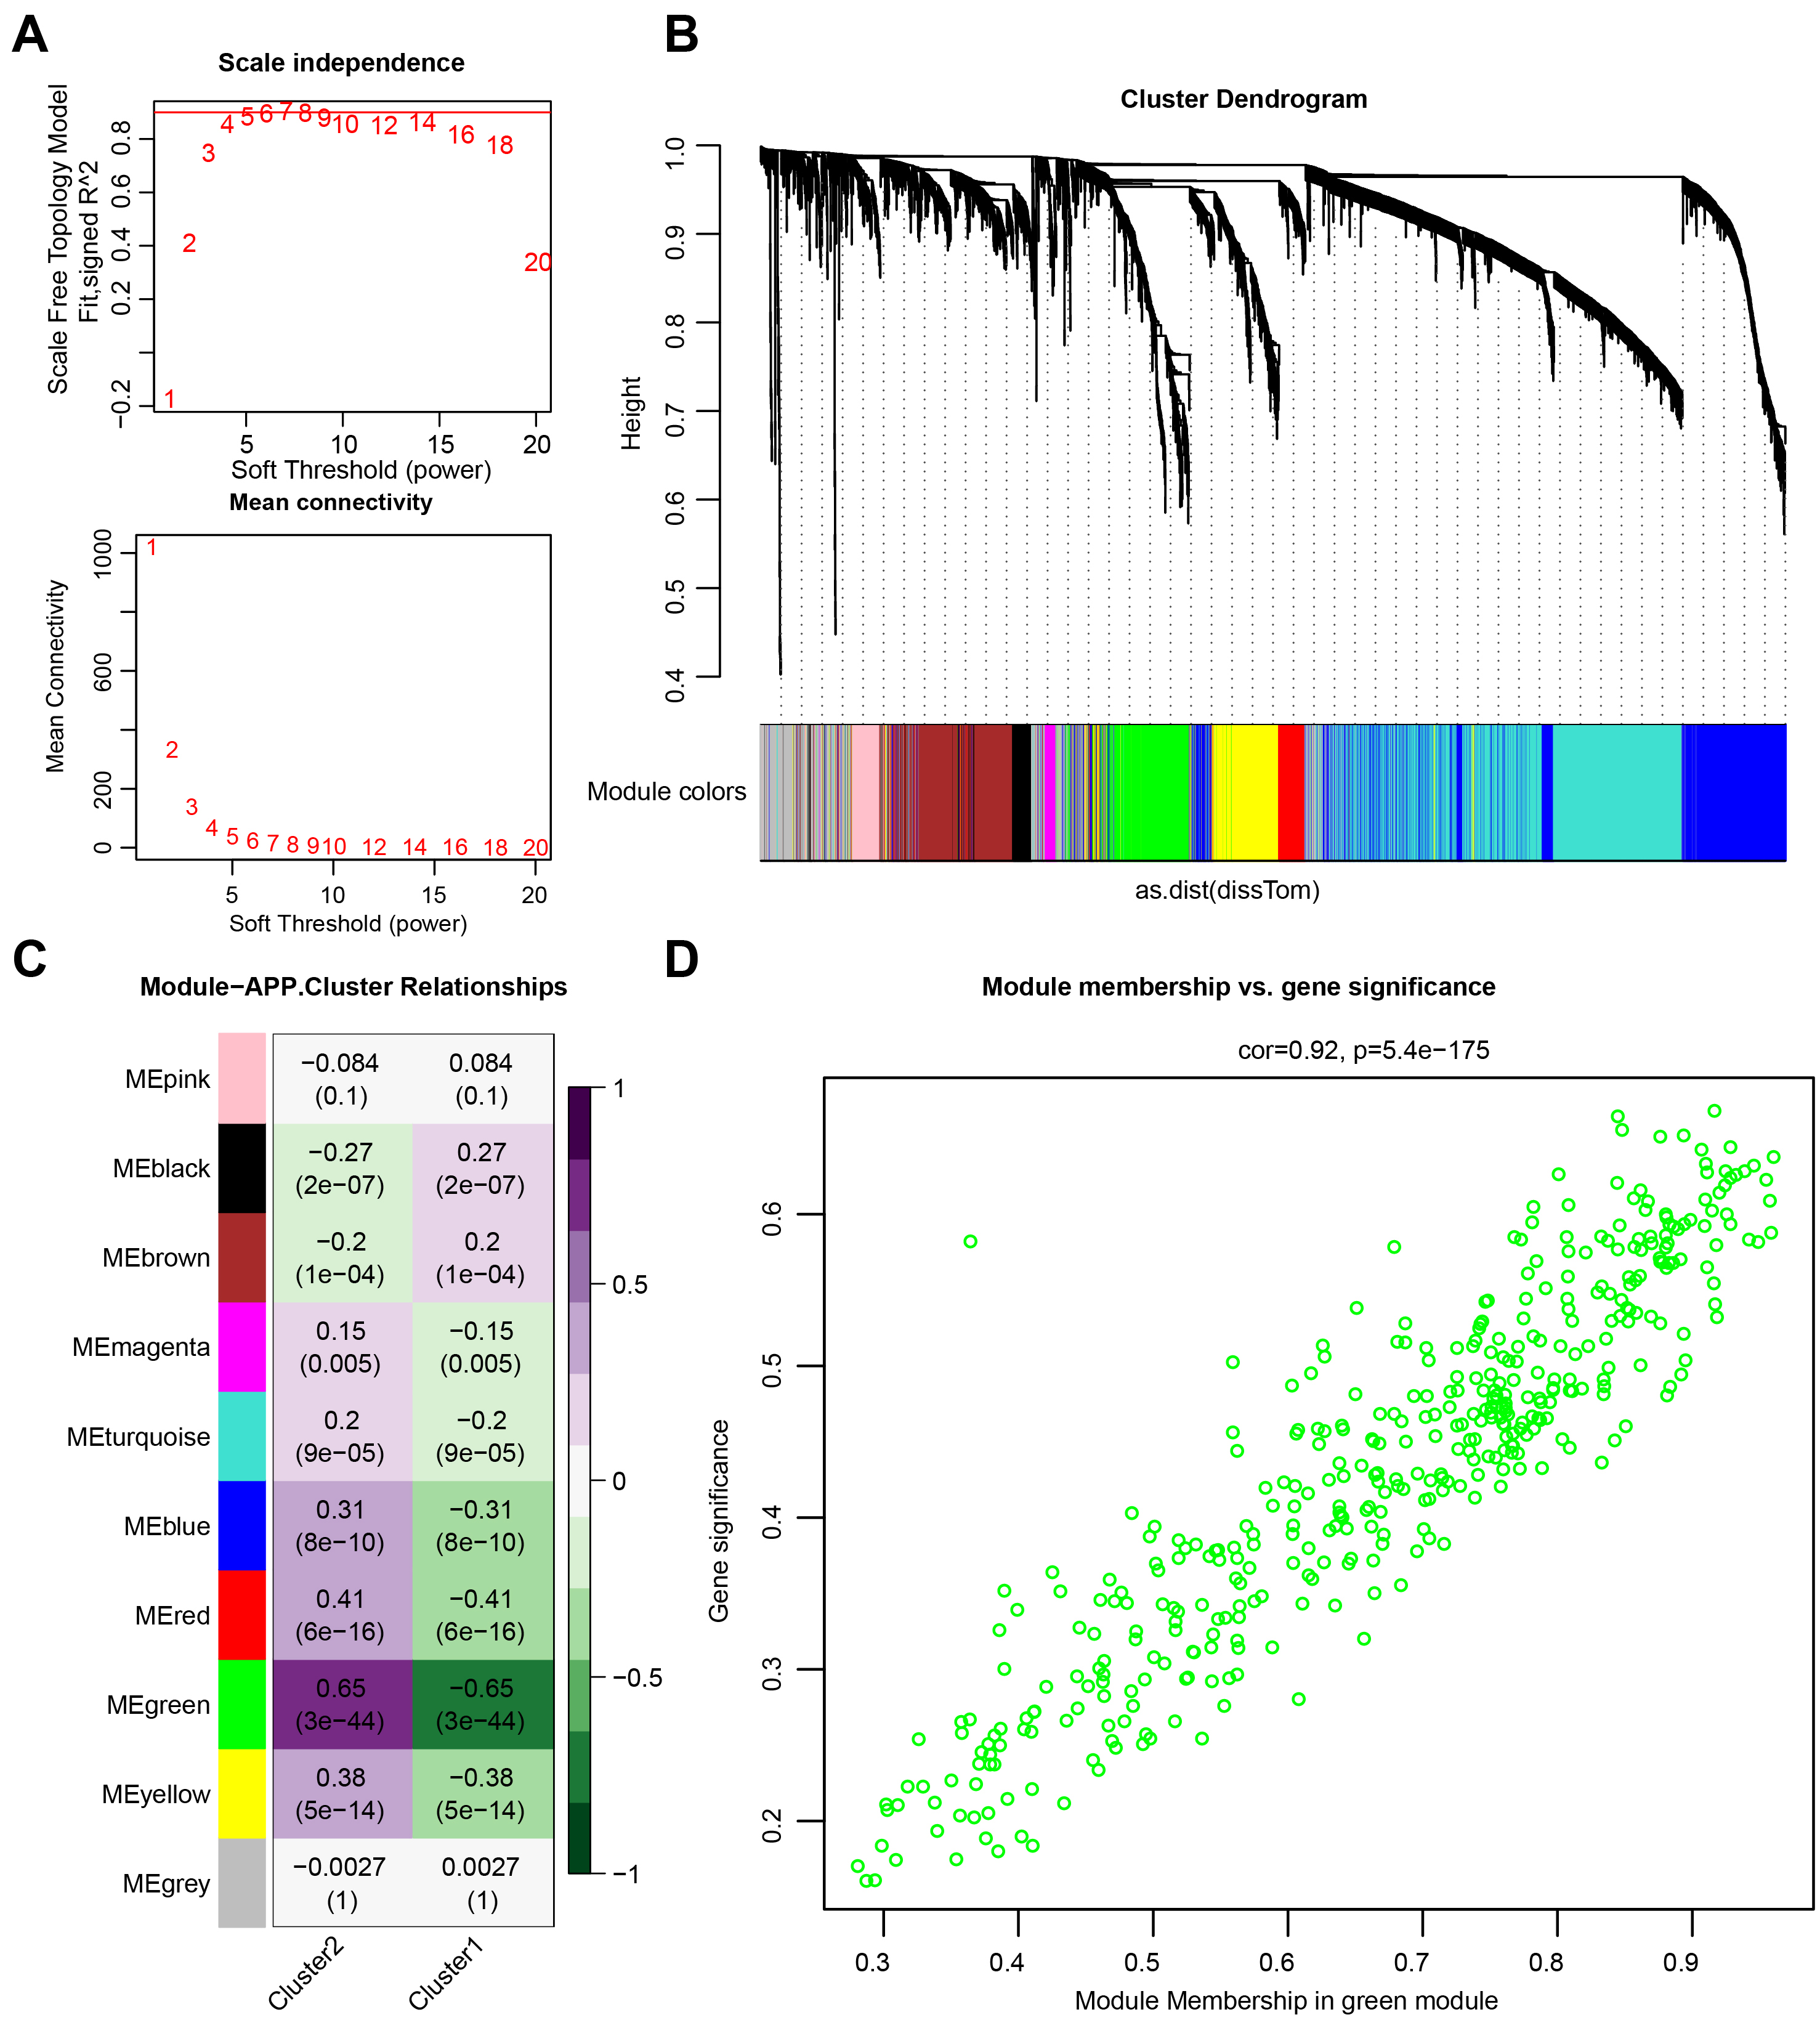
The minimum soft threshold value for building a scale-free network was 5 (scale-free fit index = 0.9). Therefore, 5 was chosen as the optimal soft threshold value for subsequent analyses. Another Figure showed the network connectivity under soft thresholding power (Fig. 2A). Subsequently, a gene clustering tree was constructed (Fig. 2B). The correlation and significance of different gene modules with cluster 1 and cluster 2 are shown in Fig. 2C. The green gene module exhibited the highest correlation with both cluster 1 and cluster 2. Further analyses revealed a positive correlation between module membership and gene significance (Fig. 2D), suggesting that genes highly related to cluster 1 and cluster 2 were also crucial in the green gene module.
 Fig. 2.
Weighted gene co-expression network analysis (WGCNA). (A) Network topology analysis. (B) Module clustering tree. (C) Phenotypic and module correlation plot. (D) Correlation analysis between genes and phenotypes in modules.
Subsequently, 39 genes were obtained by performing univariate analysis on the
genes in the green module (Fig. 3A). Nine significant genes, including
KLRB1, NCF2, PLA2G7, MSC, HSPA6, NPL, FCER1G, SPP1, and
FABP5P7, were obtained through further RF analysis (Fig. 3B). Then a
LASSO model was constructed. Seven genes, including KLRB1, NCF2, PLA2G7,
MSC, HSPA6, SPP1, and FABP5P7, were selected. Finally, the APP.Score
was obtained by calculating the formula (APP.Score = –2.2047
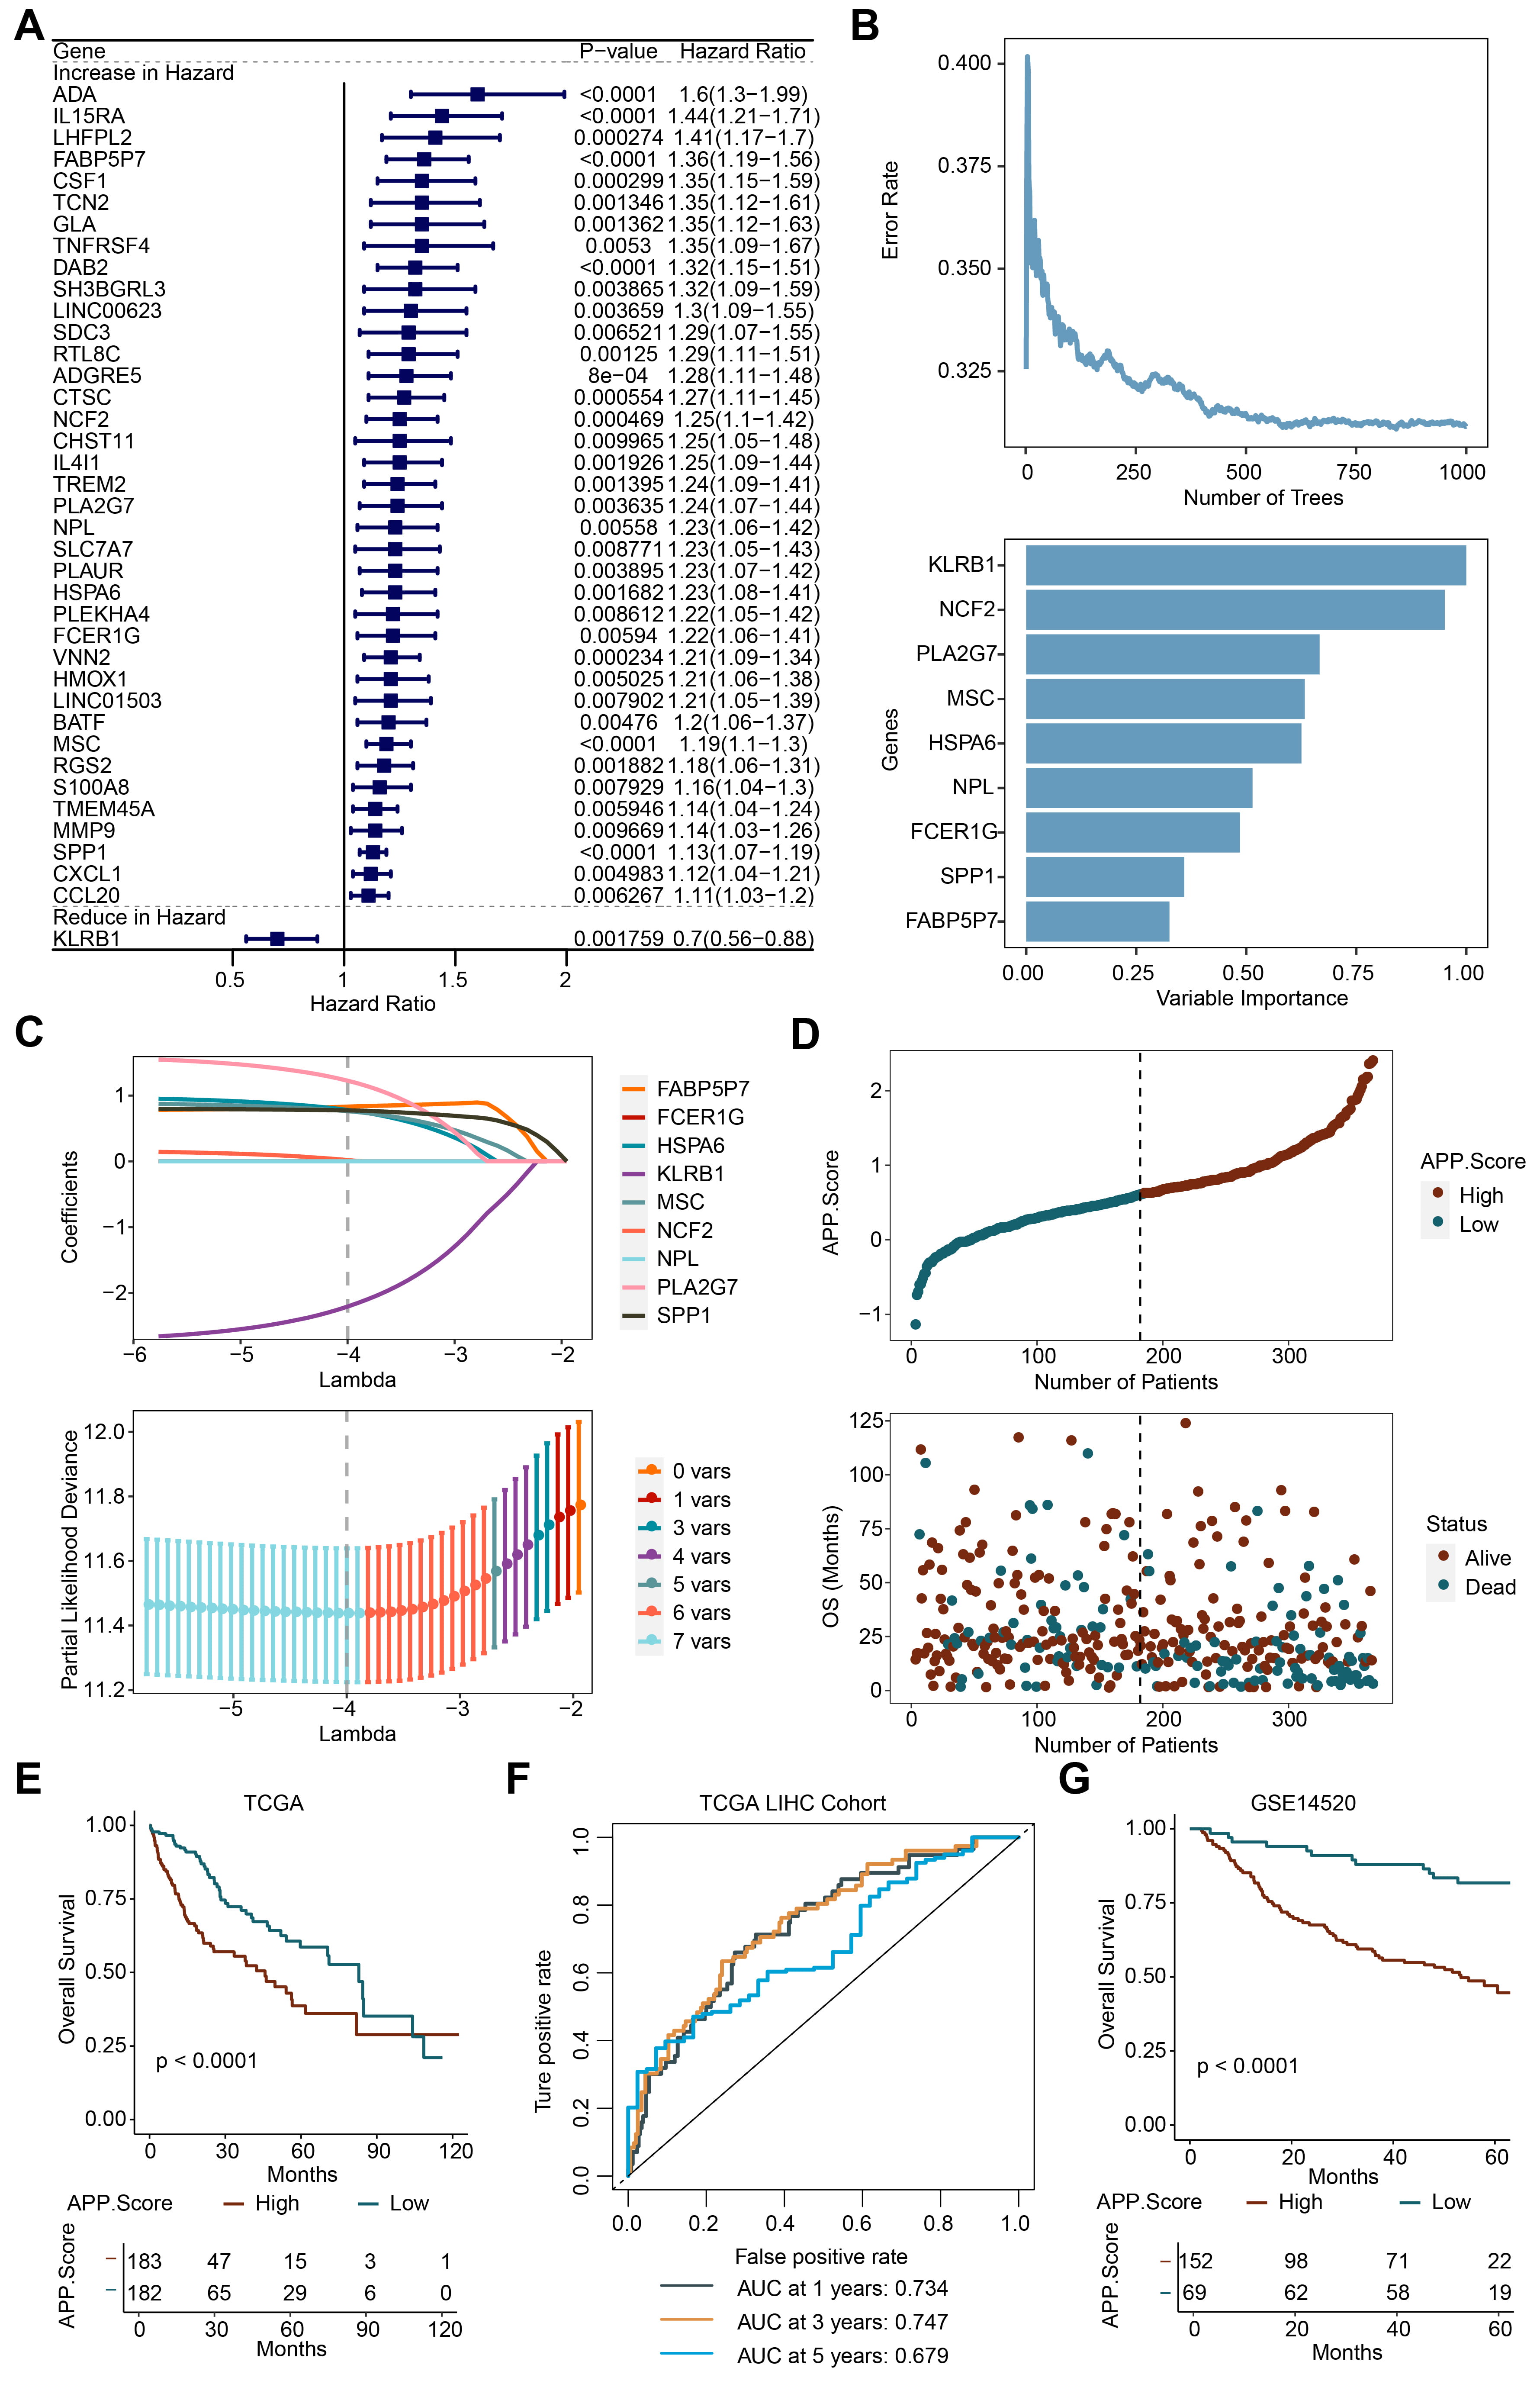 Fig. 3.
APP.Score was a risk factor for Liver Hepatocellular Carcinoma (LIHC). (A) Univariate analysis. (B) Random forest (RF). (C) Lasso analysis. (D) Risk evaluation of APP.Score. (E) The Cancer Genome Atlas (TCGA) survival analysis. (F) Receiver operator characteristic (ROC) curve. (G) GSE14520 survival analysis.
Supplementary Fig. 2A shows that with the increase in APP.Score, the
expression of KLRB1, NCF2, PLA2G7, MSC, HSPA6, SPP1, and
FABP5P7 was significantly increased. With the increase in APP.Score,
stromal score, immune score, estimate score, B cells, CD4
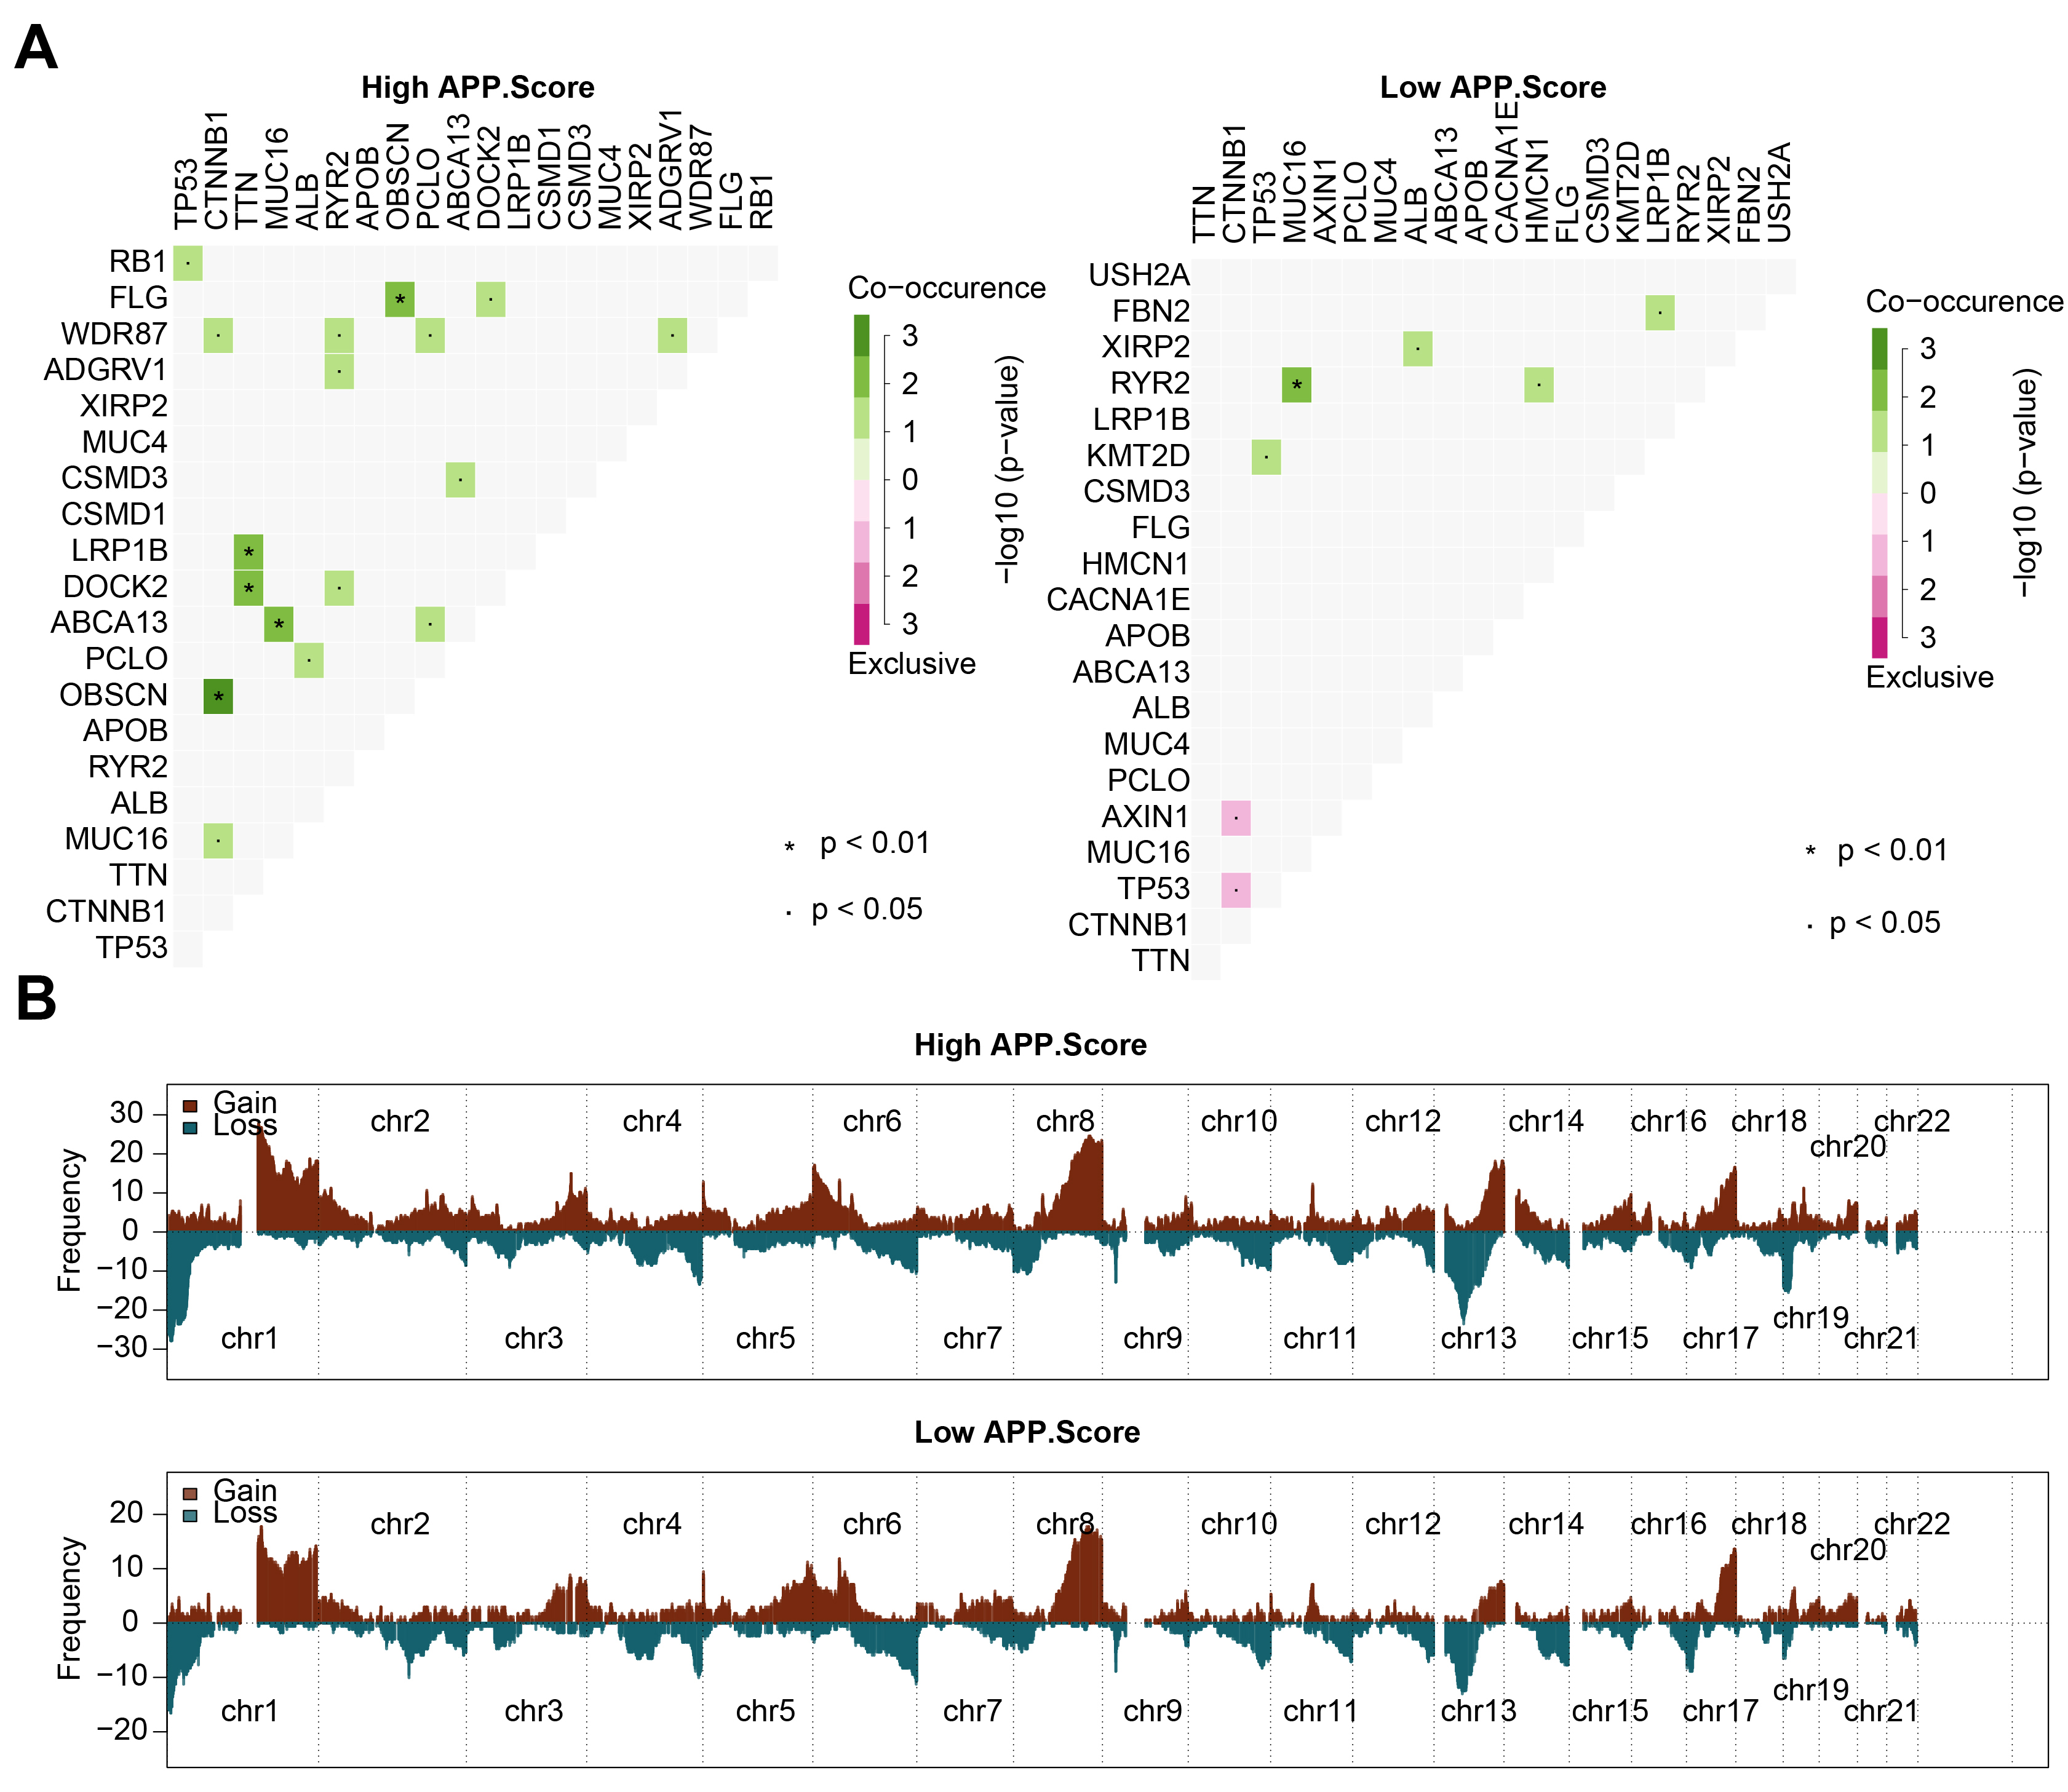
We further analyzed the correlation of mutated genes in the high and low
APP.Score groups. In the high APP.Score group, tumor protein p53 (TP53)
and retinoblastoma 1 (RB1) might have co-occurring mutations;
 Fig. 4.
Mutation and copy number variation (CNV) analysis. (A) Correlation analysis between mutated genes. (B) CNV frequency.
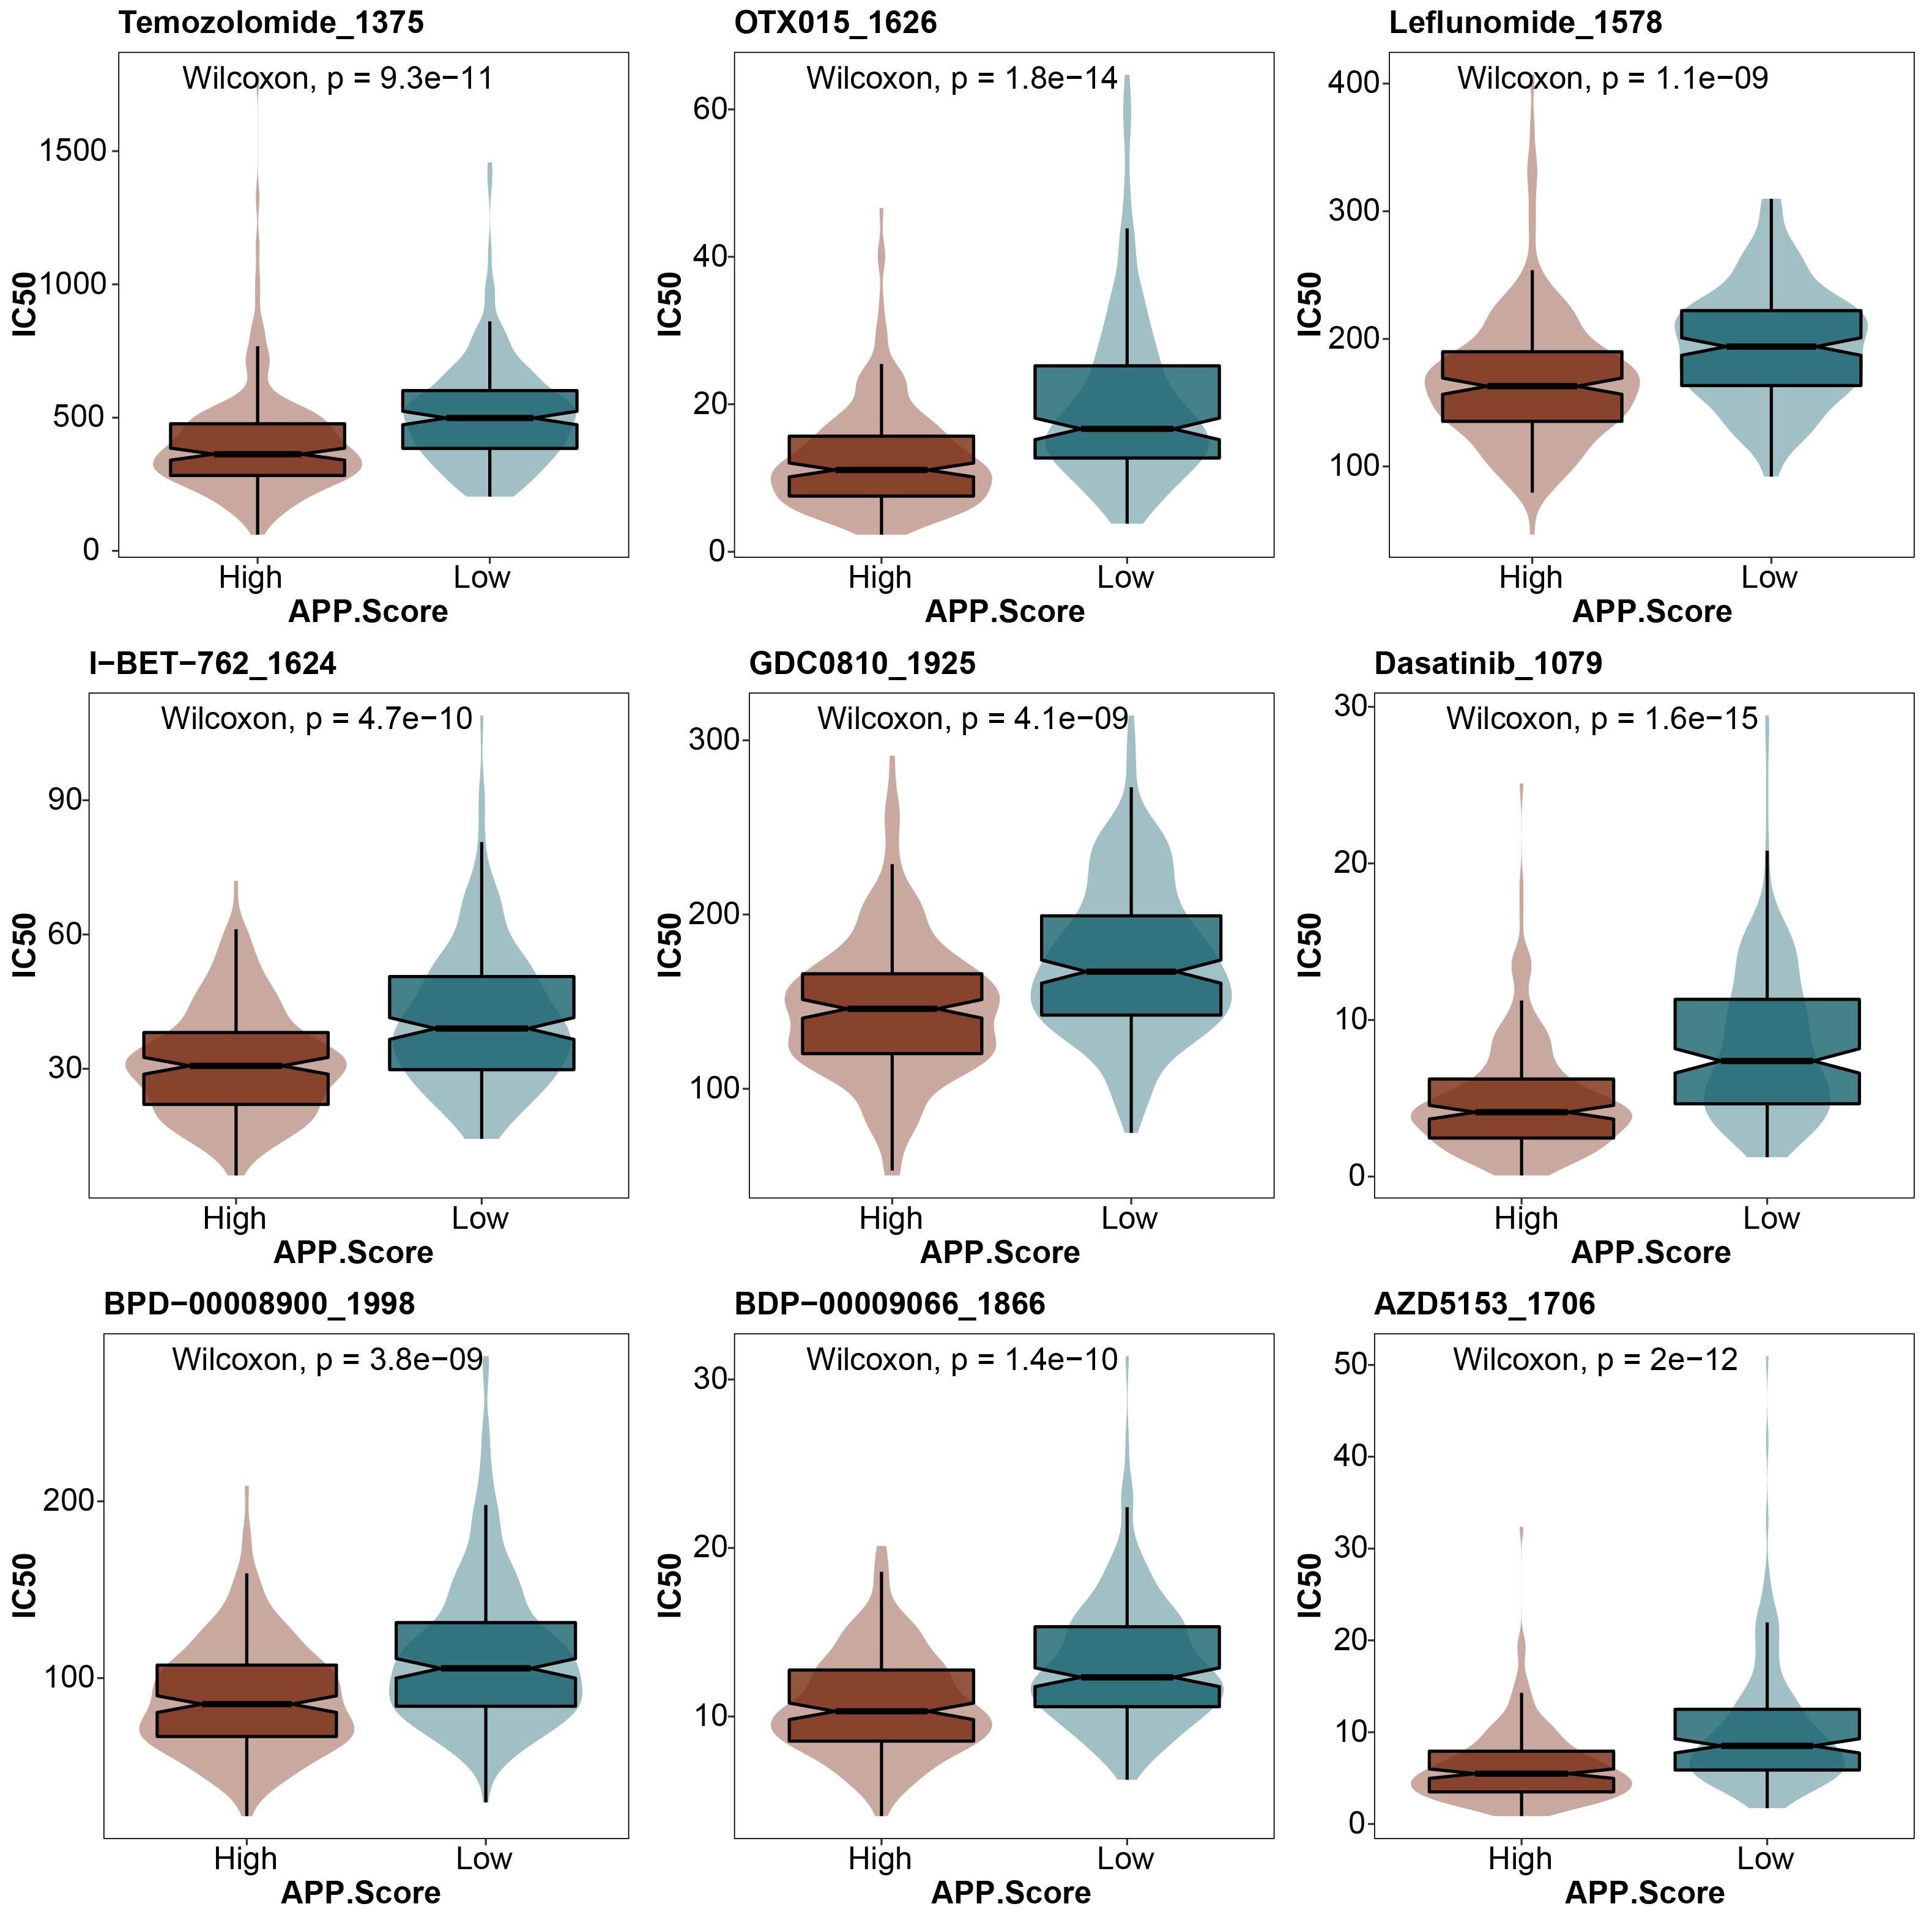
We further analyzed the difference in drug sensitivity between the high and low APP.Score groups. In all of the drug sensitivity analyses, including temozolomide 1375, otx015 1626, leflunomide 1578, i-bet-762 1624, gdc0810 1925, dasatinib 1079, bpd-00008900 1998, bdp-00009066 1866, and azd5153 1706, the drug sensitivity of the high APP.Score group was higher than that of the low APP.Score group (Fig. 5).
 Fig. 5.
Prediction of drug sensitivity.
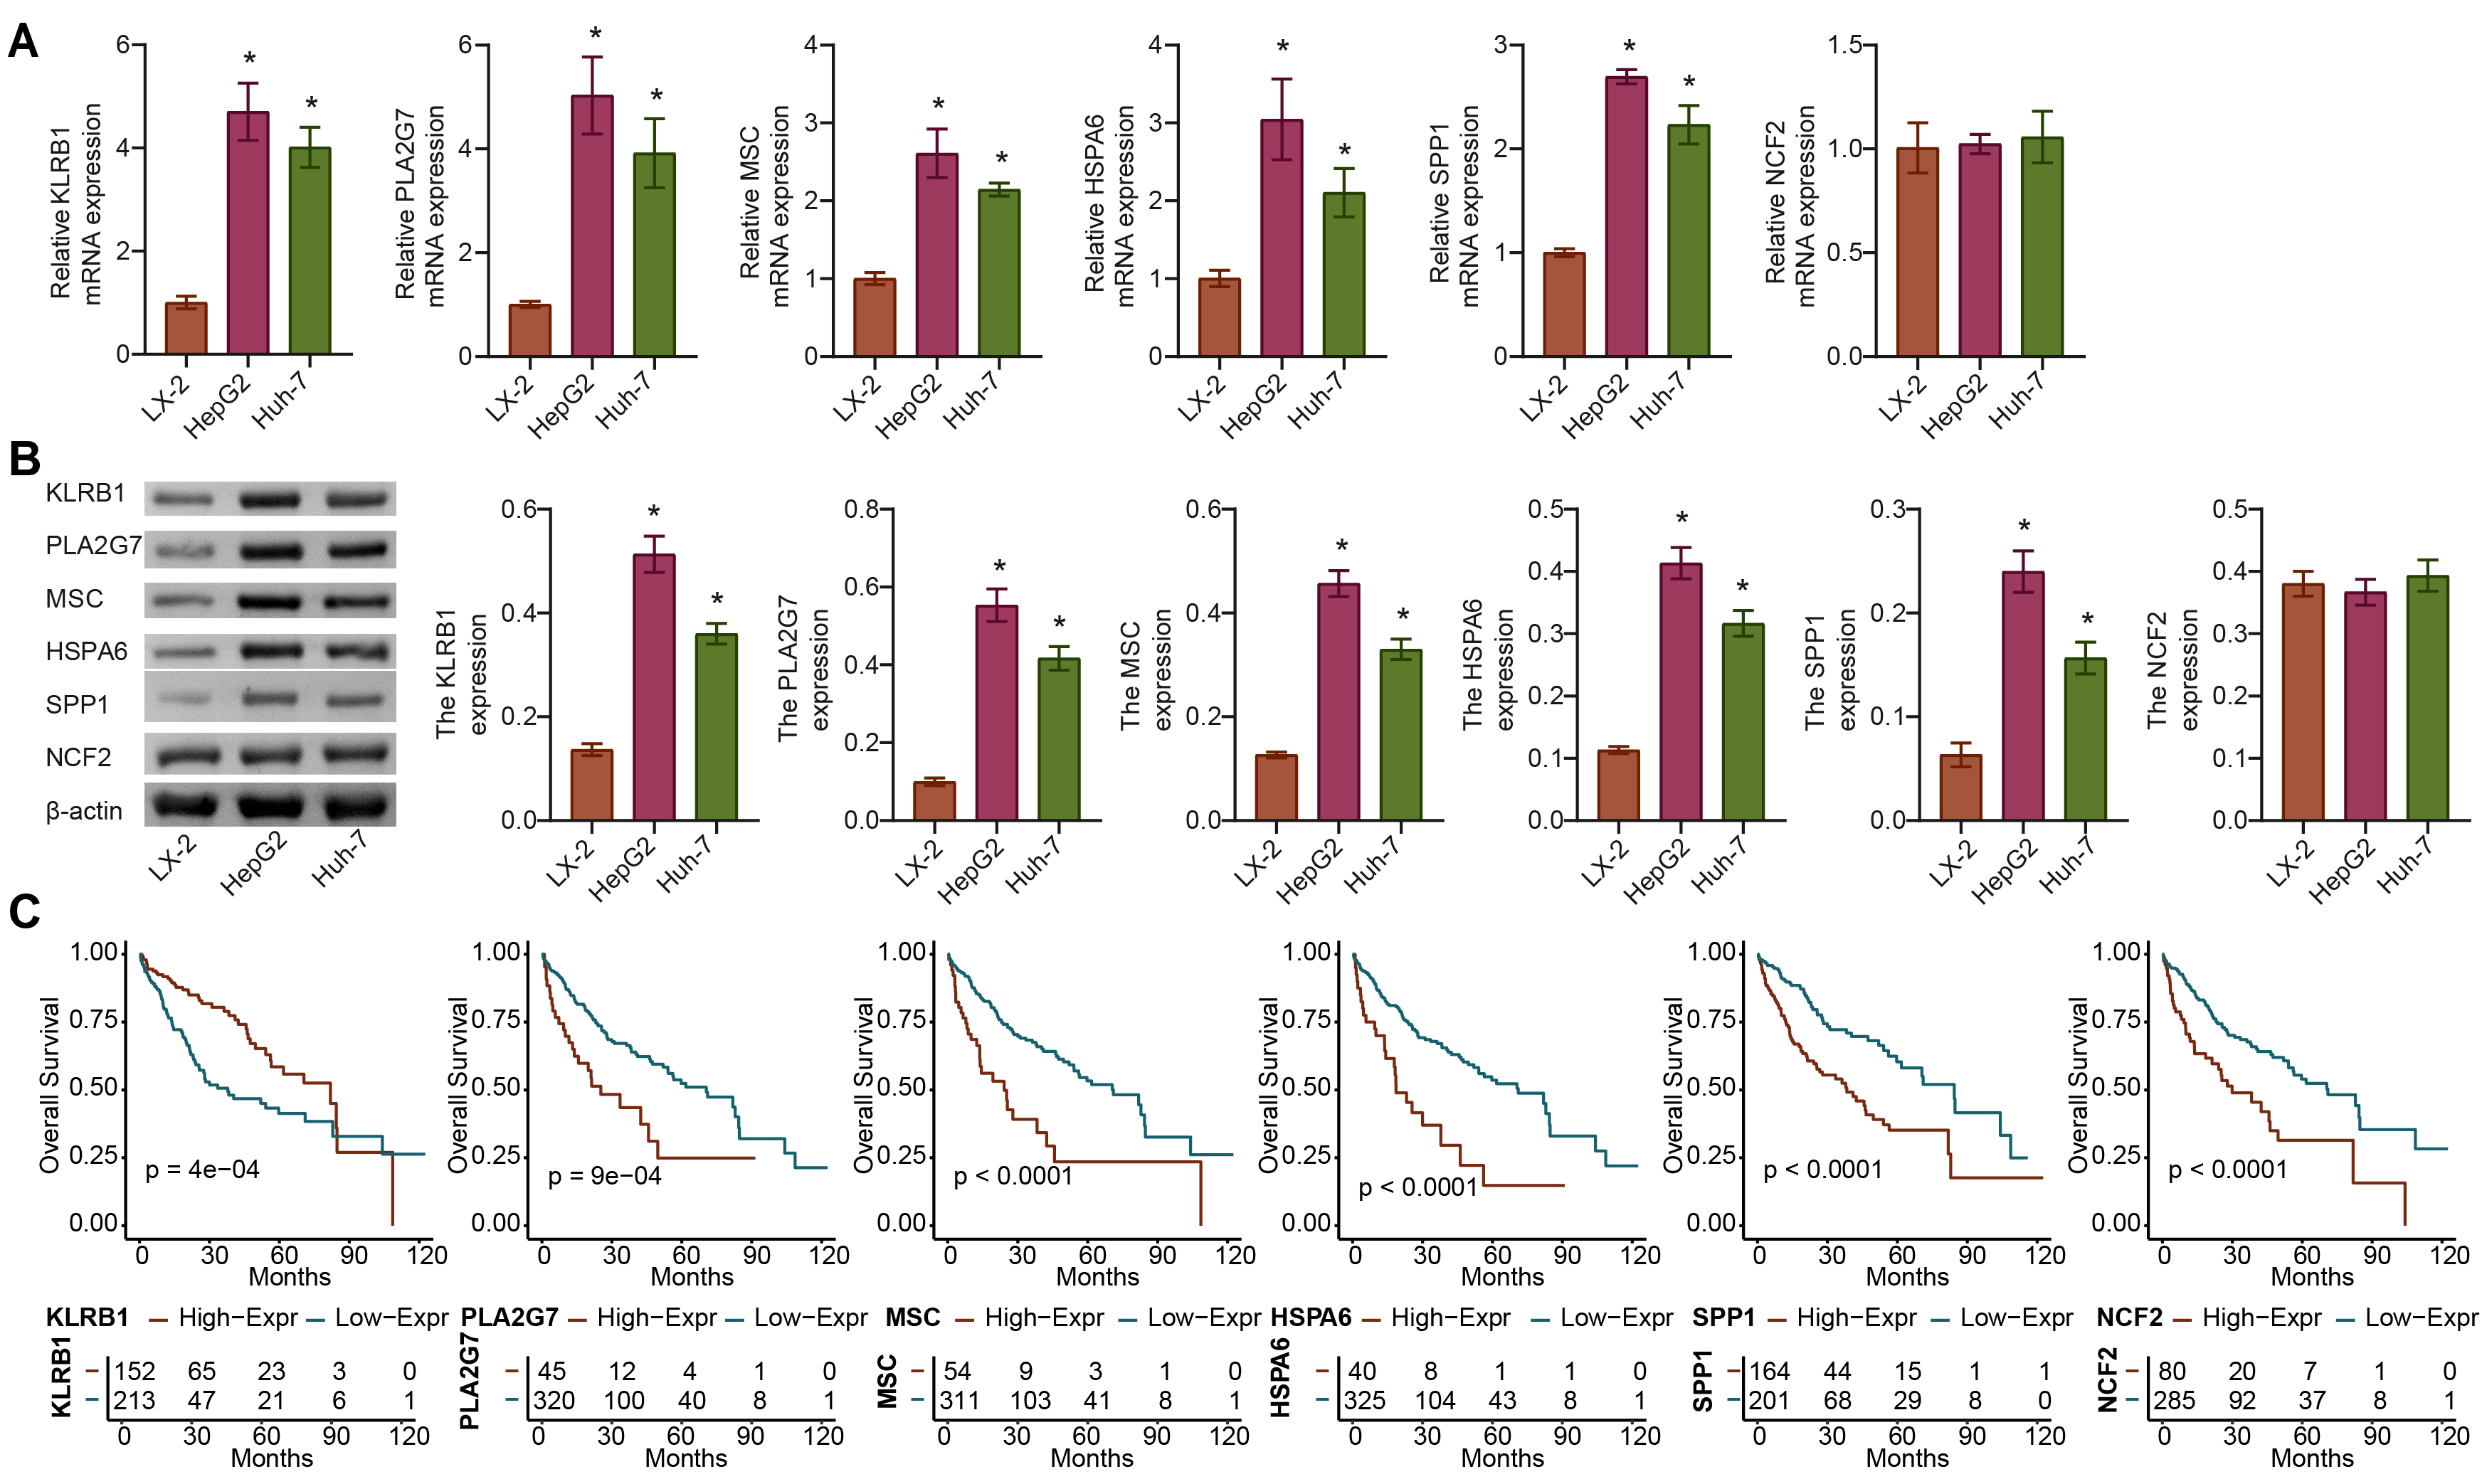
We further analyzed the expression differences in KLRB1, PLA2G7, MSC, HSPA6, SPP1, and NCF2 between the tumor and normal groups using the TCGA-LIHC dataset. Compared with the LX-2 group, the expression of KLRB1, PLA2G7, MSC, HSPA6, and SPP1 but not NCF2 was significantly upregulated in the HepG2 and Huh-7 groups. The difference in KLRB1 and PLA2G7 expression at the gene and protein levels was the most significant (Fig. 6A,B). The OS rate was 0.5, and the survival time of patients with high expression of PLA2G7, MSC, HSPA6, and SPP1 was shorter, whereas that with high KLRB1 expression was longer (Fig. 6C). Therefore, PLA2G7 was selected for further study.
 Fig. 6.
In vitro validation of gene expression of APP.Score.
(A,B) The expression of genes (KLRB1, PLA2G7, MSC, HSPA6, SPP1, and
NCF2) of APP.Score. (C) Survival curves of the six genes (KLRB1,
PLA2G7, MSC, HSPA6, SPP1, and NCF2) used to construct the APP.Score
were analyzed. Analysis of variance (ANOVA). *p
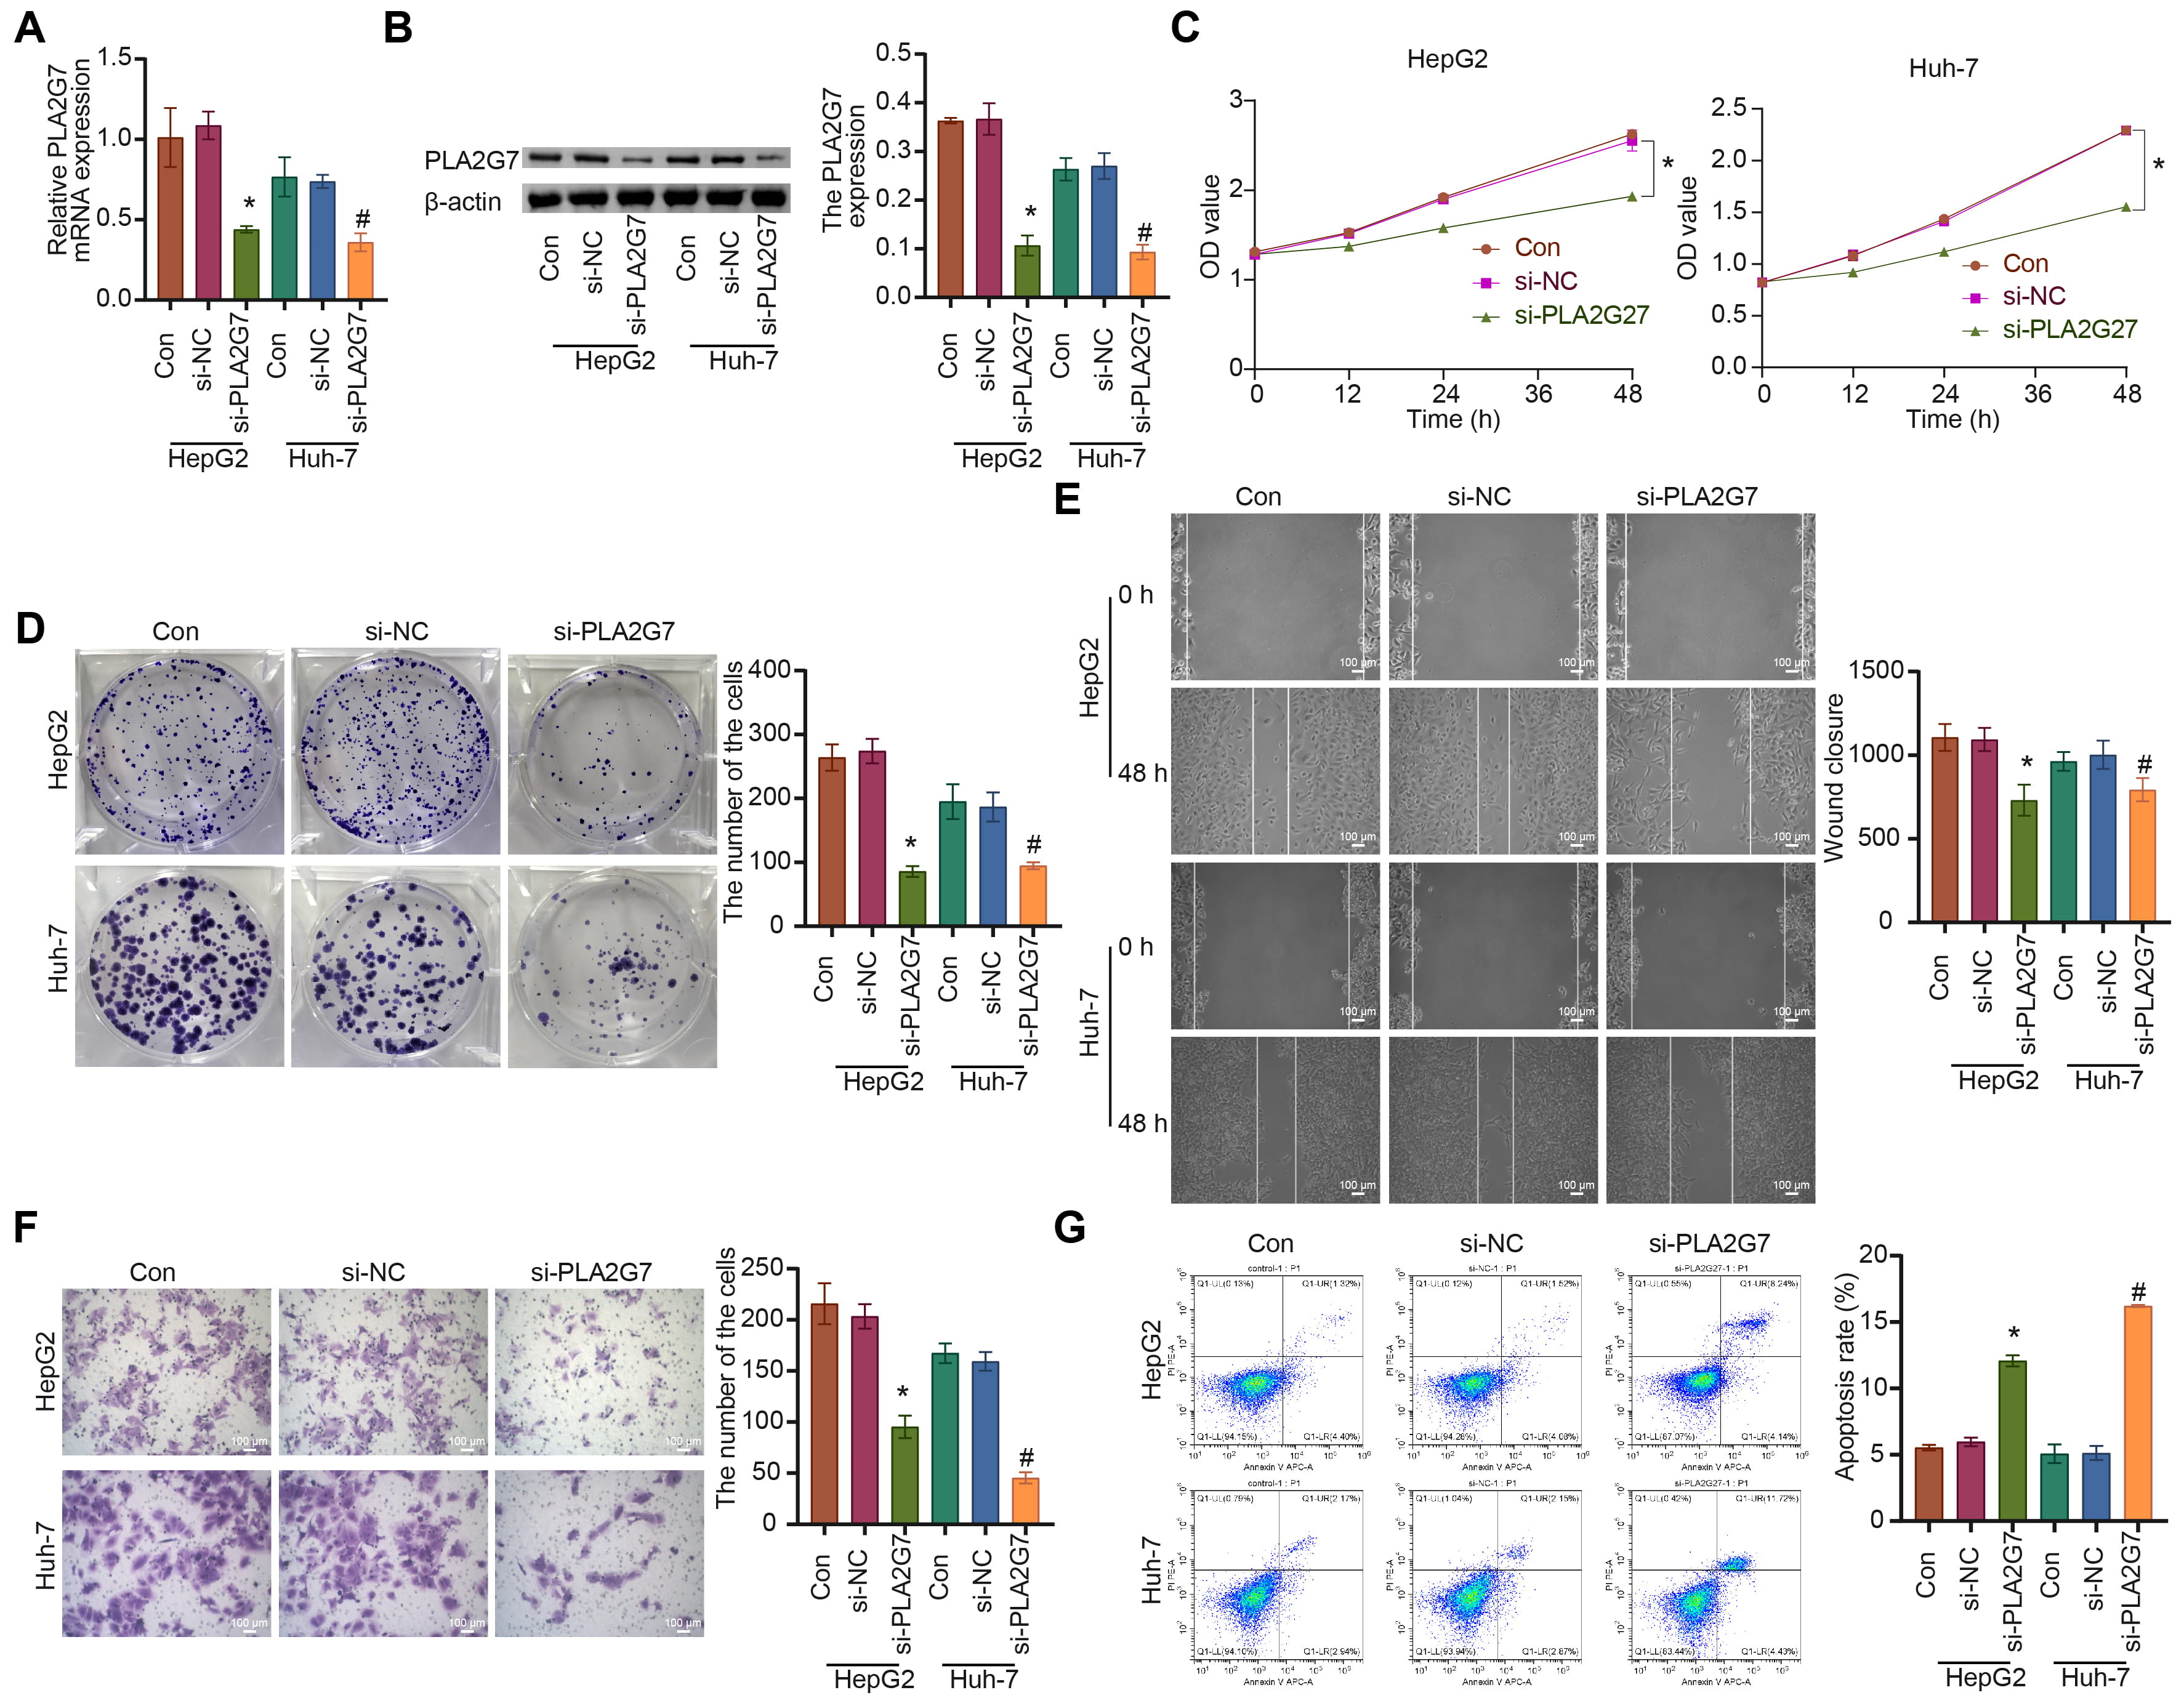
Firstly, PLA2G7 was silenced in HepG2 and Huh-7 HCC cell lines (Fig. 7A,B). Compared to the si-NC group, the cell proliferation, migration, and invasion abilities of the si-PLA2G7 group were suppressed, while the level of cell apoptosis was significantly increased (Fig. 7C–G).
 Fig. 7.
Inhibiting PLA2G7 affects the functions of
hepatocellular carcinoma (HCC) cells HepG2 and Huh-7. (A,B) The expression of
PLA2G7 was detected. (C) The cell proliferation (0, 12, 24, 48 h) was
measured. (D) The cell proliferation ability was analyzed. (E) The cell migration
was measured. (F) The cell invasion was analyzed. (G) The cell apoptosis level
was assessed. ANOVA. *p
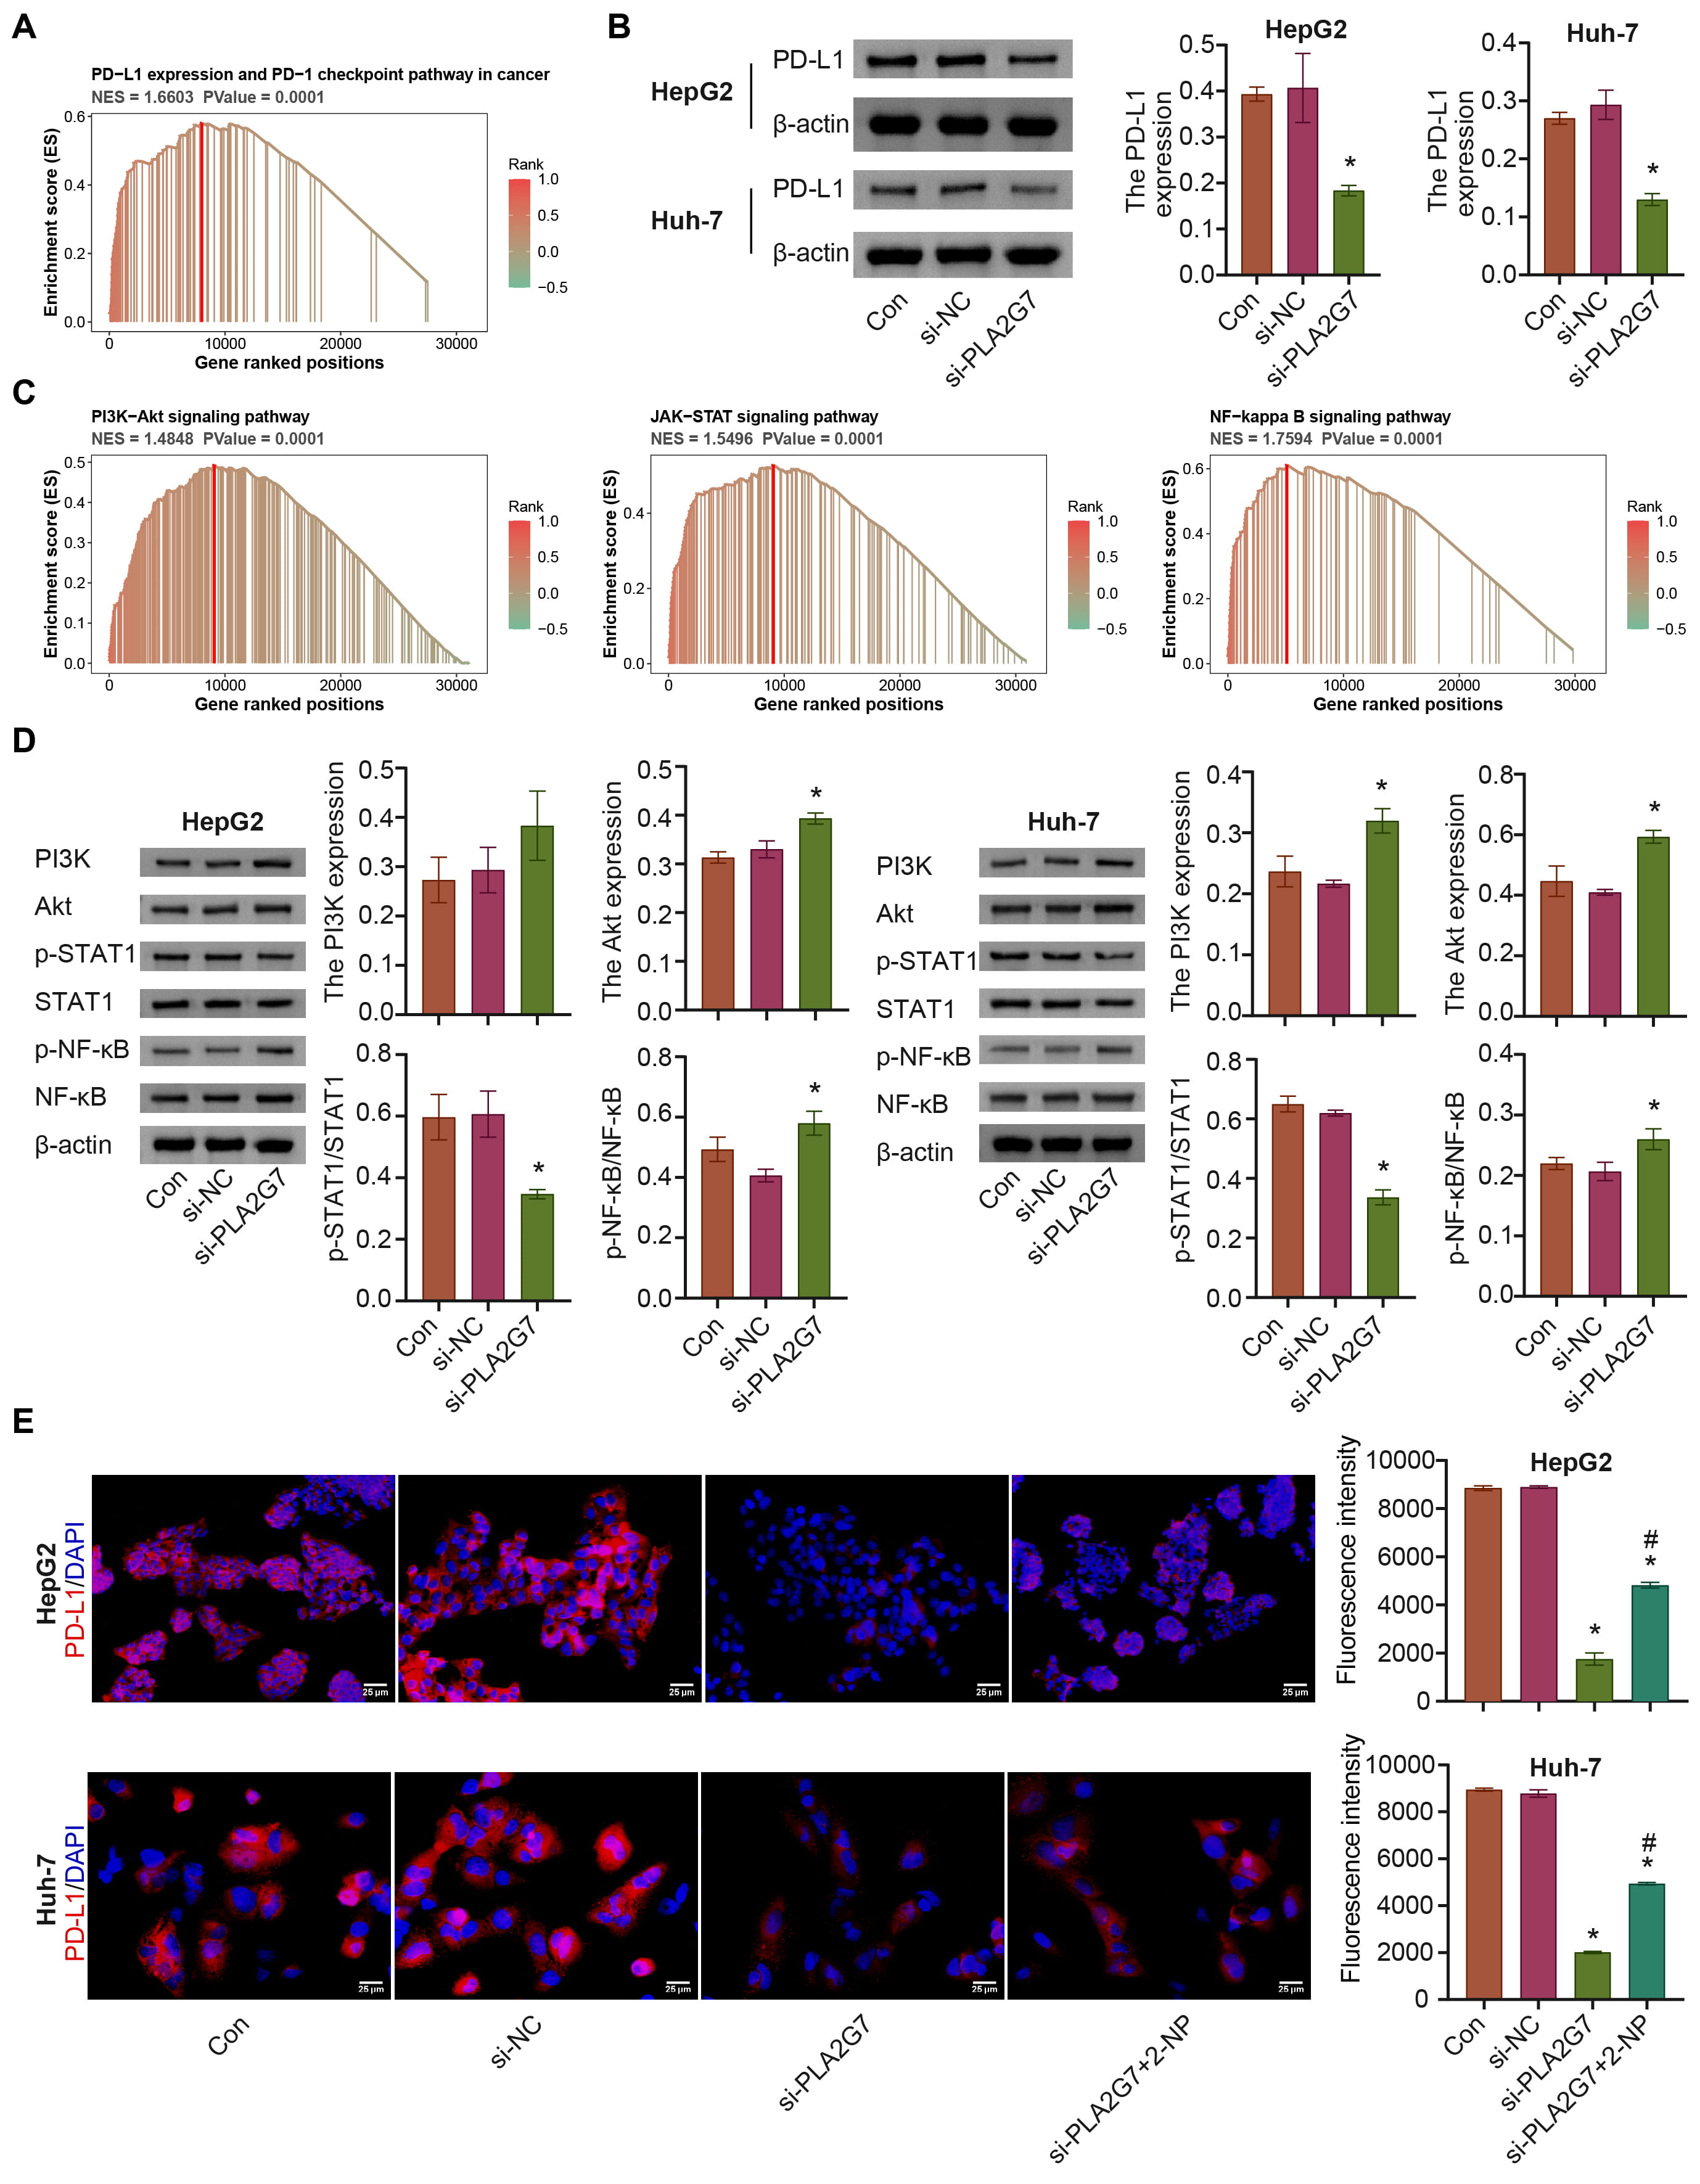
We performed GSEA for PLA2G7, which was enriched for PD-L1 expression and the
PD-1 checkpoint pathway in cancer, and the PI3K/AKT, and Janus kinase/STAT
pathways; si-PLA2G7 inhibited PD-L1 expression (Supplementary Fig. 3 and
Fig. 8A–C). The levels of PI3K, AKT, and p-NF-
 Fig. 8.
PLA2G7 affects PD-L1 expression via STAT1. (A) PLA2G7 was
enriched in the PD-L1 pathway. (B) The expression of PD-L1 was detected. (C)
PLA2G7 was enriched in the PI3K-Akt, JAK-STAT, and nuclear factor kappa B
(NF-
Dysfunctional antigen presentation has been identified as a key factor that causes tumor progression and immune therapy resistance [31]. Antigen presentation gene disruption is one of the reasons for the loss of antigen presentation and a common event leading to immune escape in cancer [13, 32]. This study focused on APPGs, and screened for core APPGs that might affect HCC. Based on this, APP.Score was calculated. APP.Score was positively associated with immune cell infiltration, expression of ICI-related genes, immune and inflammatory pathways, antigen mutations occurring simultaneously, and drug sensitivity, and was negatively correlated with OS. The AUC values were 0.734, 0.747, and 0.679 for survival periods of 1, 2, and 3 years, respectively, indicating that APP.Score may serve as an independent prognostic factor for patients with HCC. SPP1 was obviously overexpressed in HCC in the TCGA-LIHC dataset. With the exception of KLRB1, the high expression group of the five core APPGs (PLA2G7, MSC, HSPA6, SPP1, and NCF2) had lower survival rates than the low expression group. Furthermore, in vitro experiments showed that the significant expression of the five core APPGs (KLRB1, PLA2G7, MSC, HSPA6, and SPP1) was increased in HCC cell lines, and PLA2G7 silencing inhibited the development of cancer cells.
In recent years, several studies have used methods such as WGCNA, RF, and LASSO to reveal the related risk factors and potential mechanisms of immune escape in different tumors [33, 34]. For example, Zhong et al. [33] mainly used WGCNA to reveal that syndecan-1 may be related to immune infiltration and regulate AP. Chen et al. [34] mainly used WGCNA and LASSO methods to find that the high-risk group (based on the hypoxia-related gene risk model) displayed a unique immune-suppressive microenvironment, lower levels of AP, and higher levels of suppressive cytokines. However, the screening of core APPGs and its potential immune function prediction in HCC have been poorly reported. The current study found that seven core APPGs (KLRB1, PLA2G7, MSC, HSPA6, SPP1, NCF2, and FABP5P7) and APP.Score were obtained through NMF clustering, WGCNA, RF, and LASSO methods in HCC.
KLRB1, encoded by the killer cell lectin-like receptor B1 gene, is a
newly reported candidate inhibitor of tumor-infiltrating T cells [35]. KLRB1 is a
potential a potential new immune checkpoint, and may synergize with other ICIs to
regulate the immune microenvironment, thus it can be used to develop new
immunotherapeutically targeted drugs [36]. CD8
It is well known that common APCs include DCs, MACs, and B cells [51].
Dysregulation of APCs is an important cause of tumor immune escape [14]. In
cancer, APCs present peptides on their HLA to naïve T cells (CD8
Mutations or heterozygous loss of MHC-I can also cause damage to the antigen presentation system [55]. Cai et al. [56] found that the most common mutated genes predicting MHC-II neoantigens in lung adenocarcinoma patients included TTN, RYR2, MUC16, and TP53. In breast cancer, TP53 mutation is linked to both a poor prognosis and immune cell infiltration [57]. Long et al. [58] found that TP53 mutation is commonly associated with HCC and negatively impacts its progression and outcome. It also impairs the immune response of patients with HCC. Wang et al. [59] reported that these are the most frequently mutated genes in Chinese patients with HCC include TP53, RB1, CCND1, and AT-rich interactive domain-containing protein 1A. Among these mutated genes, TTN mutation is usually associated with poor immune infiltration and a worse HCC prognosis [60]. Our study found that a high APP.Score might be associated with more gene pairs with a concurrent mutation in tumor antigens (e.g., TP53 and RB1), suggesting that APP.Score might be related to poor prognosis. Zhou et al. [61] reported that MHC-I antigen-presenting enhanced cancer immunotherapy. Enhanced tumor antigen-presenting contributes to synergistic anti-PD-1 therapy for metastatic breast cancer [62]. Our study discovered a positive correlation between APP.Score and expression of ICI-related genes, a positive correlation between APP.Score and drug sensitivity, and a negative correlation between the APP.Score and survival. ROC curve analysis showed the AUC values were 0.734, 0.747, and 0.679 for survival periods of 1, 2, and 3 years, respectively, indicating that the APP.Score may serve as an independent prognostic factor for patients with HCC. In conclusion, APP.Score may help to facilitate the clinical management of HCC.
Activation of STAT1 promotes PD-L1 expression, enhancing the effect of PD-L1 blockade in a mouse model of lung cancer [63]. STAT1 can bind to the PD-L1 promoter and thus transcriptionally regulate PD-L1 expression [64]. In HCC, activation of STAT1 promotes PD-L1 expression [65]. Our results suggest that si-PLA2G7 may inhibit PD-L1 expression by repressing the STAT1 pathway. Our study identified PLA2G7, a novel regulator of PD-L1, as a potential target for cancer therapy. PLA2G7 may be a novel target for ICI therapy.
Due to the complexity and difficulty of collecting clinical specimens, the expression of the core APPGs in HCC tissue has not been further validated. We did not explore the effects of PLA2G7 on immune cells for the study, which is a limitation of our study. In addition, considering that FABP5P7 is a mostly non-coding pseudo genes [66], we have not yet studied its expression and functional effects in HCC. We plan to study this further in the future.
In this study, a risk scoring model, APP.Score, was successfully constructed based on seven core APPGs in LIHC, namely, KLRB1, PLA2G7, MSC, HSPA6, SPP1, NCF2, and FABP5P7. In vitro experiments showed the significant upregulation of five core APPGs (KLRB1, PLA2G7, MSC, HSPA6, and SPP1) in HCC cell lines, and inhibition of PLA2G7 significantly suppressed cancer cell development and PD-L1 expression. The study provides a new perspective and potential target for immune research on antigen presentation in HCC.
All data found in this study are included in the manuscript or are available upon request by contact with the first author or corresponding author.
QY designed the research study. SG performed the research, and analyzed the data. SG wrote the manuscript. Both authors contributed to editorial changes in the manuscript. Both authors read and approved the final manuscript. Both authors have participated sufficiently in the work and agreed to be accountable for all aspects of the work.
Not applicable.
Not applicable.
This research received no external funding.
The authors declare no conflict of interest.
References
Publisher’s Note: IMR Press stays neutral with regard to jurisdictional claims in published maps and institutional affiliations.