


 , Zuzana Pakanová 1, Filip Květoň 1, Alena Holazová 1, Paras H. Kundalia 1, Peter Baráth 1, Goran Miljuš 2, Olgica Nedić 2, Jaroslav Katrlík 1,*
1 Institute of Chemistry, Slovak Academy of Sciences, 84538 Bratislava, Slovakia
2 Institute for the Application of Nuclear Energy (INEP), University of Belgrade, 11080 Belgrade, Serbia
Abstract
Background: Aberrant glycosylation is a hallmark of cancer and thereby has an excellent potential for the discovery of novel biomarkers. Impairments in the glycan composition of lipoproteins impact their functional properties and can be associated with various diseases, including cancer. This research is still in its infancy; however, it can lead to the development of new diagnostic and disease stratification approaches as well as therapeutic strategies. Therefore, we aimed to evaluate anomalies in O-glycosylation of apolipoprotein C-III (apoC-III) in colorectal carcinoma (CRC) patients’ sera, in comparison with sera from healthy individuals, and assess the disparities of O-glycoforms on apoC-III in CRC. Methods: The choice of patients (n = 42) was based on the same tumor type (adenocarcinoma) and tumor size (T3), without or with inconsiderable lymph node infiltration. Patients with comorbidities were excluded from the study. The control healthy individuals (n = 40) were age- and sex-matched with patients. We used an approach based on the MALDI-TOF MS in linear positive ion mode, allowing simple analysis of O-glycosylation on intact apoC-III molecules in the serum samples directly, without the need for specific protein isolation. This approach enables relatively simple and high-throughput analysis. Results: In CRC patients’ sera samples, we observed significantly elevated apoC-III sialylation. Fully sialylated (disialylated) O-glycans had 1.26 times higher relative abundance in CRC samples compared to controls with a p-value of Mann–Whitney U test of 0.0021. Conclusions: We found altered O-glycosylation of apoC-III in the serum of CRC patients. However, it can be non-specific as it may be associated with another process such as ongoing inflammation. Therefore, to establish it as a potential novel non-invasive biomarker for CRC in suspected patients, further studies interrogating the changes in apoC-III O-glycosylation and the robustness of this biomarker need to be performed and evaluated.
Keywords
- O-glycoprofiling
- apolipoprotein C-III
- glycosylation
- colorectal cancer
- biomarker
- mass spectrometry
Apolipoproteins (apos) primarily are the protein porters hauling lipids and constituting the primary protein partner of lipoproteins. In humans, they form a conglomerate of 10 distinct apos, including ApoA - ApoF, ApoL, ApoM, ApoO, and ApoJ, each of which conjugates with distinct types and titer of lipids, resulting in lipoproteins of various densities. Considering their indispensable role in lipid transport and metabolism, it was intuitive to explore their roles, especially in the aspect of cardiovascular biology and atherosclerotic anomalies [1]. Moreover, links of apos to neurological disorders like Alzheimer’s disease were also discerned [2]. Despite its complicity in the pathophysiology of various diseases, the association of apos in malignancy was disregarded until the affluent production of apos by human hepatoma cell lines [3]. Subsequently, the potential of apos as diagnostic and prognostic biomarkers of tumorigenesis and malignancy advancement in the case of lung cancer, gastric cancer, and colorectal cancer (CRC) was realized [4], and recent reports have indicated that apolipoproteins’ levels in the blood could be potential biomarkers for different cancers [5]. Specifically, it was reported that CRC is associated with altered levels of apoA-I, apoC-I, apoD, apoE, apoL-VI, apoM, and apoJ [6, 7]. One of the recent studies determining the prognostic value of apos reported that a relative ratio apoB-I/apoA-I may have prognostic value in CRC [8], wherein a higher ratio was associated with a shorter survival rate. Another study on tissue samples of CRC patients reported a heightened expression of apoC-I [9]. However, the expression levels were associated with poor prognosis, as they influenced cell proliferation and motility via the mitogen-activated protein kinase (MAPK) signaling pathway. Some reports indicated that apoC-III might also be a potential biomarker in pancreatic cancer and breast cancer [10, 11]. To date, the expression of apoC-III has not been examined in patients with CRC. Its expression was determined to be almost two times lower in patients with gastric cancer than in healthy persons, and lower than in patients with benign gastric lesions [5, 12]. However, the relatively lower specificity of the approach published by Cohen et al. [5] indicated that additional clinical parameters and serum biomarkers should be added for the formulation of an applicable diagnostic score for stomach cancer patients.
An additional source for such biomarkers could be differential glycosylation of
secreted proteins that could provide additional serum biomarkers for cancerous
states [13, 14]. Owing to the association of apoC-III levels with many
pathological conditions, there is considerable interest in measuring the levels
of apoC-III and its glycoforms in serum [15]. Various previously published
studies of analysis of apoC-III and/or its glycosylation through mass
spectrometry were based on the analysis of peptides or glycopeptides [15, 16],
utilizing time-consuming LC-MS/MS and proteolytic digestion or analysis of intact
glycoproteins based on magnetic-bead extraction and MALDI FT-ICR MS [5]. In the
case of traditionally used analysis of O-glycans released from proteins,
Regarding the analysis of apoC-III-specific glycosylation, the relatively low molecular weight of intact apoC-III along with its O-glycans permits the use of apoC-III as a suitable sample for intact glycoprotein analysis via mass spectrometry (MS), without the need for its specific immunoaffinity chromatography-based isolation from the complex serum sample, and without any proteolytic treatments commonly used in proteomics, such as tryptic cleavage prior to glycopeptides analysis. The only two sample preparation steps before MS analysis in the presented approach can be total methionine oxidation and widely used reverse-phase solid-phase extraction to enrich apoC-III fraction [18]. Thus, the analysis of apoC-III and its glycoforms using MALDI-TOF MS represents a straightforward and robust approach, which can also be fully automatized, customizing it to a 96-well format and thereby achieving considerable throughput for its glycomics analysis.
The high resolution and sensitivity of MS instruments also allow for studying
such structures as, for example, aglycosylated apoC-III (apoC-III
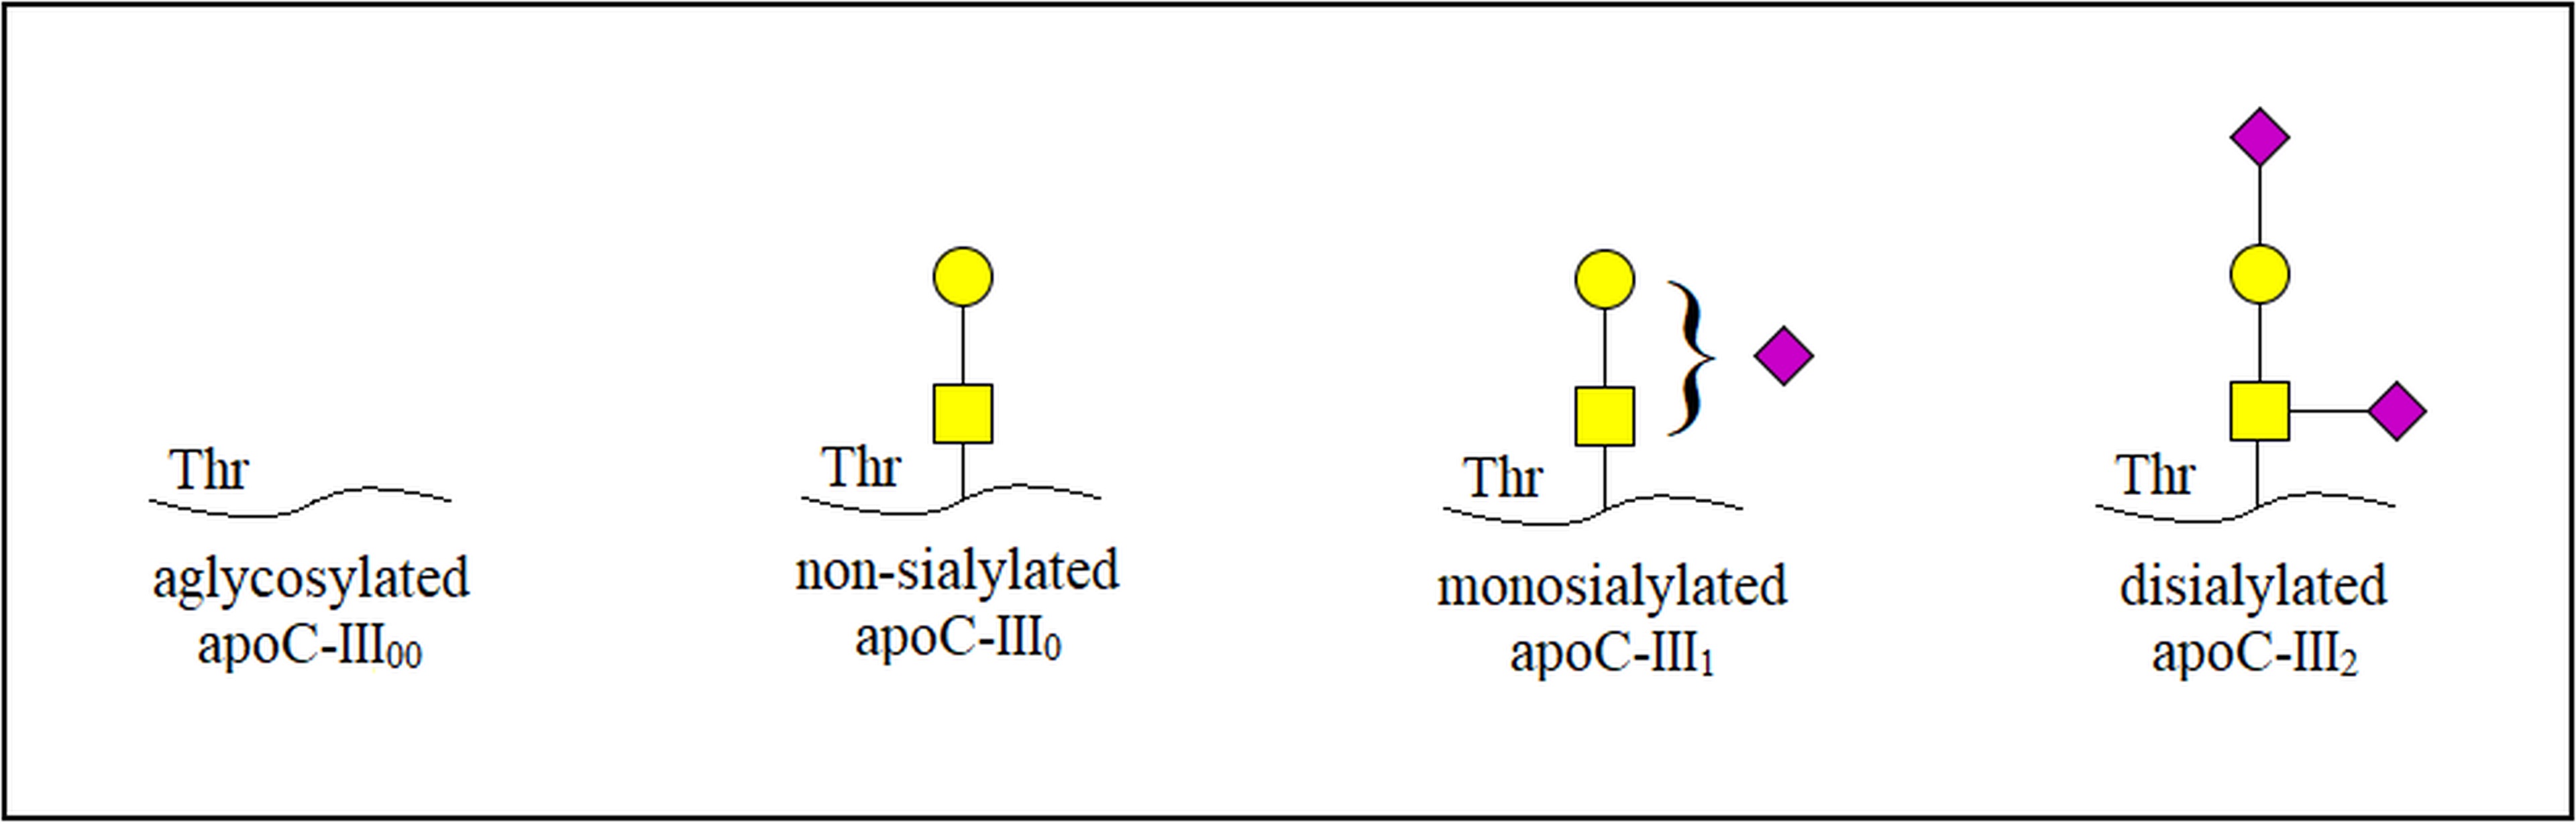 Fig. 1.
Schematic illustration of three main glycoforms and
aglycosylated isoform in apoC-III. apoC-III, apolipoprotein C-III;
apoC-III
To date, there are still only a limited number of reported works on the altered glycosylation in lipoproteins, including apos and its relation to pathologies such as cancer, but these studies show how this field could help in the development of new diagnostic tools, approaches to disease stratification, and new therapeutic interventions [20]. For this aim, high-throughput methods for glycan analysis of lipoproteins are necessary. In this regard, the pursuit of the present study was to characterize the aberrancies in O-glycosylation of apoC-III of CRC patients in comparison to healthy individuals and evaluate the correlation between the ratio of distinct apoC-III glycoforms in relation to CRC.
Serum samples were collected from patients with CRC who were regularly followed up in the Clinical Medical Center (CMC) “Bežanijska kosa” (n = 42, 17 females and 25 males, aged 34–73 years). Patients’ serum samples were collected after the diagnosis and just prior to the surgery in the clinic. Patients were enrolled for a period of 3 months. The choice of patients was based on the same tumor type (adenocarcinoma) and similar tumor size, without or with inconsiderable lymph node infiltration. Patients were diagnosed to have adenocarcinoma using colonoscopy, transrectal ultrasound, and abdominal CT, and graded according to the TNM scale, a staging system for cancer spreading (T—tumor size, N—nearby lymph nodes spread, M—metastasis). The majority of patients were T3N0M0, T3N0M1, T3N1M0, or T3N1M1. Basic biochemical and hematological parameters (including those defining lipid status) were, on average, within reference ranges (although often close to the limit), except for inflammatory markers. Their values, expressed as medians and 2.5–97.5th percentile rank, were as follows: sedimentation rate 33, 5.4–61.0 mm/h, C-reactive protein 45.7, 1.0–153.5 mg/L, and fibrinogen 5.5, 3.3–12.7 g/L. A control group consisted of healthy individuals (n = 40, 19 males and 21 females, aged 35–74 years); control individuals were chosen from those who were apparently healthy, self-reported as healthy, and whose basic hematological and biochemical blood parameters were within the referent range. The exclusion criteria for all the sample selections were diseases and diagnoses other than adenocarcinoma. Serum samples were obtained from all subjects in the morning, after 12 h fasting.
The level of triacylglycerol (TG) in serum was measured according to the GPO-PAP method, based on enzymatic determination of glycerol, catalyzed by glycerol phosphate oxidase (GPO), after hydrolysis by lipoprotein lipase, using a commercial reagent and biochemical analyzer Biosystems A25 (Biosystems, Barcelona, Spain). The concentration of apoC-III was determined by employing ELISA assay Human APOC3/Apolipoprotein C-III ELISA Kit (AssayGenie, Dublin, Ireland) on a BioTek Synergy HT (BioTek, Winooski, VT, USA) microplate reader. TG and apoC-III levels were determined, not in all, but in most of the samples.
For MALDI-TOF analysis, 10 µL of serum was incubated with 250
µL of 200 mM H
Signal intensities of aglycosylated apoC-III
Determined serum TG concentrations were 1.61
For MALDI-TOF MS analyses of apoC-III glycoforms, linear positive ion mode that
allows simple analysis of O-glycosylation on intact apoC-III molecules directly
in the serum samples without the need for specific protein isolation was used.
Methionine oxidation is commonly observed during protein sample preparation and
analysis. To overcome this challenge that complicates the data interpretation,
total oxidation of methionines was performed with the aim of unifying the signals
from various oxidation states of apoC-III glycoforms. A total of 200 mM
H
Representative MALDI-TOF mass spectra of apoC-III glycoforms from the CRC sample and the control sample are shown in Fig. 2.
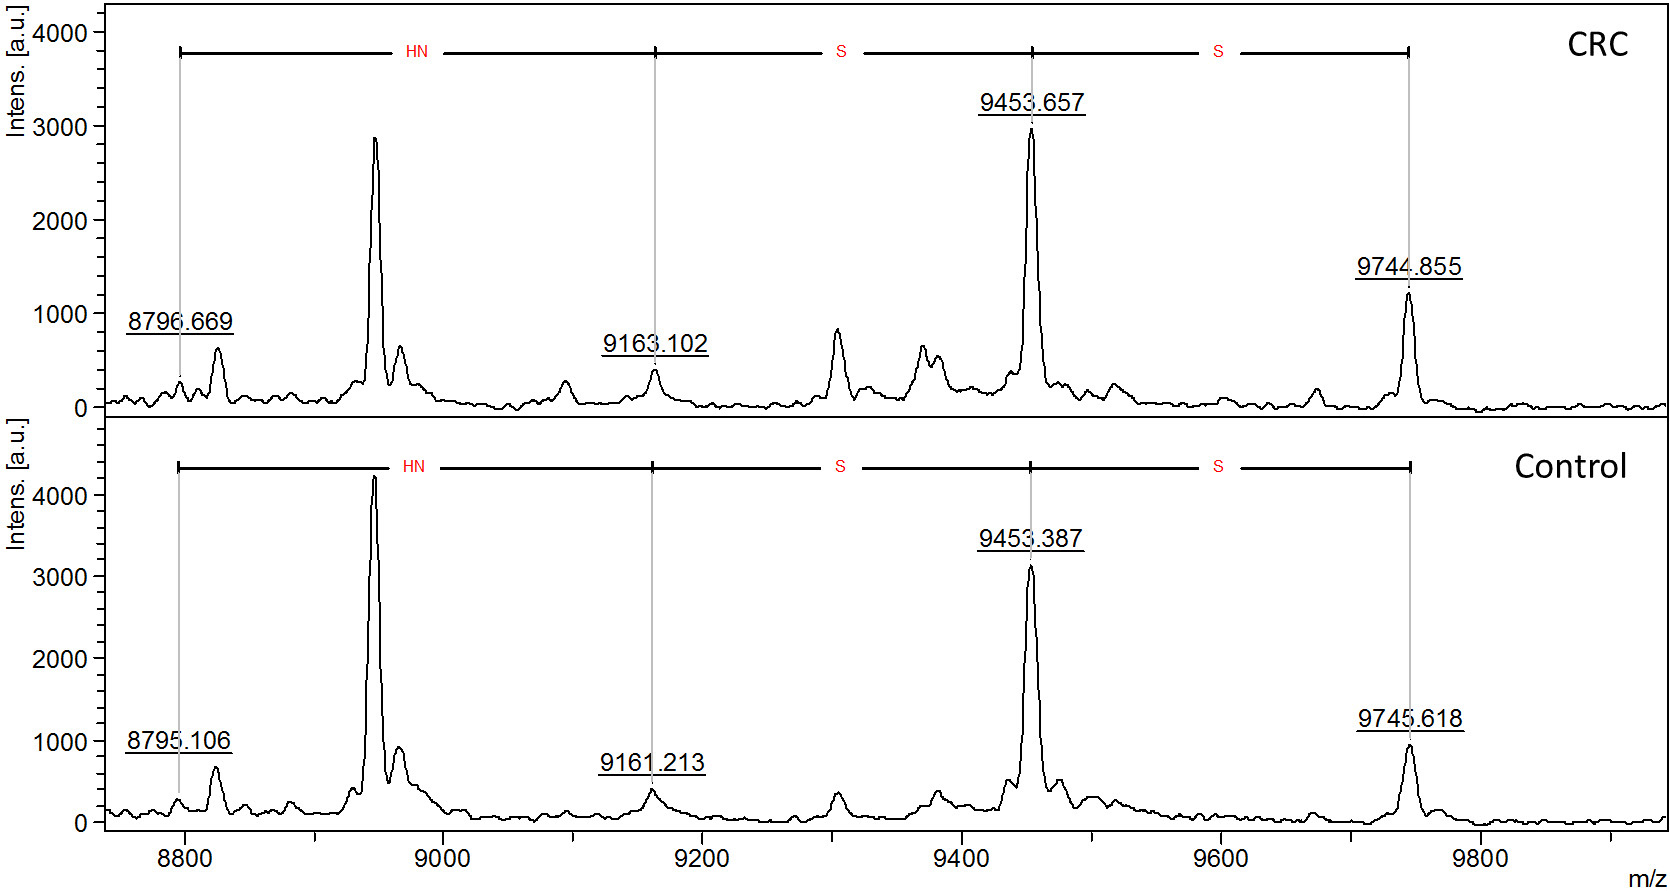 Fig. 2.
Representative MALDI-TOF mass spectra of apoC-III in a serum
sample of CRC patient compared to healthy control (Control) illustrating the
general distribution of apoC-III glycoforms. Aglycosylated (apoC-III
Table 1 shows the determined relative abundance of four serum apoC-III glycoforms in measured samples, ratios of relative abundance of glycoforms in controls and CRC samples, and statistical evaluation of the difference through the Mann–Whitney U test. Differences between CRC and control samples for aglycosylated and disialylated glycoforms have shown statistical significance with p-values of 0.0036 and 0.0021, respectively.
| Glycoform | Relative abundance, control samples (n = 40) | Relative abundance, CRC samples (n = 42) | Ratio of relative abundance of glycoforms | p-values |
| (%) | (%) | CRC samples/controls | ||
| Aglycosylated (apoC-III |
7.87 |
6.15 |
0.78 | 0.0036 |
| Non-sialylated (apoC-III |
9.48 |
9.18 |
0.97 | 0.4386 |
| Monosialylated (apoC-III |
61.99 |
58.56 |
0.94 | 0.0542 |
| Disialylated (apoC-III |
20.66 |
26.10 |
1.26 | 0.0021 |
Various relations between four apoC-III glycoforms as indicated in Table 2 were
estimated in order to identify the most significant values. In most cases, the
p-values were below 0.05, and in the cases of the ratios
apoC-III
| Glycoform ratio | Average ratio in control samples (n = 40) | Average ratio in CRC samples (n = 42) | Ratio of glycoform relations | p-values |
| CRC samples/controls | ||||
| apoC-III |
1.34 |
1.88 |
1.41 | 0.0032 |
| apoC-III |
8.88 |
12.13 |
1.36 | 0.0269 |
| apoC-III |
3.03 |
5.76 |
1.90 | 0.0005 |
| apoC-III |
6.73 |
6.55 |
0.97 | 0.6067 |
| apoC-III |
2.32 |
3.02 |
1.30 | 0.0052 |
| apoC-III |
0.35 |
0.47 |
1.34 | 0.0038 |
| Sialylated/neutral (apoC-III |
5.01 |
5.84 |
1.17 | 0.0211 |
| Sialylated/neutral with double-weighted apoC-III |
6.29 |
7.70 |
1.22 | 0.0046 |
| Glycosylated/aglycosylated (apoC-III |
13.25 |
19.77 |
1.49 | 0.0036 |
ROC curves were plotted for disialylated (apoC-III
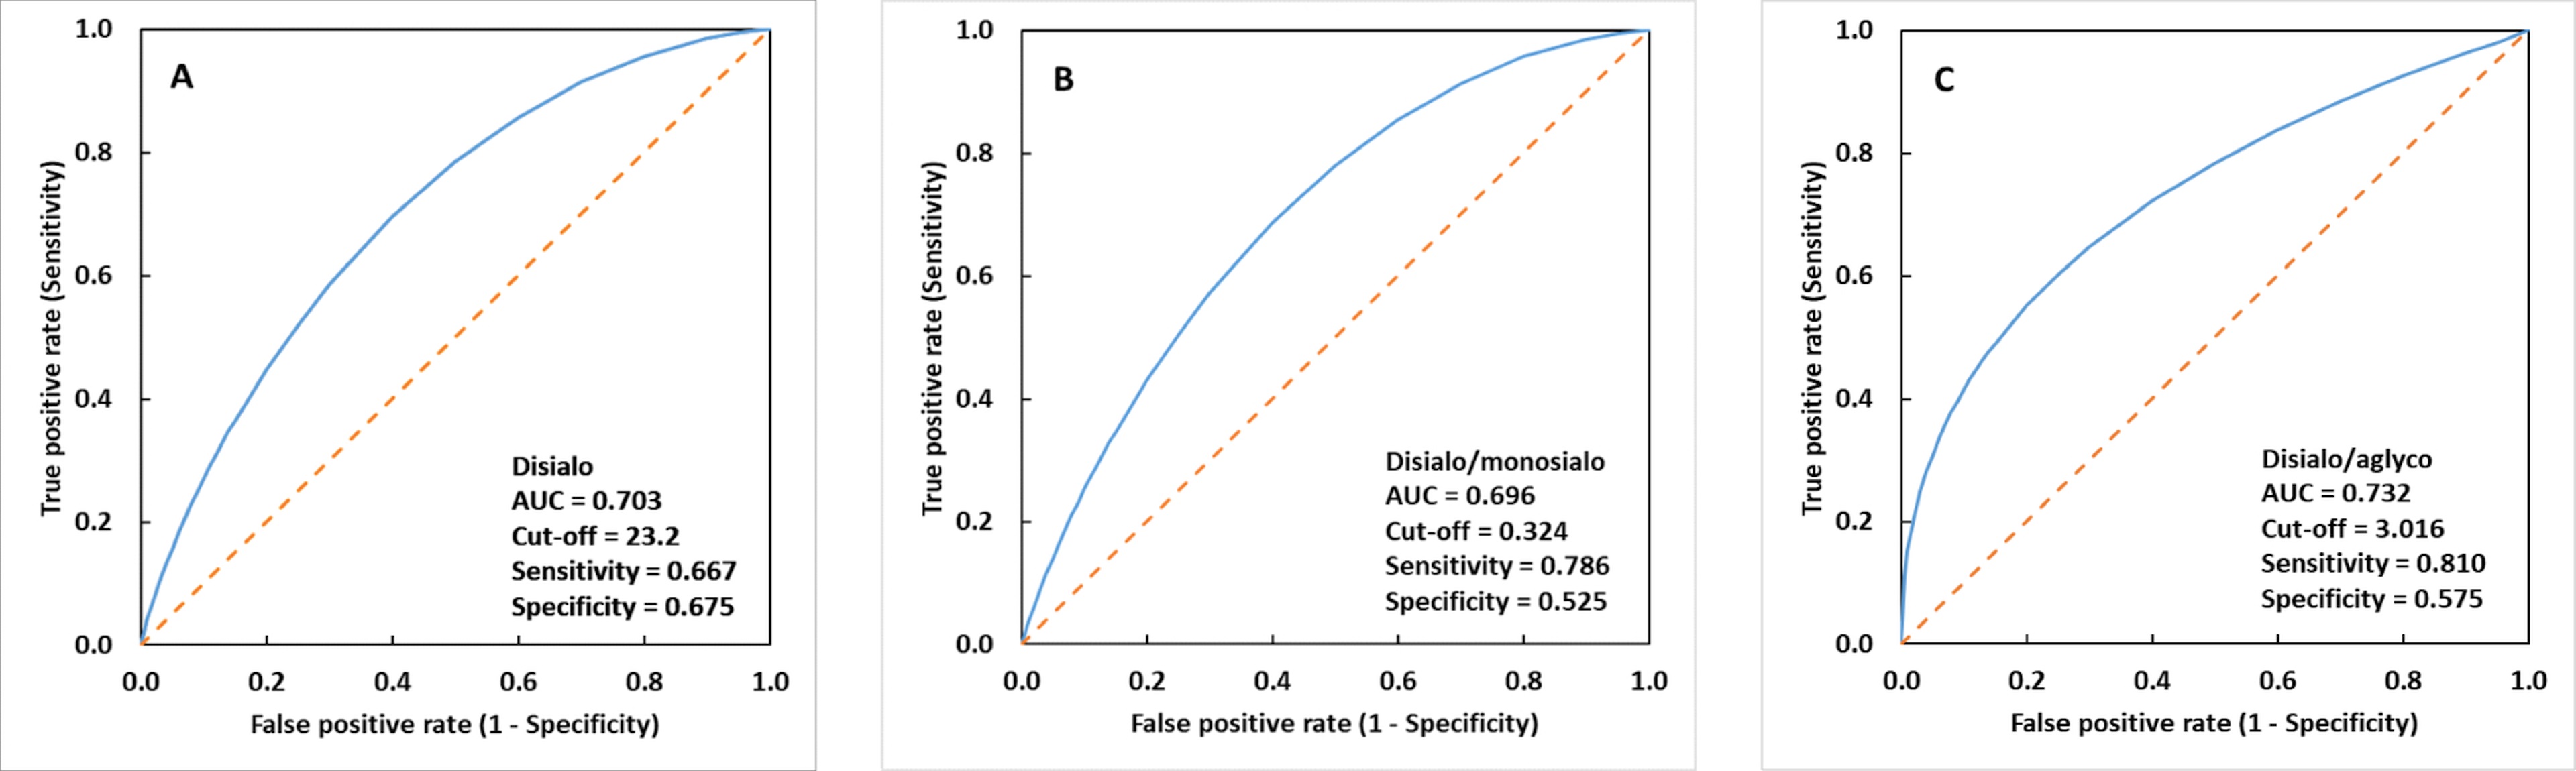 Fig. 3.
Fitted receiver operating characteristic (ROC) curves. (A)
disialylated (apoC-III
We have also correlated both age and gender with apoC-III glycosylation status in both CRC and control groups, and no correlation was found.
Encoded by specific genes, apos can be broadly classified as insoluble apos (apoB) and soluble apos (apoA, apoC, and apoE). The inherent amphiphilicity of apos, along with other molecules like phospholipids and cholesterol, confers them to the capacity to enclose lipid moieties and form water-soluble lipoprotein particles with polar surfaces. This permits the transport of lipid components in the bloodstream that are mostly hydrophilic. In addition to being lipid carriers, apos interact with cell membrane receptors and are structural elements of lipoproteins and cofactors of enzymes, binding lipoprotein receptors, and other lipid transporters, discharging vital roles in lipid metabolism for lipoprotein consumption and clearance. Impairments in glucose and lipid metabolism seem to be tightly connected with neoplasia, but the exact mechanisms of the involvement of various apos in cancer etiology and progression are not known yet [27, 28]. Apos were suggested to promote proliferation and invasion in carcinogenesis and to participate in antitumor immunity, drug delivery, and oxidative stress [6, 8]. The apo gene family consists of 22 members and a majority of apos were found to exert functions in cancer [6].
ApoC-III has been known to promote atherogenicity by enhancing the affinity of LDL for proteoglycans of the arterial walls [29], facilitating interaction between monocytes and endothelial cells [30], promoting the proliferation of smooth muscle cells, and alternating thrombocyte activity by triggering a cascade of inflammatory [31] and thrombotic events [32]. Several experimental analyses indicate apoC-III to be a cause mediating harmful effects. Although HDL is generally considered to exhibit atheroprotective effects [33], HDL carrying apoC-III contributes to HDL dysfunction and an increased risk for the development of cardiovascular diseases (CVDs) [34]. Persons with a rare apoC3 null mutation R19X have much lower concentrations of apoC-III and TG in the circulation, and a cardioprotective phenotype [35]. A specific apoC-III variant, D25V, detected in one family with renal insufficiency, was shown to exhibit self-assembly causing amyloidosis, but also a cardioprotective lipoprotein profile [36]. Our measurements detected no change in the concentration of serum apoC-III due to CRC.
Examination of triglyceridemia-related disorders revealed the importance of the genetic background, as APOC3 polymorphism may be related to an increased risk of CVDs [37]. APOC3 expression is down-regulated by several factors including insulin [38], and up-regulated by several factors including glucose [39]. Hyperglycemia may be a link between an increased APOC3 expression and hyperinsulinemia in diabetes mellitus type 2, often accompanied by increased levels of growth factors and inflammatory cytokines, which may be involved in tumor growth [40]. An interplay between different pathways and factors involved in the regulation of APOC3 expression, diabetes, and cancer is not fully known or documented. CVDs and cancer possess various similarities and possible interactions, including several shared risk factors, suggesting common trigger mechanisms [41]. A relationship between heart failure and cancer has already been described [42]. Serum lipid levels have a well-known association with coronary artery disease; however, hyperlipidemia as a risk factor for cancer remains inconclusive based on heterogeneous data [41]. In our study, no correlation between TG or apoC-III levels and CRC was observed.
As a constituent of one of the four low-molecular-weight apos (apos C-I, II,
III, IV) forming different cholesterol entities and chylomicrons, apoC-III is
synthesized in the liver. The mature form of apoC-III is comprised of 79 amino
acid residues and has a single core 1 O-glycan at Thr-74 [43]. Depending on the
number of terminal sialic acids, three main glycoforms of this protein exist,
namely non-sialylated apoC-III
ApoC-III, as a small protein, falls within the range that can be effectively analyzed in both the reflectron and linear mode of the MALDI-TOF mass spectrometer, respectively. Linear mode, well-suited for intact protein ions with lower m/z values and providing sufficient resolution in this range, was selected as the suitable mode for the analysis of large sample sets, offering rapid data acquisition. This approach enables relatively simple and high-throughput analysis. Results from MALDI-TOF MS glycoanalysis of apoC-III in CRC samples showed an overall decrease in “hyposialylated” structures—aglycosylated, non-sialylated, and monosialylated apoC-III glycoforms—while a significant increase in disialylated apoC-III glycoform was observed when compared to controls (Tables 1,2). Based on the obtained results, elevated apoC-III sialylation, represented by increased levels of fully sialylated disialyl core 1 type O-glycan, was observed in CRC samples with high statistical significance (p = 0.0021). In addition, average levels of all apoC-III precursors of this disialylated core 1 type O-glycan—aglycosylated, non-sialylated, and monosialylated glycoforms—were decreased in CRC samples, when compared to controls, with high statistical significance (p = 0.0036) for the aglycosylated form (Table 1). The various types of glycoform ratios as shown in Table 2 can also be good parameters to monitor differences in apoC-III glycosylation between CRC and control samples. According to AUC, sensitivity, specificity and cut-off values, the relative abundance of disialylated glycoform seems to be the best parameter for differentiating between the group of patients with CRC and the control group (Fig. 3). Nevertheless, we have to keep in mind that the biochemistry behind found apoC-III hypersialylation in CRC is not clear and can be a consequence of a CRC-related but different process, such as inflammation. Nonetheless, the monitoring of levels of apoC-III glycoforms and their ratios can be useful parameters in clinical applications, such as CRC monitoring and its prognosis. However, to confirm or reject this, further studies of glycosylation changes on apoC-III and their relation to CRC are required.
As mentioned, the mechanism clarifying its hypersialylation in CRC remains
unknown. During the last few years, new correlations between apoC-III and various
diseases were discovered and apos have been reported to regulate many cellular
functions [48]. The transcription rate of apoC-III is decreased by insulin [38, 49] and peroxisome proliferator-activated receptor-
A recent cross-sectional study [52] described independent significant down-regulation of apoC-III in patients with inflammatory bowel disease (IBD). According to this study, patients with IBD showed significantly lower serum levels of apoC-III; however, its specific glycosylation was not examined. In patients with IBD, an increased rate of sialylation of colonic mucin was described [53]. From various cancer types, the strongest correlation between long-standing inflammation and tumorigenesis is most apparent in CRC [54, 55]. Focal sites of inflammation could significantly increase the risk of initiation and later development of cancer. It is possible that high levels of inflammatory mediators that are produced in IBD may contribute to the development and progression of CRC [56].
To date, there is no relevant research on the exact pathological effects of
aglycosylated or sialylated apoC-III in CRC. Since apoC-III has one
O-glycosylation site with four main glycoforms, it should be interesting to look
at enzymes responsible for different glycoforms formation. ST3Gal-I and
ST3GalNAc-II are enzymes responsible for sialylation with the presence of a final
disialylated apoC-III structure [57]. In recent advances, we can find research
that studied the impact of ST3GAL2 gene knock-down that decreased the
tumoral character of colorectal cancer cells [58]. It would be beneficial to
continue with a study of apoC-III
The phenomenon of protein hypersialylation was described as a common hallmark of
several cancers [59]. In general, total serum sialylation levels appear to be
increased in various malignancies and show potential for clinical applications,
especially for disease monitoring and prognosis [60]. Atypical glycoforms like
elevated
In the canonical understanding of the glycosylation process, glycosyltransferases residing within the intracellular secretory apparatus assemble glycan structures on nascent proteins and lipids in transit. Plasma sialyltransferase activity was found to be significantly elevated in patients with a variety of cancers, including CRC [64]. Thus, the hypothetical explanation of increased levels of disialylated apoC-III might be based on its additional extracellular sialylation occurring in blood. The acceptance of the extracellular glycosylation phenomenon has been hampered by the widespread notion that there is no extracellular supply of the sugar-nucleotide donor substrates necessary for glycosylation [65], but few studies have already identified platelets as the sufficient sialic acid donor substrates to drive extracellular ST6Gal-1 sialylation and, in some situations, dying cells [66, 67]. We assume that apoC-III hypersialylation, reported in this study, might be a secondary cause as a result of the unspecific increase of both blood sialyltransferase activity and source of CMP-sialic acid, respectively, but there may be other factors as well, such as different clearance by hepatic receptors. Another option that could alter the observed hypersialylation of apoC-III is the asialoglycoprotein receptor (ASGR) that is involved in the catabolism of asialylated glycoproteins. It was found that its ASGR1 subunit is down-regulated in hepatocellular carcinoma (HCC) tissue and lower ASGR1 expression is associated with poorer prognosis in HCC patients [68]. Theoretically, the ASGR can indirectly influence protein sialylation by modulating the expression or activity of sialyltransferases. However, the exact significance of ASGR in protein sialylation is still not completely understood. Therefore, to investigate and confirm the possible underlying mechanisms, a more comprehensive study, including large cohorts, cell lines, and/or mouse models, as well as the samples from IBD patients, is necessary.
Hepatic clearance of individual apoC-III glycoforms is different [69] and the
clinical relevance of their ratio remains unclear, especially in disease states.
Diet interventions can affect the ratio of its glycoforms [70]. It seems that
apoC-III
Genetic polymorphism of apoC-III and its associated molecular pathologies in cardiovascular diseases has been well established [37]. However, the possibility of whether such polymorphic variants of apoC-III manifesting glycosylation anomalies can be connected with oncogenesis and tumor development remains an enigma. Identifying susceptibilities of certain apoC-III genotypes to aberrancies in sialylation could prove to be a game changer in the early diagnosis of CRC. Since some tumors also have genetic etiology, perhaps a risk estimation can also involve an investigation of the association between apoC-III polymorphism, sialylation degree, incorporation in lipoprotein particles, and effector function.
The precise rationale and biochemistry of detected apoC-III hypersialylation in
CRC, namely the increase of fully sialylated disialyl core 1 type O-glycans, are
not clear and could also be of a secondary cause, for instance, a manifestation
of ongoing inflammation. However, the analysis of apoC-III glycoforms might be a
useful parameter to be included in the panel of non-invasive diagnostic tests
when considering CRC in suspected patients, even if it is non-specific.
Determination of apoC-III sialylation levels might also have a potential for
further clinical applications, such as disease monitoring and possibly prognosis.
The presented approach based on MALDI-TOF MS for the analysis of O-glycosylation
in apoC-III directly in the serum samples, without the need for specific apoC-III
isolation, was used due to its simplicity and robustness as a promising
analytical approach, appropriate for this purpose. Complete automatization of
apoC-III glycan analysis to a 96-well format confers considerable throughput to
this method, making it appropriate for high-throughput screening of apoC-III
glycosylation-based biomarker. However, an increased number of samples spread
across broader age groups of both genders and diverse ethnicities, as well as
control samples from IBD patients, will be needed for a more in-depth study of
glycosylation changes on apoC-III and their relation to CRC. It would be also
beneficial to differentiate the type of sialic acid linkage in apoCIII
The mass spectrometry data are deposited and publicly available at the mass spectrometry data repository for glycomics GlycoPOST (GPST000376) [23]. Other datasets are available upon request.
JK and ON designed the research study. KK, ZP, FK, AH and GM performed the research. ZP and PB provided help and advice on research methodology. KK, ZP, JK, AH and GM analyzed the data. KK, ZP, JK, ON and PHK interpreted the data. KK, ZP, ON, JK, GM and PHK wrote and reviewed the manuscript. All authors contributed to editorial changes in the manuscript. All authors read and approved the final manuscript. All authors have participated sufficiently in the work and agreed to be accountable for all aspects of the work.
The study was conducted in accordance with the Declaration of Helsinki, and approved by the Ethical Committee of the CMC “Bežanijska kosa” (approval no. 3562). Informed consent was obtained from all subjects involved in the study.
Not applicable.
This work was supported by the Ministry of Education, Science and Technological Development of Serbia (contract number 451-03-68/2022-14/ 200019). This work was supported by the grants VEGA 2/0120/22, APVV-20-0243 and APVV SK-SRB-21-0046. This publication was created with the support of the Operational Program Integrated Infrastructure for the following projects: Centre for Medical Bio-Additive Manufacturing and Research (CEMBAM), ITMS2014+: 313011V358, and Long-term strategic research and development focused on the occurrence of Lynch syndrome in the population of the Slovak Republic and the possibilities of prevention of tumors associated with this syndrome, ITMS: 313011V578, funded by the European Regional Development Fund.
The authors declare no conflict of interest.
References
Publisher’s Note: IMR Press stays neutral with regard to jurisdictional claims in published maps and institutional affiliations.