1. Introduction
Renal cell carcinoma (RCC) is a common lethal malignancy globally [1]. As
estimated, this malignancy occupies nearly 4% of newly diagnosed cases as well
as 2% of cancer-related deaths in 2020 [1]. RCC includes a varying group of
malignancies that arise from the nephron [2]. According to the somatic genetic
and genomic variations, RCC encompasses three major histological subtypes: clear
cell RCC (ccRCC; 75%), papillary RCC (pRCC; 20%) and chromophobe RCC (chRCC;
5%) [3]. For patients with localized or early stage RCC, surgery (partial or
radical nephrectomy, etc.) improves the 5-year survival rate to 93% [4].
Approximately 30% of patients have metastasis during initial diagnosis, and
nearly 30% of the remaining patients will develop metastasis during follow-up
[5]. Among the renal cancer-related deaths, over 90% are in relation to RCC
metastasis [6]. Within the tumor microenvironment (TME), there are complex
interactions between tumor cells, immune cells, and stromal cells [7, 8]. Immune
checkpoint inhibitors targeting programmed cell death 1 (PD-1)/programmed cell
death ligand 1 (PD-L1) combined with a tyrosine kinase inhibitor have remarkably
altered the clinical management of metastatic RCC, and have been recommended as
the first-line treatment option [9]. Nevertheless, long-term response is low due
to high risk of resistance. Thus, novel treatment options are urgently required
to enhance the therapeutic effects as well as to determine biomarkers for
predicting the responses and better stratifying RCC patients, thereby reducing
costs and prolonging the survival duration.
N-methyladenosine (mA) represents the most abundant RNA modification
pattern in eukaryotic cells, which typically occurs at the nitrogen-6 position of
adenosine [10]. MA modification, a dynamically reversible process, is
mediated by methyltransferases (“writers”), demethylases (“erasers”), and
binding proteins (“readers”) [11]. This methylation modification in mRNAs
exerts key functions in diverse aspects of RNA metabolism (mRNA splicing,
translation efficiency, etc.), thereby participating in critical biological
processes such as tumorigenesis, immunomodulatory process, and cancer metastasis
[12, 13]. Thus, it is of importance to extensively characterize “writers”,
“erasers” and “readers” that alter the modification levels and recognize the
chemical marks [14]. Recently, fat mass and obesity associated (FTO) mA
demethylase inhibits ccRCC via FTO-peroxisome proliferator-activated
receptor-gamma co-activator-1 (PGC-1) signaling axis [15].
MA demethylase AlkB homolog 5 (ALKBH5) accelerates RCC progression through
modulating aurora kinase B (AURKB) expression with an mA-dependent manner
[16]. Nevertheless, the expression of mA regulators in RCC patients with
various clinicopathological features, their roles in the TME, and their
prognostic implications are mostly unclear. Oxidative stress is an imbalance
between oxidants and antioxidants. Overactivation of oncogenes results in the
increased generation of reactive oxygen species (ROS) in tumor cells, accompanied
by an increased antioxidant ability to maintain redox homeostasis at increased
levels in tumor cells. Accumulated evidence suggests that mA modification
modulates cellular ROS levels via distinct mechanisms [17]. The effects of
mA modification in oxidative stress remain unclear in RCC. Here, this study
constructed distinct mA modification subtypes characterized by distinct
biological functions, oxidative stress, TME features, tumor immunity and survival
outcomes in RCC. Moreover, this study developed a mA scoring system for
quantifying the mA modification patterns for individual patients, which
could be applied for elucidating immune phenotypes and predicting the prognosis
and immunotherapy responses in clinical practice.
2. Materials and Methods
2.1 Data Download and Preprocessing
RNA sequencing profiles (FPKM value) and matched clinical information of ccRCC,
pRCC and chRCC were retrieved from the Cancer Genome Atlas (TCGA) database
(https://portal.gdc.cancer.gov) via the Genomic Data Commons
(https://portal.gdc.cancer.gov/) utilizing TCGAbiolinks package [18]. The raw
count value was converted to TPM value. Three RCC datasets were integrated and
batch effects were removed through Combat function of sva package [19]. Finally,
128 normal samples and 893 RCC samples (chRCC (N = 65), ccRCC (N = 539) and pRCC
(N = 289) were included in this study. Copy number alterations (CNAs) of RCC that
were preprocessed by GISTIC algorithm were obtained from the UCSC Xena data
portal (http://xena.ucsc.edu/). Additionally, RNA expression profiling of 101
ccRCC patients from the E-MTAB-1980 dataset was adopted for external validation.
In total, 23 mA regulators containing 8 writers (Cbl proto-oncogene like 1
(CBLL1), Vir like mA methyltransferase associated (VIRMA),
methyltransferase 14/3 (METTL14/3), RNA binding motif protein 15 (RBM15), RNA
binding motif protein 15B (RBM15B), WT1 associated protein (WTAP), zinc finger
CCCH-type containing 13 (ZC3H13)), 2 erasers (ALKBH5 and FTO) and 13 readers
(ELAV like RNA binding protein 1 (ELAVL1), FMRP translational regulator 1 (FMR1),
heterogeneous nuclear ribonucleoprotein A2/B1 (HNRNPA2B1), heterogeneous nuclear
ribonucleoprotein C (HNRNPC), insulin like growth factor 2 mRNA binding protein
1/2/3 (IGF2BP1/2/3), leucine rich pentatricopeptide repeat containing
(LRPPRC), YTH domain containing 1/2 (YTHDC1/2), YTH mA RNA
binding protein 1/2/3 (YTHDF1/2/3)) were collected from the published literature.
The mRNA expression of the mA regulators was compared between 128 normal
and 893 RCC samples. Univariate-cox regression analyses were presented to
investigate the correlation between the mA regulators and RCC prognosis in
the TCGA dataset. The results were visualized via forestplot package (version
2.0.1, https://cran.r-project.org/web/packages/forestplot) [20]. The expression
of prognostic mA regulators was validated utilizing the Human Protein Altas
(https://www.proteinatlas.org/).
2.2 Interactions between MA Regulators
The mA regulators were inputted into the STRING online database
(http://string-db.org/) [21]. The interactions were visualized into a
protein-protein interaction (PPI) network via Cytoscape software (version 3.8.2,
https://cytoscape.org/) [22]. Pearson correlation
analysis was performed to evaluate the correlation of the mRNA expression of the
mA regulators across RCC samples.
2.3 Immunotherapy Response
Through Tumor Immune Dysfunction and Exclusion (TIDE) approach, the response to
immunotherapy was predicted following the tumor immune evasion mechanisms [21].
The expression similarity between subtypes and the patients who might respond to
anti-PD-1 and anti-CTLA4 therapy was detected utilizing Subclass Mapping (SubMap)
algorithm [23].
2.4 Unsupervised Clustering Analyses of 23 MA Regulators
Unsupervised clustering analyses were applied to estimate the number of
unsupervised classes across 893 RCC samples based on the expression profile of 23
mA regulators by ConsensuClusterPlus package (version 1.60.0,
https://bioconductor.org/packages/release/bioc/html/ConsensusClusterPlus.html)
[24]. The classification accuracy was assessed via t-distributed stochastic
neighbor embedding (t-SNE) method. Survival differences among clusters were
compared by Kaplan-Meier curves and log-rank tests.
2.5 Gene-Set Variation Analysis (GSVA)
In total, 50 hallmark pathways were retrieved from the Molecular Signatures
Database, which may comprehensively reveal the major biological functions of
humans [25]. The enrichment levels of above pathways were quantified with GSVA
package [26]. From the REACTOME dataset
(https://reactome.org/) [27] and the Gene set
enrichment analysis (GSEA) website (http://www.gsea-msigdb.org/gsea/index.jsp)
[28], 32 oxidative stress-related genes were collected. The activity of oxidative
stress was estimated with single-sample gene set enrichment analysis (ssGSEA)
function [29].
2.6 Evaluation of Stemness Features
Two stemness indicators: gene expression-based stemness index (mRNAsi) and DNA
methylation-based stemness index (mDNAsi) were calculated in RCC samples by
building the stemness index models with one-class logistic regression (OCLR)
machine-learning method [30]. The stemness value was ranging from 0 (no gene
expression) to 1 (complete gene expression).
2.7 Assessment of Immunological Characteristics
Cancer immunity cycle contains release of cancer cell antigens (step 1), cancer
antigen presentation (step 2), priming and activation (step 3), trafficking of
immune cells to tumors (step 4), infiltration of immune cells into tumors (step
5), recognition of cancer cells by T cells (step 6), and killing of cancer cells
(step 7) [31]. The activation of each step was quantified in RCC
samples by ssGSEA function.
2.8 Tumor Immune Landscape
Immune score and stromal score were obtained using estimation of stromal and
immune cells in malignant tumours using expression data (ESTIMATE) algorithm
based on gene expression data, which represented the fractions of immune and
stromal cells in RCC samples [32]. The enrichment levels of immune cells were
estimated in RCC samples through the ssGSEA algorithm according to the expression
matrix of gene symbols of tumor-infiltrating immune cells (TIICs) [33]. The mRNA
expression of immune checkpoints was calculated in each RCC specimen.
2.9 Identification of MA-Related DEGs
Differentially expressed genes (DEGs) were screened between mA clusters
rough limma package [34]. Genes with adjusted p 0.05 were considered
as DEGs. DEGs shared by any two clusters were identified as mA-related
DEGs.
2.10 Functional Enrichment Analyses
Functional enrichment analyses of mA-related DEGs were presented with
clusterProfiler package (version 4.9.0.2,
https://bioconductor.org/packages/release/bioc/html/clusterProfiler.html),
containing gene ontology (GO) and kyoto encyclopedia of genes and genomes (KEGG)
[35]. GO categories comprised biological processes (BPs), cellular components
(CCs) and molecular functions (MFs). Terms with adjusted p 0.05 were
significantly enriched by mA-related DEGs.
2.11 Generation of mA Scoring System
RCC patients were clustered into distinct gene clusters through applying
unsupervised clustering analyses based on the extracted mA-related DEGs. By
using ConsensuClusterPlus package, the number of gene clusters and their
stability were determined across RCC samples. The accuracy of the gene clusters
was validated with t-SNE method. Survival differences among gene clusters were
observed with Kaplan-Meier curves and log-rank tests. Univariate-cox regression
analyses were carried out for extracting prognostic mA-related DEGs with
p 0.05 across RCC patients. These extracted DEGs were used for
feature selection through recursive feature elimination (RFE) with random forest,
followed by 10-fold cross-verification utilizing caret package. The mA
scoring system was quantified in individual tumors based on the curated
expression profiles of the finally identified DEGs by conducting a principal
component analysis (PCA) utilizing the Boruta algorithm, named the mA
score. Both principal component 1 and 2 were chosen as signature scores. The
mA score was quantified according to the following formula: mA score
= (PC1 + PC2), where i indicated the expression of
mA-related DEGs.
2.12 Collection of Genomic and Clinical Information of Immunotherapy
Cohorts
The mRNA expression profiles and follow-up data of patients with anti-PD-1
therapy were downloaded from the GSE78220 dataset (N = 27) in the Gene Expression
Omnibus (GEO, https://www.ncbi.nlm.nih.gov/geo/) repository [36] and the
literature reported by Liu et al. [37] (N = 121). The prognostic value
of mA score was externally validated in the two immunotherapy cohorts.
2.13 Gene Set Enrichment Analysis (GSEA)
Pathways were probed by GSEA package [28]. The “c5.bp.v6.2.symbols.gm” gene
set was set as the reference set, which was obtained from the molecular
signatures database. Pathways with adjusted p 0.05 were
significantly associated with mA score.
2.14 Assessment of Sensitivity of Chemotherapeutic Agents
By employing pRRophetic algorithm [38], the half-maximal inhibitory
concentration (IC50) values of chemotherapy agents were estimated for RCCs on the
basis of the genomics of drug sensitivity in cancer (GDSC; www.cancerrxgene.org/)
cell line expression spectrum [39] and mRNA expression profiling.
2.15 Prediction of Drug Response
Drug sensitivity data of human cancer cell lines (CCLs) were retrieved from the
the Cancer Therapeutics Response Portal (CTRP) (https://portals.broadinstitute.org/ctrp) and Preservice Research Institute for Science and Mathematics (PRISM) database
(https://depmap.org/portal/prism/) datasets. Both two datasets offer the area
under the dose–response curve as an evaluation indicator for the responses to
hundreds of compounds. Reduced area under the curve (AUC) indicates higher
sensitivity to a specific drug. By K-nearest neighbor method, the missing AUCs
were imputed. Since the CCLs in both datasets were retrieved from the cancer cell
line encyclopedia (CCLE) project (https://portals.broadinstitute.org/ccle/) [40],
expression profiling data in CCLE project were employed for CTRP and PRISM
analyses.
2.16 Statistical Analyses
Statistical analyses were conducted with R packages (version 4.0.2).
Kaplan-Meier curves of overall survival (OS), disease free survival (DFS),
disease-specific survival (DSS), progression free survival (PFS) and progression
free interval (PFI) were depicted for RCC patients and survival differences
between groups were compared with log-rank tests. Comparison between two groups
was presented via student’s t test or Wilcoxon test. One-way ANOVA or
Kruskal-Wallis test was used for conducting comparison between three or more
groups. Two-sided p 0.05 indicated statistical significance.
3. Results
3.1 Systematic Analyses of Genetic Variation, Expression, Prognostic
Implication and Interactions of mA Regulators in RCC
This study collected three types of RCC ccRCC, pRCC and chRCC from TCGA datasets
and removed batch effects after integration (Fig. 1A,B). Finally, 893 RCC samples
(chRCC (N = 65), ccRCC (N = 539) and pRCC (N = 289) and 128 normal samples were
included for further analyses. In total, 23 mA regulators were collected
and the prevalence of CNAs among these mA regulators was analyzed in RCC
samples. In Fig. 1C, YTHDC2 had the prevalent gain and IGFBP2, YTHDF2 and RBM15B
had the widespread loss across RCC tissues. The mRNA expression of these mA
regulators was compared in RCC and normal specimens. We found that most mA
regulators were abnormally expressed in RCC compared to normal tissues (Fig. 1D),
including writers (CBLL1, METTL14, ZC3H13), eraser (FTO) and readers (FMR1,
HNRNPA2B1, HNRNPC, IGF2BP1/2/3, LRPPRC, YTHDC1/2, YTHDF2/3). We also compared the
expression of mA regulators in stage I&II and III&IV RCC tissues. As
depicted in Fig. 1E, writers (CBLL1, METTL14, METTL3, RBM15B, ZC3H13), and
readers (FMR1, IGF2BP1, IGF2BP3, LRPPRC, YTHDC1, YTHDF1) displayed remarkable
differences between stage I&II and III&IV. Additionally, we noted that there
were significant differences in the expression of writers (RBM15, WTAP), erasers
(ALKBH5, FTO) and readers (HNRNPA2B1, HNRNPC, IGF2BP2/3, YTHDC1, YTHDF2) among
three RCC types ccRCC, pRCC and chRCC (Supplementary Fig. 1). Through
Submap algorithm, we predicted the responses to anti-PD-1 and anti-CTLA4 therapy.
As a result, among three RCC types, ccRCC patients were more likely to respond to
anti-PD-1 therapy. There was no significant difference in the response to
anti-CTLA4 therapy among three RCC types (Supplementary Fig. 1). By
univariate-cox regression analyses, prognostic implication of each mA
regulator was evaluated across RCC patients. METTL14, ZC3H13, FTO, LRPPRC and
YTHDC1 were protective factors of RCC, while HNRNPA2B1 and IGF2BP1/2/3 acted as
risk factors of RCC (Fig. 1F). Further multivariate cox regression analysis
showed that METTL14 and LRPPRC were protective factors, while IGF2BP3 and
HNRNPA2B1 were identified as risk factors, which was consistent with the results
of univariate-cox regression analysis (Supplementary Fig. 2).
Additionally, we evaluated the relationships between mA regulators and DFS,
DSS, and PFS outcomes. Our results demonstrated that the mA regulators
IGF2BP1/3 were significantly associated with DFS, DSS, and PFS, indicating that
they might contribute to RCC progression (Fig. 1G–I). The PPI network revealed
the tight interactions among the mA regulators (Fig. 1J). Also, there were
significant correlations between the mA regulators at the mRNA levels
across RCC samples (Fig. 1K). Above data highlighted the important implications
of the interactions of mA regulators in RCC progression.
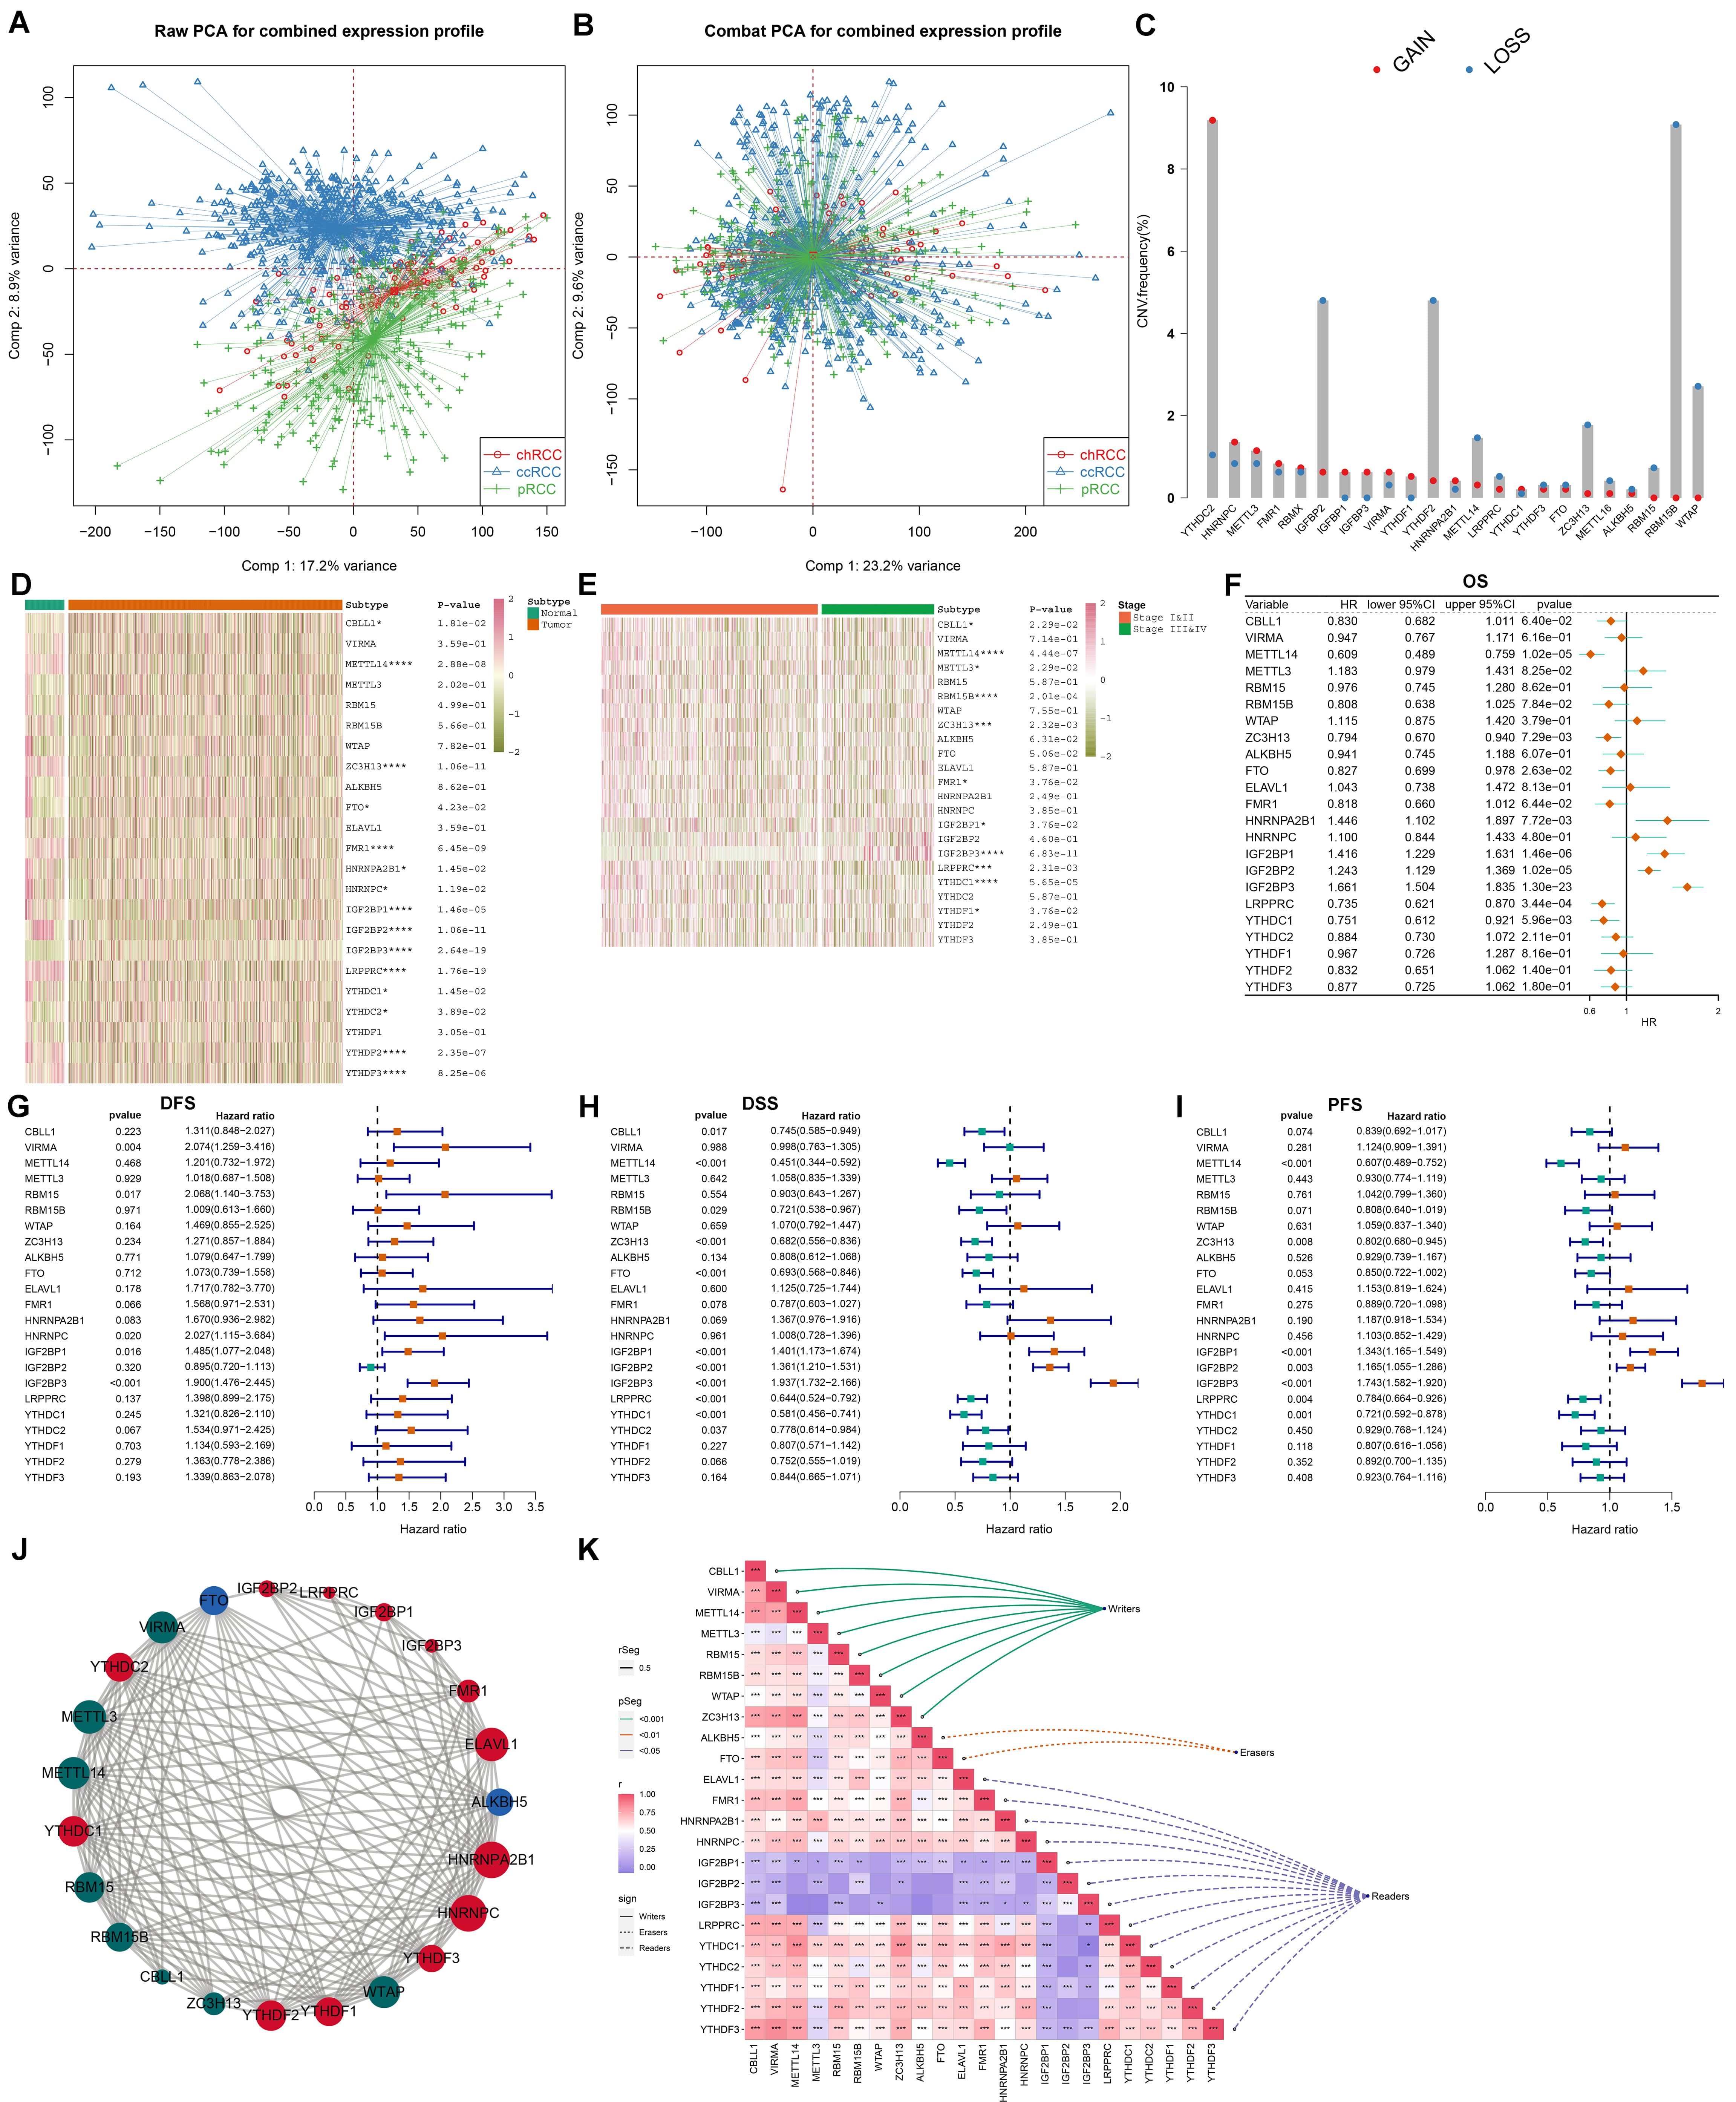 Fig. 1.
Systematic analyses of genetic variation, expression, prognostic
implication and interactions of N6-methyladenosine (m6A) regulators in renal cell
carcinoma (RCC). (A,B) Before and after removing batch effects by integrating three types of RCC: clear cell RCC (ccRCC), papillary RCC (pRCC) and chromophobe RCC (chRCC) from the Cancer Genome Atlas (TCGA) datasets. PCA, Principal component analysis. (C) The frequency of
copy number variation (CNV) (red: gain and blue: loss) of mA regulators
across RCC samples. (D) An overview of the mRNA expression of mA regulators
in RCC and normal specimens. p values were calculated by unpaired
student’s t test, *p 0.05 and ****p 0.0001.
Red: up-regulation and green: down-regulation. (E) The mRNA expression of
mA regulators in stage I&II and stage III&IV RCC cases. *p
0.05, ***p 0.001 and ****p 0.0001. (F–I)
Univariate-cox regression analyses of the correlation between mA regulators
and RCC patients’ overall survival (OS), disease free survival (DFS),
disease-specific survival (DSS), and progression free survival (PFS). (J) The
protein-protein interaction (PPI) network of writers (green), erasers (blue) and
readers (red). (K) The Pearson correlations between mA regulators at the
mRNA levels across RCC samples. Red: positive correlation and green: negative
correlation, *p 0.05, **p 0.01 and ***p
0.001.
3.2 Protein Expression of Prognostic mA Regulators and
Interactions of MA Regulators with Oxidative Stress in RCC
Using the human protein altas database, we verified the expression of prognostic
mA regulators in RCC and normal kidneys. As depicted in Fig. 2A, METTL14,
ZC3H13, HNRNPA2B1 were lowly expressed in RCC than normal kidneys. Meanwhile,
FTO, LRPPRC, YTHDC1, IGF2BP1/2/3 were highly expressed in RCC compared with
normal kidneys. We also evaluated the interactions of mA regulators with 32
oxidative stress-related genes in RCC. In Fig. 2B, mA regulators was
significantly linked to most oxidative stress-related genes, indicating that the
activity of oxidative stress might be modulated by mA modification during
RCC progression.
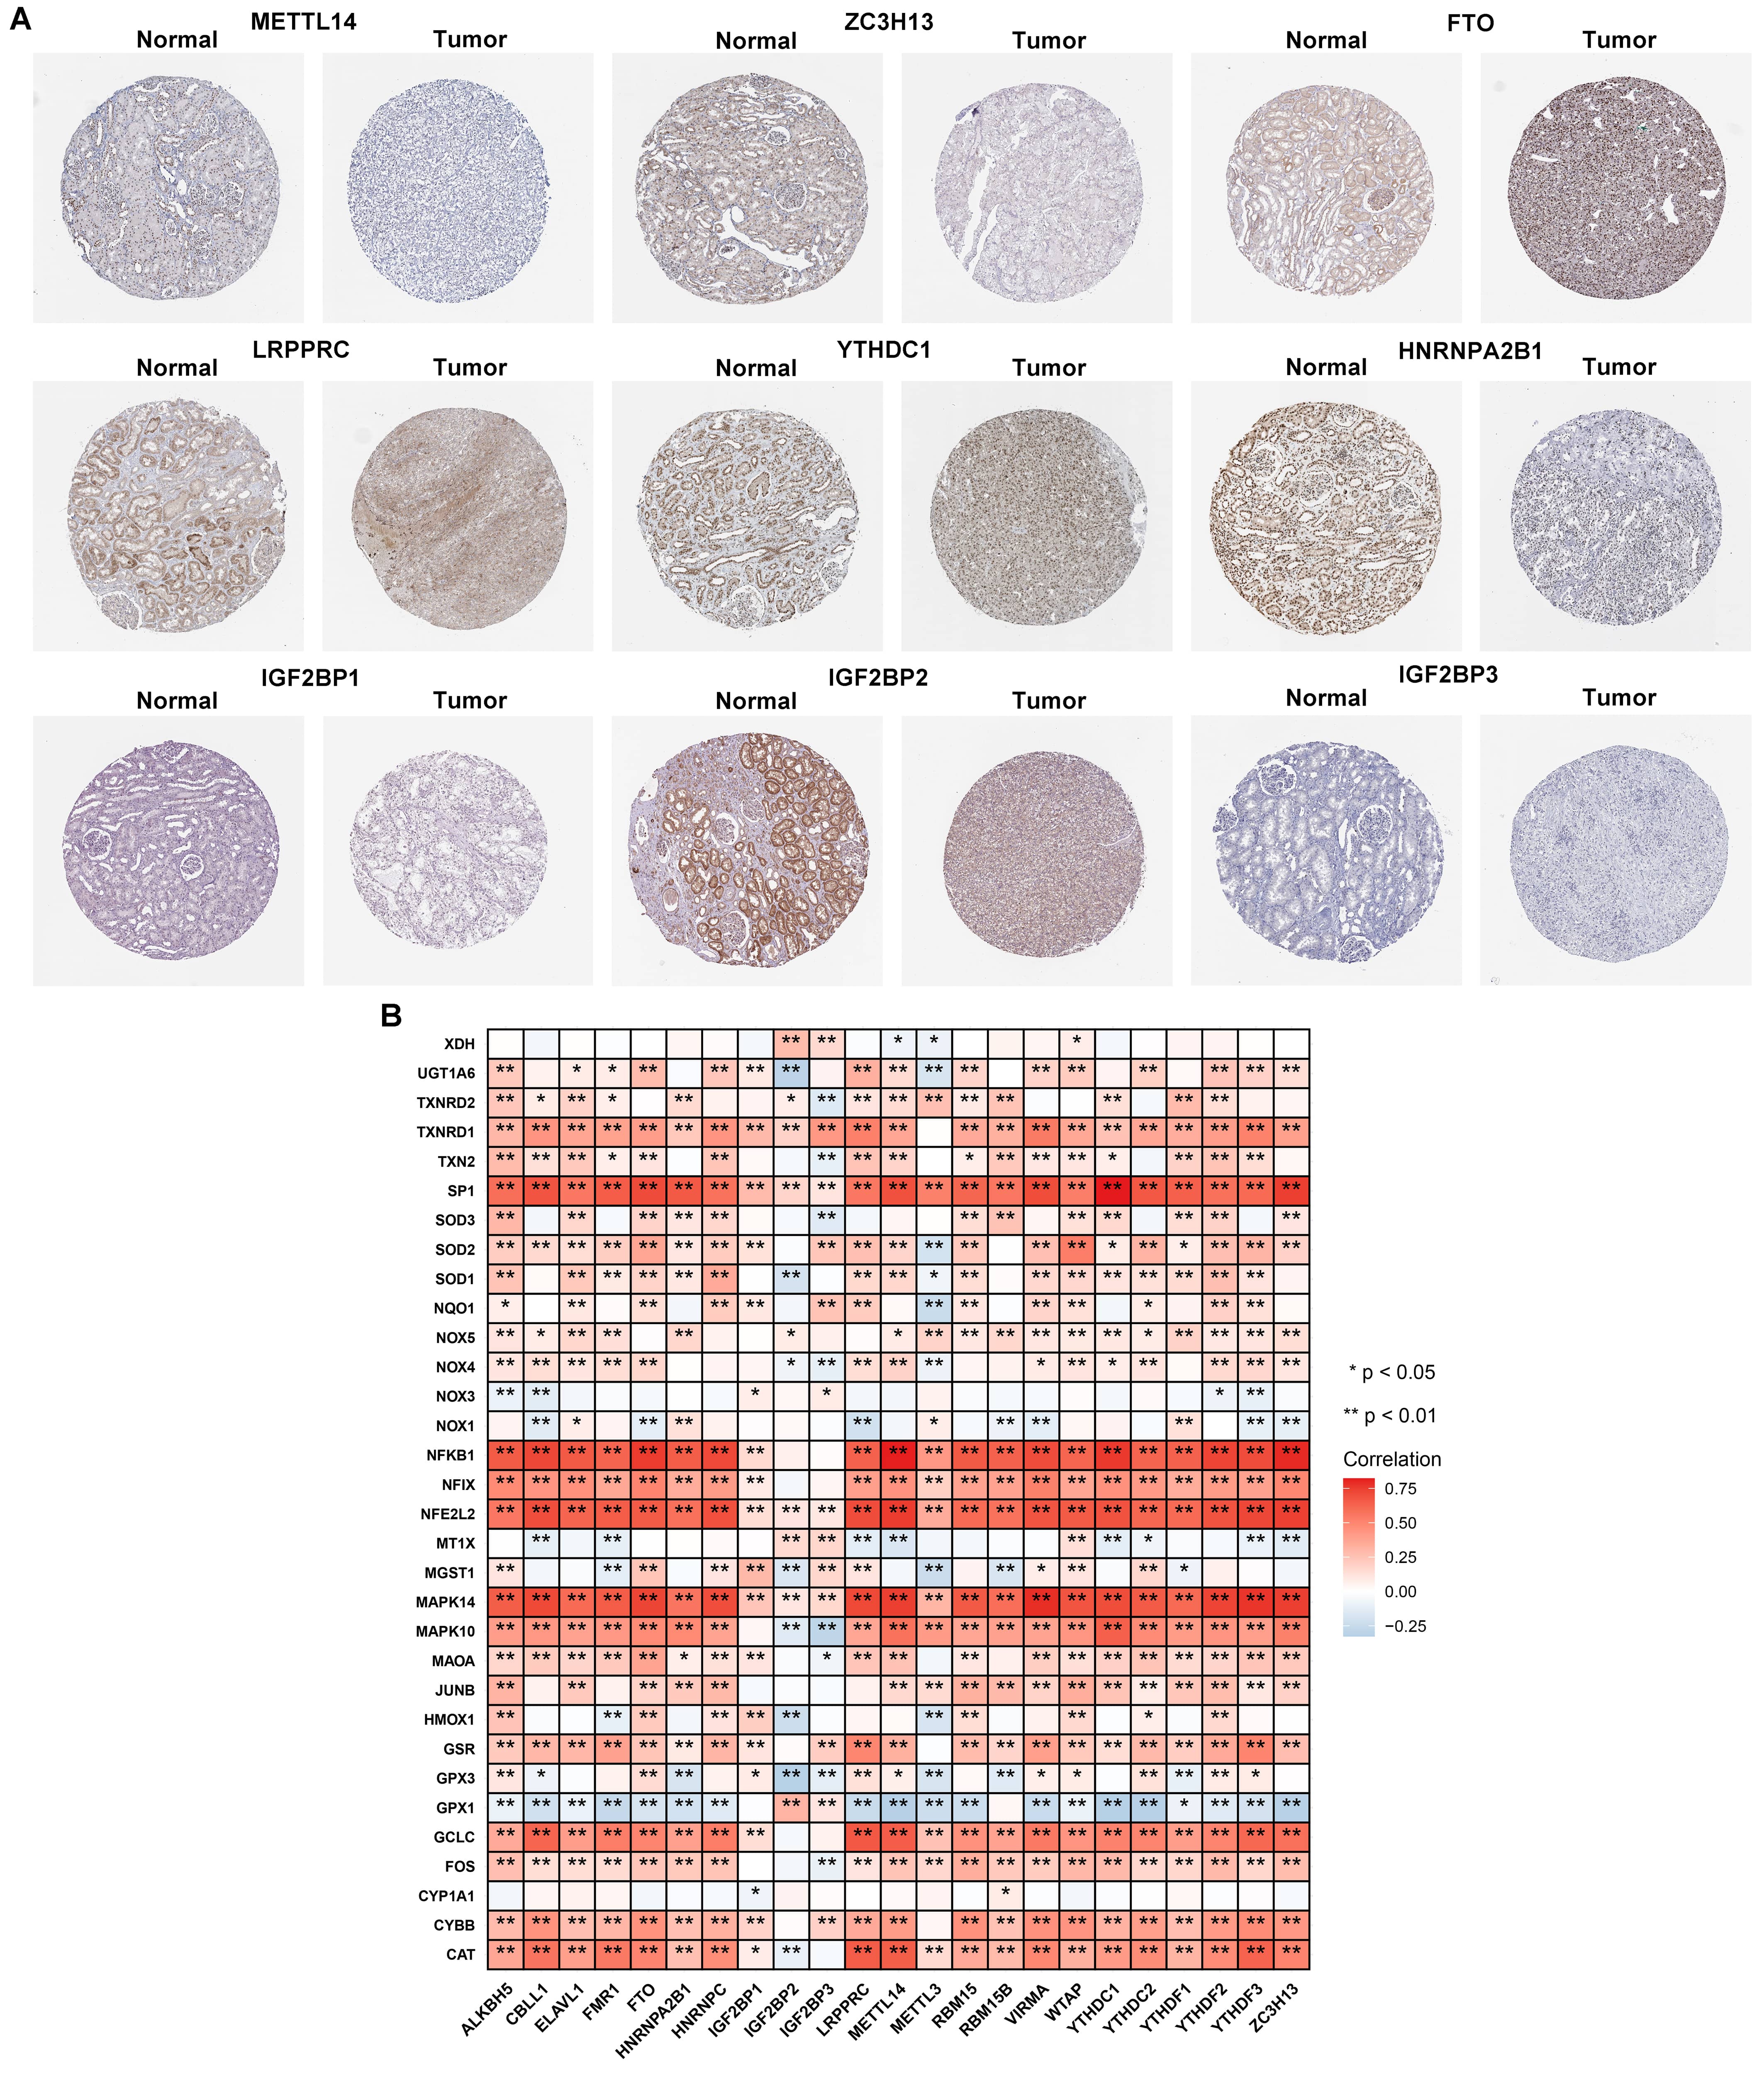 Fig. 2.
Protein expression of prognostic mA regulators and
interactions of mA regulators with oxidative stress in RCC. (A) Validation
of the expression of prognostic mA regulators in RCC and normal kidneys
from the Human Protein Altas database. Scale bar, 200 µm. (B) Heatmap of
the interactions of mA regulators and oxidative stress-related genes in
RCC. Red: positive correlation and green: negative correlation, *p
0.05; **p 0.01.
3.3 The MA Modification Subtypes with Different Prognosis,
Activation of Pathways, Cancer Stemness and Somatic Copy Number Alterations
(SCNA)
By performing consensus clustering analysis, we classified 893 RCC samples into
five mA modification subtypes based on the expression profile of the
mA regulators (Fig. 3A), named mA modification subtype A (N = 85), B
(N = 160), C (N = 105), D (N = 237) and E (N = 292). The t-SNE confirmed the
accuracy of this classification (Fig. 3B). Survival analyses were carried out
among the five mA modification subtypes. In Fig. 3C, we found that there
were significant differences in prognosis among subtypes, where subtype A
exhibited the worst survival outcomes, subtype E and B had the prominent survival
advantage, and subtype C and D had the moderate survival time. The mRNA
expression of the mA regulators was compared among subtypes. As a result,
subtype C had the lowest expression of the mA regulators, followed by
subtype D (Fig. 3D). Most mA regulators were up-regulated in subtype A, B
and E. To validate the reliability of this mA modification classification,
the E-MTAB-1980 dataset was adopted. Consistently, ccRCC patients were clearly
classified into five mA modification subtypes (Supplementary Fig.
3). The notable survival difference among the subtypes was also proven
(Supplementary Fig. 3). The activation of the major biological processes
was quantified in each RCC specimen vis ssGSEA. Almost all pathways were
inactivated in subtype C and D (Fig. 3E). However, most pathways were activated
in subtype A, B and E. Cancer stemness was quantified by two indices: mDNAsi and
mRNAsi. In Fig. 3F, subtype B had the lowest mDNAsi value while subtype E had the
highest mDNAsi value. But mRNAsi value was the lowest in subtype E (Fig. 3G). The
somatic copy number alteration (SCNA) was observed in each RCC specimen. Among
subtypes, subtype A exhibited the highest SCNA level (Fig. 3H).
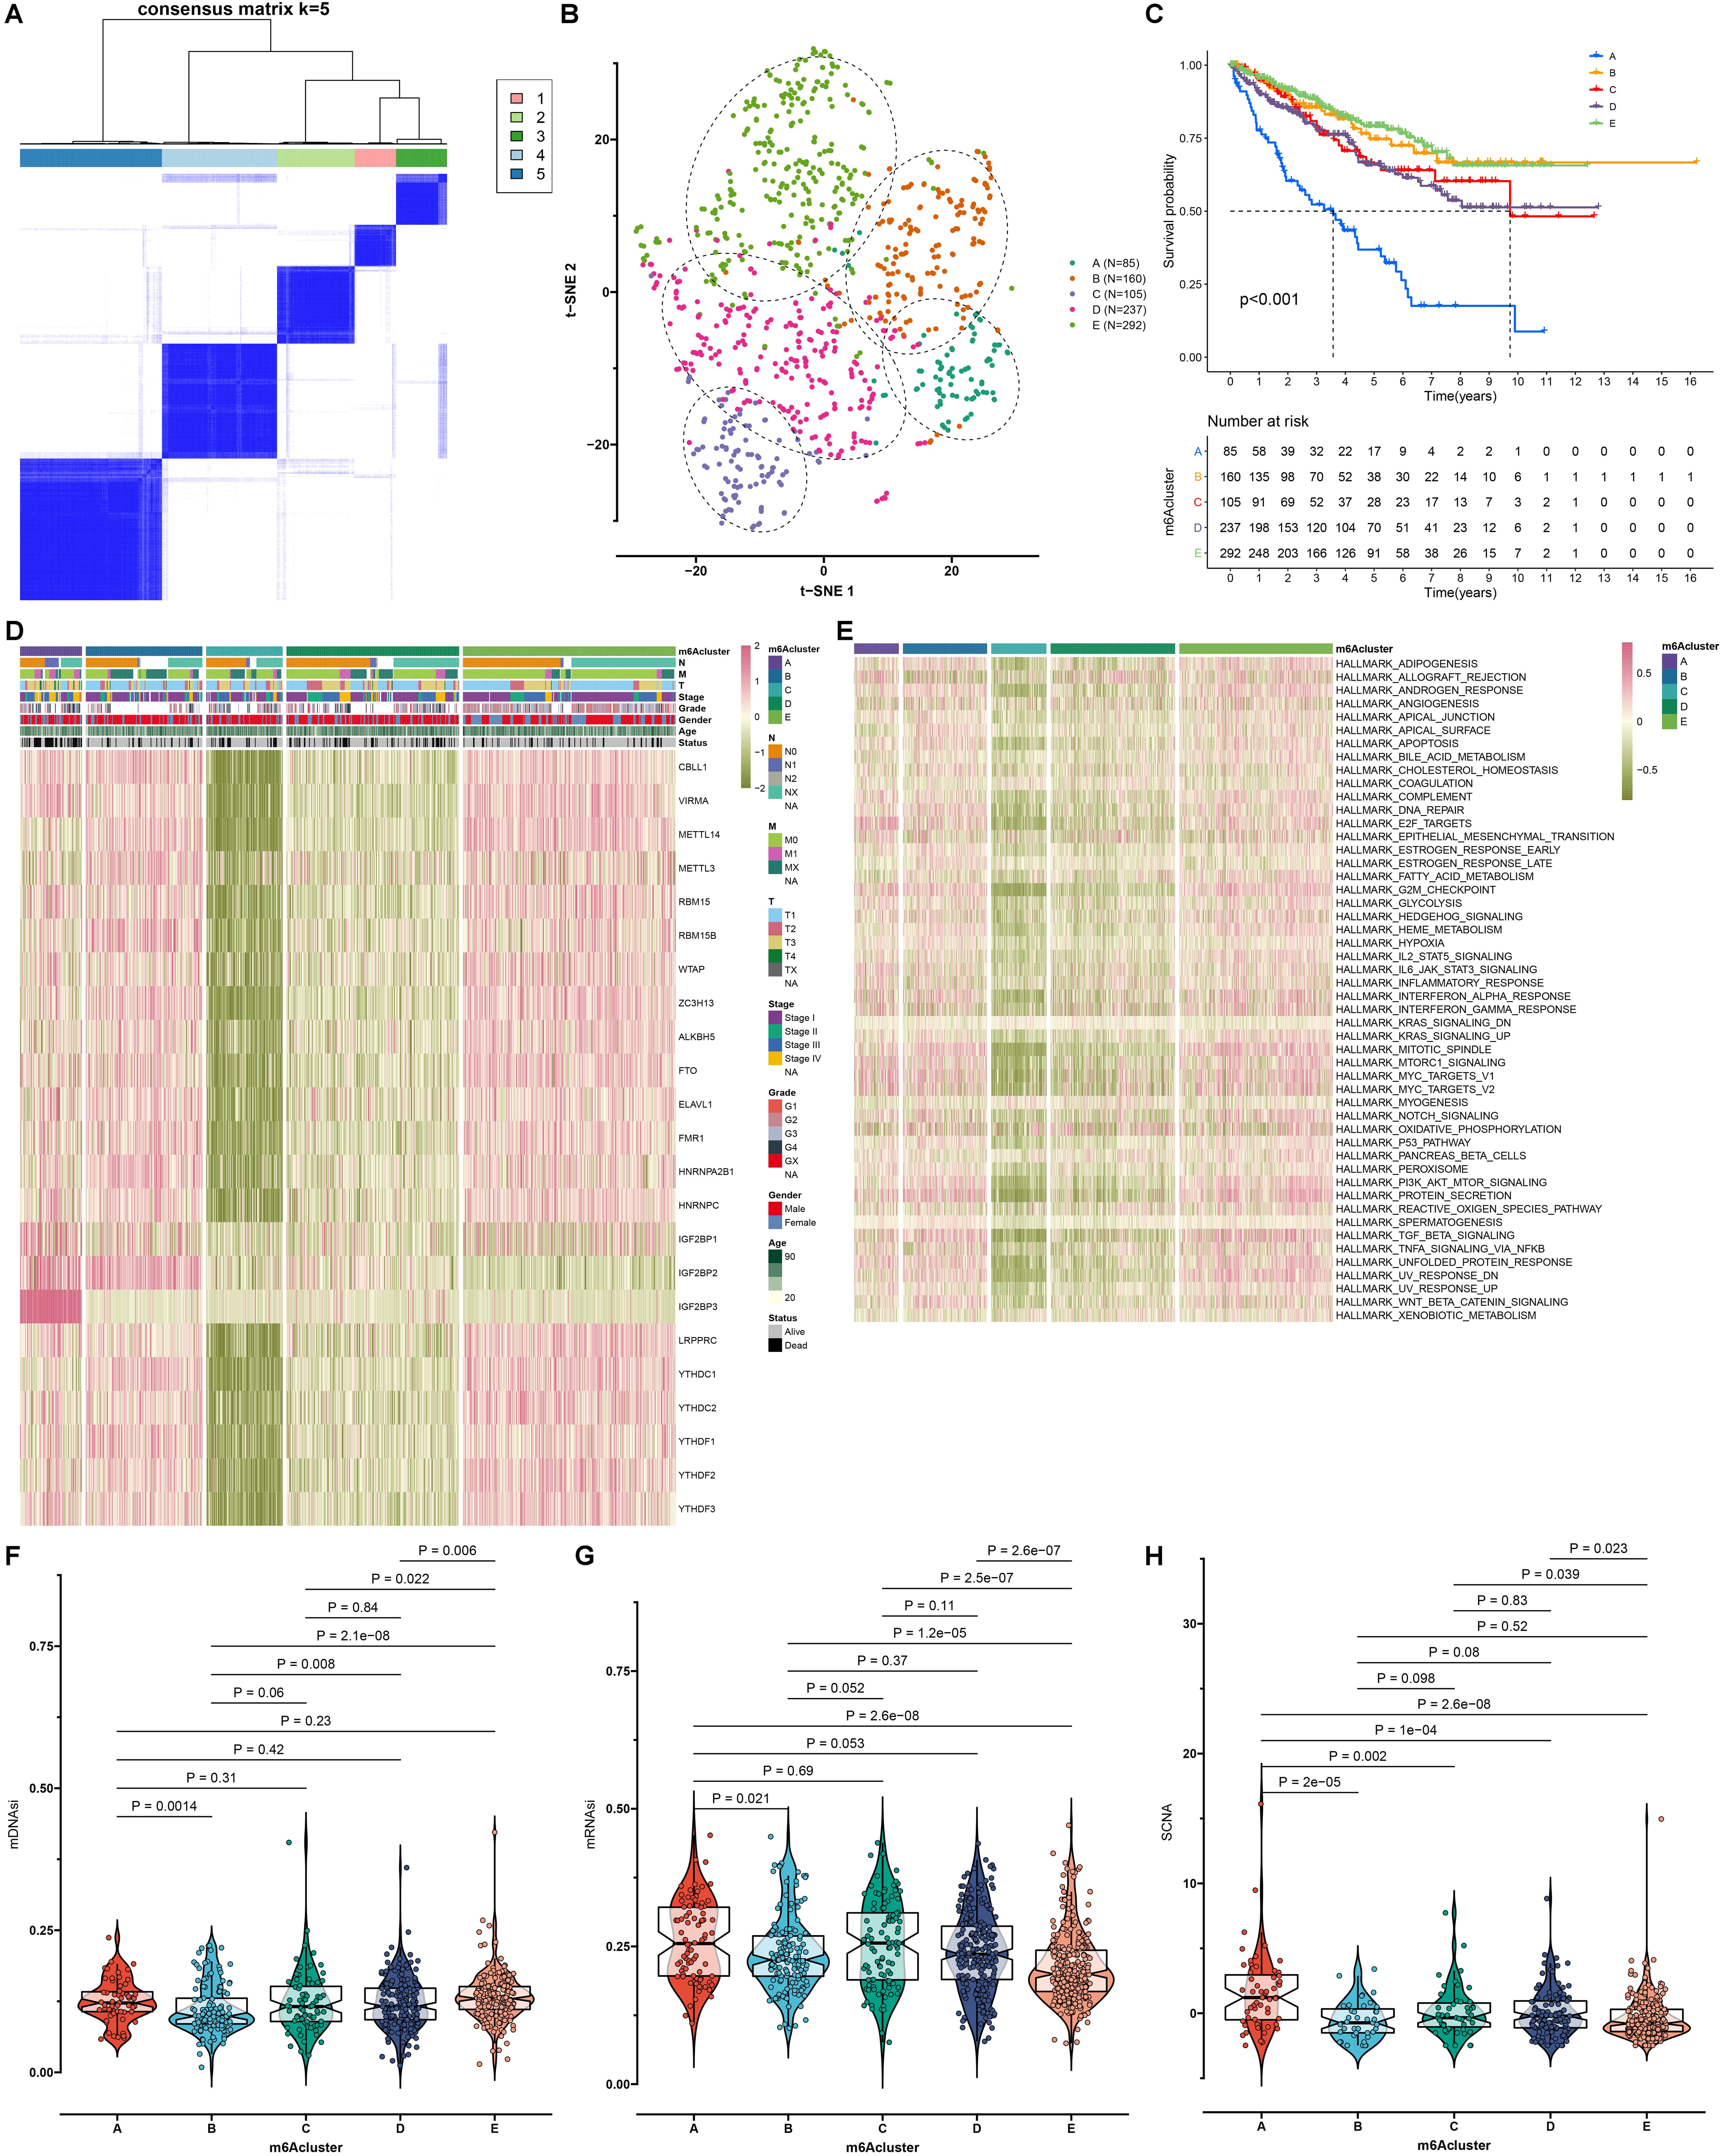 Fig. 3.
Construction of the mA modification subtypes with
different prognosis, activation of pathways, cancer stemness and somatic copy
number alteration (SCNA) across RCC samples. (A) Consensus clustering analyses
for identifying the best clustering number (k = 5) across RCC samples based on
the expression matrix of mA regulators. (B) The t-SNE for assessing the
clustering accuracy across RCC samples. (C) Survival analyses of RCC patients in
different mA modification subtypes with log-rank tests. (D) An overview of
the mRNA expression of mA regulators in each mA modification subtype.
Red: up-regulation and green: down-regulation. (E) An overview of the activation
levels of the 50 main signaling pathways in RCC specimens from five mA
modification subtypes. (F) The mDNAsi score, (G) mRNAsi score and (H) SCNA level
among different mA modification subtypes. p values were determined
with Kruskal-Wallis test.
3.4 The MA Modification Subtypes with Distinct Oxidative
Stress and Tumor Immunity
By ssGSEA method, we quantified the infiltration levels of immune cells in RCC
tissues. As a result, subtype A had the highest infiltration levels of most
tumor-infiltrating immune cells, but subtype B displayed the lowest infiltration
levels of most immune cells (Fig. 4A,B). With the same approach, the activity of
oxidative stress was quantified. The significant heterogeneity in oxidative
stress was found among five subtypes (Fig. 4C). Among them, subtype B had the
lowest activity of oxidative stress. The mRNA expression of immune checkpoints
PD-1 and PD-L1 was compared among subtypes. We found that patients in subtype A
exhibited the highest mRNA expression of PD-1 (Fig. 4D) and PD-L1 (Fig. 4E). The
enrichment levels of each step in the cancer immunity cycle were evaluated across
RCC samples. Our results showed that most steps exhibited the highest activation
in subtype A, while most steps exhibited the lowest activation in subtype B (Fig. 4F). The overall infiltrations of immune cells and stromal cells were calculated
by ESTIMATE method. As expected, the highest immune score and stromal score were
found in subtype A (Fig. 4G,H). Meanwhile, we found that there were the lowest
immune score and stromal score in subtype B. Furthermore, subtype A displayed the
lowest tumor purity while the highest tumor purity was detected in subtype B
(Fig. 4I). Microsatellite instability (MSI) was quantified and compared among
mA modification subtypes. In Fig. 4J, our data showed
that there was the lowest MSI level in subtype E but there was the highest MSI
level in subtype B.
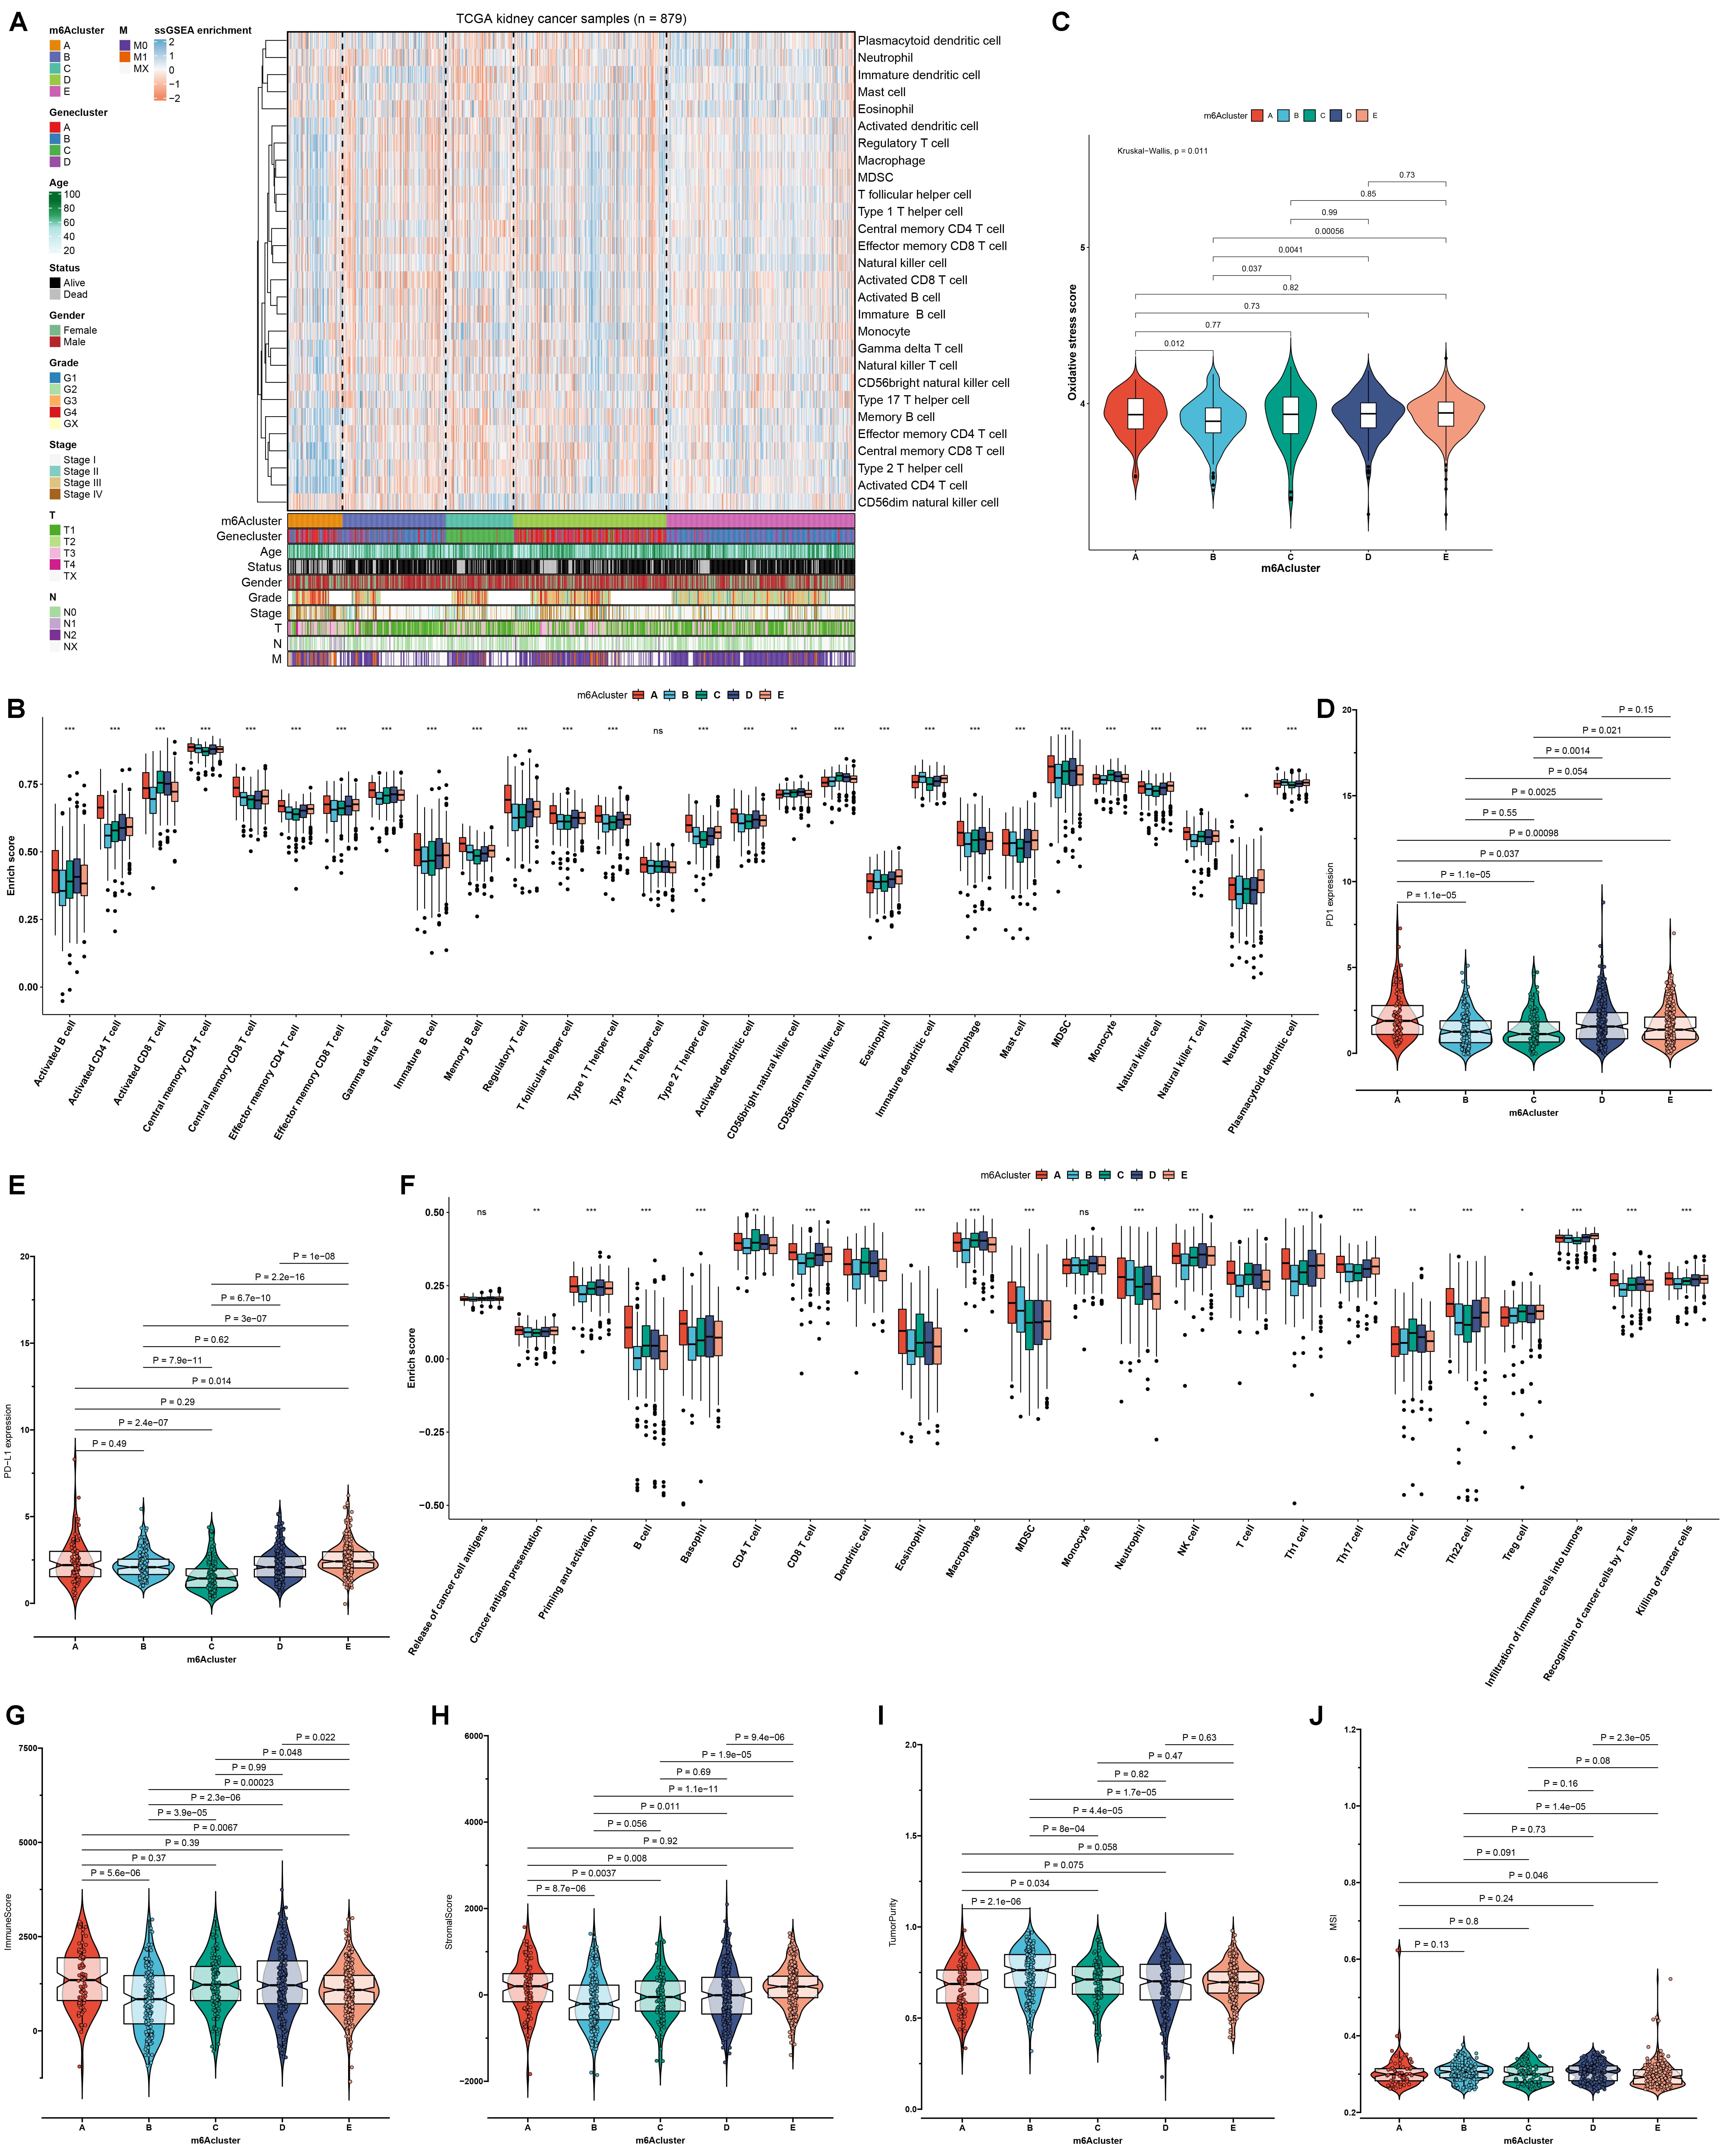 Fig. 4.
Assessment of the mA modification subtypes with distinct
oxidative stress and tumor immunity across RCC samples. (A,B) The infiltration
levels of immune cells among five mA modification subtypes. (C)
Activity of oxidative stress among five mA modification subtypes.
(D,E) The mRNA expression of immune checkpoints programmed cell death 1 (PD-1)
and programmed cell death ligand 1 (PD-L1) among five mA
modification subtypes. (F) The activation of each step in the cancer
immunity cycle among five mA modification subtypes. (G–I) Immune
score, stromal score, and tumor purity among five mA modification subtypes. (J) The microsatellite instability (MSI) level among five mA
modification subtypes. p values were calculated with
Kruskal-Wallis test, ns: not significant; *p 0.05; **p
0.01; ***p 0.001.
3.5 Exploration of Biological Implications of mA-Related DEGs
By comparing the DEGs between mA modification subtypes, we
finally identified 733 mA-related DEGs (Fig. 5A; Supplementary
Table 1). GO enrichment analyses indicated that these mA-related DEGs were
significantly correlated to methylation modification processes such as histone
modification, covalent chromatin modification and histone H3-H4 methylation (Fig. 5B). Meanwhile, we found that the mA-related DEGs were markedly enriched in
mRNA modification pathways (such as mRNA surveillance pathway) and carcinogenic
pathways (such as renal cell carcinoma, TGF-beta signaling pathway and central
carbon metabolism in cancer; Fig. 5C), which confirmed that mA modification
played a non-negligible role in the tumor progression. Among 733 mA-related
DEGs, 512 were significantly associated with RCC prognosis according to
univariate-cox regression analyses (Supplementary Table 2).
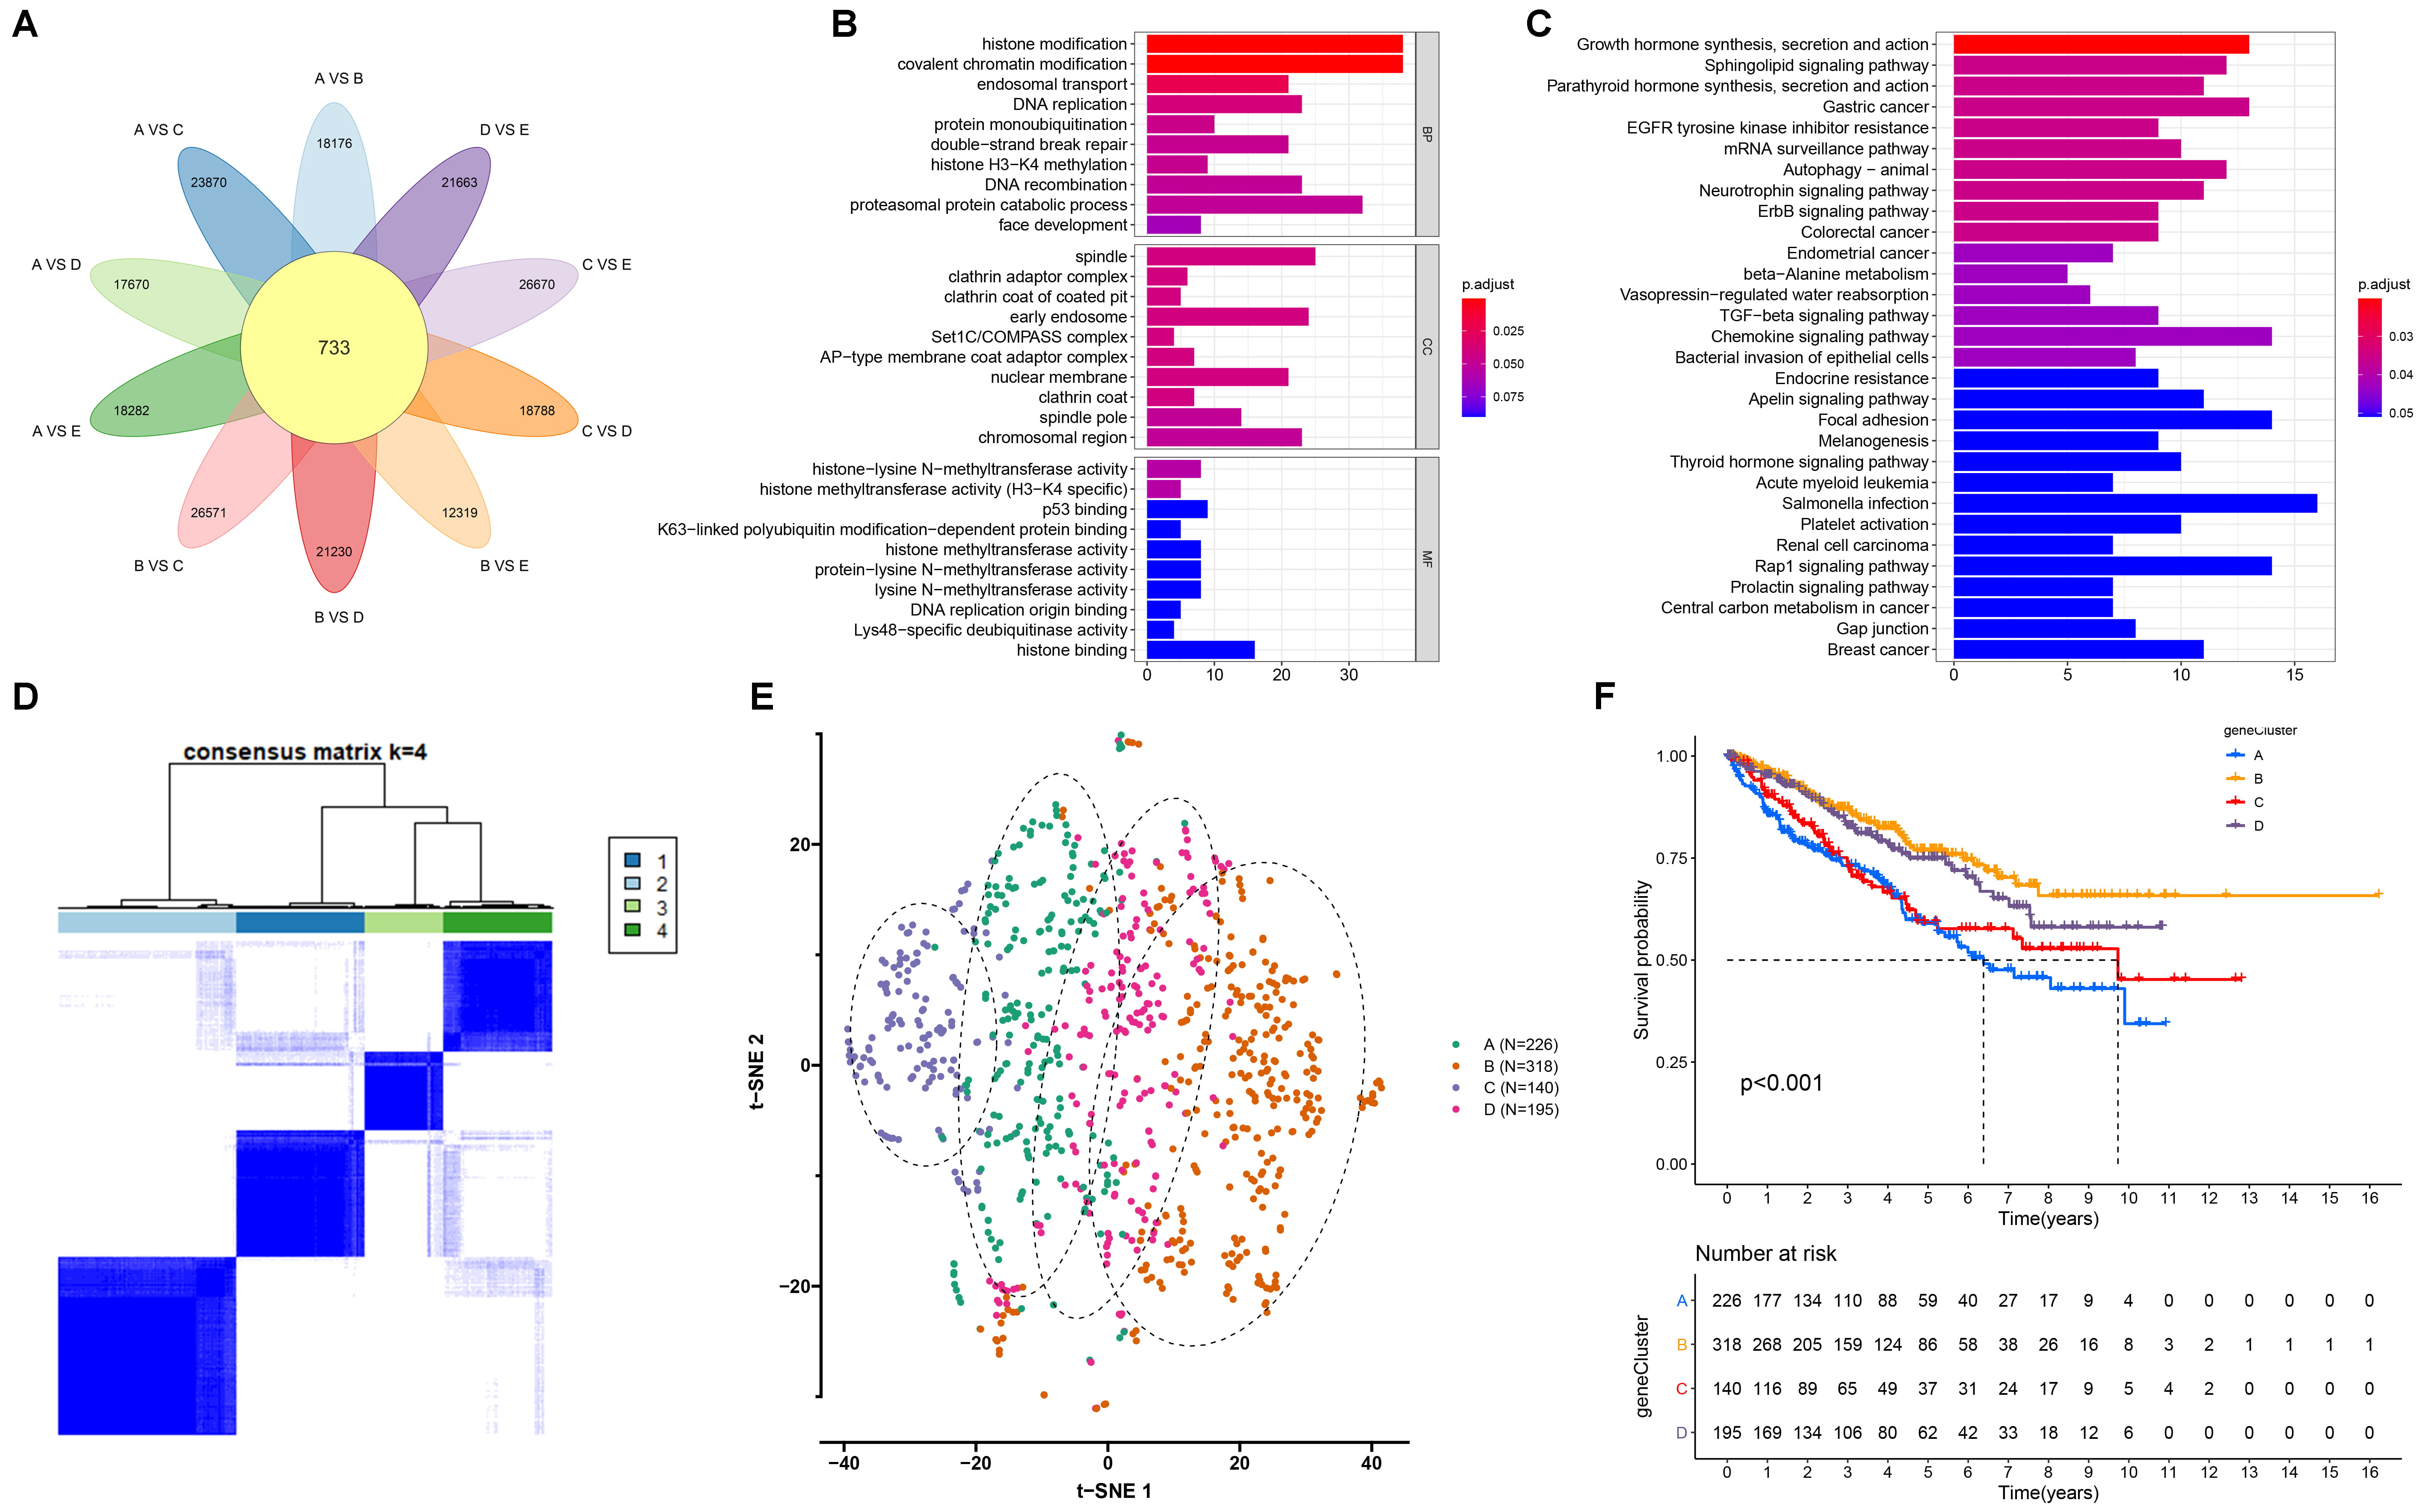 Fig. 5.
Establishment of the mA genomic subtypes with different
survival outcomes across RCC samples. (A) Venn diagram for the mA-related
differentially expressed genes (DEGs) by comparing the DEGs between mA
modification subtypes. (B,C) Gene ontology (GO) and kyoto encyclopedia
of genes and genomes (KEGG) enrichment results of the mA-related DEGs. The
length of the rectangle indicated the number of enriched genes in a specific
term. The more the color tended to red, the smaller the adjusted p
value. (D) The four mA genomic subtypes across RCC samples based on the
mA-related DEGs via unsupervised clustering analyses. (E) The t-SNE for
the transcriptome profiles among the four mA genomic subtypes. (F)
Kaplan-Meier survival curves for the four mA genomic subtypes across RCC
samples. p values were determined with log-rank tests.
3.6 Construction of the mA Genomic Subtypes Characterized by
Different Survival Outcomes
To further validated the regulation mechanism of mA modification, we
conducted unsupervised clustering analyses based on the obtained five mA
cluster-related genes. On the basis of the expression profiling of the 512
prognostic mA-related DEGs, 893 RCC samples were clustered into four
mA genomic subtypes by unsupervised clustering analyses, named mA
genomic subtype A (N = 226), B (N = 318), C (N = 140) and D (N = 195; Fig. 5D).
The t-SNE plots confirmed that there was a distinct difference on transcriptome
profiles among the four mA genomic subtypes (Fig. 5E). Prognostic analyses
showed that there was a significant difference in survival outcomes among
mA genomic subtypes (Fig. 5F), where mA genomic subtype B had the
most prominent survival advantage and mA genomic subtype A exhibited the
poorest survival outcomes.
3.7 Oxidative Stress, TME Cell Infiltration and Transcriptome
Features in Distinct mA Genomic Subtypes
To explore the biological processes of the four mA genomic subtypes, we
used GSVA to analyze the activity of the top 50 signaling pathways. In Fig. 6A,
mA genomic subtype B and D displayed the activation of most pathways, while
mA genomic subtype A and C had the inactivation of most pathways. Among
four mA genomic subtypes, subtype D displayed the highest activity of
oxidative stress (Fig. 6B). The roles of the mA genomic subtypes in
regulating the TME immune infiltration were further analyzed. We found that
several antitumor immune cells such as activated CD8 T cells, activated CD4 T
cells, central memory CD4 T cells, central memory CD8 T cells, effector memory
CD4 T cells, effector memory CD8 T cells, activated dendritic cells and natural
killer T cells displayed the relatively high infiltration levels in mA
genomic subtype A (Fig. 6C). Meanwhile, the most protumor immune cells such as
immature dendritic cells, and plasmacytoid dendritic cells exhibited the low
infiltration levels in mA genomic subtype A and C as well as the high
infiltration levels in mA genomic subtype B and D. The activity of cancer
immunity cycle was also analyzed. As a result, priming and activation of the
immune system, recognition of cancer cells by T cells and killing of cancer cells
had the highest activity in mA genomic subtype A (Fig. 6D). Above steps
exhibited the relatively low activity in mA genomic subtype B and C. This
indicated that mA genomic subtype A might be an inflammatory phenotype,
while mA genomic subtype B and C might be non-inflammatory phenotypes.
Also, we quantified the mRNA expression of immune checkpoints. As expected, PD-1
expression was the highest in mA genomic subtype A, while its expression
was the lowest in mA genomic subtype C (Fig. 6E). Furthermore, mA
genomic subtype B had the highest PD-L1 expression, while mA genomic
subtype C had the lowest PD-L1 expression (Fig. 6F). These data indicated that
mA genomic subtype A and B might be more sensitive to anti-PD-1/PD-L1
therapy.
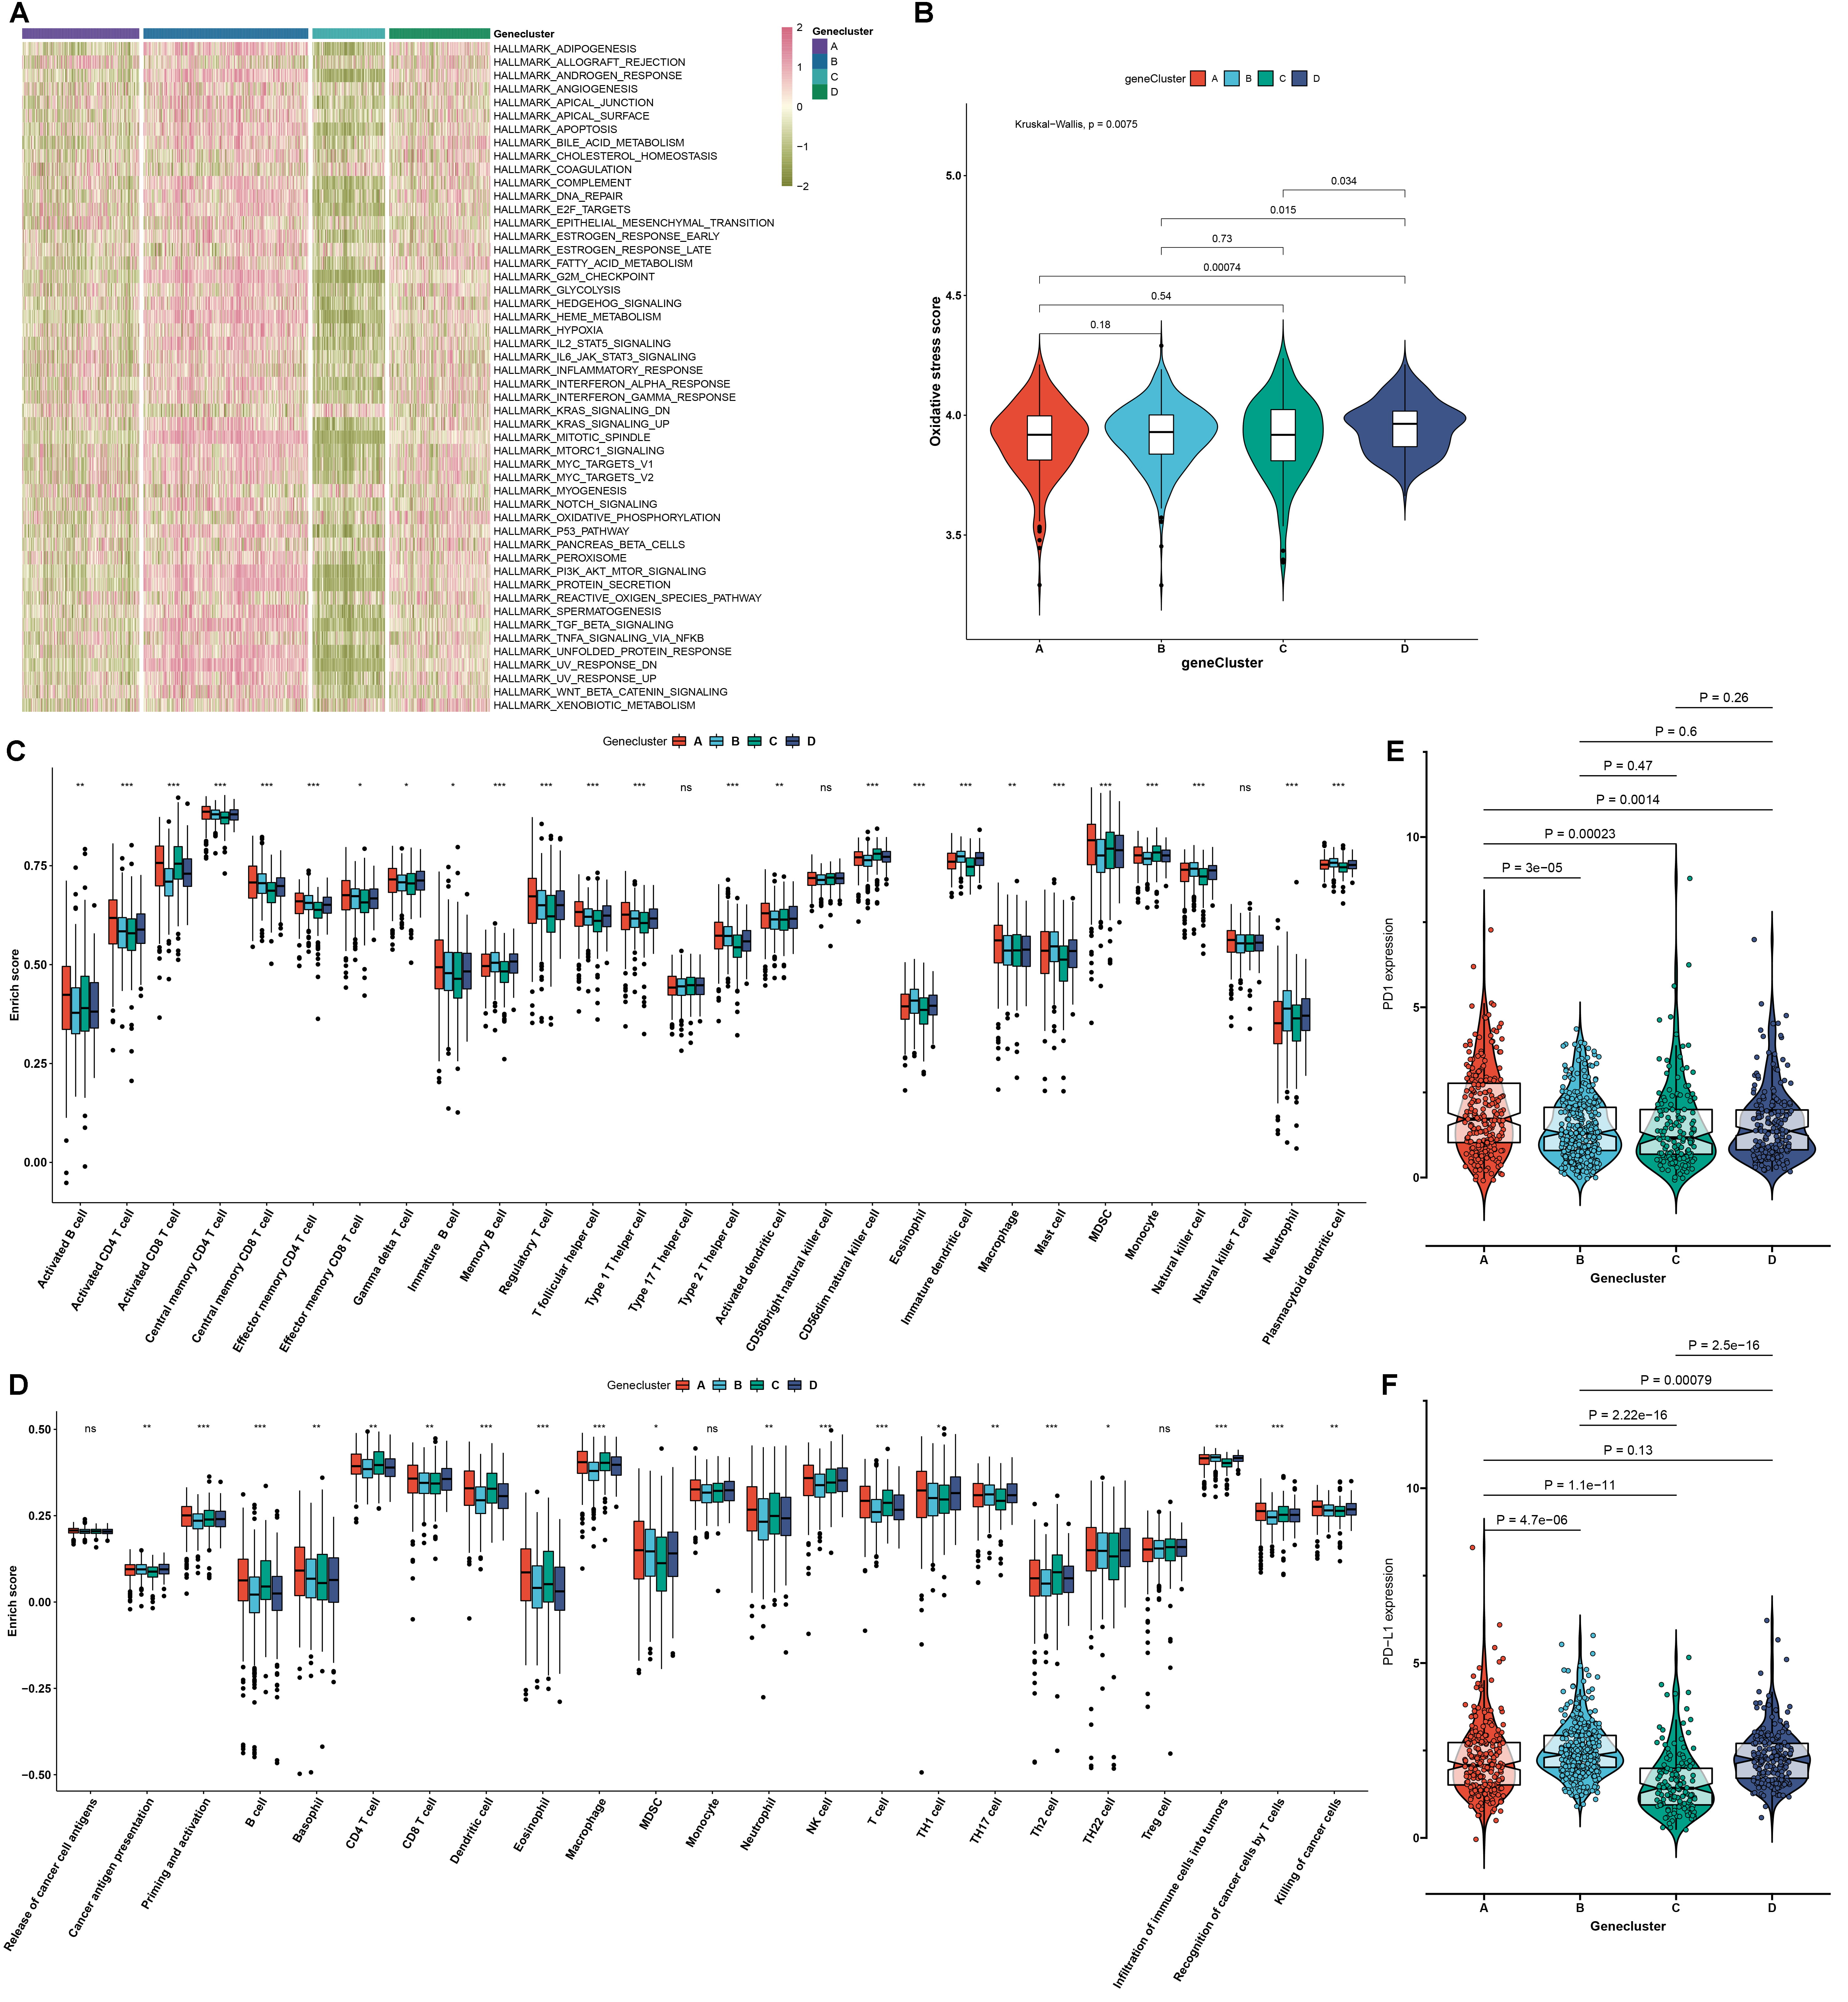 Fig. 6.
The mA genomic subtypes characterized by oxidative stress,
tumor microenvironment (TME) cell infiltration and transcriptome features across
RCC samples. (A) An overview of the activity of the major 50 signaling pathways
in RCC specimens from the four mA genomic subtypes. Red: activation and
green: inactivation. (B) Activity of oxidative stress in the four mA
genomic subtypes. (C) The enrichment scores of tumor-infiltrating immune cells in
the four mA genomic subtypes. (D) The activity of each step in the cancer
immunity cycle in the four mA genomic subtypes. (E,F) The mRNA expression
of immune checkpoints PD-1 and PD-L1 in the four mA genomic subtypes.
p values were calculated with Kruskal-Wallis test, ns: not significant;
*p 0.05; **p 0.01; ***p 0.001.
3.8 Generation of mA Scoring System and Assessment of the
Prognostic Value of mA Score in RCC
Due to the heterogeneity and complexity of mA methylation modification, a
mA scoring system was generated for quantifying mA modification
subtypes of each RCC patient based on the expression profiling of the prognostic
mA-related DEGs that were identified by PCA method using the Boruta
algorithm, named mA score (Fig. 7A). For better illustrating the clinical
value of mA score, this study analyzed the distribution of mA score
in different clinicopathological characteristics (Fig. 7B). Our data showed that
patients with age 65 had the significantly lower mA score compared
to those with age 65. There was a significantly decreased mA score in
male patients than female patients. With the increase of grade, stage and T,
mA score was gradually reduced across RCC specimens. Metastatic patients
had significantly lower mA score than non-metastatic patients. Patients
with N1-2 displayed markedly reduced mA score in comparison to those with
N0. In addition, we also explored the relationship between clinical factors and
mA score. Low mA score was corresponding to more dead cases
(p 0.001), advance stage and grade cases (Supplementary Fig.
4). Based on the median mA score, RCC patients in the TCGA cohort were
separated into high and low mA score group. Survival analysis were then
presented for comparing the prognostic divergence between groups. As a result,
patients with high mA score displayed the prominent advantage in OS, DSS
and PFI in comparison to those with low mA score (Fig. 7C–E).
Consistently, better OS outcomes were observed in high mA score group
relative to low mA score group in the E-MTAB-1980 dataset (Fig. 7F). The
prognostic value of mA score was also externally verified in the two
anti-PD-1/PD-L1 immunotherapy cohorts. Both in the GSE78220 dataset and the
dataset reported by Liu et al. [37], high mA score indicated
undesirable outcomes than low mA score among patients who received
anti-PD-1/PD-L1 therapy (Fig. 7G,H). Finally, we estimated the correlation
between mA cluster, genomic cluster and mA score using sankey plot
(Supplementary Fig. 5). Most of cases from mA cluster E and
genomic cluster B were attribute to high mA score, which can partly explain
why mA cluster E and genomic cluster B associated with a better survival
outcome.
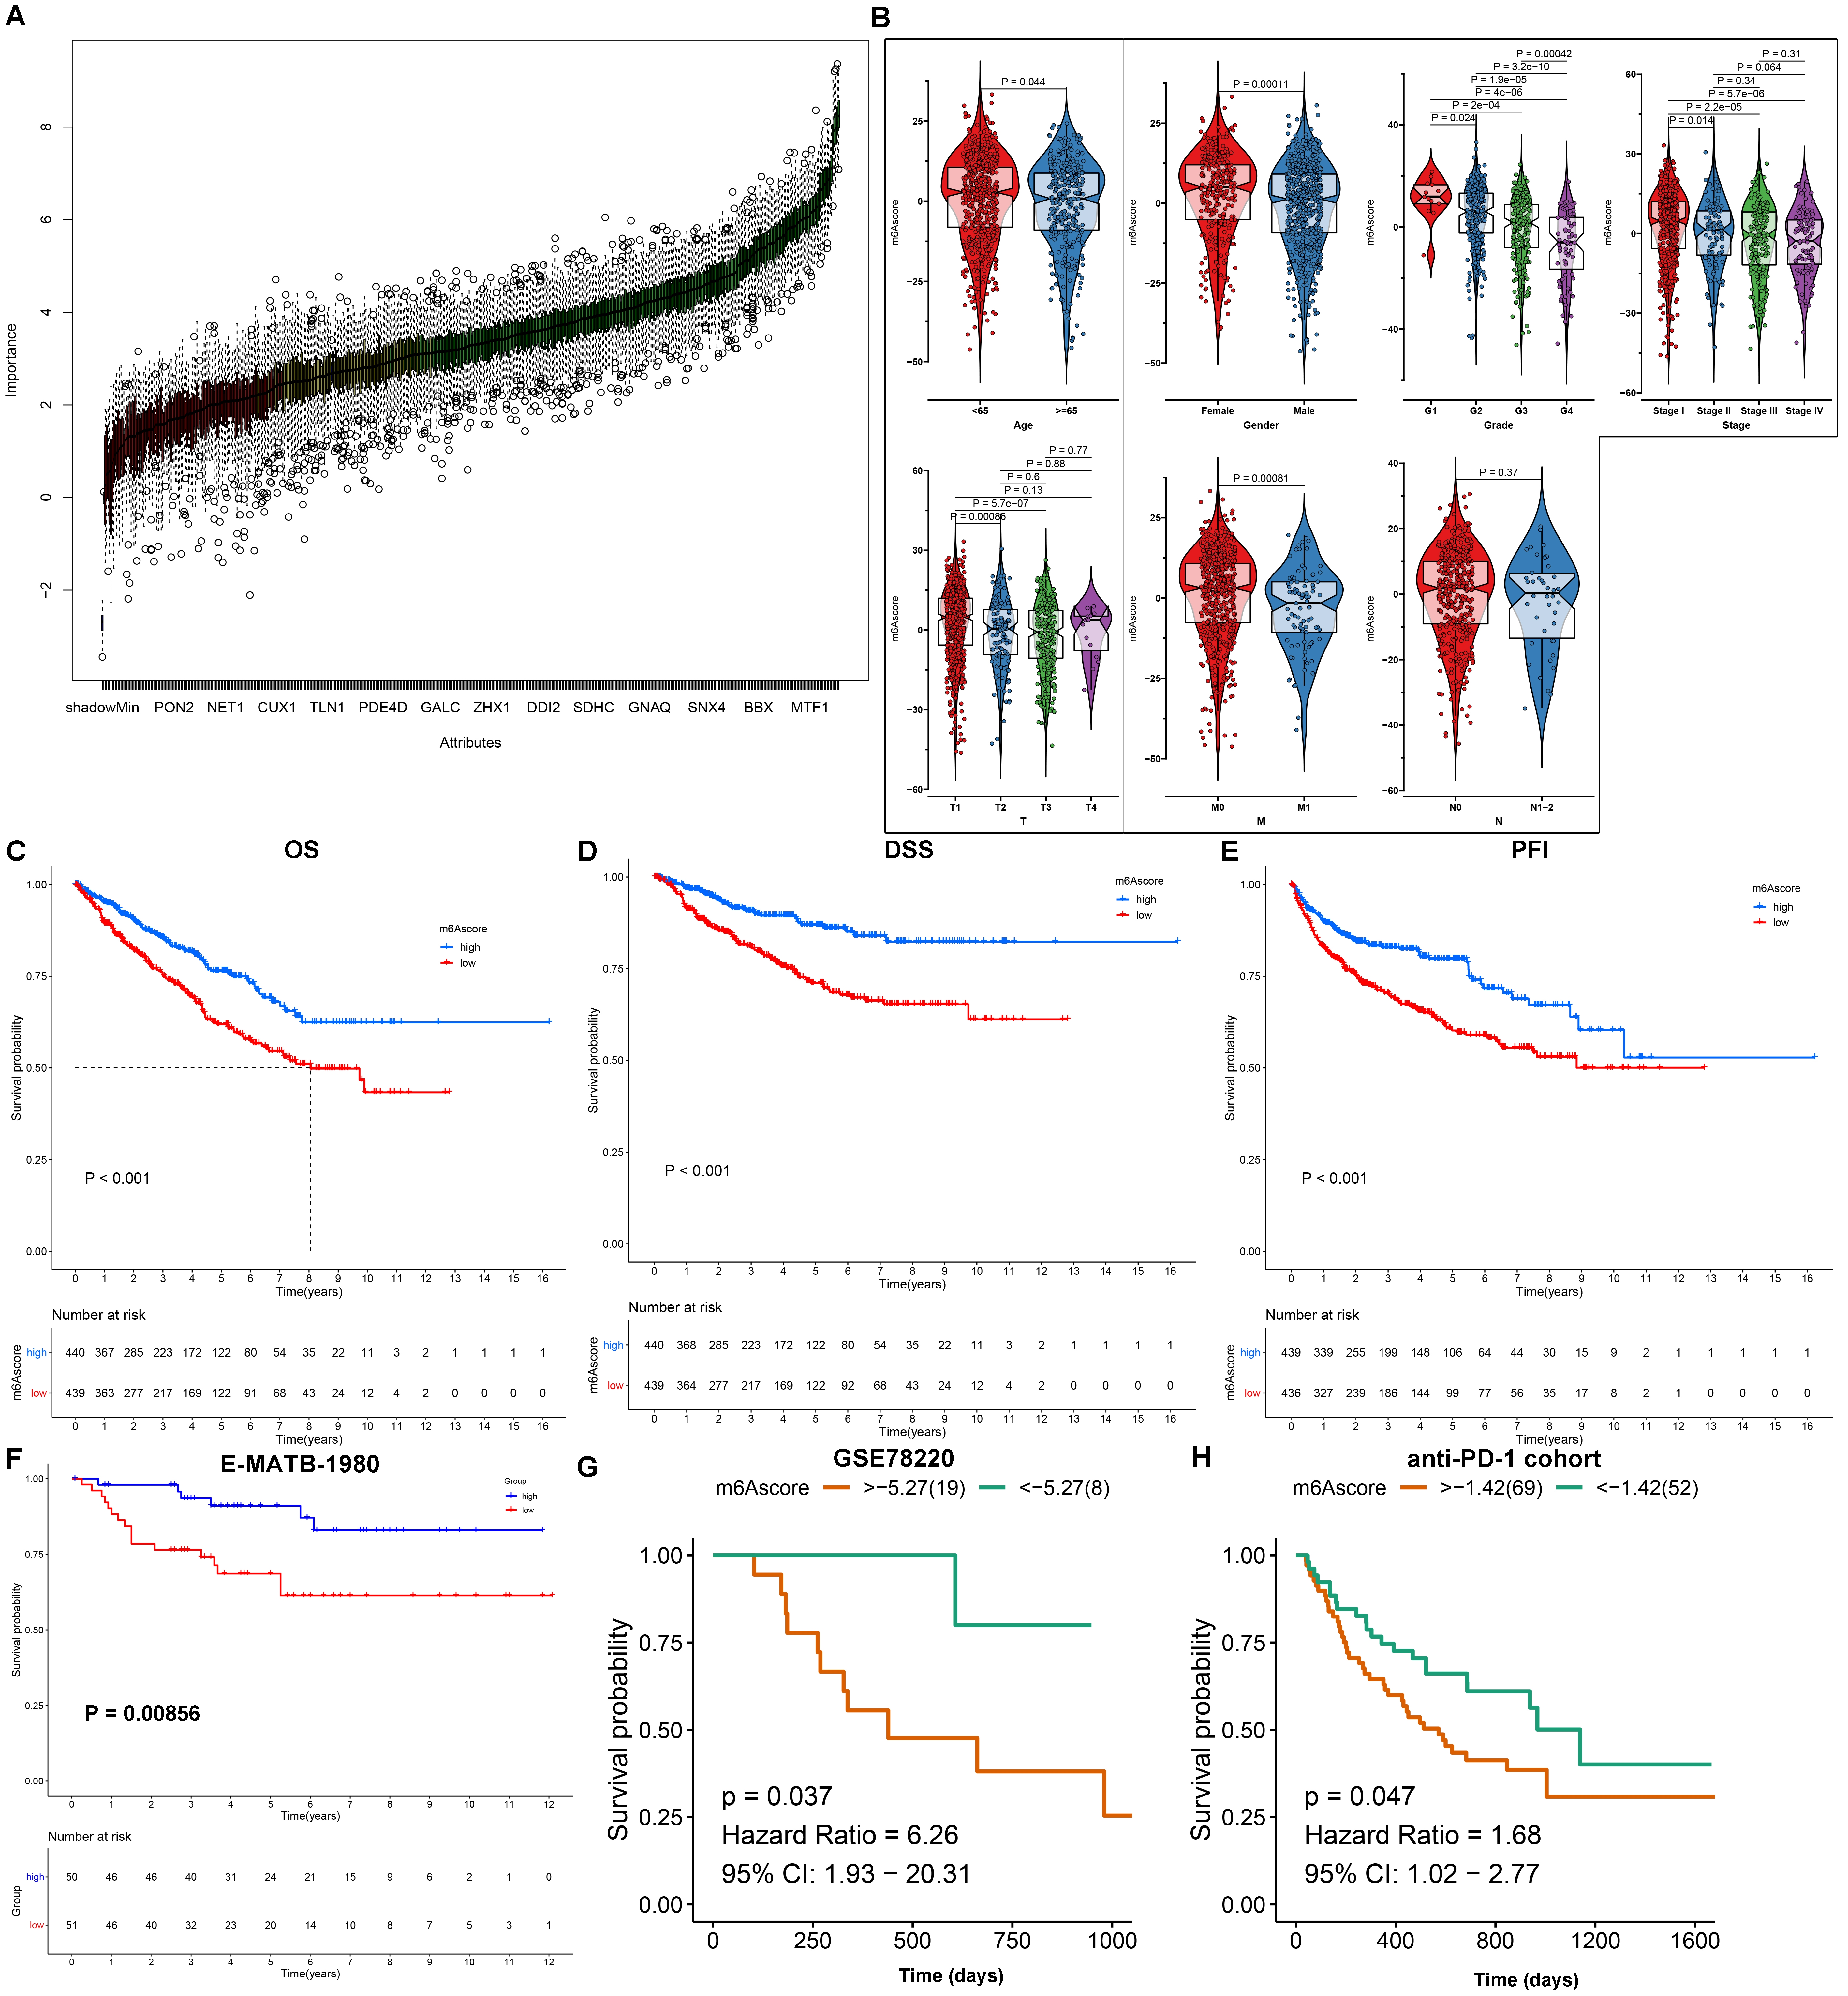 Fig. 7.
Generation of mA scoring system and assessment and
external validation of the prognostic value of mA score for RCC patients.
(A) Identification of the final mA-related DEGs that were used for
construction of mA score by principal component analysis (PCA) method
utilizing Boruta algorithm. (B) The distribution of mA score in different
clinicopathological characteristics across RCC patients, including age, sex,
stage, grade and T, N, M. p values were determined with Wilcoxon or
Kruskal-Wallis tests. (C–E) Kaplan-Meier curves of OS, DSS and PFI for RCC
patients with high and low mA score in the TCGA cohort. (F) Kaplan-Meier
curves of OS between high and low mA score ccRCC patients in the
E-MTAB-1980 cohort. (G,H) Kaplan-Meier curves of OS between high and low mA
score groups for patients treated with anti-PD-1/PD-L1 therapy in the GSE78220
dataset and the dataset reported by Liu et al [37].
3.9 Correlation between mA Score and Signaling Pathways, Tumor
Immunity and Oxidative Stress in RCC
The activity of the major signaling pathways was compared in high- and
low-mA score RCC patients. We found that most pathways such as carcinogenic
pathways and inflammation-related pathways were distinctly activated in
high-mA score group compared to low-mA score group. Meanwhile, in
comparison to high-mA score group, KRAS signaling, coagulation and
myogenesis were distinctly activated in low-mA score group (Fig. 8A).
Consistently, GSEA results revealed that apoptosis, focal adhesion, insulin
signaling pathway, MAPK signaling pathway, oocyte meiosis, pathway in cancer and
WNT signaling pathway were significantly up-regulated in high-mA score
samples than low-mA score samples (Fig. 8B). No pathways were significantly
enriched in low-mA score specimens. Furthermore, we evaluated the
differences in tumor immunity between high- and low-mA score groups. Most
immune checkpoints such as LAIR1, HAVCR2 and ICOS displayed the higher mRNA
expression in high-mA score group compared to low-mA score group
(Fig. 8C). TNFRSF18, TNFSF14, TMIGD2, LAG3 and CD70 were significantly
up-regulated in low-mA score group than high-mA score group. There
were increased infiltration levels of central memory CD8 T cell, eosinophil,
effector memory CD4 T cell, memory B cell, type 2 T helper cell, mast cell,
neutrophil, natural killer cell, plasmacytoid dendritic cell and immature
dendritic cell in high-mA score group than low-mA score group (Fig. 8D). Meanwhile, activated CD8 T cell, CD56dim natural killer cell, monocyte, MDSC
and activated B cell exhibited the higher infiltration levels in low-mA
score group in comparison to high-mA score group. Most oxidative
stress-related genes had higher expression levels in high- than low-mA
score group (Fig. 8E).
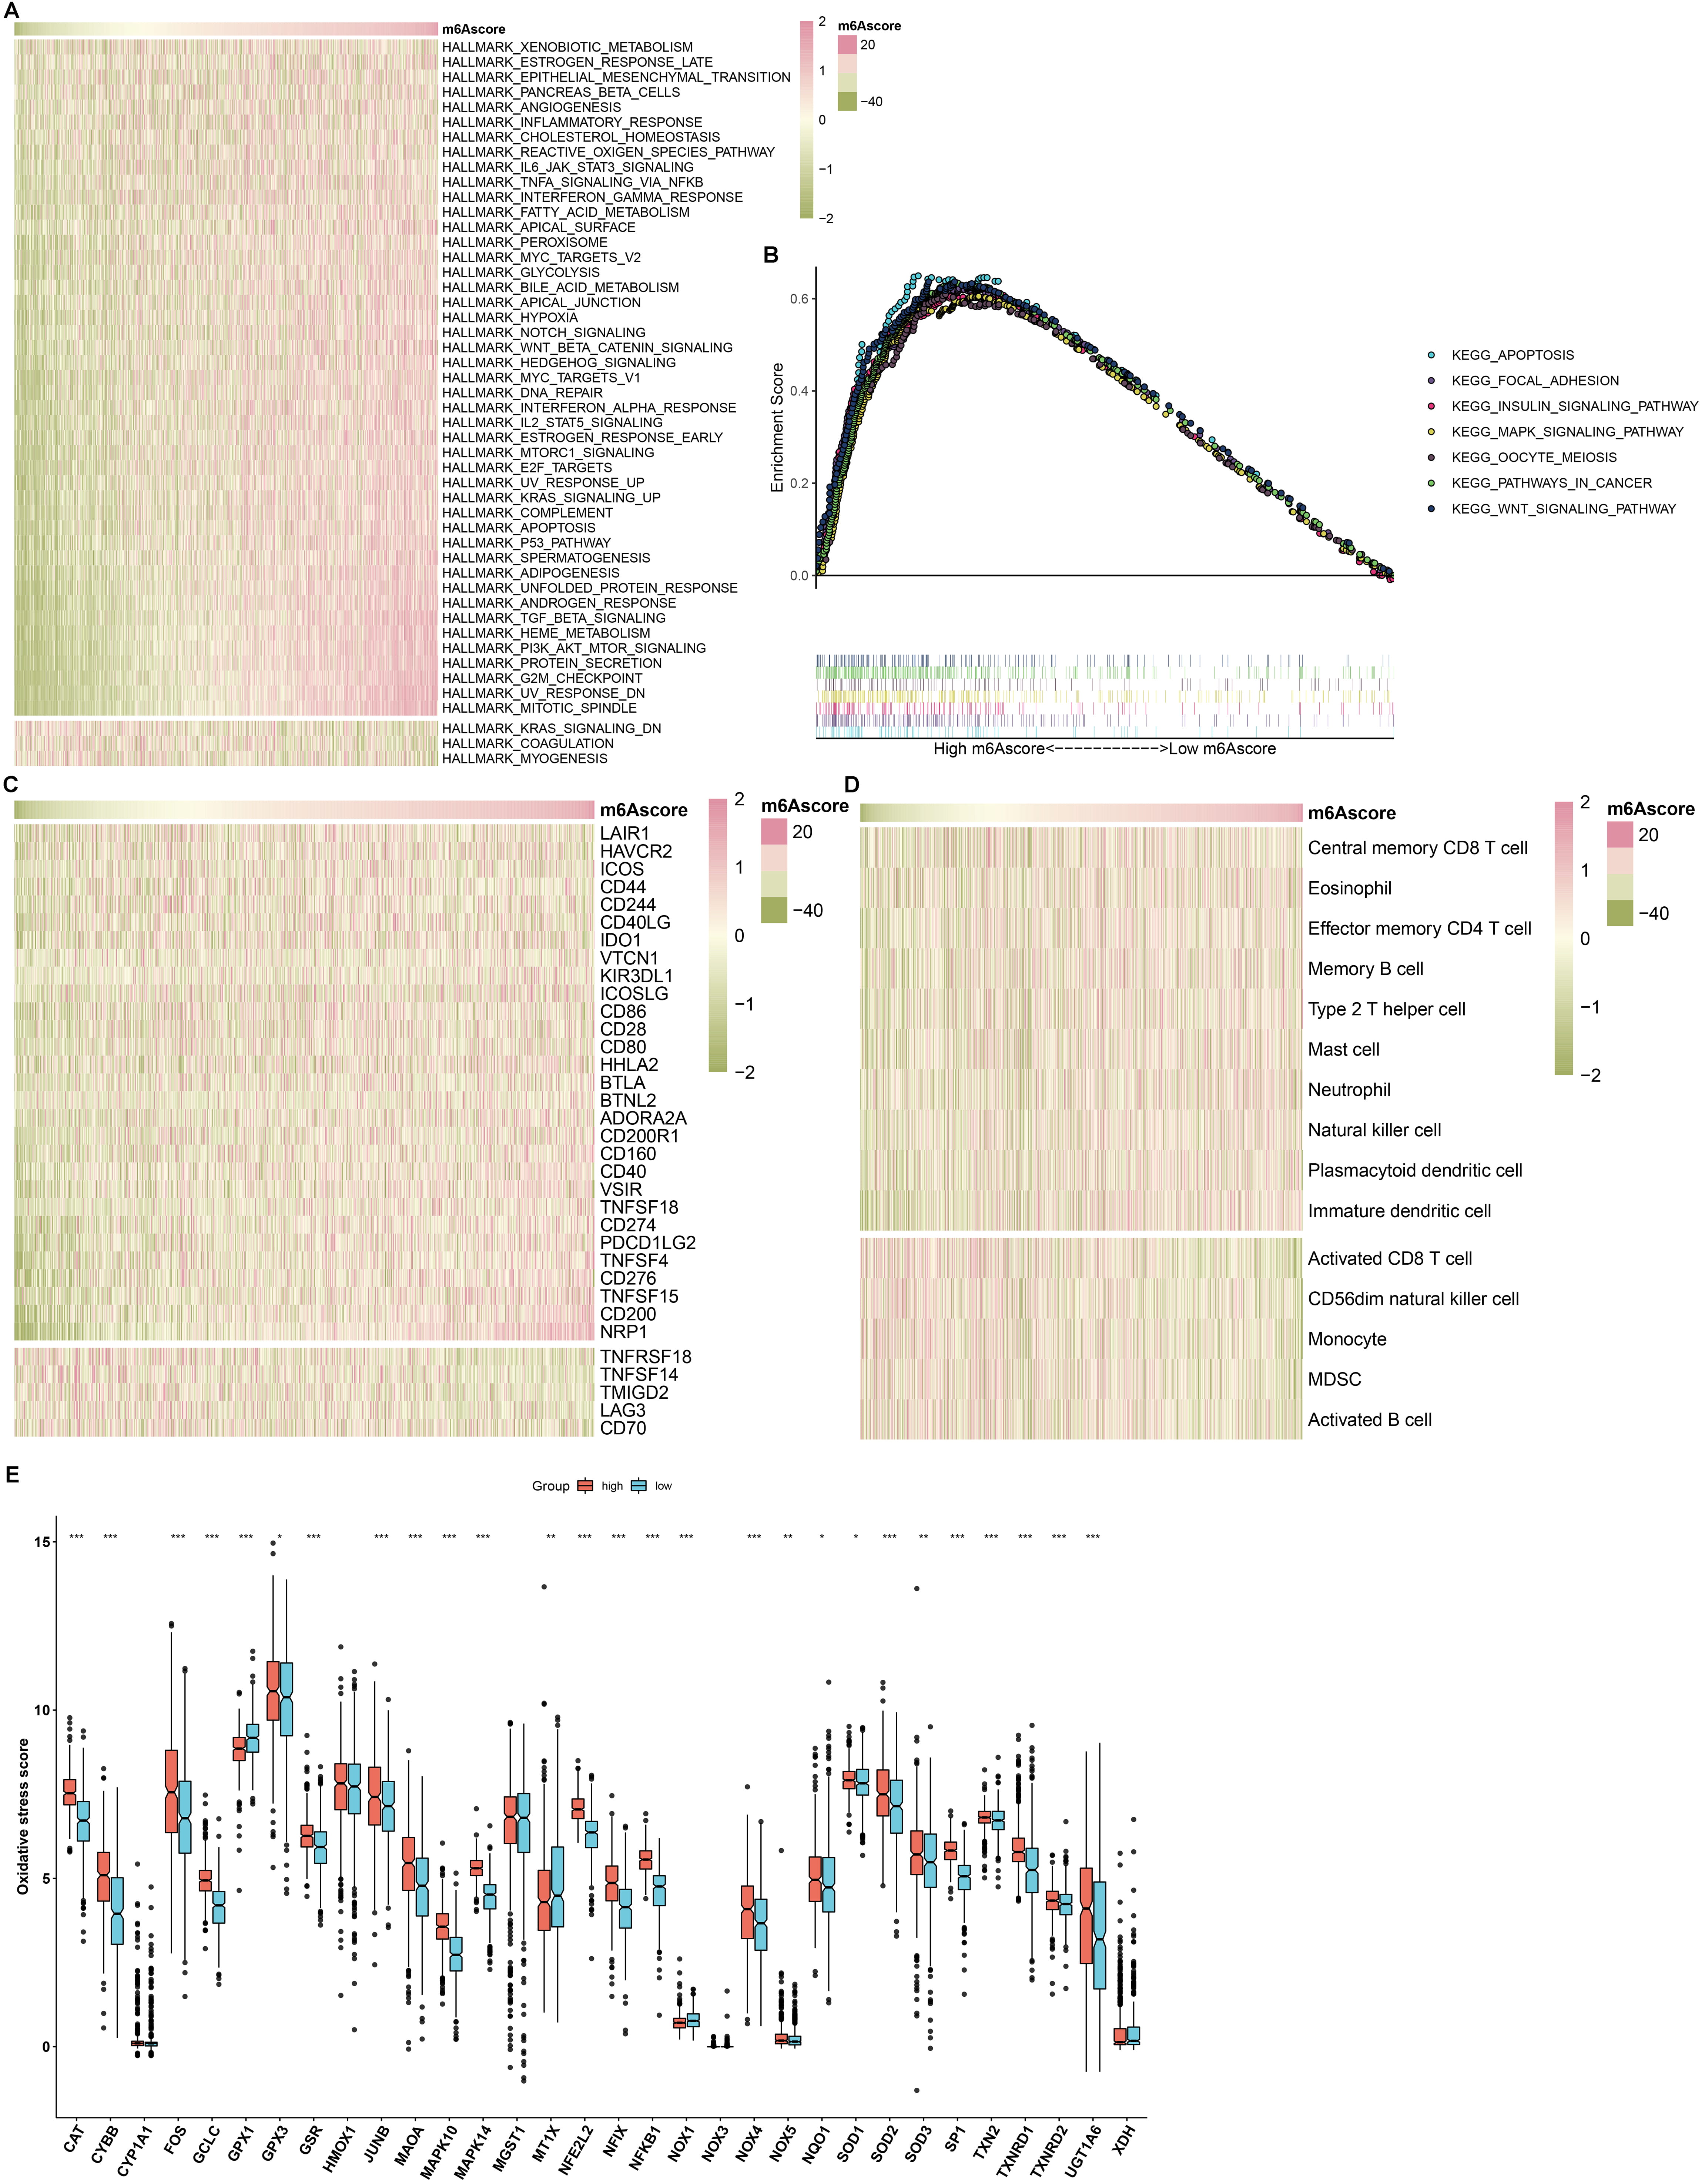 Fig. 8.
Correlation between mA score and signaling pathways, tumor
immunity and oxidative stress in RCC samples. (A) An overview of the correlation
between mA score and the enrichment score of the major 50 signaling
pathways in RCC samples. The mA scores from left to right gradually
increased. Red indicated high activation of a specific pathway and green
indicated low activation of a specific pathway. (B) Gene set enrichment analysis (GSEA) for the activated
signaling pathways in high-mA score samples. (C) An overview of the
correlation between mA score and the mRNA expression of immune checkpoints
in the RCC cohort. Red represented high expression and green represented low
expression for a specific immune checkpoint. (D) An overview of the correlation
between mA score and the infiltration levels of immune cells in RCC
specimens. Red indicated high infiltration level and green represented low
infiltration level for a specific immune cell. (E) The mRNA expression of
oxidative stress-related genes in high and low mA score groups. Comparisons
between two groups were analyzed with Wilcoxon test, *p 0.05;
**p 0.01; ***p 0.001.
3.10 Drug Sensitivity and Potential Druggable Targets in High- and
Low-mA Score RCC Patients
IC50 values of four approved targeted drugs including axitinib, pazopanib,
sorafenib and sunitinib were estimated in each RCC sample. The differences in
IC50 values were compared between high- and low-mA score RCC patients. In
comparison to low-mA score group, there were significantly reduced IC50
values of axitinib, pazopanib and sorafenib in high-mA score group (Fig. 9A–C). This indicated that RCC patients with high-mA score were more
sensitive to axitinib, pazopanib and sorafenib. Conversely, lower IC50 value of
sunitinib was found in low-mA score group compared to high-mA score
group (Fig. 9D), demonstrating that low-mA score patients were more likely
to benefit from sunitinib. Potential therapeutic agents were predicted for
low-mA score patients. Two drug dataset (CTRP and PRISM) were adopted to
identifying candidate CTRP and PRISM-derived agents with higher drug sensitivity
in low-mA score patients. Differential drug response analyses between high-
and low-mA score groups were carried out for predicting drugs with reduced
AUCs in low-mA score patients. As a result, six CTRP-derived compounds
(CR-1-31B, daporinad, leptomycin B, methotrexate, oligomycin A and ouabain; Fig. 9E) and ten PRISM-derived compounds (bosutinib, gemcitabine, GSK1070916,
halobetasol-propionate, mesna, OTX015, PD-0325901, Ro-4987655, romidepsin and
vincristine; Fig. 9F) had reduced AUCs in low-mA score group compared to
high-mA score group, indicating that they could become potential
therapeutic agents against low-mA score patients. Additionally, potential
druggable targets were predicted for low-mA score patients. As a result, we
found that mA score was positively associated with CERES scores of four
druggable targets (NMU, MOCOS, UCHL1, and RARRES1), with negative relationships
with their protein expression (Fig. 9G,H). Therefore, NMU, MOCOS, UCHL1, and
RARRES1 might become potential druggable targets for low-mA score patients.
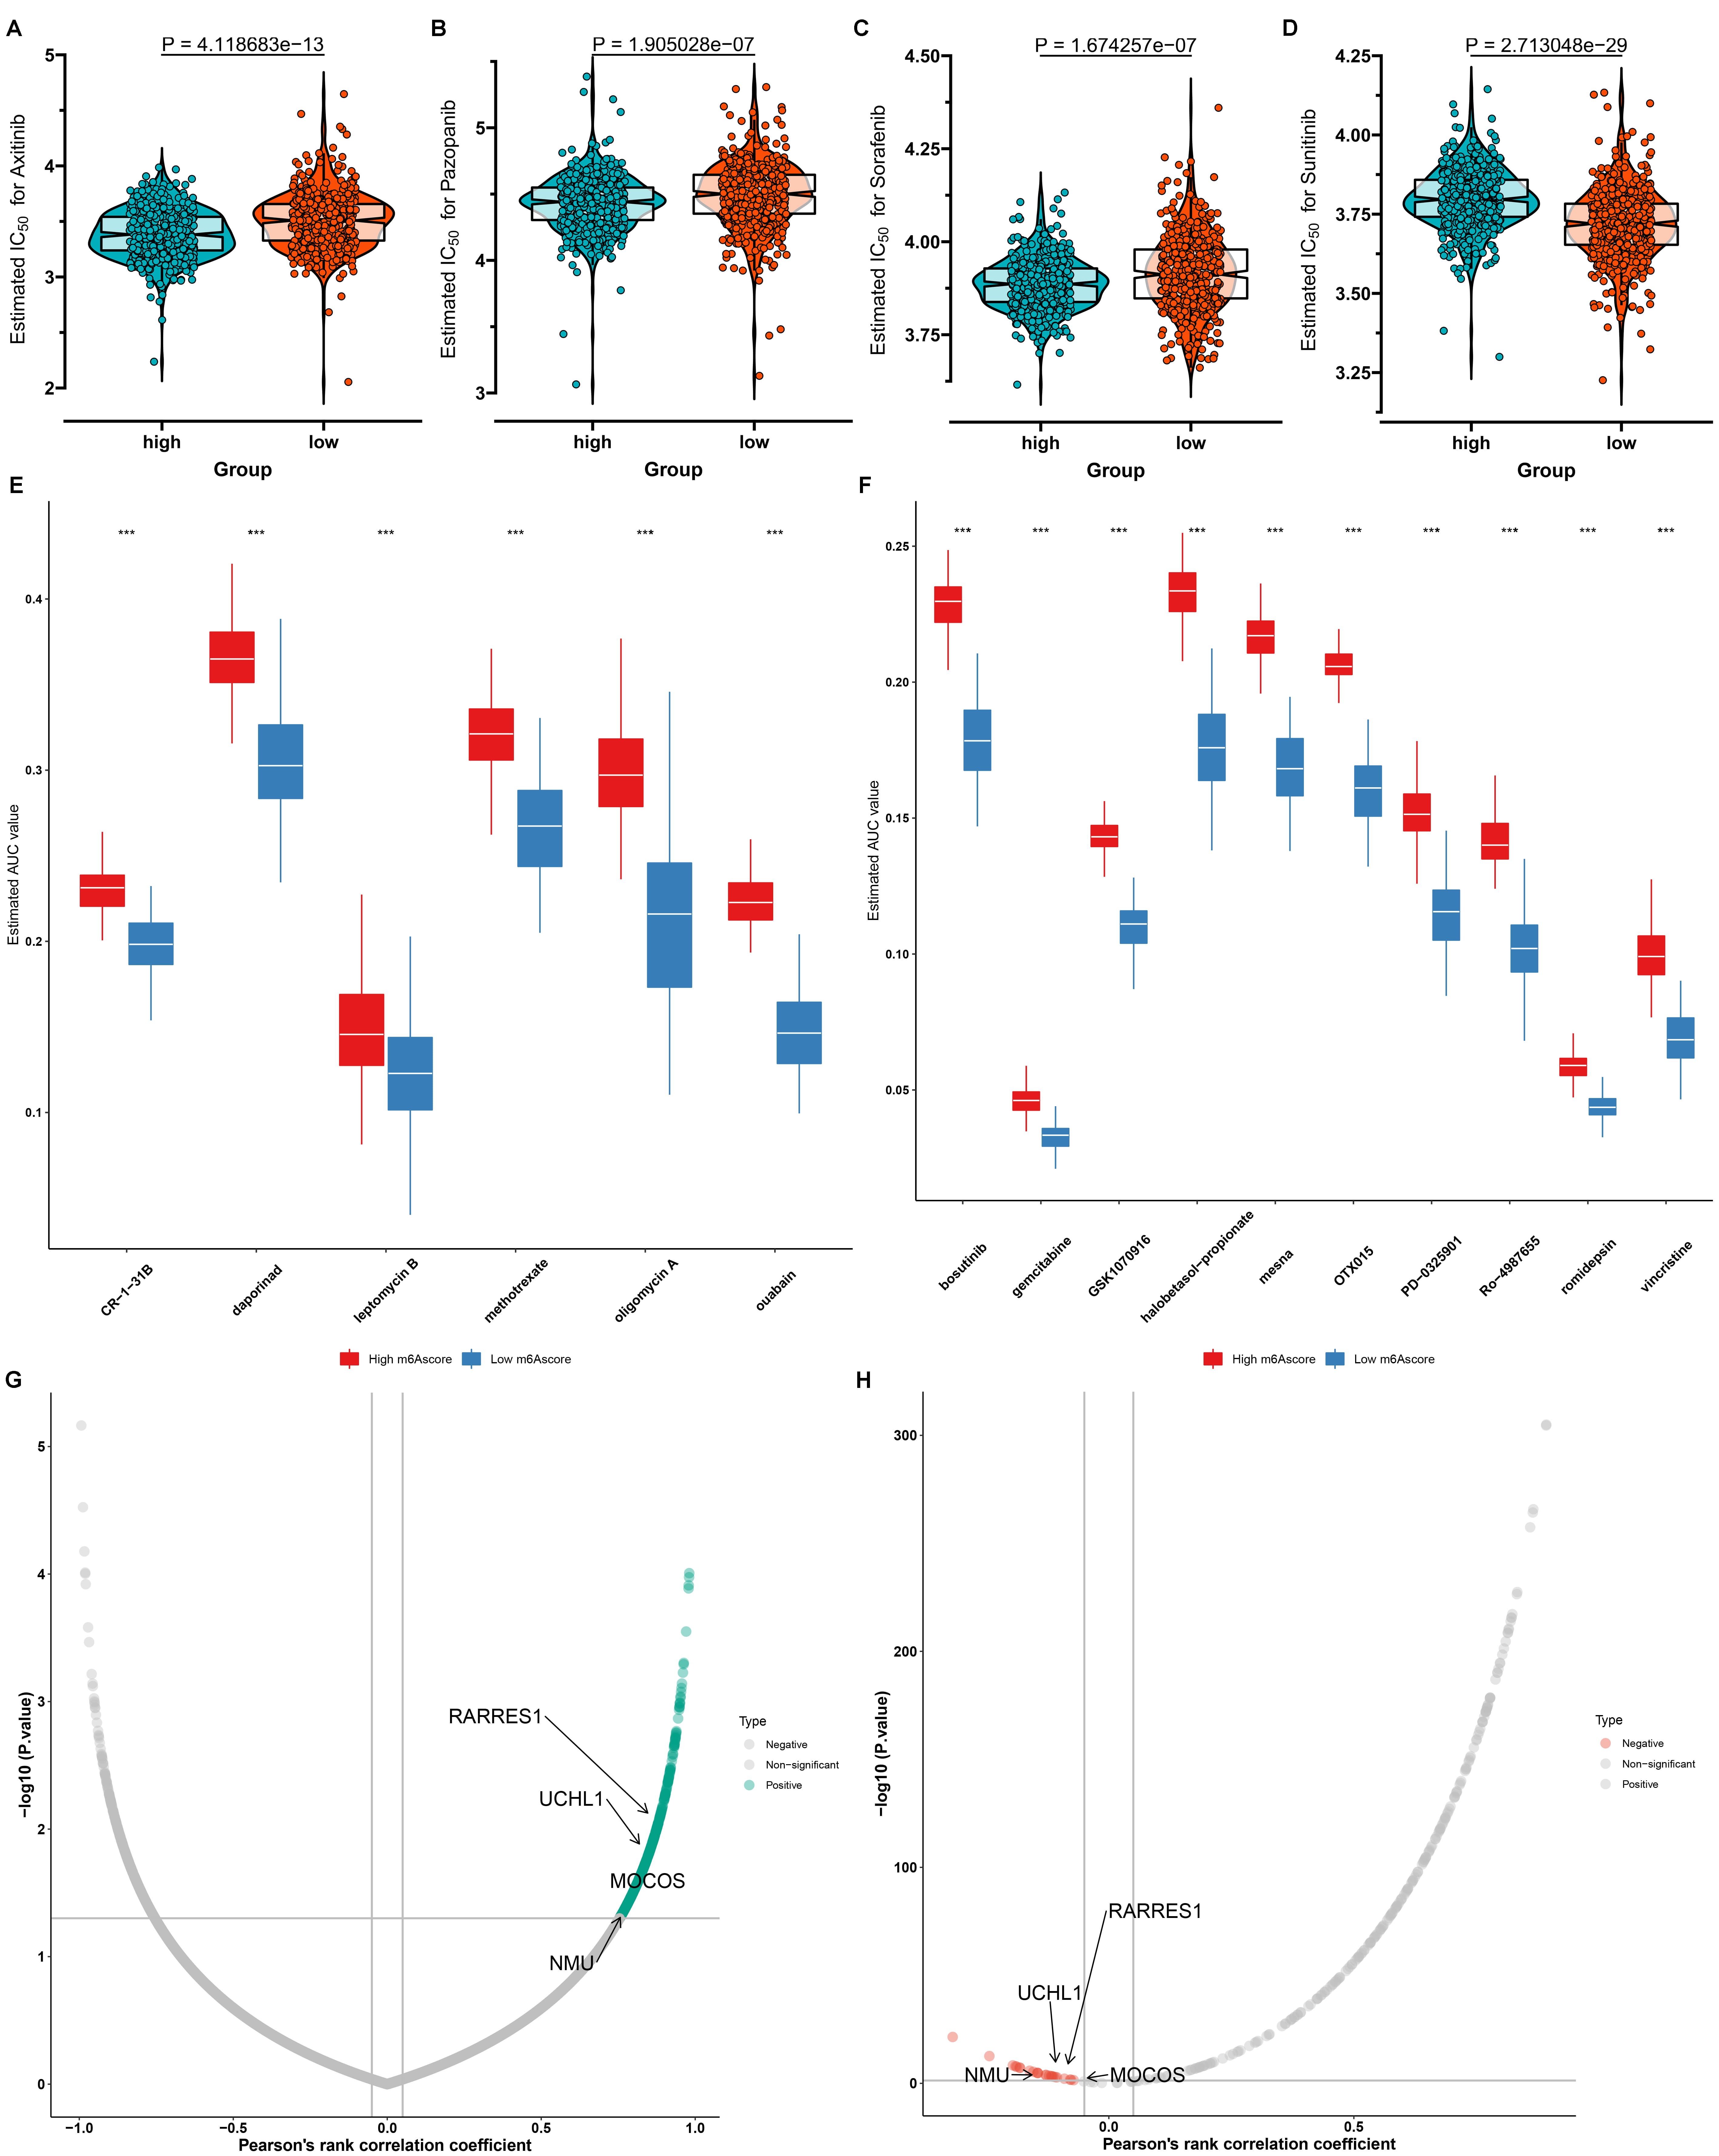 Fig. 9.
Comparison of the response to drugs in high- and low-mA
score RCC patients. (A–D) Violin plots of the estimated IC50 values of
chemotherapy drugs including axitinib, pazopanib, sorafenib and sunitinib in
high- and low-mA score RCC patients. (E) Differential drug response
analyses of six Cancer Therapeutics Response Portal (CTRP)-derived compounds in high- vs low-mA score RCC groups.
Comparisons between two groups were analyzed with Wilcoxon test, ***p 0.001. (F) Differential drug response analyses of ten PRISM-derived compounds
in high- vs low-mA score RCC groups. Comparisons between two groups were
analyzed with Wilcoxon test, ***p 0.001. (G,H) Associations between
mA score and CRISPR-Cas9 essentiality screens (CERES) score and protein expression of druggable targets.
4. Discussion
RCC contains distinct malignancies with different pathologic characteristics and
different molecular pathways [41]. Due to no obvious symptoms, 30% RCC patients
have metastasis at diagnosis. Typically, most patients experience undesirable
survival outcomes [41]. RCC initiation and development involve diverse and
complex mechanisms. Hence, based on the precise mechanisms underlying RCC,
development of novel therapeutic strategies is of importance in clinical
practice.
MA methylation modifications mediated by methyltransferases, demethylases
and binding proteins act as critical determinants in mRNA metabolism [42].
Emerging evidence suggests that mA methylation modifications occupy 80% of
RNA methylation modifications, which may mediate diverse malignancy-associated
processes like tumorigenesis, metastasis, and immune escape [43]. For example,
mA methyltransferase METTL14 mediates tumor immune and development of ccRCC
[44]. In this study, we found that most mA regulators displayed abnormal
expression in RCC compared with normal kidneys. Furthermore, there were
remarkable differences in the expression of most mA regulators between the
early and late stage of RCC, demonstrating the dynamic process of mA
modification. The close interactions between the mA regulators were found
according to PPI and pearson correlation analyses, indicating that their
interactions might participate in mediating RCC progression [45].
Here, based on the expression matrix of 23 mA regulators, we conducted
five distinct mA modification subtypes with different biological functions,
survival outcomes, oxidative stress, TME features, cancer stemness and tumor
immunity across RCC patients. Furthermore, a mA scoring system was
developed for quantifying the mA modification patterns for each RCC
patient, which might be applied for predicting prognosis, oxidative stress,
immunotherapy responses, sensitivity to chemotherapy drugs and designing novel
agents. This scoring system possessed the advantages of focusing the scores on
the set with the largest block of well associated (or anti-associated) genes in
the set; meanwhile, down-weighting contributions from genes which do not track
other set members. High mA score indicated favorable survival outcomes of
RCC patients. Selecting RCC subjects who will respond specifically to ICIs is
still a challenge. Distinctive biomarkers are urgently needed to predict clinical
outcomes and responses to ICIs. The prognostic value of mA score was
confirmed in two anti-PD-1/PD-L1 therapy cohorts. Most immune checkpoints
exhibited the up-regulation in RCC patients with high mA score, indicating
that the group of patients might benefit from ICIs.
Molecularly targeted treatment is prone to drug resistance [41]. Here, we found
that high mA score indicated higher sensitivity to axitinib, pazopanib and
sorafenib, while low mA score were more sensitive to sunitinib. This
indicated that mA score might be applied for estimating the drug
sensitivity for RCC patients. Due to poor survival outcomes of patients with low
mA score, we predicted six CTRP-derived compounds (CR-1-31B, daporinad,
leptomycin B, methotrexate, oligomycin A and ouabain) and ten PRISM-derived
compounds (bosutinib, gemcitabine, GSK1070916, halobetasol-propionate, mesna,
OTX015, PD-0325901, Ro-4987655, romidepsin and vincristine) that could become
potential therapeutic agents against low-mA score patients. Nevertheless,
more experiments will be required for verifying the therapeutic efficacy of above
agents in RCC. In addition, the immunotherapy cohorts of RCC patients are lack.
Therefore, we only validated the significance of mA score in predicting the
response of anti-PD-1/PD-L1 immunotherapy in the GSE78220 dataset and the dataset
reported by Liu et al. [37]. Yet, the immunotherapy results were not in
line with our prior results, likely due to the tumor heterogeneity and limited
sample size of these datasets. Thus, in our future studies, the mA
modification subtypes and score will be validated in a prospective and large
number cohort.
Abbreviations
RCC, renal cell carcinoma; ccRCC, clear cell RCC; pRCC, papillary RCC; chRCC,
chromophobe RCC; TME, tumor microenvironment; mA, N-methyladenosine;
TCGA, the Cancer Genome Atlas; CNAs, copy number alterations; PPI,
protein-protein interaction; t-SNE, t-distributed stochastic neighbor embedding;
GSVA, Gene-set variation analysis; mRNAsi, gene expression-based stemness index;
mDNAsi, DNA methylation-based stemness index; ssGSEA, single-sample gene set
enrichment analysis; ESTIMATE, Estimation of STromal and Immune cells in
MAlignant Tumours using Expression data; TIICs, tumor-infiltrating immune cells;
DEGs, differentially expressed genes; GO, gene ontology; KEGG, Kyoto Encyclopedia
of Genes and Genomes; BPs, biological processes; CCs, cellular components; MFs,
molecular functions; PCA, principal component analysis; GEO, Gene Expression
Omnibus; GSEA, Gene set enrichment analysis; IC50, half-maximal inhibitory
concentration; CCLs, cancer cell lines; AUC, area under the curve; CCLE, Cancer
Cell Line Encyclopedia; OS, overall survival; DFS, disease free survival; PFS,
progression free survival; DSS, disease-specific survival; PFI, progression free
interval; PD-1, programmed cell death 1; PD-L1, programmed cell death ligand 1;
FTO, fat mass and obesity associated; PGC-1, peroxisome
proliferator-activated receptor-gamma co-activator-1; ALKBH5, AlkB
homolog 5; AURKB, aurora kinase B; CBLL1, Cbl proto-oncogene like 1; VIRMA, Vir
like mA methyltransferase associated; METTL14/3, methyltransferase 14/3;
RBM15, RNA binding motif protein 15; RBM15B, RNA binding motif protein 15B; WTAP,
WT1 associated protein; ZC3H13, zinc finger CCCH-type containing 13; ELAVL1, ELAV
like RNA binding protein 1; FMR1, FMRP translational regulator 1; HNRNPA2B1,
heterogeneous nuclear ribonucleoprotein A2/B1; HNRNPC, heterogeneous nuclear
ribonucleoprotein C; IGF2BP1/2/3, insulin like growth factor 2 mRNA binding
protein 1/2/3; LRPPRC, leucine rich pentatricopeptide repeat containing;
YTHDC1/2, YTH domain containing 1/2; YTHDF1/2/3, YTH mA RNA binding protein
1/2/3.


 , Weimin Zhong 2,*