
- Academic Editor
†These authors contributed equally.
Background: Ferroptosis, an iron-dependent form of cell death, plays a crucial
role in the progression of various cancers, including colon adenocarcinoma
(COAD). However, the multi-omics signatures relevant to ferroptosis regulation in
COAD diagnosis remain to be elucidated. Methods: The transcriptomic, miRNAomic,
and methylomic profiles of COAD patients were acquired from the Cancer Genome
Atlas (TCGA). Ferroptosis activity in these patients was determined, represented
by a ferroptosis score (FS), using single-sample gene set enrichment analysis
(ssGSEA) based on the expression of ferroptosis-related genes. Results: Results
showed that the COAD patients with high-FS displayed favorable survival outcomes
and heightened drug sensitivity. They also exhibited an up-regulation of genes
involved in immune-related pathways (e.g., tumor necrosis factor signaling
pathway), suggesting a correlation between immunity and ferroptosis in COAD
progression. Furthermore, three survival prediction models were established based
on 10 CpGs, 12 long non-coding RNAs (lncRNAs), and 14 microRNAs (miRNAs),
respectively. These models demonstrated high accuracy in predicting COAD
survival, achieving areas under the curve (AUC)
Colon adenocarcinoma (COAD), a prevalent malignant cancer globally [1, 2], continues to exhibit an upward trend in both incidence and mortality rates [3, 4]. A major obstacle in COAD diagnosis and therapy is its pronounced heterogeneity at different molecular levels [5, 6]. Early detection and intervention are crucial, as they substantially enhance patient survival prospects [1, 7]. Consequently, the need for research focused on the identification of diagnostic and classification biomarkers for COAD remains critical.
Ferroptosis, characterized as an oxidative and iron-dependent form of regulated cell death, plays a significant role in the development of various cancers, such as breast cancer, hepatocellular carcinoma, and COAD [8, 9, 10, 11, 12]. Emerging evidence suggests a strong association between ferroptosis and various molecular factors, including messenger RNA (mRNA), long non-coding RNA (lncRNA), microRNA (miRNA), along with epigenetic modifications like DNA methylation (DNAm), in tumor progression [13, 14, 15]. Alterations in the expression of ferroptosis-related mRNA genes have been instrumental in cancer prognosis prediction, including COAD [9, 12, 16]. However, a comprehensive exploration of ferroptosis-associated signatures, particularly in relation to COAD classification and diagnosis, at other molecular levels has not yet been fully explored.
In this study, transcriptomic, miRNomic, methylomic, and clinical data of COAD patients were obtained from the Cancer Genome Atlas (TCGA). The ferroptosis score (FS) of each COAD patient was calculated based on the expression of 20 ferroptosis-associated genes using single-sample gene set enrichment analysis (ssGSEA). The COAD patients were then classified into either high-FS or low-FS subtypes, with the high-FS group demonstrating better survival probability and heightened sensitivity to multiple anti-cancer drugs. Additionally, 1065 differentially expressed mRNAs (DE-mRNAs), 324 differentially expressed lncRNAs (DE-lncRNAs), 91 differentially methylated CpG sites (DMCs), and 39 differentially expressed miRNAs (DE-miRNAs) were identified between the high-FS and low-FS COAD groups. Notably, the up-regulated protein-coding mRNAs in the high-FS COAD patients were enriched in immune-related pathways. Three ferroptosis-related signatures comprising 10 DMCs, 12 DE-lncRNAs, and 14 DE-miRNAs were constructed using the least absolute shrinkage and selection operator (LASSO) Cox regression model, yielding a high degree of accuracy in the prediction of COAD prognostic outcomes. Further mixOmics analysis revealed that the ferroptosis-related multi-omics features displayed excellent performance in COAD classification.
RNA-seq (HTSeq-Counts/log2(FPKM+1)), Illumina Human Methylation 450K BeadChip
(HM450,
In total, 288 ferroptosis-related genes, including drivers, suppressors, and markers were obtained from the FerrDb database [18]. Among them, genes with relationships between expression and COAD survival were identified using univariate Cox survival analysis. The ssGSEA function in the R package “GSVA” (v1.50.0) (https://bioconductor.org/) was used to calculate the enrichment scores of gene sets positively or negatively associated with COAD survival [19]. The FS, representing the ferroptosis level in each COAD sample, was defined as the difference in enrichment scores between positive and negative components.
Cancer cell line drug sensitivity data (IC50) were downloaded from the Genomics
of Drug Sensitivity in Cancer database (GDSC, https://www.cancerrxgene.org/)
[20, 21]. The drug sensitivity score of each COAD patient was estimated using the
R package “oncoPredict” (v0.2) (https://cran.r-project.org/)
based on gene expression data [22]. Drugs with a mean predicted sensitivity value
Survival differences between the two groups were calculated using the Kaplan-Meier method and log-rank test in the R package “survival” (v3.5-7) (https://cran.r-project.org/). Samples were classified into two subgroups based on the median FS or risk score values.
DE-mRNAs and DE-lncRNAs were identified using the R package
“DESeq2” (v1.42.0) (https://bioconductor.org/) based on the
thresholds:
Gene Ontology (GO) and Kyoto Encyclopedia of Genes and Genomes (KEGG) pathway
enrichment analyses were performed for the DE-mRNAs using DAVID
(https://david.ncifcrf.gov/tools.jsp) [23]. A Benjamini-Hochberg (BH)-adjusted
p-value
LASSO Cox regression model analysis was used for variable selection with the “glmnet” R package. Multivariate analysis based on the Cox proportional hazards regression model was used to calculate the coefficients of the selected variables and construct the prognostic signatures. Receiver operating characteristic (ROC) curves and area under the ROC curves (AUC) were used to evaluate the effectiveness of the prognostic model with the “survivalROC” R package (v1.0.3.1) (https://cran.r-project.org/).
The “mixOmics” R package was employed to select key variables within the three -omics data signatures that effectively differentiate between the high-FS and low-FS COAD subgroups according to the provided instructions (http://mixomics.org/) [24]. In brief, the continuous quantitative values of variables, such as the expression levels of lncRNAs and miRNAs and methylation levels of CpGs, within the three signatures served as input data for the “mixOmics” package (v6.26.0) (https://bioconductor.org/). Supervised analysis and feature selection with sparse Partial Least Square-Discriminant Analysis (sPLS-DA) were performed to identify specific variables of different molecular types critical for discriminating the high-FS and low-FS groups. All statistical analyses were performed using the R program (v4.3.1) (https://cran.r-project.org/).
Table 1 displays the clinical information of the 446 COAD patients and 39 normal
samples. Survival analysis showed that age and pathological stage of the COAD
patients were both associated with COAD survival (p
| Characteristic | Number (%) | HR (95% CI) | p-value | |
| Age | 1 (1–1) | 0.041 | ||
| 125 | ||||
| 309 | ||||
| Sex | 1.6 (0.95–2.5) | 0.074 | ||
| Female | 207 | |||
| Male | 239 | |||
| Stage | 2.1 (1.6–2.8) | 3 × 10 | ||
| Stage I | 76 | |||
| Stage II | 171 | |||
| Stage III | 126 | |||
| Stage IV | 62 | |||
HR, hazard ratio; CI, confidence interval.
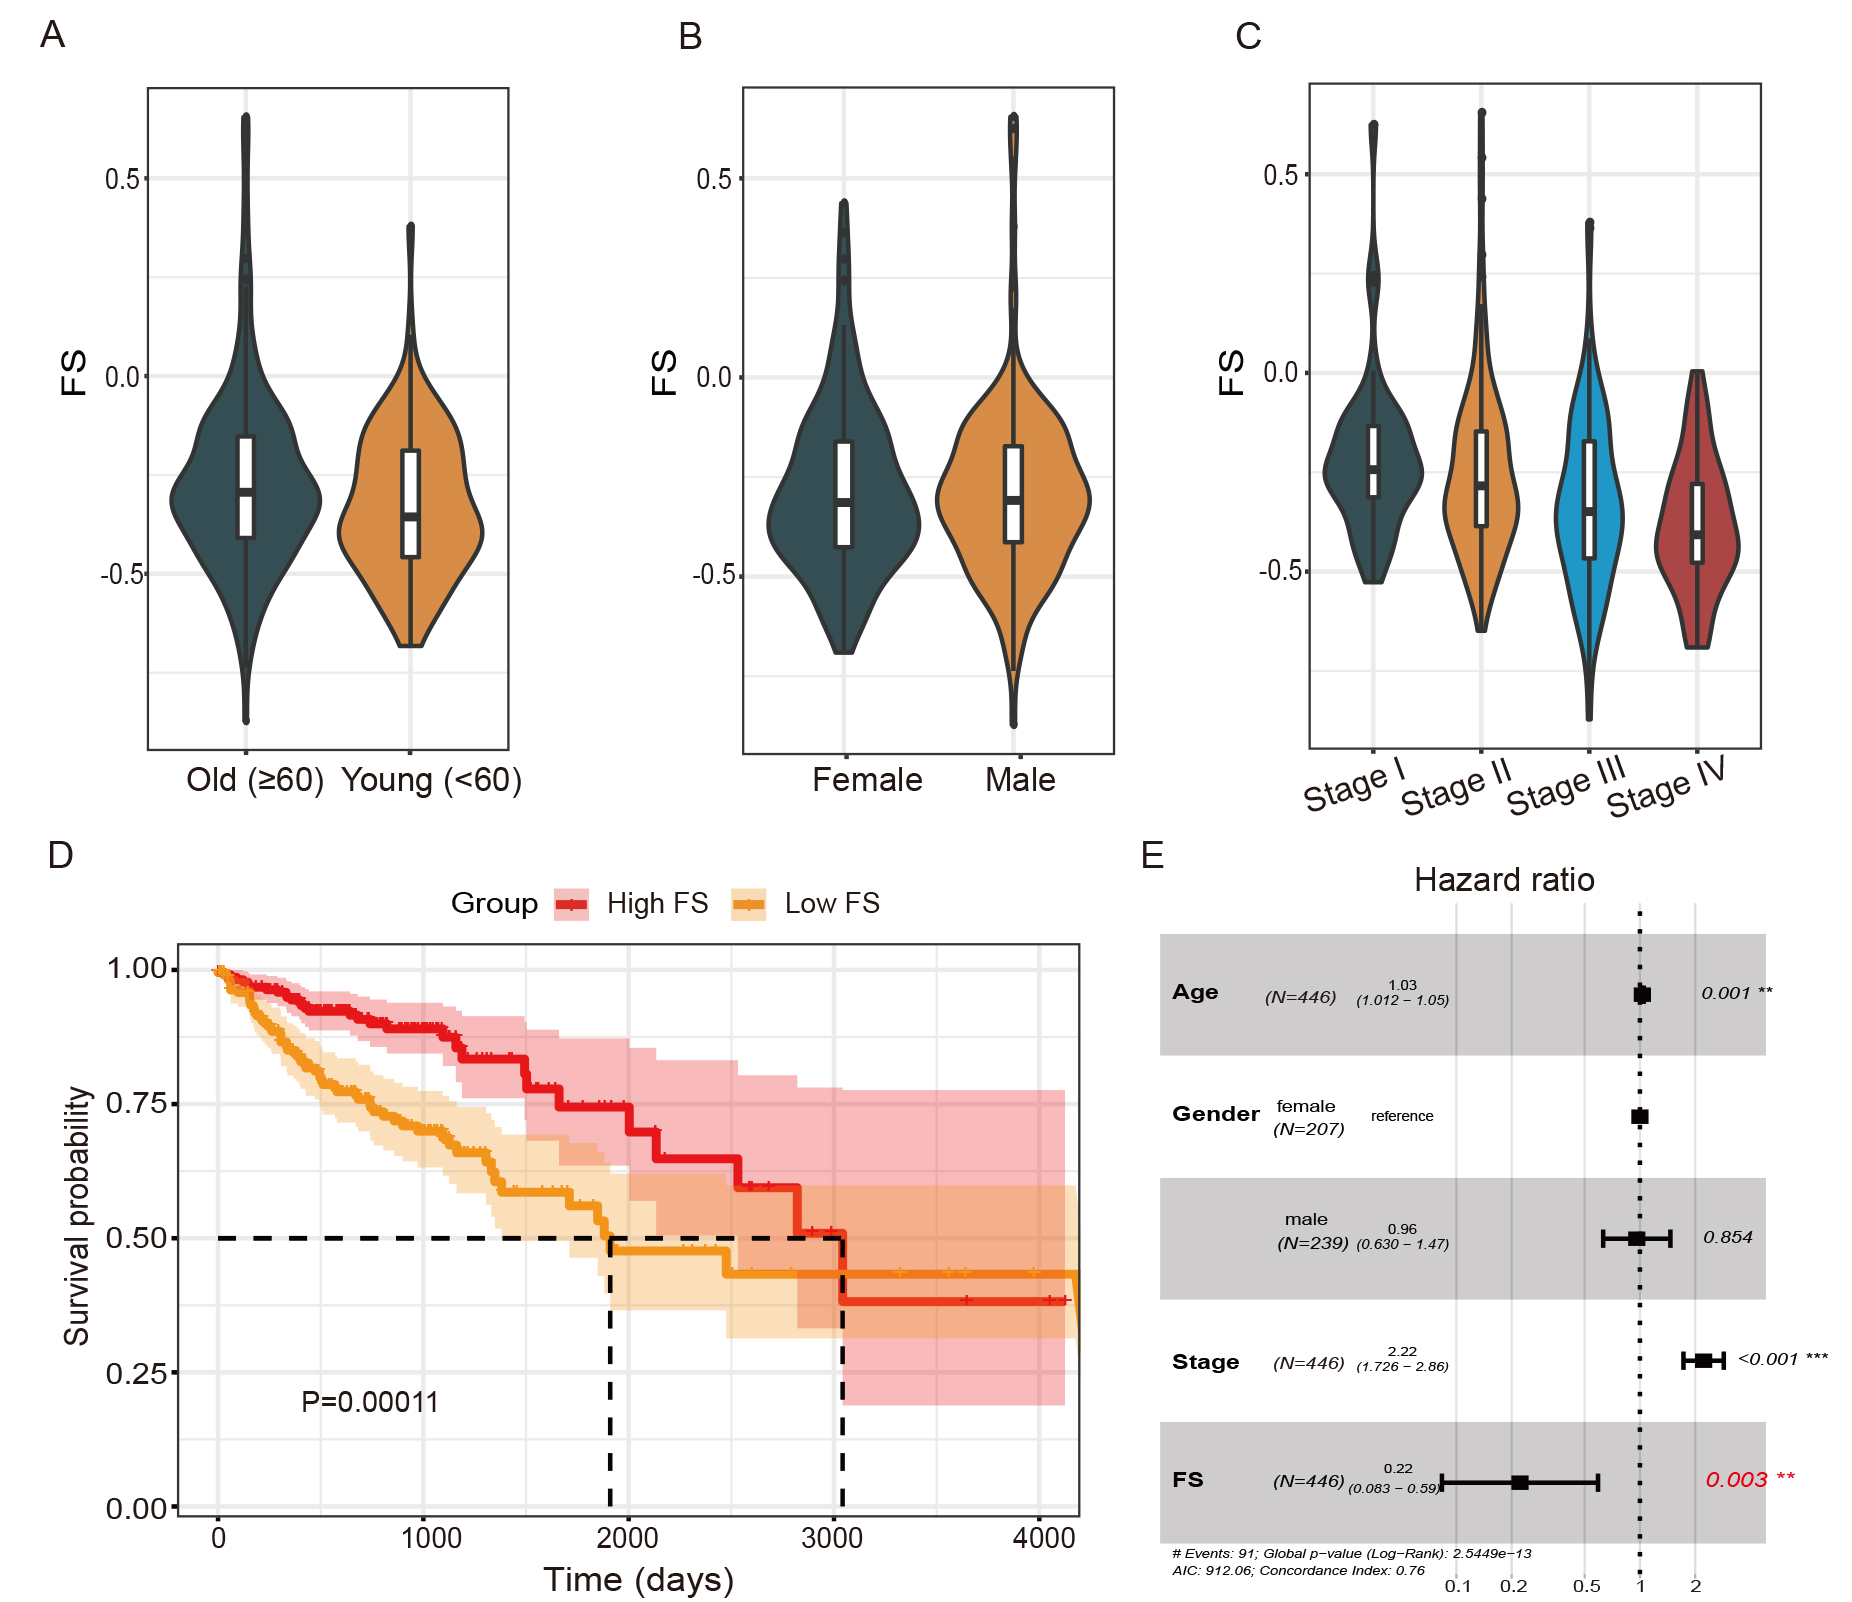 Fig. 1.
Association between ferroptosis scores (FSs) and colon
adenocarcinoma (COAD) overall survival. (A–C) FS differences in patients of
different age, sex, and pathological stage. (D) Kaplan-Meier survival curve of
high- and low-FS patients. (E) Forest plot of association between FSs and COAD
survival in multivariate Cox proportional hazards model. **, p
To explore the potential association between FSs and COAD treatment precision, the drug sensitivity score of each patient was calculated using the R package “oncoPredict” based on drug sensitivity data from the GDSC database. In total, 11 agents showed sensitivity differences between the high-FS and low-FS COAD subgroups, with high drug sensitivity in the high-FS patients (Fig. 2A). Among these drugs, several have been used in COAD therapy, such as camptothecin, vinblastine, and staurosporine [25, 26, 27]. Based on further correlation analysis, 10 of the anti-cancer drugs exhibited significant associations between sensitivity and FSs (Fig. 2B).
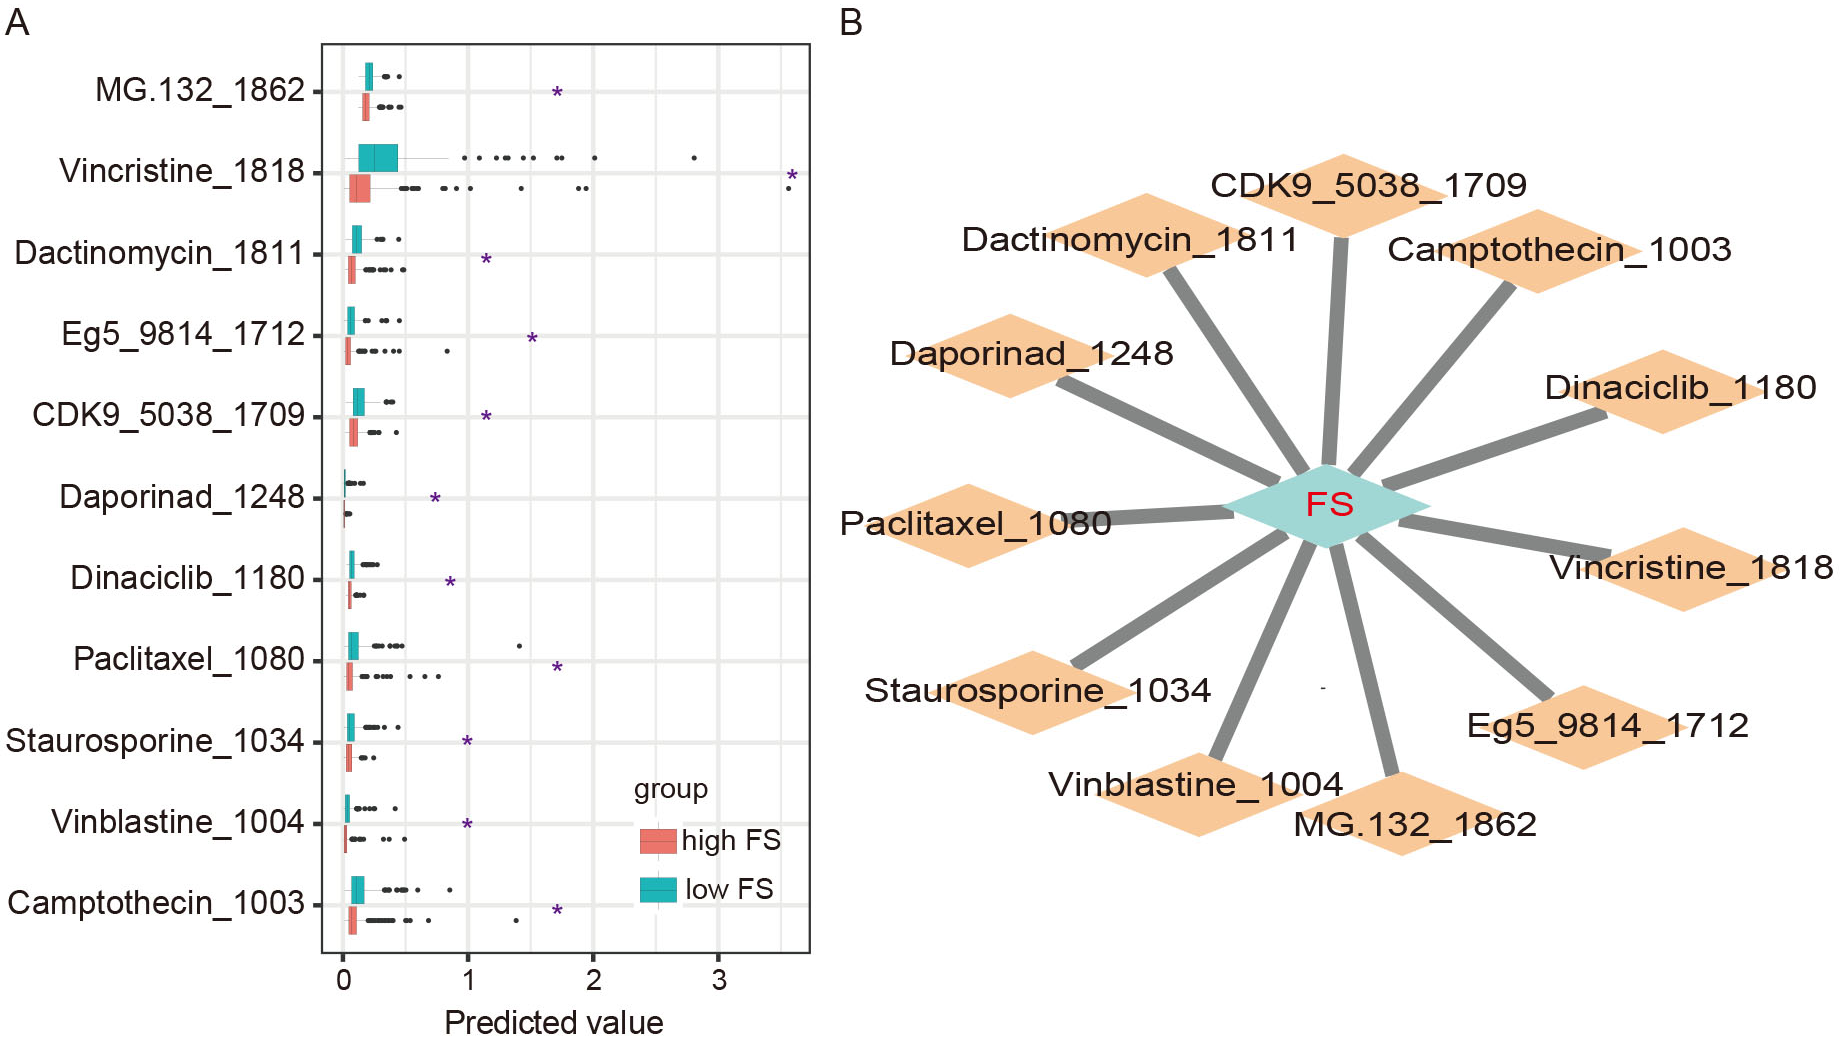 Fig. 2.
Drug sensitivity between high- and low-FS COAD subgroups. (A)
Differences in predicted drug sensitivity between high- and low-FS subgroups (*,
p
Next, changes in protein-coding mRNA expression were analyzed between the two COAD subgroups. In total, 1065 DE-mRNAs exhibited differences between the COAD patients and normal samples, as well as between the high-FS and low-FS COAD subgroups (see Materials and Methods). Functional enrichment analysis of the DE-mRNAs was conducted to explore differences in biological functions and signaling pathways between the two subgroups. Notably, GO analysis identified 376 up-regulated DE-mRNAs enriched in the inflammatory response, chemokine-mediated signaling pathway, and immune response (Fig. 3A), and 689 down-regulated DE-mRNAs enriched in the Wnt signaling pathway, lipid metabolism, and cell adhesion (Fig. 3B). Furthermore, KEGG pathway analysis revealed that the up-regulated DE-mRNAs were mainly enriched in immune-related pathways, such as the TNF signaling pathway, chemokine signaling pathway, and cytokine-cytokine receptor interaction (Fig. 3C), while down-regulated DE-mRNAs were enriched in the cell adhesion molecule, chemical carcinogenesis, and cAMP signaling pathways (Fig. 3D). Therefore, these findings highlight the close association between ferroptosis and immune processes in tumor progression.
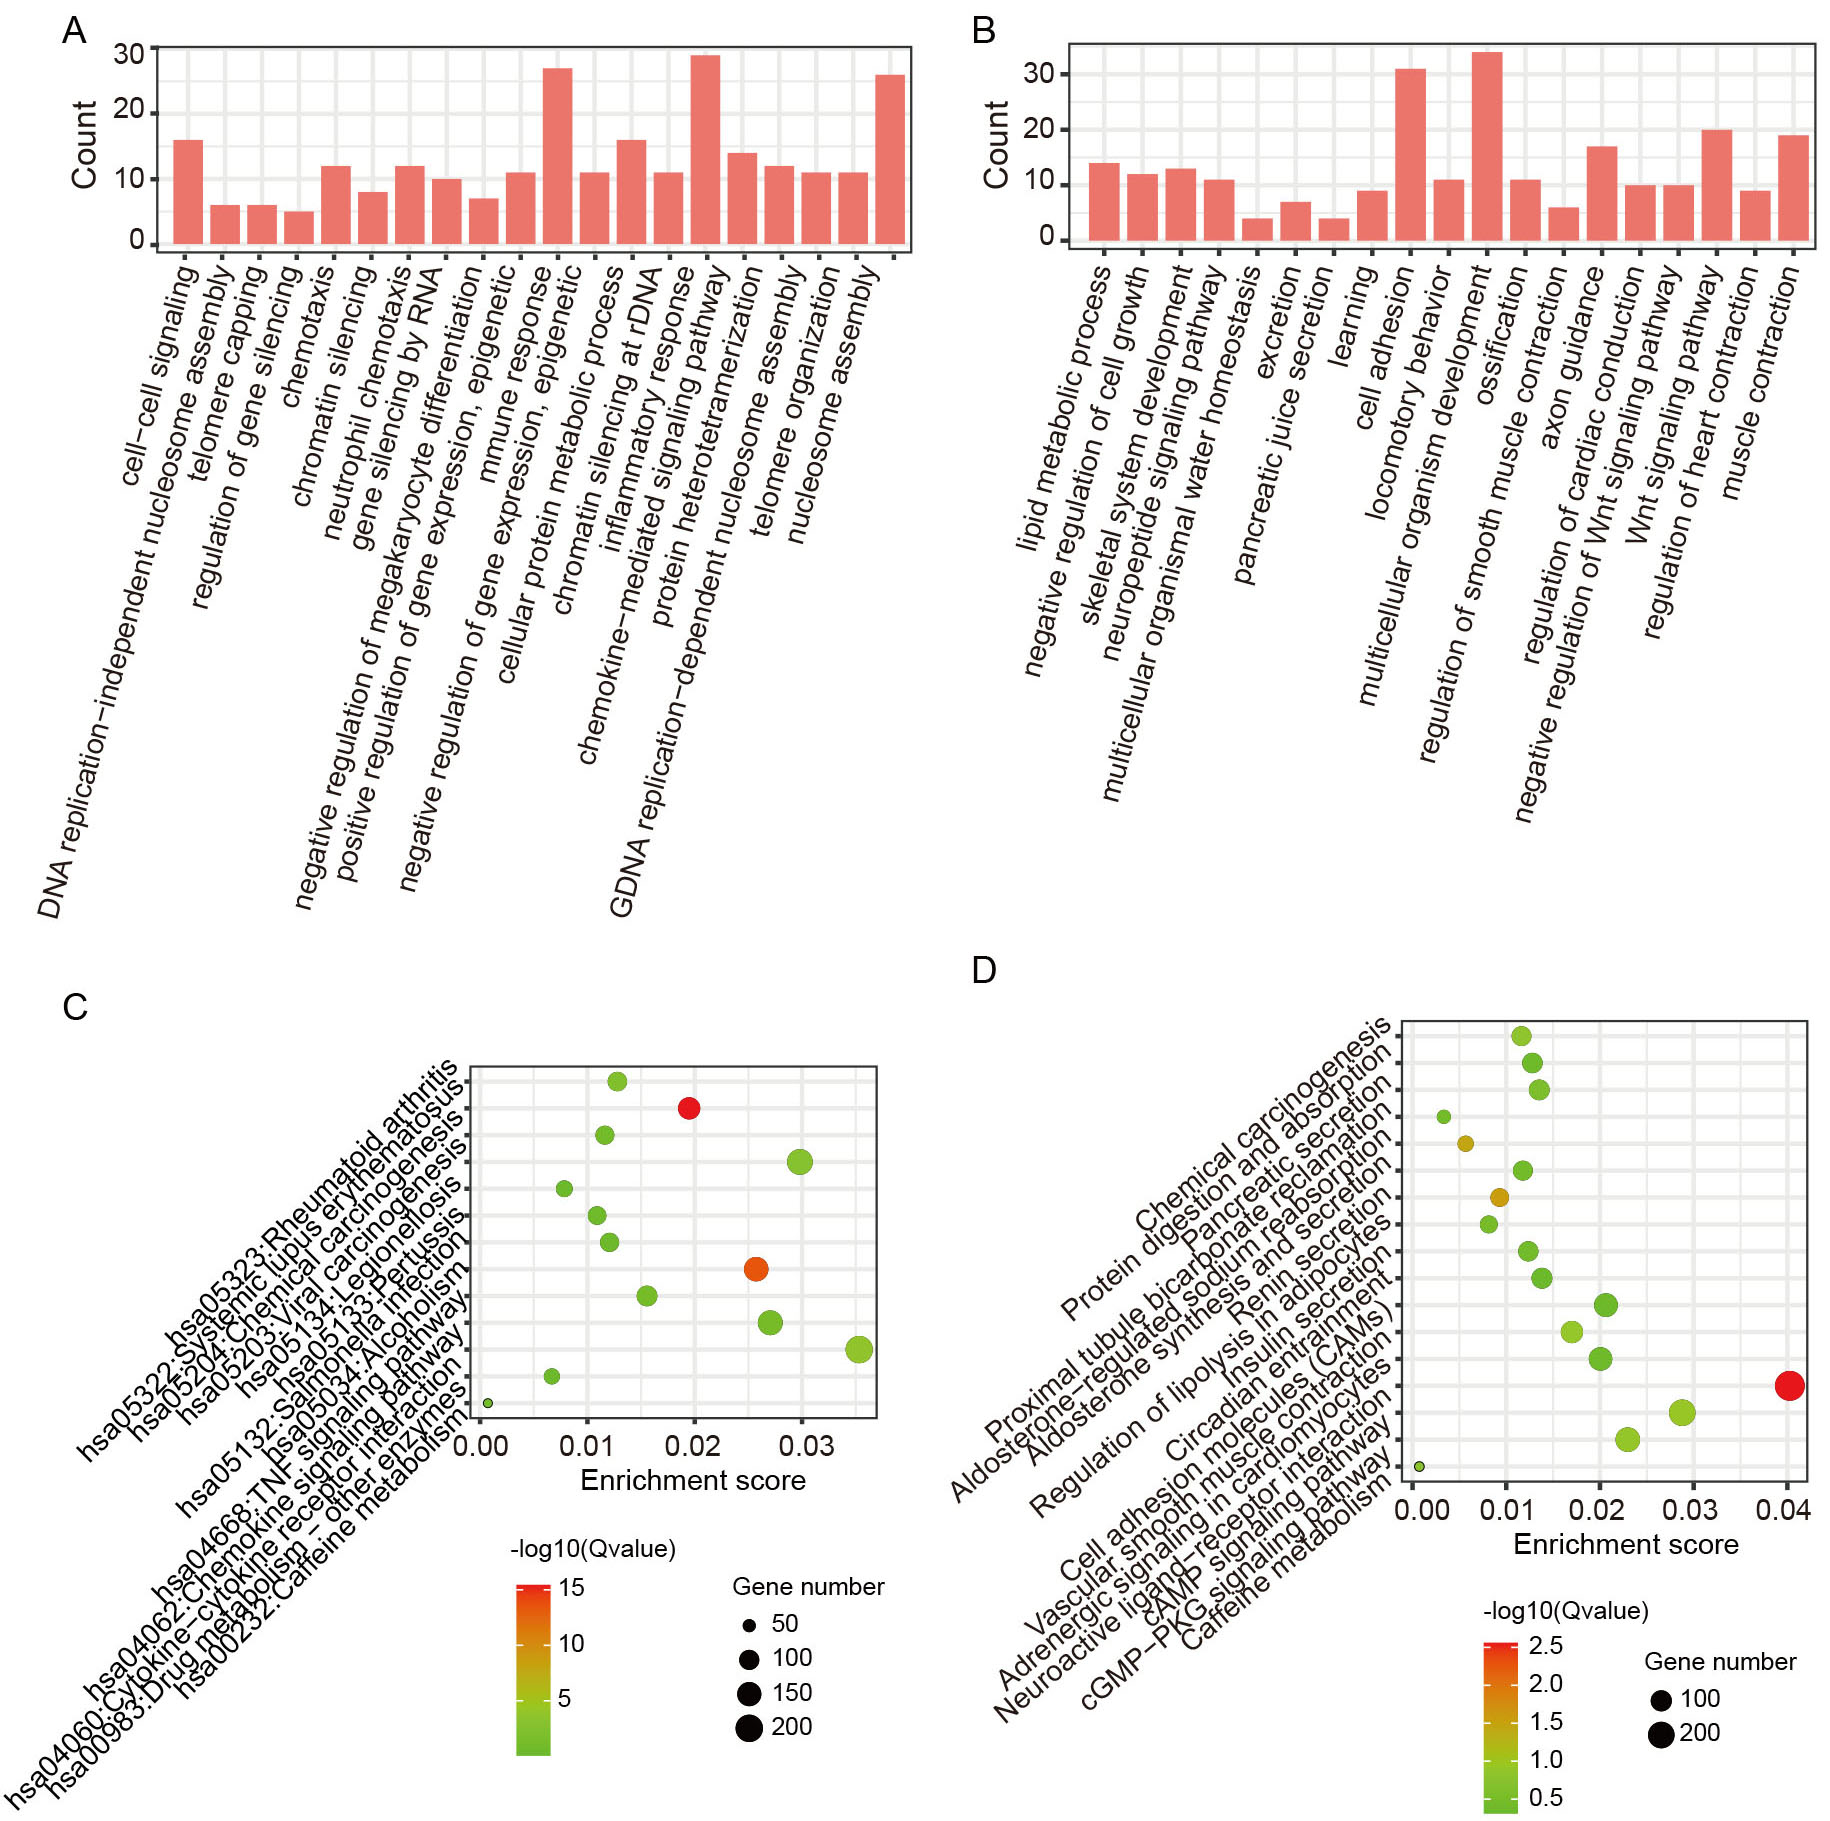 Fig. 3.
Functional enrichment analyses of differentially expressed mRNAs (DE-mRNAs) between high- and low-FS COAD subgroups. (A,B) GO enrichment analysis of up-regulated and down-regulated DE-mRNAs in COAD patients with high-FS. (C,D) Kyoto Encyclopedia of Genes and Genomes (KEGG) enrichment analysis of up-regulated and down-regulated DE-mRNAs in COAD patients with high-FS.
Ferroptosis-related mRNA signatures associated with COAD prognosis were
determined utilizing expression data of identified DE-mRNAs from the TCGA
database. LASSO Cox regression analysis was performed on the 1065 DE-mRNAs, with
12 DE-mRNAs selected to build a risk model (risk-score
The risk score for each COAD patient was then calculated, with median values used to categorize patients into high- and low-risk groups. Kaplan-Meier analysis revealed a significantly poorer prognosis in the high-risk group compared to the low-risk group (Fig. 4A). The ROC curves indicated AUC values for the risk score model at 1, 3, and 5 years of 0.833, 0.799, and 0.835, respectively (Fig. 4B). Additionally, an independent gene expression microarray dataset of COAD from the GEO database was analyzed to validate the prognostic value of the 12-DE-mRNA signature. This analysis confirmed that COAD patients with a low risk score demonstrated better survival, with AUCs of 0.582 at 3 years and 0.592 at 4 years (Fig. 4C,D). In addition, we also observed that the patients with high FS presented good survival in this independent COAD cohort (Supplementary Fig. 2).
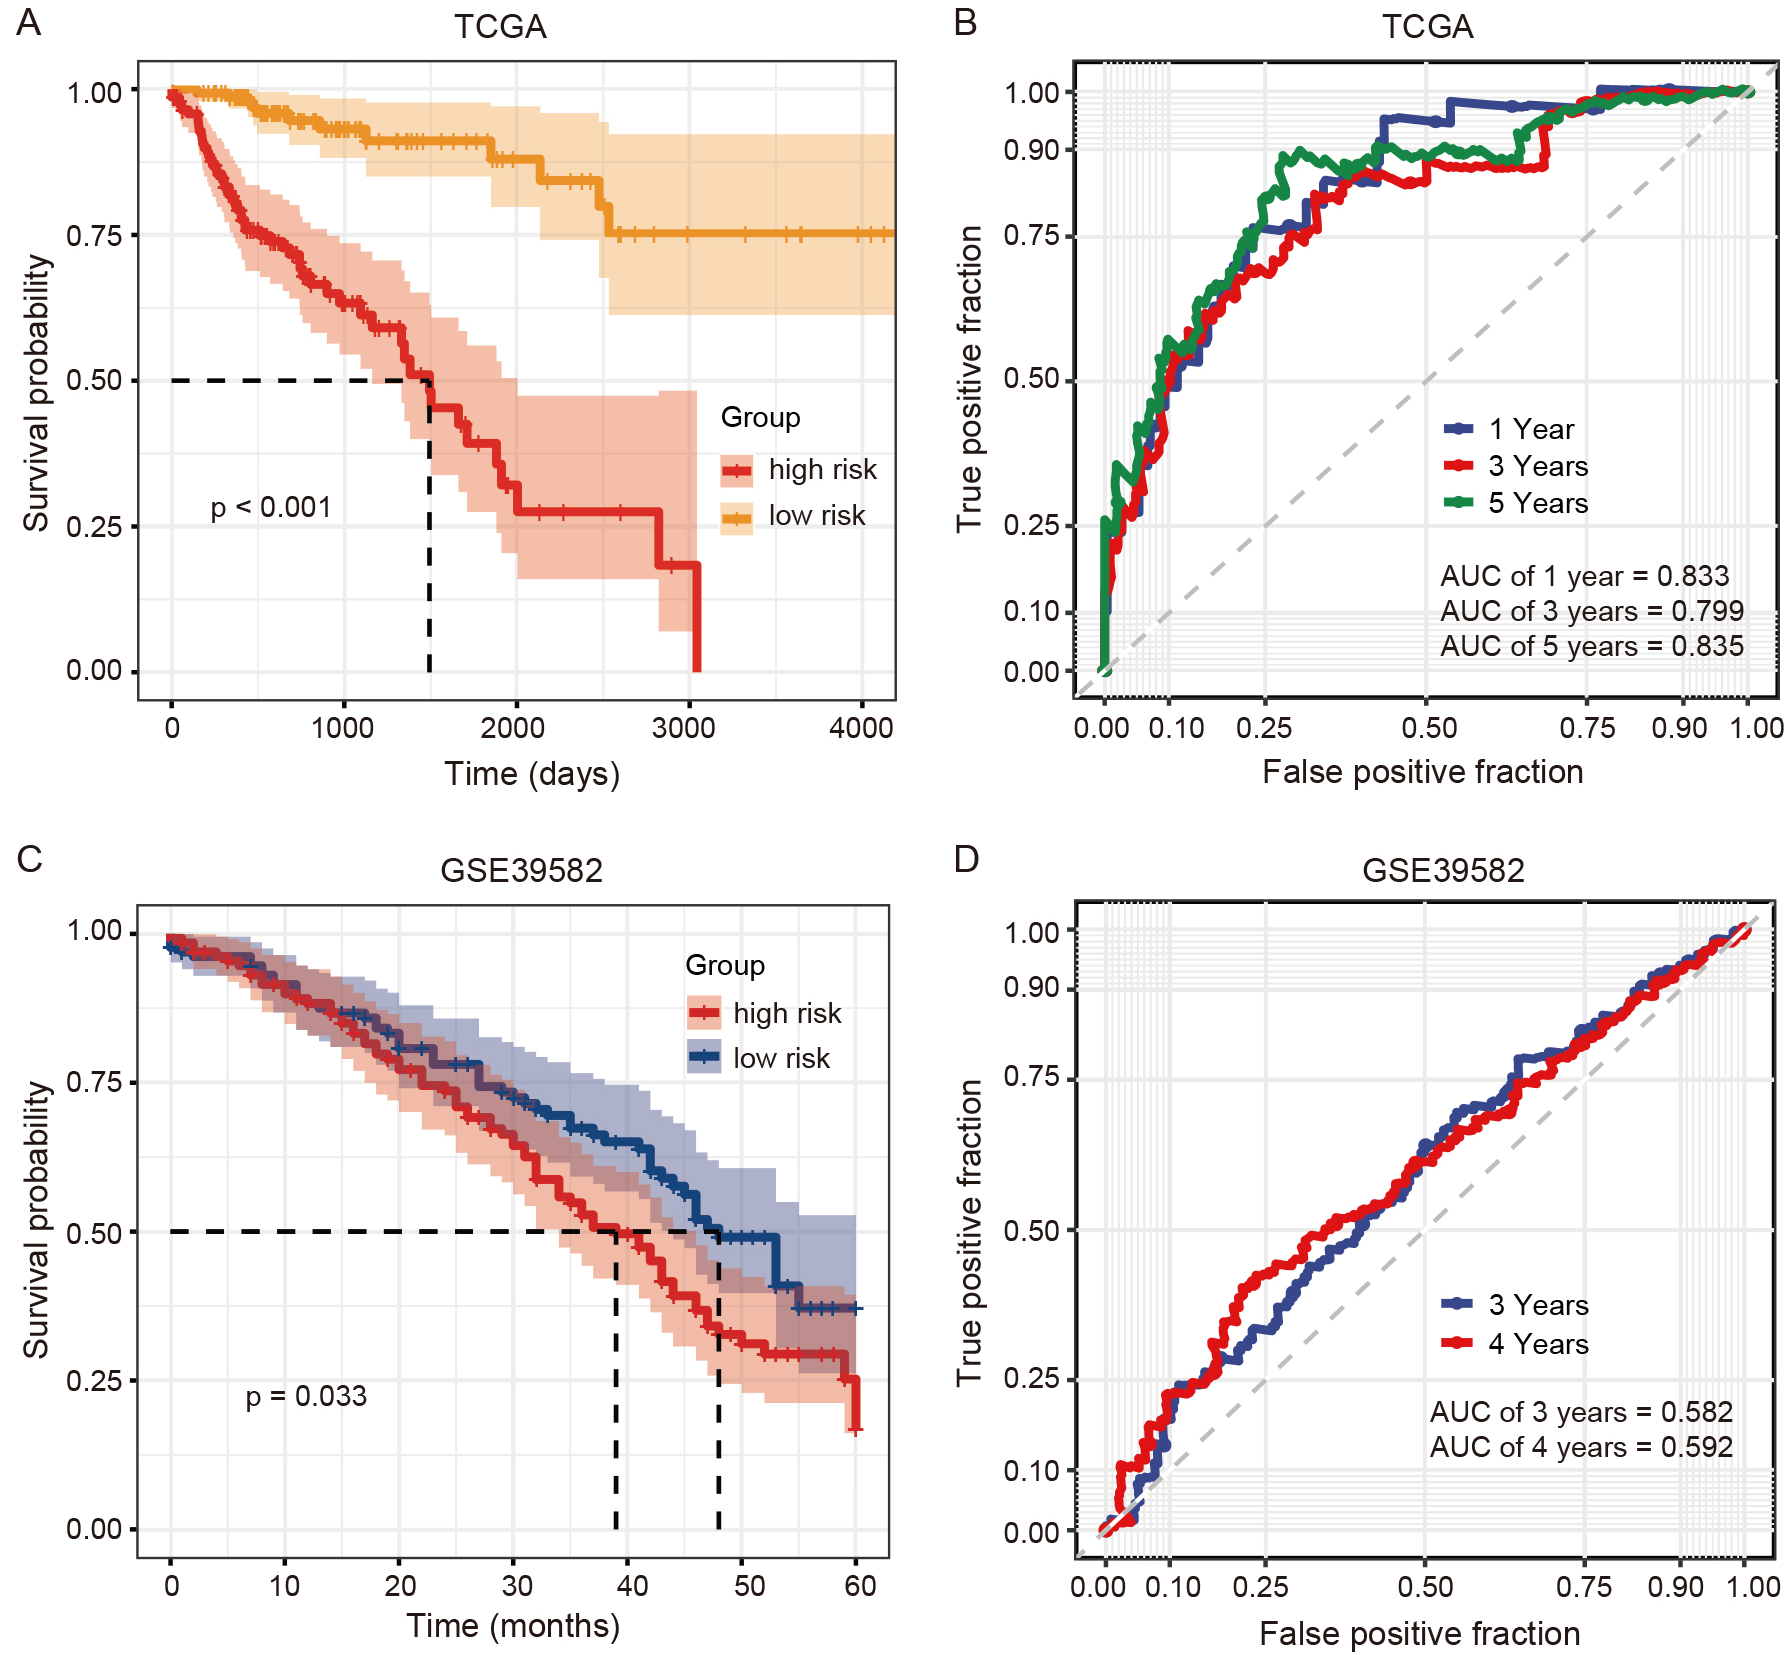 Fig. 4.
Predictive efficacy of ferroptosis-related mRNA signatures in COAD patients from The Cancer Genome Atlas (TCGA) and Gene Expression Omnibus (GEO) databases. (A,B) Survival and receiver operating characteristic (ROC) curves of the 12-DE-mRNA signature in COAD patients from the TCGA. (C,D) Survival and ROC curves of the 12-DE-mRNA signature in COAD patients from GSE39582.
To further explore the ferroptosis-related regulatory features associated with
COAD prognostic outcomes, 91 DMCs, 324 DE-lncRNAs, and 39 DE-miRNAs were
identified displaying differences between COAD patients and normal samples, as
well as between the high-FS and low-FS COAD subgroups (see Methods). A subset of
132 high-FS and 160 low-FS COAD patients with transcriptomic, miRNAomic, and
methylomic data were selected for subsequent analyses. LASSO Cox regression
analysis was then performed on the 91 DMCs, 324 DE-lncRNAs, and 39 DE-miRNAs to
identify the most predictive features for COAD prognosis. In total, 10 DMCs, 12
DE-lncRNAs, and 14 DE-miRNAs were selected as variables for the risk score models
at different molecular levels (i.e., risk-score
The risk score of each COAD patient was then calculated at three molecular
levels using the three different datasets. According to the median values of the
risk scores inferred by each molecular signature (i.e., DNAm, lncRNA, and miRNA),
the COAD patients were categorized into high- and low-risk groups (Fig. 5A,E,I).
Kaplan-Meier analyses revealed significantly poorer prognosis for patients in the
high-risk group than those in the low-risk group for each -omics data type (Fig. 5B,F,J). Supplementary Fig. 4 presents the vital statuses of COAD
patients classified into the high- and low-risk groups, as determined by the
signatures from the three -omics-level datasets. The risk score models from the
three datasets were then used to predict patient survival status at 1, 3, and 5
years. ROC curve analysis showed that the AUC values for the DNAm risk score
model were 0.725, 0.718, and 0.774 at 1, 3, and 5 years, respectively (Fig. 5C);
the AUC values for the lncRNA risk score model were 0.797, 0.739, and 0.773 at 1,
3, and 5 years, respectively (Fig. 5G); and the AUC values for the miRNA risk
score model were 0.717, 0.721, and 0.707 at 1, 3, and 5 years, respectively (Fig. 5K). In addition, heatmaps presented the methylation and expression level changes
of the 10 DMCs, 12 lncRNAs, and 14 miRNAs within corresponding prediction models
alongside their respective risk scores (Fig. 5D,H,L). Notably, a significant
proportion of molecular features, including 8 DMCs, 11 lncRNAs and 8 miRNAs,
demonstrated statistically significant correlations between their methylation and
expression levels and the associated risk cores (p
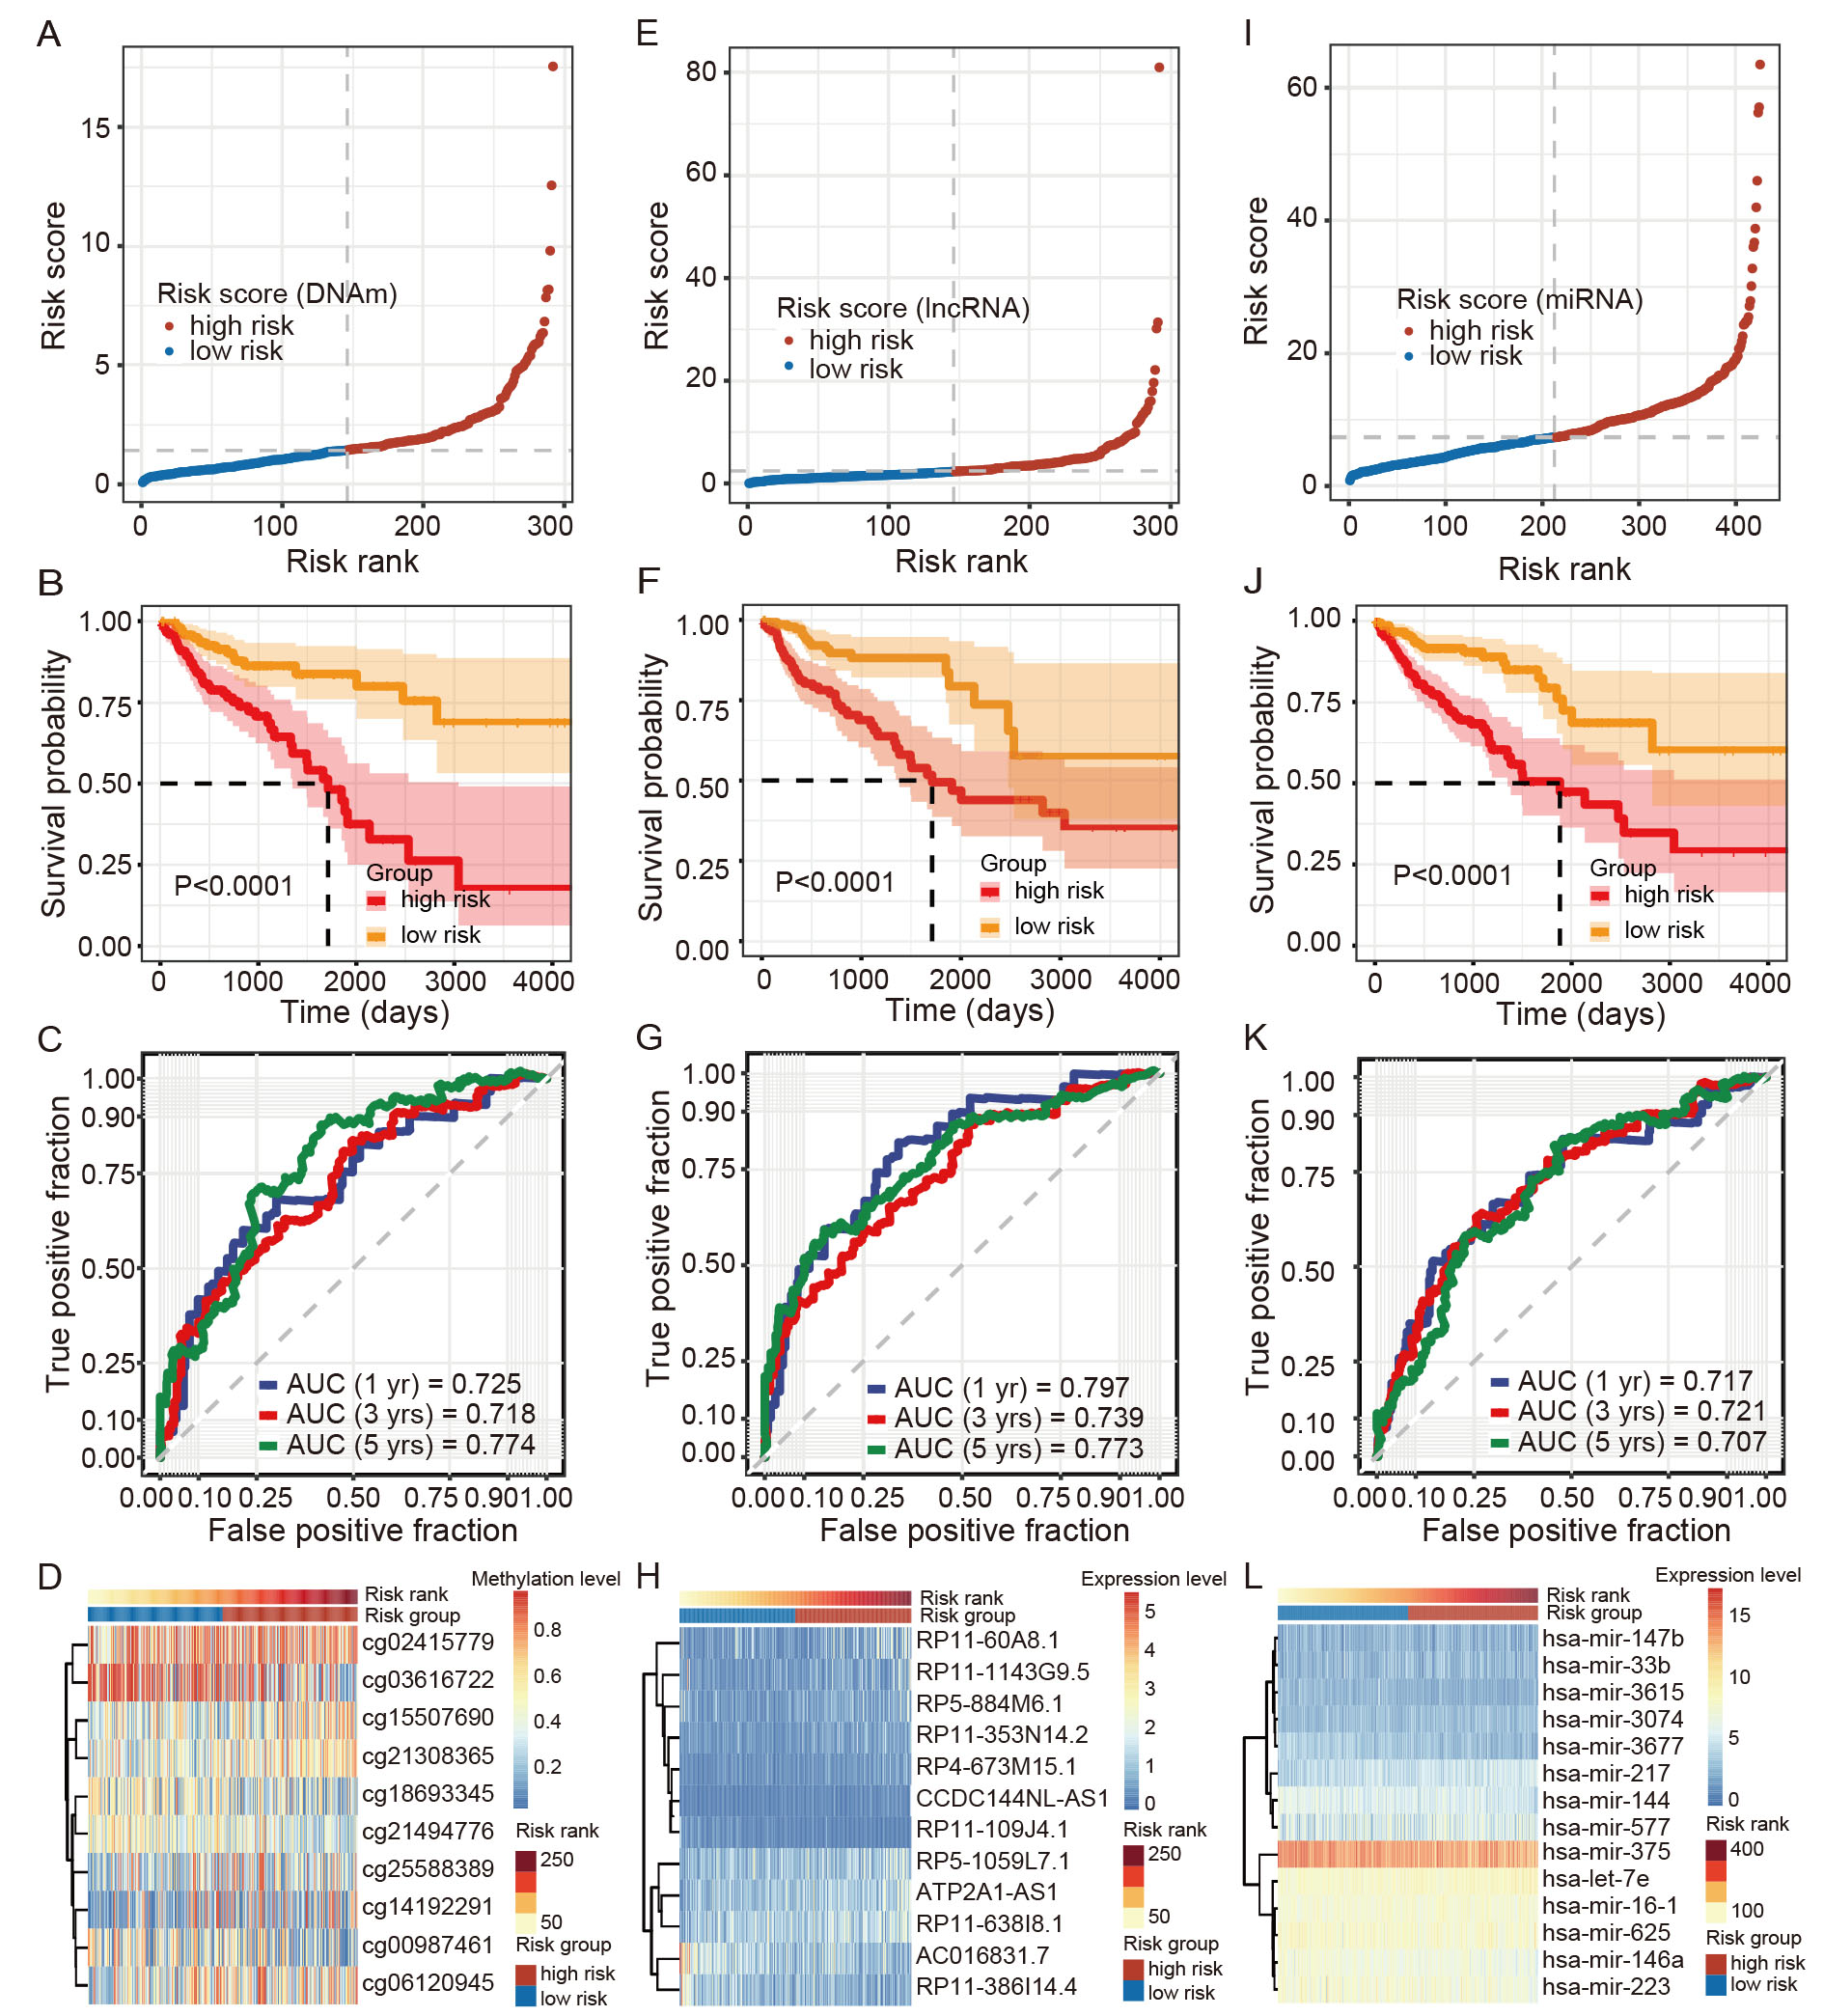 Fig. 5.
Construction of ferroptosis-related multi-omics signatures (10 differentially methylated CpG sites (DMCs), 12 DE-lncRNAs, and 14 DE-miRNAs) in COAD patients. (A–D) Risk score plot, survival curve, ROC curve, and heatmap plot of 10-DMC signatures. (E–H) Risk score plot, survival curve, ROC curve, and heatmap plot of 12-DE-lncRNA signatures. (I–L) Risk score plot, survival curve, ROC curve, and heatmap plot of 14 DE-miRNA signatures. In this panel, figures (C,G,K) show predictive performance of three molecular signatures for COAD survival.
To explore the potential of ferroptosis-related multi-omics features as biomarkers for COAD classification, the “mixOmics” R package was used to integrate three omics datasets. This integration encompassed 292 samples with corresponding RNA-seq, HM450, and miRNA-seq data, and included the previously identified 10 DMCs, 12 DE-lncRNAs, and 14 DE-miRNAs. Results showed that the high-FS and low-FS COAD subgroups were distinguishable based on the first and second components of the models for the DNAm, lncRNA, and miRNA datasets, with AUC values of 0.77, 0.76, and 0.80, respectively (Fig. 6A). The loading weights of each selected variable on each component and each dataset are presented in Fig. 6B. In addition, the Circos plot showed significant correlations between and within variables at different -omics levels (r = 0.2) (Fig. 6C). These results indicate that the multi-omics signatures can classify COAD patients into two subtypes based on their ferroptosis activity.
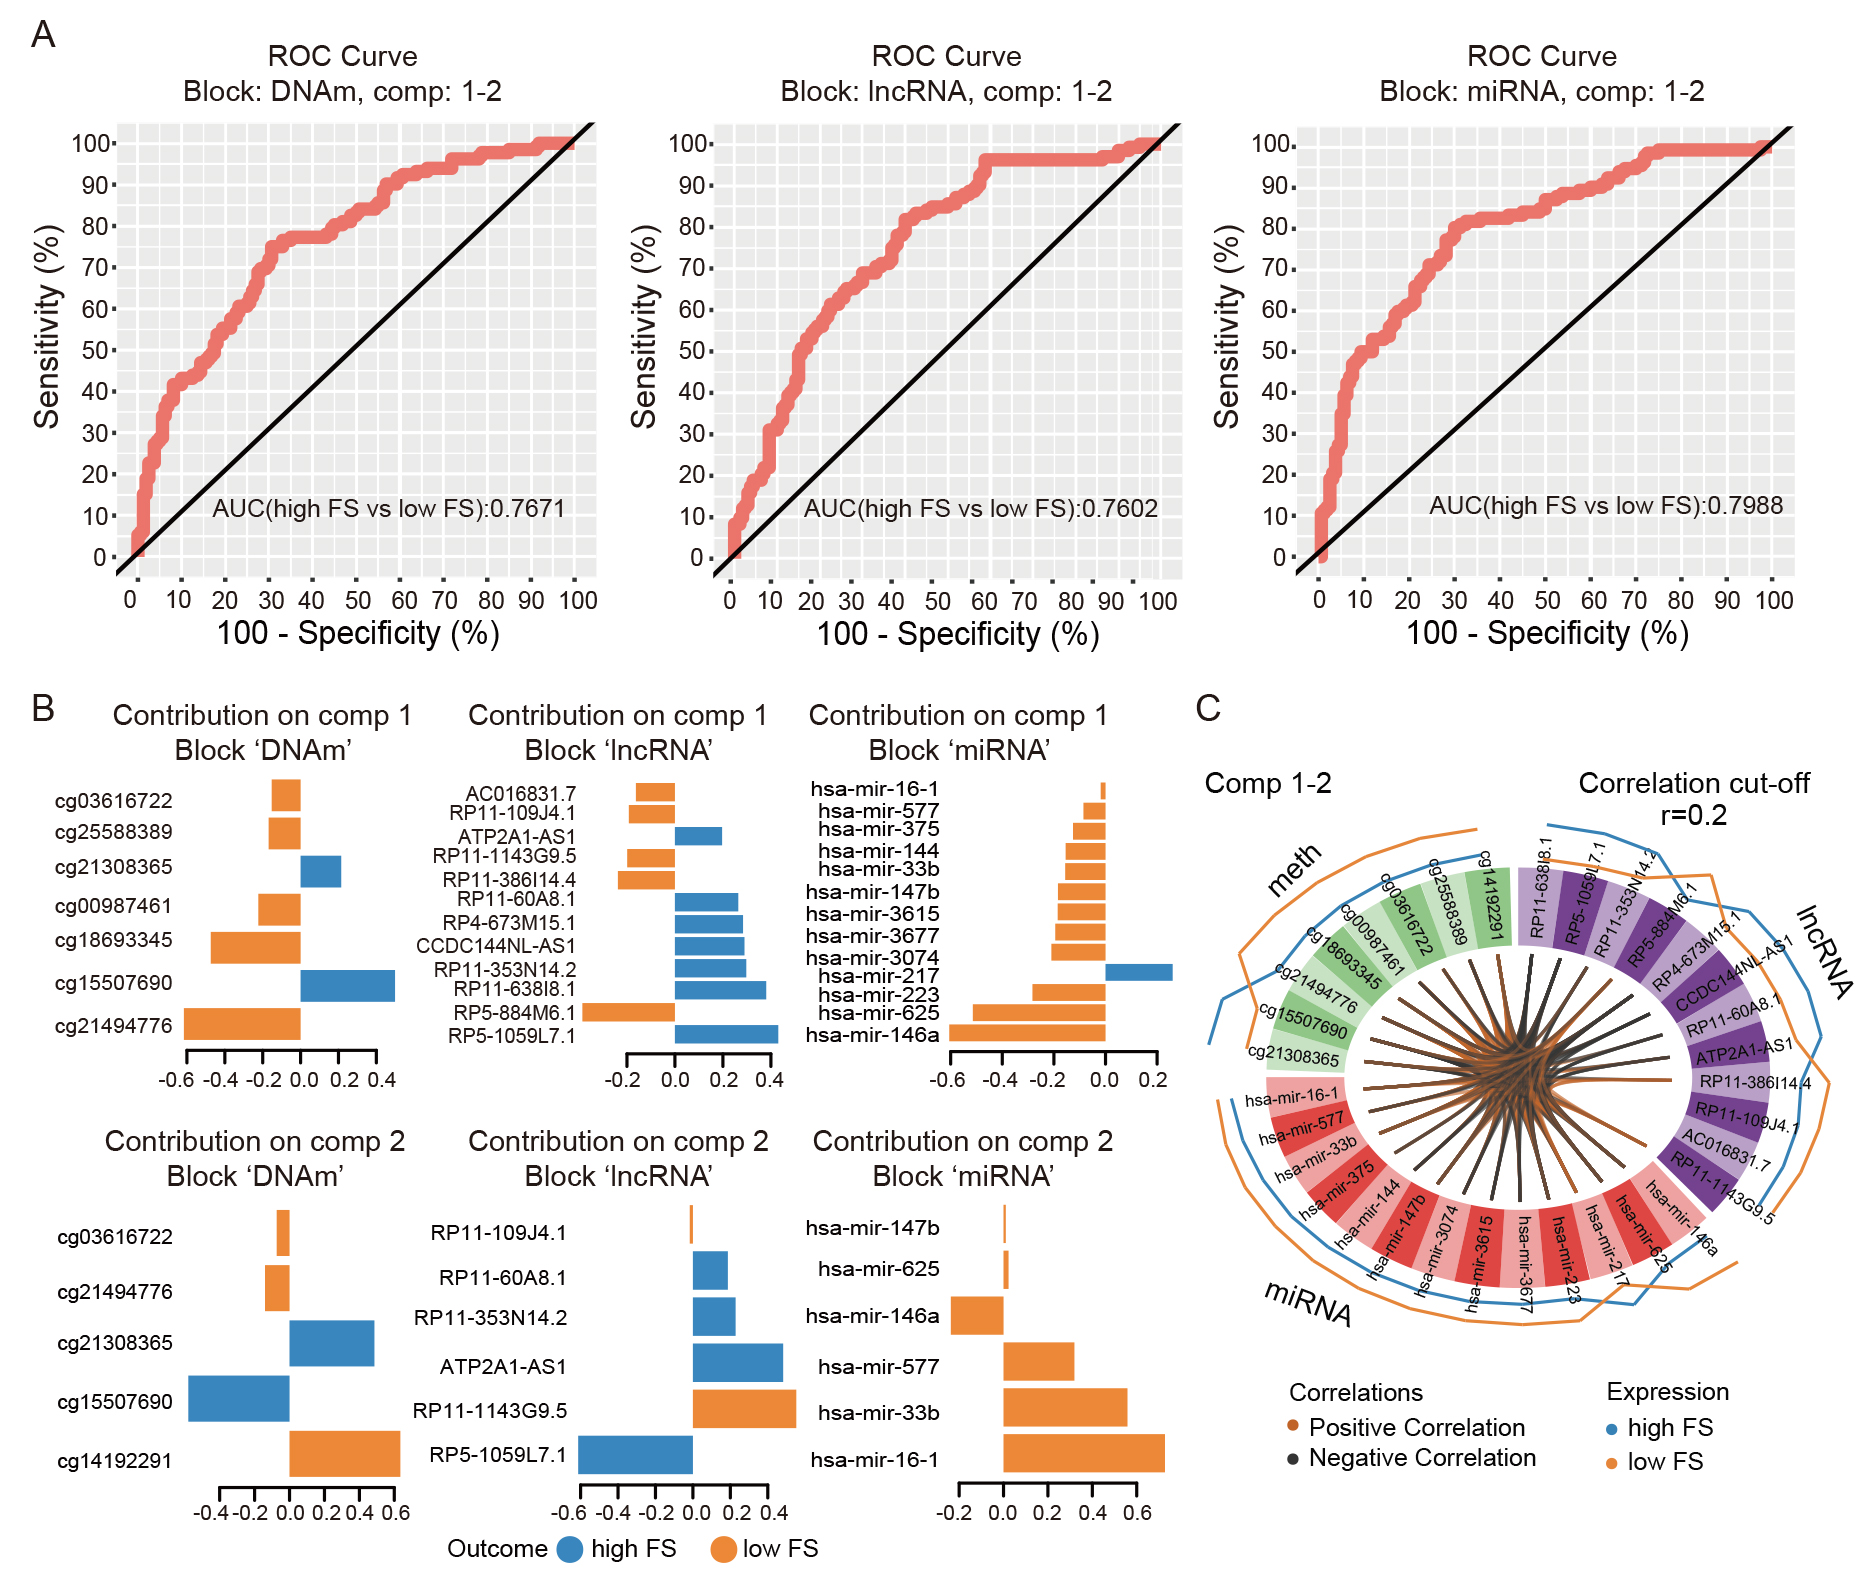 Fig. 6.
Discriminant analysis of COAD patients. (A) ROC curves of three molecular signatures (viz., DNAm, lncRNA, and miRNA) discriminating between high- and low-FS patients. Plot suggests that variables (i.e., markers) selected by sparse Partial Least Square-Discriminant Analysis (sPLS-DA) on components 1 and 2 in each of the signatures can discriminate high-FS samples from low-FS samples. (B) Loading weight plots of variables selected by sPLS-DA on components 1 and 2 in each signature. Variables are ranked according to their loading weight (most important at bottom to least important at top). Colors indicate group for which a particular variable has a higher value than the other group. (C) Circos plot of positive or negative correlations between selected variables from three signatures (presented by brown and black links, respectively). Plot represents correlations greater than 0.2 between variables of different molecular types. Outer lines show levels of each variable in the two groups (i.e., high-FS vs. low-FS).
Ferroptosis, an iron-dependent form of programmed cell death, is characterized by intracellular accumulation of lipid peroxidation [28]. Mounting evidence has shown that ferroptosis plays an important role in the pathogenesis of various diseases, especially tumors [29]. An increase in ferroptosis activity has also been shown to suppress the progression of various cancers, such as COAD [30]. Therefore, ferroptosis-related regulatory features at multi-omics levels could potentially be harnessed for cancer diagnosis, classification, and treatment.
In this study, the ferroptosis activity (viz., FS) of each COAD patient
was estimated using ssGSEA based on the expression of 20 ferroptosis-related
genes linked to COAD survival, many of which are implicated in tumor
pathogenesis. GPX4, a well-known oncogene that inhibits ferroptosis in
cancer cells [31], showed a negative association with COAD survival (p
Enrichment analysis was further conducted to explore the biological functions of
protein-coding mRNA genes that exhibited differential expression between the
high- and low-FS COAD subgroups. Results showed that the up-regulated DE-mRNAs
were enriched in the TNF signaling, chemokine signaling, and cytokine-cytokine
receptor interaction pathways, while the down-regulated DE-mRNAs were enriched in
the cell adhesion molecule, chemical carcinogenesis, and cAMP signaling pathways.
Several of these pathways, especially those related to immunity, are correlated
with ferroptosis and cancer development. For example, CD8+ T cells can release
TNF and interferon gamma (IFN-
Ferroptosis-related multi-omics signatures at the DNAm, lncRNA, and miRNA levels
were identified to predict COAD prognosis, yielding 10 DMCs, 12 DE-lncRNAs, and
14 DE-miRNAs, respectively. The ROC and AUC results demonstrated the potential of
these signatures in predicting COAD survival (AUC
Multiple significant methylation sites, lncRNAs, and miRNAs associated with ferroptosis activity were identified, demonstrating potential as biomarkers for COAD prognosis and classification. These ferroptosis-related multi-omics signatures offer novel clinical perspectives for COAD diagnosis and therapy. Additionally, this study identified a potential relationship between ferroptosis and the immune response, revealing a possible interplay in the development of COAD.
COAD, colon adenocarcinoma; TCGA, the Cancer Genome Atlas; FS, ferroptosis score; ssGSEA, single-sample gene set enrichment analysis; DNAm, DNA methylation; DE-mRNA, differentially expressed mRNA; DE-lncRNA, differentially expressed lncRNA; DMC, differentially methylated CpG site; DE-miRNA, differentially expressed miRNA; LASSO, least absolute shrinkage and selection operator; ROC, receiver operating characteristic; AUC, area under ROC curve; TNF, tumor necrosis factor.
Multi-omics data for COAD samples were downloaded from the TCGA database using the UCSC Xena platform (https://xena.ucsc.edu/). An independent gene expression microarray dataset for COAD were downloaded from the Gene Expression Omnibus (GEO) database (GSE39582) (https://ncbi.nlm.nih.gov/geo/). All data analyzed during this study are included in this published article.
YFL and XQC conceived and designed the project and reviewed and approved the manuscript. XQC, KL, and ZWC conducted data analysis and drafted the manuscript. FHX provided valuable assistance and guidance throughout the data acquisition, analysis and interpretation phases of the work. XZ, TL, TW, TS, XYC, and XSC contributed to the interpretation of data derived from the reviewed literature. All authors contributed to editorial changes in the manuscript. All authors read and approved the final manuscript. All authors have participated sufficiently in the work and agreed to be accountable for all aspects of the work.
This study is based on open-source data obtained from the TCGA and GEO databases, and does not contain any experiments with human participants or animals performed by the authors. All procedures were carried out in accordance with relevant guidelines and regulations. The study was approved by the Institutional Review Board of Colorectal Cancer Clinical Research Center, Third Affiliated Hospital, Kunming Medical University, China (KYCS2023-031).
We would like to thank Dr. Christine Watts for help in editing the manuscript.
This work was supported by a grant from Scientific Research Fund Project of Yunnan Provincial Department of Education (2023Y0657).
The authors declare no conflict of interest.
Publisher’s Note: IMR Press stays neutral with regard to jurisdictional claims in published maps and institutional affiliations.