
- Academic Editors
Background: The current research centers on exploring the antioxidant,
antimicrobial, and antidiabetic features of Schinus molle L. grown in
Turkey. Methods: Quantitative analysis of chlorogenic acid, caffeic
acid, and hyperoside levels in leaf, ripe fruit, and raw fruit extracts was
conducted using High-Performance Liquid Chromatography (HPLC) in a 70%
methanol-water mixture. Among the extracts, the methanol extract from ripe fruits
displayed the highest chlorogenic acid concentration, measuring at 2.040%
Throughout history, the therapeutic properties of medicinal plants have played a significant role in people’s lives. Because of their affordability and accessibility, these plants have been utilized for ages by several civilizations to cure a variety of ailments [1]. Worldwide, it is estimated that 422,000 plant species are used for therapeutic purposes [2]. Schinus molle belongs to the Anacardiaceae family and a native of South America, particularly the coast of Brazil, is one of these medicinal plants. Amenorrhea, bronchitis, gingivitis, gonorrhea, gout, tuberculosis, tumors, ulcers, urethritis, warts, and urogenital disorders are only a few of the ailments that have historically been treated with S. molle [3]. As a result of its antibacterial and antiseptic capabilities, it has also been employed for the treatment of wounds and pathogenic conditions. Rheumatism and ophthalmia have both been healed using the juice from the leaves [4, 5]. Apart from its therapeutic use, S. molle’s fruit and essential oil are occasionally substituted for “black pepper” in dishes despite having a milder flavor. In Peru, it is often drunk as a beverage during celebrations. This drink (chicha de molle) is made by soaking the S.molle fruit in water, then adding sugar and processing the combination in certain containers [6, 7, 8].
S. molle fruits and leaves are rich in essential oil and the oil
contains
As it is known, plants exhibit diverse responses to the geographical locations
they inhabit, which greatly influences their phenolic content. The proportion of
secondary metabolites may vary due to a multitude of factors [13]. In a study
conducted in 2023, it was noted that there was a remarkable variation in the
substance of S. molle specimens collected from different locations [14].
Therefore, the analysis of the content of S. molle grown in our region
and indirectly the investigation of its bioactivity are pioneering and make a
significant contribution to the literature. While studies evaluating the
antioxidant and antimicrobial effectiveness of the plant exist, our results in
this research indicate that the content varies due to the reasons mentioned above
and affects the activity outcomes. Furthermore, the antibiofilm activity of
extracts from the plant has been evaluated for the first time by us. When it
comes to the antidiabetic activity, especially its effects on
In light of the facts presented above, the aim of the article is to scrutinize the bioactivity and chemical profiles of extracts obtained from the leaves, ripe, and immature fruits of S. molle, thanks to its remarkable therapeutic properties. The chemical compositions of the extracts, as well as the presence and quantity of the plant’s most common phenolic components, were determined through High-Performance Liquid Chromatography (HPLC). Comprehensive information regarding their biological properties, including antioxidant, antimicrobial, and antidiabetic activities, was examined. The most significant point derived from this data is that this plant, which is also used as a spice, holds promise as a potential source for various medicinal uses.
Schinus molle L. utilized in experimental studies was collected from the Didim (37°20’32.1”N 27°15’39.2” E) district of Aydın province in August 2021. The leaves and ripe and raw fruits were dried in the shade to avoid direct sunlight. The herbarium sample of the plant, collected and diagnosed, is preserved in the Faculty of Pharmacy of Erciyes University (Sİ 175).
Using alcohol-water mixtures to extract flavonoids and their conjugates from plant materials is a common application, and 70% methanol solution has proven to be an effective solvent in the extraction methods used [15]. For this reason, leaves (50 g), ripe (25 g), and raw (25 g) fruits from the collected plant parts were roughly powdered and extracted by adding a sufficient amount (approximately 500 mL) of 70% methanol. Water extract was prepared using distilled water. It was macerated at 37 °C using a shaking water bath. The same procedures were repeated 3 times for methanol and water extract on the same plant residue. After filtration, the filtrates were combined and the solvents were eliminated in vacuum rotavapor (37–38 °C). Concentrated extracts were lyophilized and kept at –18 °C for use in the experiment.
To calculate the amount of total phenolic content, distilled water (3.95 mL),
Folin-Ciocalteu reagent (250 µL), and 20% Na
To measure the total amount of flavonoids, 4 mL of distilled water and 0.3 mL of
5% NaNO
The sample solution was prepared at a concentration of 4 mg/mL, and for the stock solution, caffeic acid, chlorogenic acid, and hyperoside were prepared at a concentration of 500 µg/mL. HPLC analysis (Agilent 1100 series with diode array detector, New York, USA) was conducted with WatersSpherisorb C18 column (25 cm 4.6 mm, 5 µm). The mobile phase consisted of 0.01% formic acid (A) and acetonitrile (B), provided in a gradient system at a flow rate of 1 mL/min each. The proportion of A was reduced from 90% to 60% over 30 minutes, then returned to the initial conditions in 5 minutes. A wavelength of 270 nm was utilized for the detection of all samples. Three injections of five different standard concentrations were made, and a calibration curve was constructed for each standard for quantification purposes. Method validation included the calculation of accuracy, precision, limit of detection (LOD), limit of quantitation (LOQ), recovery values, and other metrics [18, 19]. Differences were demonstrated using the relative standard deviation (RSD) to assess the method’s accuracy in terms of intra-day and inter-day variance. To determine LOD and LOQ values, ten injections of standards were performed, considering a signal-to-noise ratio of 3:1 for LOD and 10:1 for LOQ. For the recovery analysis, three different known concentrations of the standard were included in the sample, and the recovery percentage was computed. Minor adjustments to the flow rate, column temperature, mobile phase, and wavelength were made for the robustness study, and their effects were examined.
The extracts were mixed with a DPPH solution made in methanol (0.1 mM) and Tris-HCl buffer (50 nM, pH 7.4). A reagent mixture devoid of extract and chlorogenic acid was used as a control. The samples’ absorption spectra at 517 nm were read after incubating them in the dark at room temperature for 30 minutes. The following equation was used to calculate inhibition % after three parallel runs of the experiment [20].
An ABTS
1 mL of each extract was combined with 2.5 milliliters of a 1% (w/v) potassium
hexacyanoferrate solution and 2.5 mL of a 0.2 M phosphate buffer (pH 6.6). 2.5 mL
of 10% (w/v) trichloroacetic acid (TCA) was added after 30 minutes at 50
°C of incubation, and the mixture was subjected to centrifugation at
1000 g for 10 minutes. Subsequently, the absorbance at 700 nm was determined by
mixing 2.5 mL of the upper layer with 2.5 mL of H
The determination of the Minimum Inhibition Concentrations (MIC) of the extracts was performed using the broth microdilution assay, following the guidelines outlined in the Clinical Laboratory Standards Institute (CLSI) M100-S28 protocol for bacteria and CLSI M27-A3 protocol for fungi [23, 24]. Staphylococcus aureus ATCC 29213, Escherichia coli ATCC 25922, and Candida albicans ATCC 10231 were utilized. Serial two-fold dilutions of each extract in the concentration range of 1–1024 g/mL were prepared in Mueller Hinton Broth (MHB) for bacteria and RPMI-1640 for yeast. All extracts were dissolved in a 10% DMSO solution. Reference antimicrobials were also tested against these microorganisms. Concurrently, growth control for microorganisms and sterilization control for the media were conducted. Additionally, 10% DMSO, used as a solvent for the extracts in this test, was assessed for antimicrobial activity. Following incubation for 18–24 hours at 37 °C for bacteria and 48 hours for fungi, the last tube without any microbial growth was identified as the Minimum Inhibition Concentration (MIC) value (in g/mL). The experiment was repeated three times to ensure consistency and accuracy of results.
To assess the antibiofilm activities of extracts, Nostro et al. (2007) [25] method was used. Firstly, 100 µL of microorganism suspensions prepared in Tryptic Soy Broth (TSB) medium involving 1% glucose were added to the 96-well microplate. 100 µL of each extract concentration at the range of 128–512 µg/mL were added into wells. The negative control consisted of the TSB medium, while the positive control consisted of microorganism cultures alone without any additional extract. After 24 hours of culturing for bacteria and 48 hours for yeast, the contents of the microplate were gently emptied. Immediately afterward, every well was washed with 300 µL of sterile Phosphate Buffered Solution (PBS). After waiting for half an hour in the open air, the wells were dyed with 0.1% (w/v) crystal violet for half an hour at room temperature. Washing with 200 µL PBS was repeated 3 times this time. The open-air waiting process was repeated. The crystal violet was subsequently dissolved using 95% (v/v) ethanol, and the optical density (OD) was quantified at 595 nm for S. aureus and E. coli and at 540 nm for C. albicans, employing a Microplate reader from Azure Biosystems. MBIC was set as the concentration of the extract at which the OD was less than or equal to that of the negative control [26]. The experiment was repeated 3 times.
The procedure outlined by Liu et al. [27] was followed. 200
µL of the extract or acarbose, along with 50 µL of a 2
U/mL
A modified version of the Sigma-Aldrich method [28] was employed to determine
inhibitory effects on the
The
To evaluate the efficacy of the extracts on diabetes, pancreatic
For variance homogeneity, the Levene test was used. Several groups were examined
with one-way ANOVA (Analysis of Variance). For pairwise comparison tests, the
Dunnett and Tukey tests were used at the p
The phenol and flavonoid composition of the plant was determined by
spectrophotometric methods as stated in the material method section. The extract
with the highest total phenolic content was identified as the S.m L MeOH extract,
with a value of 231.32
| Extracts | Total Phenol [mg |
Total Flavonoid [mg |
Chlorogenic acid (% |
Caffeic acid (% |
Hyperoside (% |
| S.m L MeOH | 231.32 |
44.40 |
0.325 |
ND |
0.057 |
| S.m L water | 172.00 |
40.32 |
0.396 |
0.006 |
0.068 |
| S.m Ripe F MeOH | 126.11 |
26.02 |
2.040 |
UD |
UD |
| S.m Ripe F water | 59.54 |
12.99 |
0.306 |
UD |
UD |
| S.m Raw F MeOH | 117.70 |
20.16 |
0.508 |
UD |
UD |
| S.m Raw F water | 63.48 |
15.18 |
0.209 |
UD |
UD |
In a study conducted in Tunisia, the highest total phenol and flavonoid contents
of methanol extracts of S. molle fruits collected from two different
localities were found to be 29.01
HPLC analyses of the extracts were made for some phenolic compounds and results
of analytical measurements are shown in Tables 1,2,3,4. Qualitative and
quantitative analyses of phenolics such as chlorogenic acid, caffeic acid,
coumaric acid, ferulic acid, rutin, hyperoside, and rosmarinic acid were
performed. All extracts were analyzed and it was observed that chlorogenic acid
was identified in all extracts. Caffeic acid was found only in S.m L Water, and
hyperoside was detected in S.m L water together with S.m L MeOH. The highest
quantity of chlorogenic acid was calculated in Schinus molle ripe fruit
methanol extract (S.m Ripe F MeOH = 2.040%
| Standards | Caffeic acid | Chlorogenic acid | Hyperoside |
| Calibration range (µg/mL) | 5–200 | 5–200 | 5–200 |
| Linear Equation | y = 53.607x + 14.135 | y = 3.607x + 14.135 | y = 50.62x + 32.131 |
| Correlation factor (r |
0.999 |
0.996 |
0.999 |
| Limit of Detection (µg/mL) | 0.039 | 0.371 | 0.112 |
| Limit of Quantitation (µg/mL) | 0.131 | 1.237 | 0.375 |
| Amount (µg/mL) | Caffeic acid | Chlorogenic acid | Hyperoside | |
| Intra-day precision (RSD |
5 | 2.284 | 3.402 | 0.490 |
| 50 | 2.636 | 0.719 | 0.458 | |
| 200 | 1.244 | 1.477 | 0.836 | |
| Inter-day precision (RSD |
5 | 0.598 | 3.139 | 0.344 |
| 50 | 2.609 | 3.568 | 0.450 | |
| 200 | 1.241 | 0.852 | 0.820 |
| Standards | Concentration in a sample (mg/mL) | Amount spiked (mg/mL) | The mean amount found in the mixture (mg/mL) | Mean recovery (% |
RSD |
| Caffeic acid | 0.0002 | 0.0004 | 0.0003 | 101.629 |
0.783 |
| 0.0002 | 0.0002 | 97.514 |
1.445 | ||
| 0.0001 | 0.00015 | 104 |
1.296 | ||
| Chlorogenic acid | 0.016 | 0.032 | 0.024 | 104.345 |
0.504 |
| 0.016 | 0.016 | 98.127 |
1.070 | ||
| 0.008 | 0.012 | 103.565 |
1.536 | ||
| Hyperoside | 0.002 | 0.004 | 0.003 | 99.570 |
0.505 |
| 0.002 | 0.002 | 101.107 |
0.642 | ||
| 0.001 | 0.0015 | 100.593 |
1.244 |
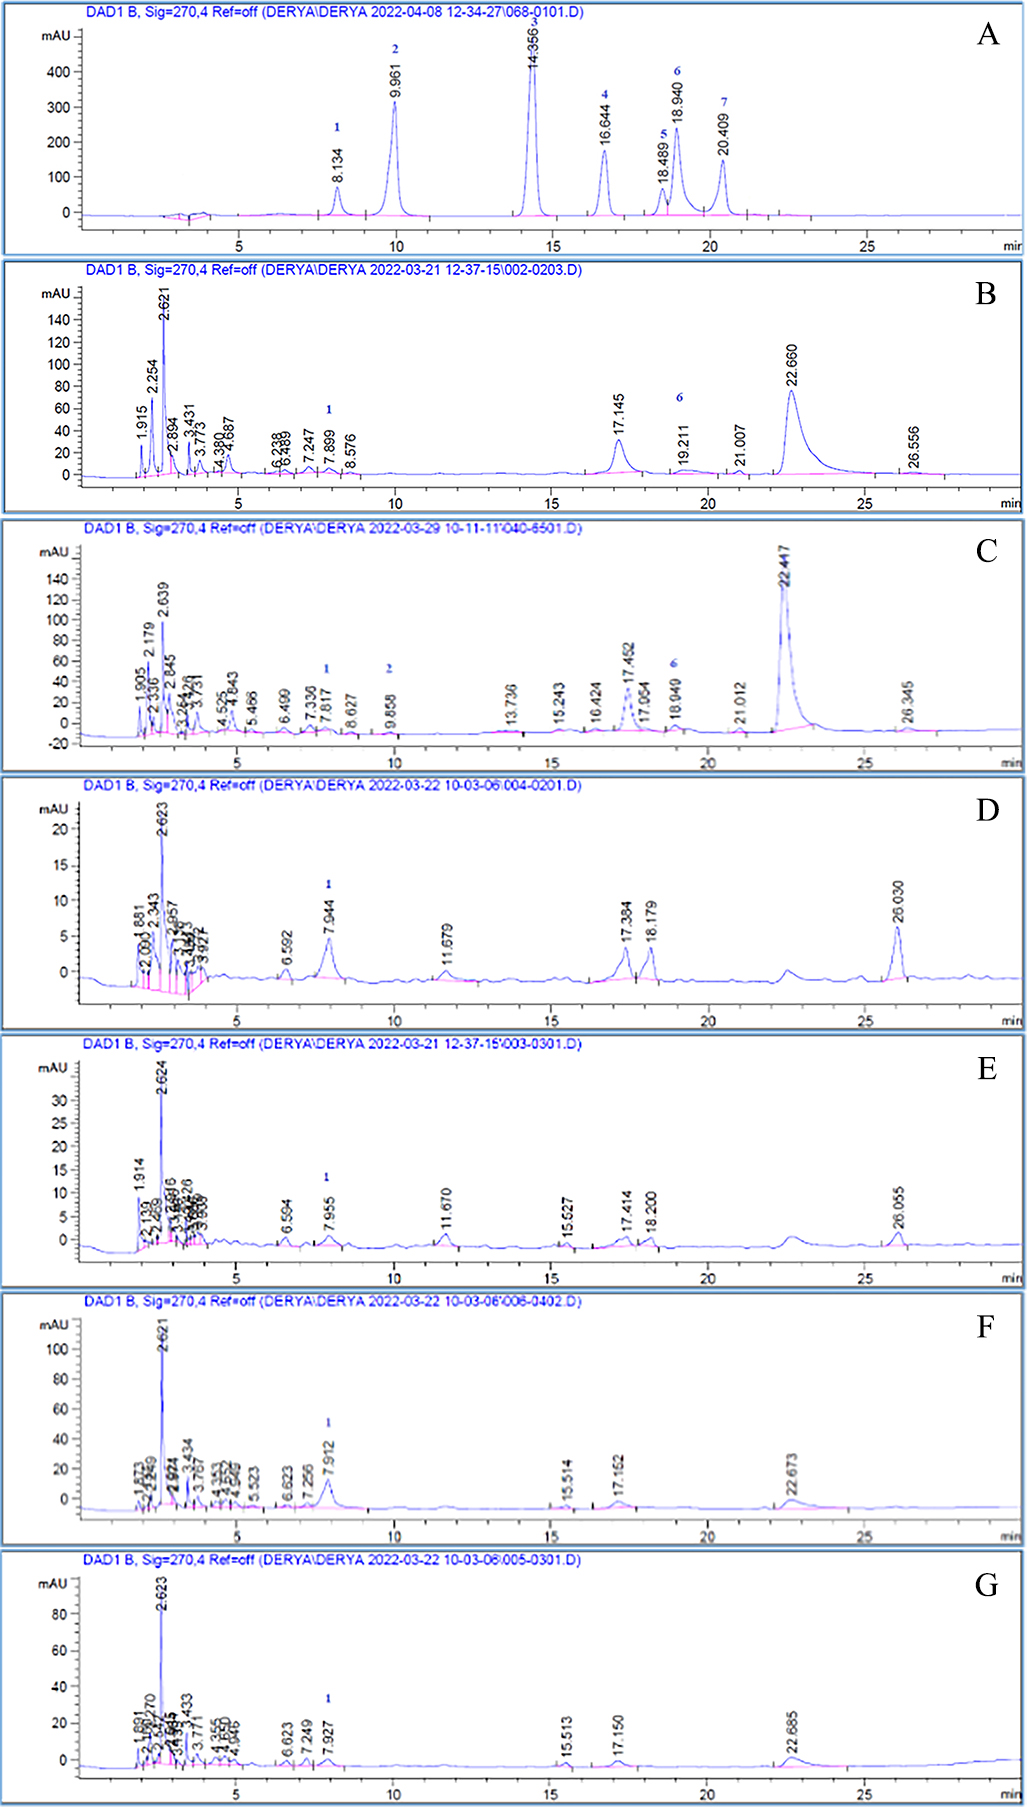 Fig. 1.
High-Performance Liquid Chromatography (HPLC) chromatograms. A. Standards: (1) Chlorogenic acid, (2) Caffeic acid,(3) Coumaric acid, (4) Ferulic acid, (5) Rutin, (6) Hyperoside, and (7) Rosmarinic acid. B. Leaf methanol extract. C. Leaf water extract. D. Raw fruit methanol extracts. E. Raw fruit water extract. F. Ripe fruit methanol extracts. G. Ripe fruit water extracts.
A chemical examination of S. molle fruit was performed in research conducted in Tunisia, and when compared to the phenolic chemicals discovered in our study, the rutin compound was detected in fruits obtained from Tunisia, but not in fruits collected from Turkey [32].
The antioxidant properties of S. molle extracts were evaluated in terms of DPPH and ABTS radical scavenging activities and reducing power capacity, and the results are given in Tables 5,6,7. All extracts were studied at four different concentrations and chlorogenic acid was used as the standard. It was determined that the extracts with the highest DPPH radical scavenging capacity were S.m L MeOH and S.m Ripe F MeOH at 1mg/mL concentration. These extracts had an activity that was statistically equivalent to chlorogenic acid, according to the evaluation. When the ABTS radical scavenging activities were examined, it was confirmed that S.m L MeOH and S.m Ripe F MeOH extracts had the highest activity at 1 mg/mL concentration, and it was observed that they showed higher activity than chlorogenic acid at the same concentration. Only S.m. Ripe F MeOH from the extracts demonstrated comparable action with chlorogenic acid when the reduction power capabilities of Iron III to Iron II were assessed.S.m Raw F water extract had the lowest antioxidant capacity results in all antioxidant activity tests studied.
| Extract | % Inhibition | |||
| 4 mg/mL | 2 mg/mL | 1 mg/mL | 0.5 mg/mL | |
| S.m L MeOH | 80.57 |
80.46 |
80.19 |
77.38 |
| S.m L water | 79.20 |
78.51 |
75.47 |
69.30 |
| S.m Ripe F MeOH | 81.32 |
81.16 |
80.92 |
78.48 |
| S.m Ripe F water | 74.52 |
72.09 |
37.94 |
21.03 |
| S.m Raw F MeOH | 79.72 |
66.65 |
40.14 |
18.54 |
| S.m Raw F water | 66.04 |
48.24 |
26.83 |
11.45 |
| Chlorogenic acid | 85.11 |
84.74 |
84.28 |
75.20 |
Values expressed as mean
| Extract | TEAC mmol/L Trolox | |||
| 4 mg/mL | 2 mg/mL | 1 mg/mL | 0.5 mg/mL | |
| S.m L MeOH | 2.58 |
2.58 |
2.58 |
2.57 |
| S.m L water | 2.56 |
2.53 |
2.47 |
2.36 |
| S.m Ripe F MeOH | 2.59 |
2.59 |
2.58 |
2.58 |
| S.m Ripe F water | 2.39 |
2.38 |
2.19 |
1.51 |
| S.m Raw F MeOH | 2.58 |
2.57 |
2.53 |
1.73 |
| S.m Raw F water | 2.41 |
2.30 |
2.08 |
1.17 |
| Chlorogenic acid | 2.32 |
2.28 |
1.91 |
0.71 |
Values expressed as mean
| AscAE [mmol/g] | |
| S.m L MeOH | 1.283 |
| S.m L water | 1.542 |
| S.m Ripe F MeOH | 1.997 |
| S.m Ripe F water | 1.498 |
| S.m Raw F MeOH | 1.833 |
| S.m Raw F water | 1.832 |
| Chlorogenic acid | 2.315 |
Values expressed as mean
Most of the studies investigating the antioxidant properties of S.
molle have used essential oils from various plant parts. The essential oils of
S. molle grown in different countries were evaluated using different
antioxidant activity determination methods [9, 33, 34]. The aqueous extract
prepared from the woody branches of S. molle grown in Egypt demonstrated
a DPPH radical scavenging action, with an IC
Antioxidant capacities of water and methanol extracts of leaves, ripe and raw fruits of the plant were evaluated for the first time in this study according to DPPH, ABTS, and reducing power test.
The extracts were tested for their in vitro antimicrobial activities against Gram-positive (Staphylococcus aureus ATCC 29213) Gram negative (Escherichia coli ATCC 25922) bacteria and yeast (Candida albicans ATCC 10231) by using broth microdilution assay. Ampicillin, gentamycin, and vancomycin for antibacterial and fluconazole for antifungal activity were used in this assay as reference antimicrobial agents. The MIC values determined for each extract and reference antimicrobial agent as a result of the experiment were presented in Table 8. 10% DMSO had no antimicrobial activity in this test.
| Extracts | Bacteria | Yeast | |
| S. aureus | E. coli | C. albicans | |
| ATCC 29213 | ATCC 25922 | ATCC 10231 | |
| S.m L MeOH | 256 µg/mL |
128 µg/mL |
128 µg/mL |
| S.m L water | 256 µg/mL |
128 µg/mL |
128 µg/mL |
| S.m Ripe F MeOH | 256 µg/mL |
128 µg/mL |
128 µg/mL |
| S.m Ripe F water | 256 µg/mL |
128 µg/mL |
256 µg/mL |
| S.m Raw F MeOH | 128 µg/mL |
128 µg/mL |
128 µg/mL |
| S.m Raw F water | 256 µg/mL |
128 µg/mL |
256 µg/mL |
| Ampicilin | 2 µg/mL |
16 µg/mL |
- |
| Gentamycin | 1 µg/mL |
1 µg/mL |
- |
| Vancomycin | 1 µg/mL |
- | - |
| Fluconazole | - | - | 1 µg/mL |
Values presented as mean
According to the result of the antimicrobial assay, Minimum Inhibitory Concentrations (MICs) ranged from 128 to 512 µg/mL against all microorganisms in this study. Remarkably, the antimicrobial activity of the extracts on Gram-negative bacteria is relatively better. Therefore, it is observed that the antibacterial effects of the extracts are better than the antifungal effects. While the MIC values of the extracts in this study did not attain the levels of the reference antimicrobials, it’s worth noting a moderate antibacterial effect.
In a study in which they investigated the antibacterial activity of S. molle L. ethanol extract on S. mutans ATCC 25175 strain, they concluded that some concentrations of the extract showed an antibacterial effect as good as chlorhexidine [38]. Another study, it was found that the MIC of leaf extracts of S. molle L. on S. aureus ATCC 25922 and C. albicans ATCC 10231 strains in the range of 16–400 µg/mL and 25–50 µg/mL, respectively [39].
The antifungal activity of the extracts of S. molle fruits grown in Syria prepared with hexane and petroleum ether was evaluated and it was found to be effective against Botrytis cinerea at a dose of 1000 ppm [40]. Aqueous extracts prepared from the woody branches of S. molle showed a notable antimicrobial effect against Staphylococcus aureus and Escherichia coli, which were also tested in our study. However, moderate activity was observed against the same strains in leaf, ripe, and raw water extracts [35].
The antibacterial and antifungal effects of the extracts of S. lentiscifolius leaves prepared with different solvents were tested and it was reported that the antifungal effects (MIC values 25, and 15.5l µg/mL) of the hexane extract were especially high. In our study, the MIC value of S. molle against C. albicans was calculated as 128 µg/mL, except for the water extracts of raw and ripe fruits [41].
It was stated that 70% methanol extract of S. terebinthifolius bark showed various effects on different strains of Staphylococcus aureus, while it showed a strong antibacterial effect against Staphylococcus aureus 6538, no effect was found against Staphylococcus aureus 25925. The identical extract did not demonstrate efficacy against E. coli 10536 [42].
In a study on S. molle L., the MIC of volatile oils extracted from its leaves and fruits on S. aureus ATCC 29213 strain were found to be 125 and 500 µg/mL, sequentially. In the same research, the MIC of S. molle L. leaf and fruit essential oils on Escherichia coli LFG03 strain were determined to be 1000 and 1000 µg/mL, respectively [9].
In the literature, the number of studies investigating the antimicrobial activity of extracts and some other products of S. molle L. is limited, and the findings obtained in these studies are briefly mentioned. Considering the findings obtained in our study and these literature data, it seems that S. molle L. is a plant that should be focused on in pharmacy and medicine in terms of its antimicrobial activity.
Surprisingly, we discovered that the extracts had no antibiofilm activity when tested. It was observed that the plant, which is also used in traditional treatment due to its antimicrobial activity, did not have strong effects in our study. In the literature, it has been found that the aqueous alcohol extract of S. terebinthifolius has a remarkable anti-adhesion activity against the biofilms produced by Streptococcus mutans UA159 and Candida albicans ATCC10231 [43].
The antidiabetic impact was determined using
In the
The main function of pancreatic
| 1 mg/mL | 1 mg/mL | Glucose amount | Insulin amount | ||
| Inhbition % |
Inhbition % |
(mg/dL) | (mg/mL) | ||
| S.m L MeOH | 94.74 |
n.d | S.m L MeOH | 144 |
25.4 |
| S.m L water | 89.64 |
10.36 |
S.m L water | 147 |
24.9 |
| S.m Ripe F MeOH | 98.64 |
19.04 |
S.m Ripe F MeOH | 128 |
33.7 |
| S.m Ripe F water | 50.32 |
34.07 |
S.m Ripe F water | 133 |
26.2 |
| S.m Raw F MeOH | 99.11 |
n.d | S.m Raw F MeOH | 129 |
37.2 |
| S.m Raw F water | n.d | n.d | S.m Raw F water | 140 |
21.9 |
| Acarbose | 88.60 |
78.4 |
Control | 108 |
50 |
The values are exhibited as the
mean
We conducted the first-ever assessment of the impacts of leaf and fruit extracts
from the plant on diabetic
Extracts of leaves and raw and ripe fruits of S. molle prepared with water and 70% methanol were investigated in terms of antioxidant, antimicrobial, and antidiabetic activities. As a consequence, further research into the use of the plant’s fruit and leaves for pharmaceutical purposes and in the food industry may encourage the use of this plant, which can be grown in many countries, as a potential nutraceutical. However, additional research is necessary to fully understand the plant’s secondary metabolites and its pharmacological characteristics and biological actions. The results obtained from this study can be considered preliminary data necessary for the elaboration of the study. This intriguing strategy may compel scientists to thoroughly examine the possibilities of these natural products for the development of secure, environmentally responsible, and powerful medicines.
The data utilized and/or examined in the present study can be obtained from the corresponding author upon a reasonable request.
GŞK, EKA, and Sİ designed the research study. Sİ, DÇP, EKŞ, HÖU, and Uİ performed the research. EKA, ÇY and GŞK provided help and advice on analysis. GŞK, EKŞ, Uİ and ÇY analyzed the data. GŞK and Sİ wrote the manuscript. All authors read and approved the final manuscript. All authors have participated sufficiently in the work and agreed to be accountable for all aspects of the work. All authors contributed to editorial changes in the manuscript.
Schinus molle plant was used in this study. The plant was collected from Didim, Aydın Turkey by Gökçe Şeker Karatoprak (Erciyes University Faculty of Pharmacy, Kayseri, Turkey) and brought to our research laboratory.
Authors are thankful for Erciyes University for putting all the facilities under their disposal to the achieve the present work.
This research received no external funding.
The authors declare no conflict of interest. Esra Küpeli Akkol was one of the Guest editors of this journal. We declare that Esra Küpeli Akkol had no involvement in the peer review of this article and has no access to information regarding its peer review. Full responsibility for the editorial process for this article was delegated to Daniela Rigano.
Publisher’s Note: IMR Press stays neutral with regard to jurisdictional claims in published maps and institutional affiliations.