
- Academic Editor
†These authors contributed equally.
Background: Lung cancer is
the main cause of cancer-related death, with epithelial-mesenchymal transition
(EMT) playing an important role in the development of this disease. The
EMT-related genes Polypeptide N-Acetylgalactosaminyltransferase 3
(GALNT3) and 2
Lung cancer is the leading cause of cancer-related death and affects the lives and health of millions of people worldwide [1]. It consists mainly of non-small-cell lung cancer (NSCLC) and small-cell lung cancer (SCLC), of which NSCLC accounts for approximately 85% of cases [2, 3]. Lung adenocarcinoma (LUAD) is a histological subtype of NSCLC that accounts for about 50% of all new lung cancer cases [4, 5]. Despite continued progress with various treatment options including surgery, targeted therapy, immunotherapy, radiotherapy, and chemotherapy, the prognosis of LUAD remains poor and the five-year survival rate is only about 20% [6, 7, 8]. Therefore, it is particularly important to identify effective biomarkers for the early diagnosis and accurate prognosis of LUAD.
Epithelial-mesenchymal transition (EMT) refers to the loss of
epithelial characteristics and the acquisition of mesenchymal traits. The process
of EMT is driven by a variety of factors, including loss of E-cadherin,
transforming growth factor-
The establishment of various biological databases and information collection has allowed researchers to conduct multi-omics research on tumors. To further explore the role of EMT-related genes in LUAD, we identified 320 EMT-related differentially expressed genes (EMT-related DEGs) from the GEO and EMTome databases. Two EMT-related genes with significant survival signatures, GALNT3 and OAS1, were identified by Cox regression and Kaplan-Meier survival analysis. We subsequently analyzed immune cell infiltration, DNA methylation, gene mutation, miRNA regulation, prognostic significance, clinical relevance, and diagnostic value in relation to GALNT3 and OAS1 expression in LUAD. The mRNA expression of these potential biomarkers was also confirmed by RT-PCR.
RNA-seq data from 442 LUAD patients (including 442 primary tumor samples and 19 adjacent normal tissue samples) together with the associated clinical information was downloaded from the GSE68465 cohort (http://www.ncbi.nlm.nih.gov/geo/). EMT-related genes were downloaded from the EMTome database [21].
The expression of genes between tumor and normal lung tissue in the GSE68465
cohort was compared using the “limma” package in R. Those with a
Genes that were most strongly associated with prognosis were identified using the “survival” and “glement” packages in R. Univariate, multivariate, lasso Cox regression analysis and Kaplan-Meier survival analysis were performed to screen for prognostically significant EMT-associated genes. Correlation analysis of EMT-related DEGs was performed in GEPIA [23].
The genomic characteristics, including genomic and subcellular locations, of EMT-related DEGs with prognostic significance were first examined in GeneCards (https://www.genecards.org/) [24] and COMPARTMENTS (https://compartments.jensenlab.org/Search) [25]. Next, the differential expression of EMT-related DEGs with prognostic value was compared between tumor and normal lung tissue from the GSE68465 cohort using the “limma” package in R. Transcription levels for EMT-related DEGs with prognostic significance were then compared between pan-cancer and normal tissue in the TIMER database (https://cistrome.shinyapps.io/timer/) [26]. Protein expression levels of EMT-related DEGs with prognostic value in LUAD were also investigated in the Human Protein Atlas (HPA) database (http://www.proteinatlas.org). EMT-related genes were grouped according to high or low expression in the GSE68465 cohort, with the “clusterProfiler” package in R then used to perform functional enrichment analysis.
Univariate and multivariate Cox regression analyses were used to evaluate correlations between EMT-related DEG expression and various clinicopathological features in LUAD patients, including age, pathological T stage, TP53 mutation status, and pathological N stage. The prognostic significance of EMT-related DEG expression in clinicopathological subgroups of LUAD patients was also investigated in the UALCAN database [27].
The DNA methylation level and prognostic significance of EMT-related DEGs in LUAD were evaluated in the DNMIVD database [28]. Online databases were used to predict the regulatory relationship between target genes and miRNAs. The TargetScan database (https://www.targetscan.org/vert_80/) [29], miRDB database (http://www.miRDB.org) [30], and miRTarBase database (https://mirtarbase.cuhk.edu.cn/) [31]were used to predict potential miRNAs upstream of EMT-related DEGs. The predicted miRNAs from the three databases were then intersected to identify miRNAs that could regulate the expression of EMT-related DEGs. Finally, the relationship between EMT-related DEGs and the miRNA expression level was further evaluated using the starBase database [32].
The TIMER database was used to correlate the expression of EMT-related DEGs with tumor-infiltrating immune cells including CD4+ T cells, CD8+ T cells, macrophages, dendritic cells, B cells, and neutrophils. Immune cell markers were obtained from the website of R&D Systems (www.rndsystems.com/cn/resources/cell-markers/immune-cells) and analyzed in TIMER and GEPIA. The associations between EMT-associated DEGs and immune cell subtypes, tumor infiltrates (TILs), immune stimulants, immunosuppressants, and major histocompatibility class (MHC) molecules in LUAD were examined in the TISIDB database (cis.hku.hk/TISIDB) [33]. Kaplan–Meier analysis was used to investigate the prognostic significance of immune cell infiltration (https://kmplot.com/analysis/) [34].
The cBioPortal database (http://cbioportal.org) was used to examine the DNA mutation status of EMT-related DEGs in 586 LUAD samples from the TCGA database [35]. We explored mutation sites in EMT-related DEGs and assessed gene mutation co-occurrence patterns between EMT-related DEG signatures and other proteins in LUAD. The top 10 altered genes that co-occurred with mutated genes were selected according to the percentage of alteration. In addition, the mRNA expression level of EMT-related DEGs was confirmed in TCGA-LUAD samples from the UALCAN database.
The OmicStudio tool (https://www.omicstudio.cn/tool) was employed to construct ROC curves in order to assess the diagnostic value of EMT-related genes. A single gene or a combination of EMT-related genes was used to assess diagnostic value.
Human LUAD (H1975) and bronchial epithelial (BEAS-2B) cell lines were purchased
from the Cell Bank of the Chinese Academy of Sciences (Shanghai, China). These cells had been performed by STR analysis and their DNA profiles were consistent with the recorded. Additionally, mycoplasma testing was conducted on the cell lines, and the result is negative. BEAS-2B
cells were grown in DMEM (Bio-Channel, Nanjing, Jiangsu, China), while H1975 cells were
grown in ERPMI-1640 medium (Bio-Channel, Nanjing, Jiangsu, China). All cells were
supplemented with penicillin (100 U/mL), streptomycin (100 U/mL) and 10%
heat-inactivated fetal bovine serum (Transgen, Beijing, China) and cultured in a humidified
environment at 37 °C with 5% CO
Adherent cells were used in the logarithmic growth phase,
which corresponded to a cell density of approximately 80%. TRIzol reagent
(Invitrogen, CA, USA) was used to extract total RNA from the cells and transcription
reagent (Transgen, Beijing, China) was then used to transcribe the RNA into cDNA. RT-PCR was
performed in the 7500 Real-Time PCR System (BIO-RAD) using SYBR qPCR mix
(Transgen, Beijing, China) and GAPDH as the endogenous reference [36]. The primer sequences used
were: GAPDH, 5
R 4.1.1 (R studio Version 1.4.1717) and GraphPad Prism 8.0 (San Diego,
California USA, www.graphpad.com) were used for statistical analysis.
The Wilcoxon test was used to screen for genes that were differentially
expressed. Prognostic factors were assessed using univariate, Lasso, and
multivariate Cox regression analysis. The Kaplan–Meier method was used to
evaluate the correlation between gene expression level and overall survival rate.
The student’s t-test was used to analyze the RT-PCR results. The 95%
confidence interval (CI) and hazard ratio (HR) was used to calculate overall
survival. p
The flow chart for this study is shown in Fig. 1A. Microarray-derived expression
database for the GSE68465 LUAD cohort was screened by “limma” in R (adjusted
p-value
 Fig. 1.
Flowchart for identifying EMT-related genes in LUAD using the GES68465 cohort and the EMTome database. (A) Flowchart used for data collection and the methods used in this study. (B) Volcano plots of DEGs in LUAD from the GSE68465 cohort. (C) Venn diagram of EMT-related genes in LUAD from the GSE68465 cohort and EMTome database. GEO, Gene Expression Omnibus; DEGs, differentially expressed genes; EMT, epithelial-mesenchymal transition; KEGG, Kyoto Encyclopedia of Genes and Genomes; TCGA, The Cancer Genome Atlas; LUAD, lung adenocarcinoma.
The “survival” package in R was used to perform univariate Cox regression
analysis on 320 EMT-related DEGs. This identified 76 EMT-related genes with
significant prognostic value. Lasso Cox analysis using the “glement” package in R
identified 24 genes (Fig. 2A,B). Multivariate Cox analysis was used for further
gene screening. A forest plot of hazard ratio (HR) (Fig. 2C) revealed that 5
genes had adverse prognostic significance (GALNT3, MUC5AC,
OAS1, TMPRSS11E, VSIG4). The “survival” package in R
was then used to screen for the strongest prognostic gene signatures.
Kaplan–Meier analysis showed that GALNT3 and OAS1 were associated with
significantly worse prognosis of LUAD patients in the GSE68465 cohort (Fig. 2D–H). Correlation analysis using the GEPIA database also
revealed that GALNT3 and OAS1 expressions were closely
correlated (r = 0.46, p-value = 1.3
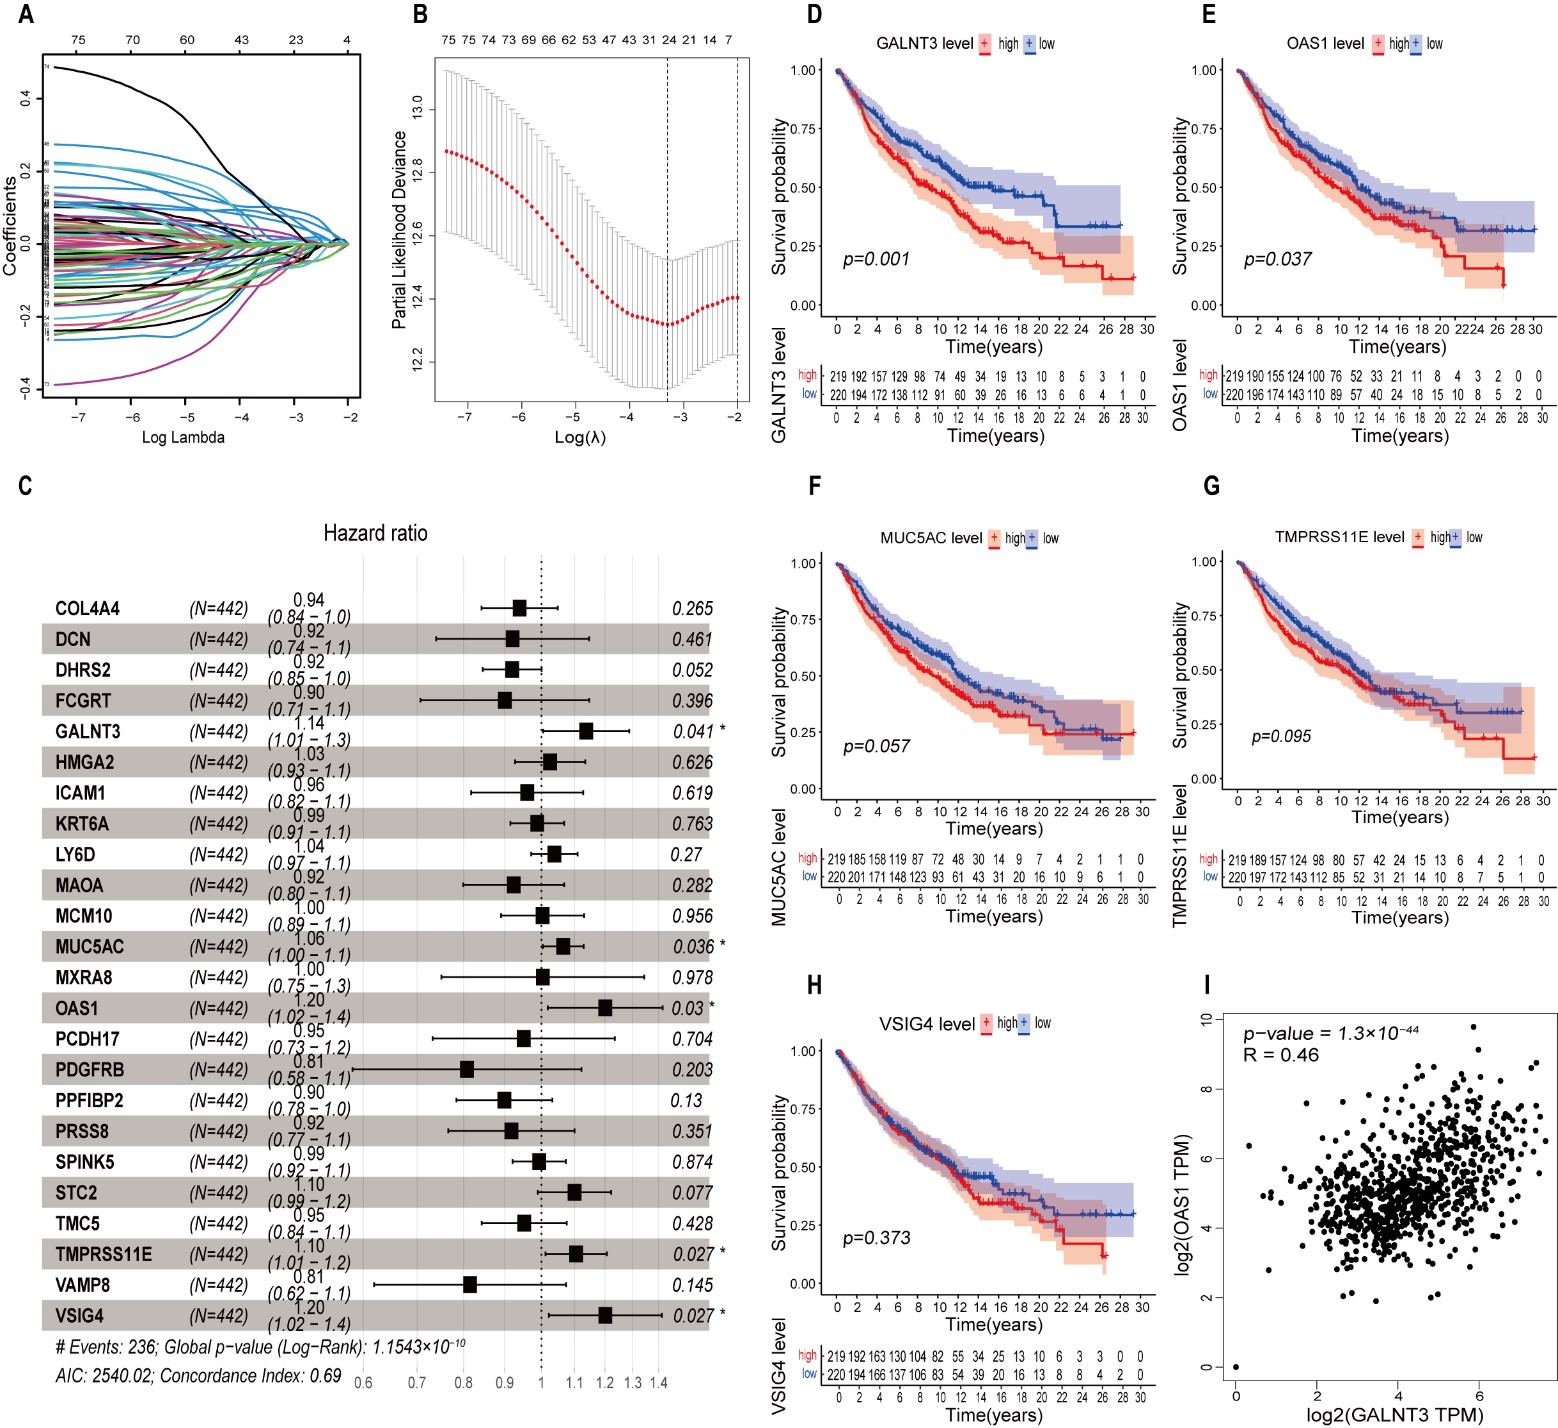 Fig. 2.
Cox regression and Kaplan-Meier analysis were used to identify EMT-related genes with prognostic significance in LUAD. (A) The coefficient profiles of lasso regression analysis. (B) Minimal criteria were used to choose variables in lasso regression. (C) Forest plot showing the results of multivariate Cox regression analysis. (D–H) Kaplan–Meier survival analysis of GSE68465 patients according to the expression of GALNT3, OAS1, MUC5AC, TMPRSS11E, and VSIG4. (I) Correlation of GALNT3 and OAS1 expression in LUAD.
The genomic location of GALNT3 (via GeneCards) was q24.3 on chromosome 2 (Fig. 3A), while its subcellular location (via COMPARTMENTS) was mainly in the Golgi apparatus and extracellular space (Fig. 3C). The genomic location of OAS1 was q24.13 on chromosome 12 (Fig. 3B), while its subcellular location was centrally in the nucleus and cytosol (Fig. 3D). GALNT3 and OAS1 mRNA were overexpressed in LUAD tumor tissue from the GSE68465 cohort compared to normal tissue (Fig. 3E,H). GALNT3 and OAS1 protein expression were also higher in LUAD tumor tissue from the HPA database compared to normal lung tissue (Fig. 3F,I). The differential expression of GALNT3 and OAS1 between tumor and normal tissue in all TCGA tumors was investigated using the TIMER database (Fig. 3G,J). This analysis indicated that GALNT3 and OAS1 were overexpressed in most tumors. As shown in Supplementary Fig. 2, Gene Ontology (GO) annotations revealed that GALNT3 was mainly enriched in skin development (Supplementary Fig. 2A), while Kyoto Encyclopedia of Genes and Genomes (KEGG) pathway analysis showed that PI3K/Akt signaling was the most enriched pathway (Supplementary Fig. 2B). OAS1 was mainly enriched in response to the virus (Supplementary Fig. 2C), with Hepatitis C being the most enriched pathway according to KEGG pathway analysis (Supplementary Fig. 2D).
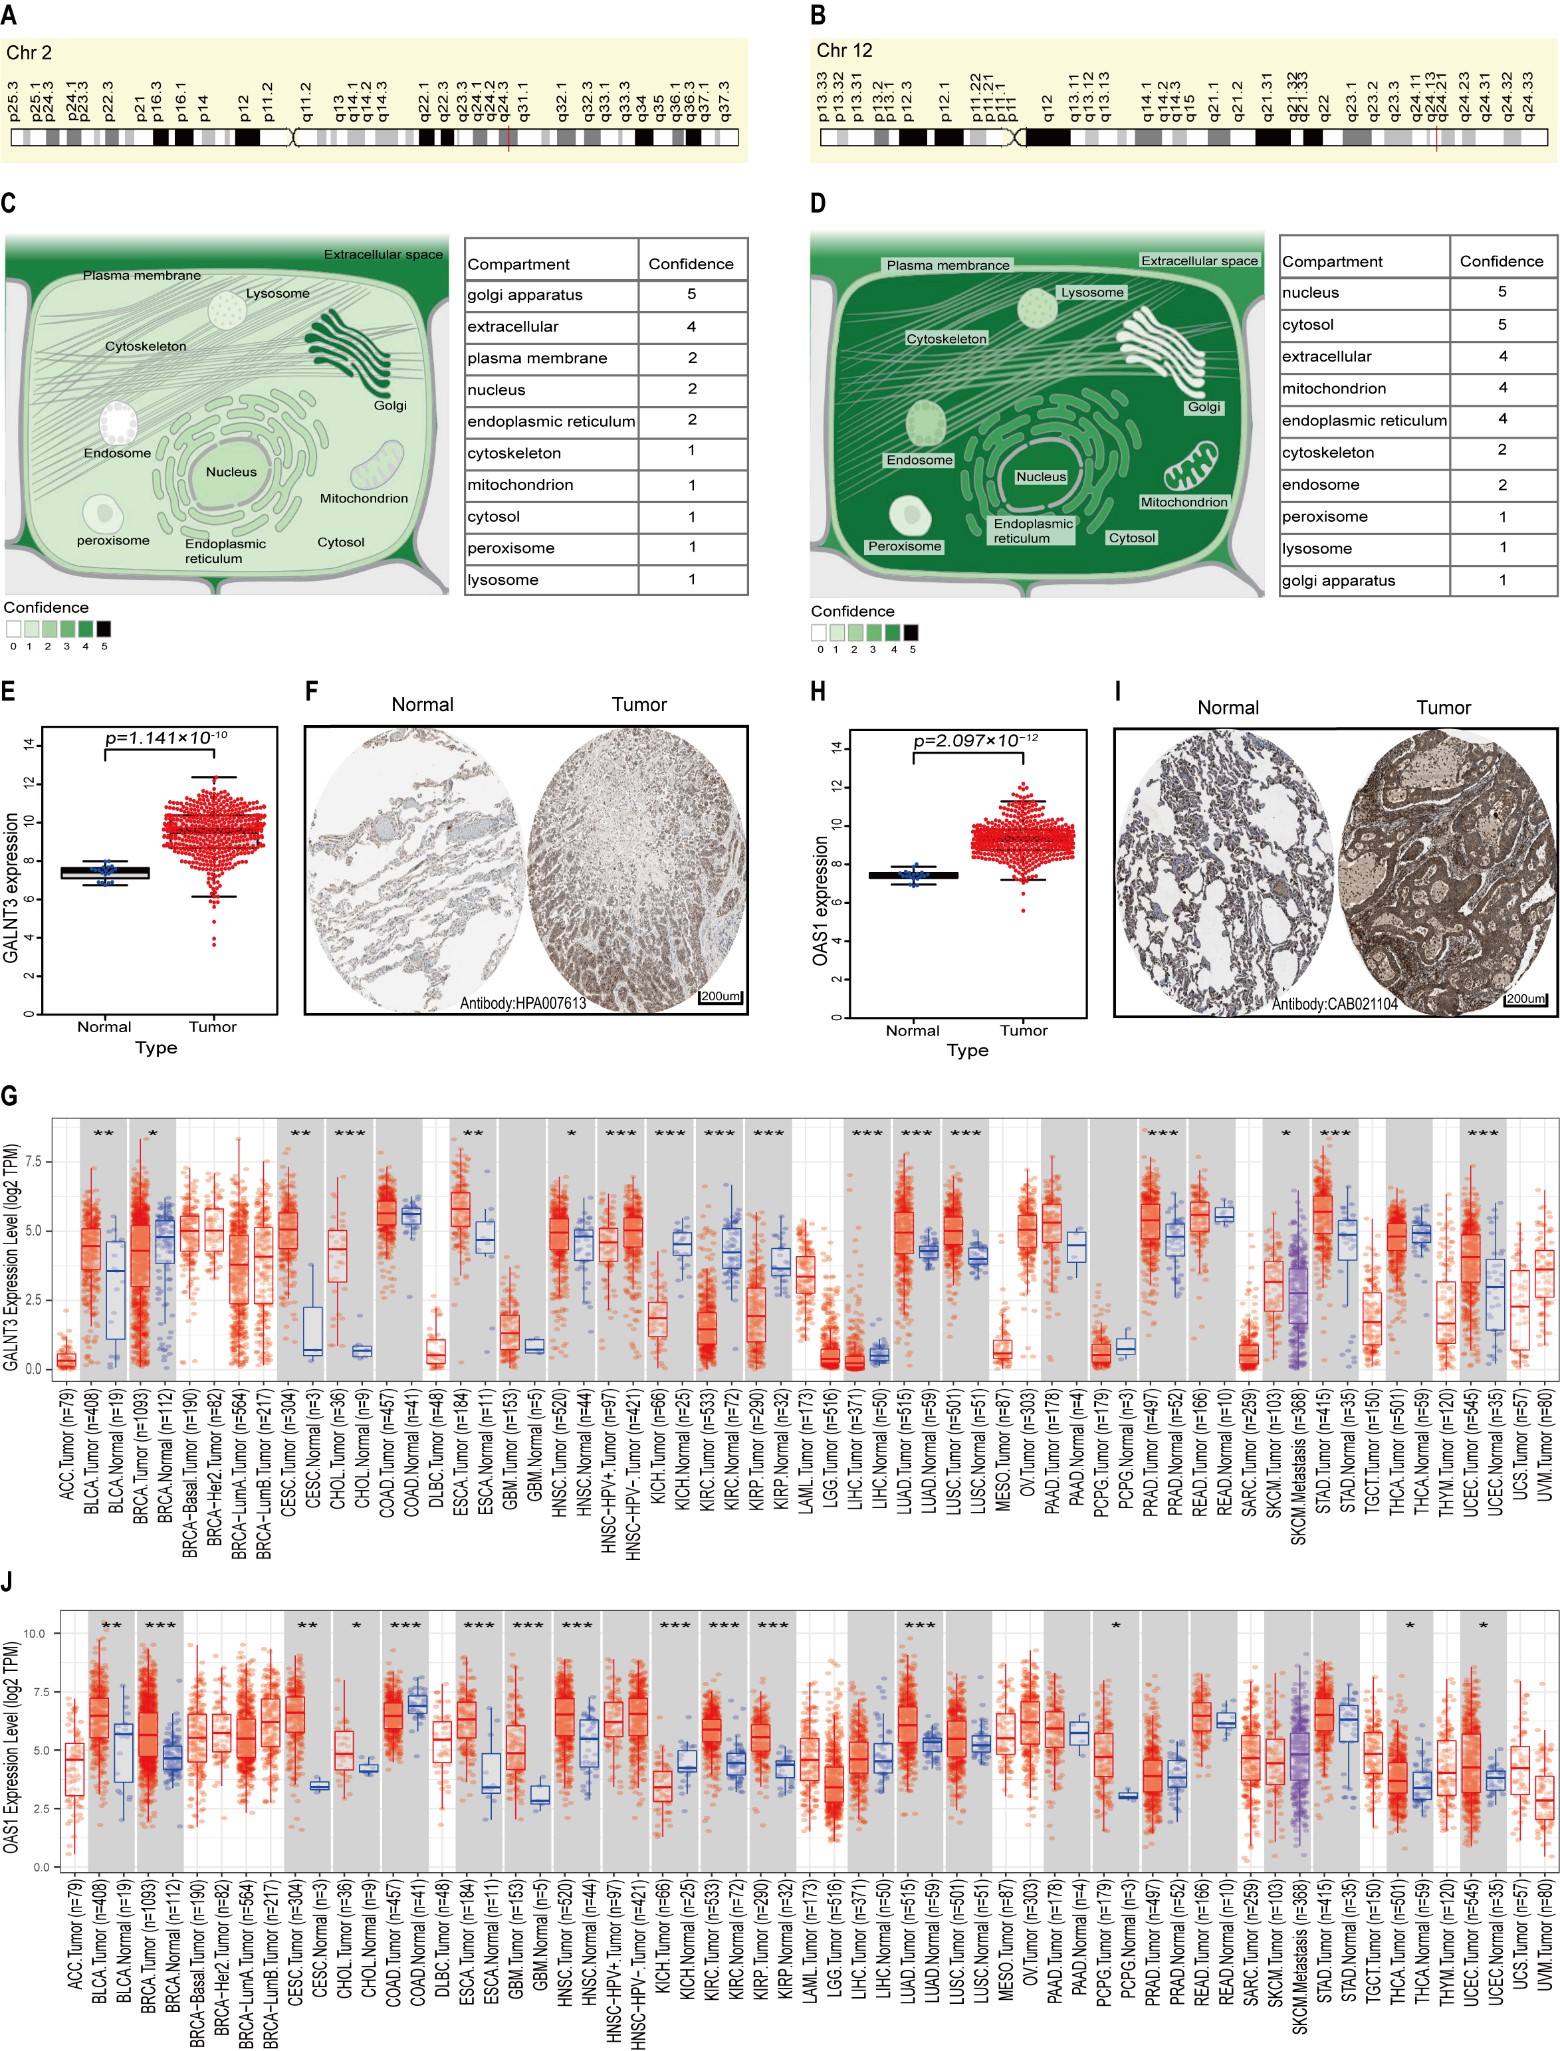 Fig. 3.
Genomic characteristics and differential expression of
GALNT3 and OAS1 in LUAD. (A,B) Genomic locations of
GALNT3 and OAS1 as viewed by GeneCards. (C,D) Subcellular
locations of GALNT3 and OAS1 as viewed by COMPARTMENTS. (E) The
mRNA expression level of GALNT3 in the GSE68465 cohort. (F)
Immunohistochemical staining for GALNT3 in normal lung tissue and LUAD
tissue from the HPA database. (G) Differential expression of GALNT3
between all tumors and adjacent normal tissue in TCGA via the TIMER database. (H)
The mRNA expression level of OAS1 in the GSE68465 cohort. (I)
Immunohistochemical staining for OAS1 in normal lung tissue and in LUAD
tissue from the HPA database. (J) Differential expression of OAS1
between all tumors and adjacent normal tissue in TCGA via the TIMER database
(*p
Univariate and multivariate Cox regression analyses were used to study the
relationships between GALNT3 and OAS1 mRNA expression and the
prognosis and clinical characteristics of LUAD. Univariate Cox analysis showed
that GALNT3 (HR = 1.230; 95% confidence interval (CI) = 1.097–1.378;
p
 Fig. 4.
Prognostic significance of GALNT3 and OAS1
expression and associations with clinicopathological features in LUAD. (A)
Univariate and (B) multivariate Cox analyses showing independent prognostic
significance for GALNT3 expression in LUAD from the GSE68465 cohort. (C)
Univariate and (D) multivariate Cox analyses showing the prognostic significance
of OAS1 expression in LUAD from the GSE68465 cohort. (E–G) Correlation
of GALNT3 expression in LUAD with individual cancer stages,
TP53 mutation status and nodal metastasis status. (H–J) Correlation of
OAS1 expression in LUAD with individual cancer stages, TP53
mutation status, and nodal metastasis statuses. (K,L) Kaplan-Meier analysis
showing the prognostic significance of GALNT3 and OAS1
expression for the survival of LUAD patients (ns, not statistically significant,
*p
We further explored the prognostic significance of GALNT3 and OAS1 expression levels in the UALCAN database, as well as their correlation with clinical features. The mRNA expression levels for both genes correlated closely with stage, TP53 mutation status and pathological N stage (Fig. 4E–J). Although the association with the pathological N3 stage was not statistically significant, this may have been due to the small number of samples. Patients with high expression of GALNT3 and OAS1 showed poor survival (Fig. 4K,L). Together, the above results indicate that high expression levels of GALNT3 and OAS1 may be associated with poor prognosis of LUAD patients.
DNA methylation status is strongly related to gene dysregulation in cancer
cells. We explored the methylation status of promoter regions in GALNT3
and OAS1 in LUAD samples from the DNMIVD database. As shown in Fig. 5A,B, both the GALNT3 (p-value = 1.95
 Fig. 5.
DNA methylation status and miRNA regulation of GALNT3 and OAS1 in LUAD. (A,B) Boxplots showing the methylation status of the GALNT3 and OAS1 promoter regions in LUAD and in normal lung tissue. (C,D) Kaplan–Meier survival curves for LUAD patients according to the DNA methylation status of GALNT3 and OAS1. (E) Potential miRNAs that target GALNT3 mRNA were identified from the intersection of TargetScan, miRDB, and miRarBase databases. The correlation between GALNT3 expression and hsa-miR-122-5p expression in LUAD was analyzed in the StarBase database. (F) Potential miRNAs that target OAS1 mRNA were identified from the intersection of TargetScan, miRDB, and miRarBase databases.
Previous studies have shown that EMT-related genes play a critical role in tumor
immunity. Here, we analyzed the correlation of GALNT3 and OAS1
expression with immune cell infiltration in LUAD. High GALNT3 expression
was associated with high levels of many immune cell populations, including B
cells (partial.cor = –0.129, p = 4.40
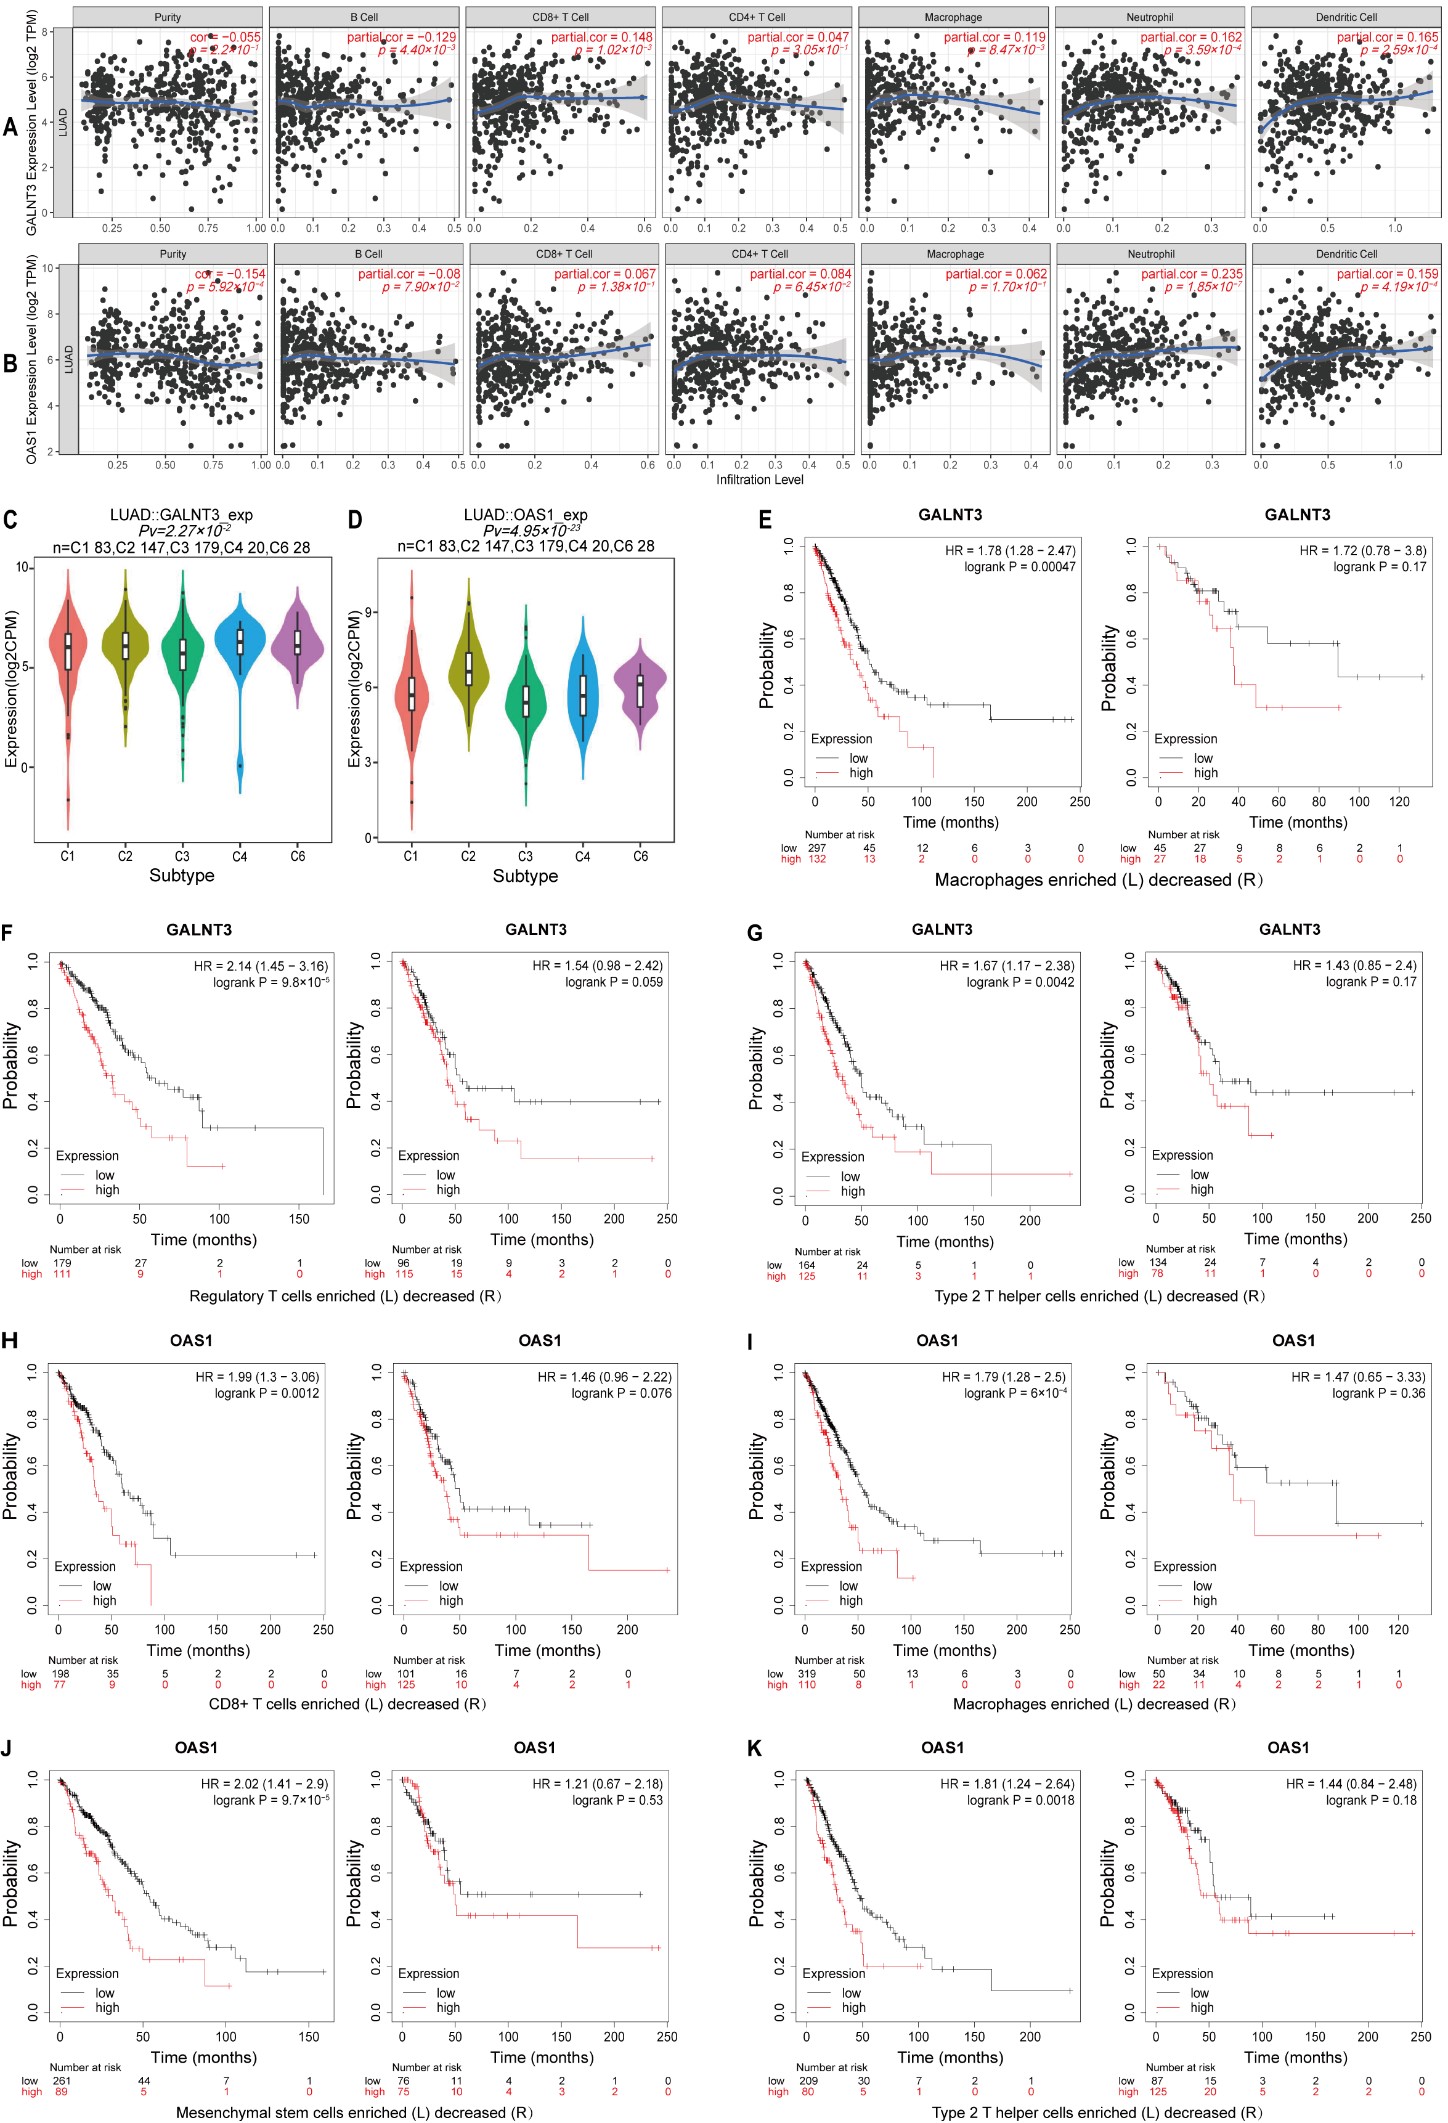 Fig. 6.
Correlation analysis of GALNT3 and OAS1 expression in LUAD with infiltrating immune cells. (A,B) Correlation of GALNT3 and OAS1 expression with that of various immune cell markers. (C,D) Correlations between GALNT3 and OAS1 expression and immune subtypes in LUAD. (E–G) Kaplan–Meier survival analysis for LUAD patients with high or low GALNT3 expression and according to the level of infiltration with different immune cell populations. (H–K) Kaplan–Meier survival analysis for LUAD patients with high or low OAS1 expression and according to the level of infiltration with different immune cell populations. HR, hazard ratio.
We further analyzed the correlations between GALNT3 and OAS1 expression in LUAD with immune cell infiltration using the TISIDB database. Samples were divided into TGF-b dominant, immunologically quiet, inflammatory, IFN-gamma dominant, and wound healing groups. GALNT3 expression was highest in the lymphocyte-depleted group and lowest in the inflammatory cell group (Fig. 6C), while OAS1 expression was highest in the IFN-gamma-dominant cell group and weakest in the inflammatory cell group (Fig. 6D). The relationships between GALNT3 and OAS1 expression in LUAD with TILs, MHC molecules, immune inhibitors, and immune stimulators are shown in Supplementary Fig. 3.
To confirm the associations between GALNT3 and OAS1 expression in LUAD with immune infiltrating cells, further analysis was conducted using the TIMER and GEPIA databases (Supplementary Tables 1,2). The results confirmed that GALNT3 and OAS1 expression levels were closely associated with those of Th2 cell immune marker genes, including STAT6, CCR8, and. Numerous factors could modulate the prognostic significance of GALNT3 and OAS1 expression in LUAD. We hypothesized that immune cell infiltration could affect their prognostic impact in LUAD. Therefore, we further analyzed the prognostic significance of GALNT3 and OAS1 in the Kaplan–Meier plotter database according to the presence of immune cell infiltration. This showed that high GALNT3 expression was most strongly associated with poor prognosis in LUAD cases that had high levels of macrophage, regulatory T cell and type 2 T helper cell infiltration (Fig. 6E–G). Similarly, high OAS1 expression was associated with poor prognosis in cases that showed strong infiltration with CD8+ T cells, macrophages, mesenchymal stem cells, and type 2 T helper cells (Fig. 6H–K). These results suggest that LUAD with high GALNT3 and OAS1 expression may potentially respond to immunotherapy through the regulation of immune cell infiltration.
We next examined the frequencies and types of genetic alterations in GALNT3 and OAS1 in TCGA-LUAD using the cBioPortal database. The genetic alterations found in GALNT3 were amplification and mutations. Somatic mutations in GALNT3 were found in 2.6% of cases, with the mutation sites located within amino acids 0 and 633 and in the Glycos-transf-2 and Ricin-B-lectin domains. Four missense mutations were reported, with one being the hotspot mutation E545K (Fig. 7A,C). Gene alterations in OAS1 consisted of amplification, mutations and deletions. Somatic mutations were found in 3% of cases, with mutation sites in the 0 to 400 amino acid NTP-transf-2 and OAS1-C domains. Three missense mutations were reported, with one being the hotspot mutation T251K (Fig. 7B,C). Genetic alterations in GALNT3 and OAS1 correlated with the frequency and pattern of genetic alterations in several other genes (Fig. 7D,E). The top 10 co-occurring genes with GALNT3 alteration were TTN (47% co-alteration frequency), MYO3B (6%), XIRP2 (21%), ADAMTS12 (23%), ZFHX4 (30%), LRP1B (32%), USH2A (35%), MUC16 (40%), TP53 (46%), and ERCC5 (4%) (Fig. 7F). The top 10 co-occurring genes with OAS1 alteration were CIT (6%), TMEM116 (2.6%), CCDC63 (4%), RPH3A (5%), TBX3 (5%), KSR2 (5%), MED13 L (7%), TBX5 (7%), RBM19 (9%), and LRRIQ1 (10%) (Fig. 7G).
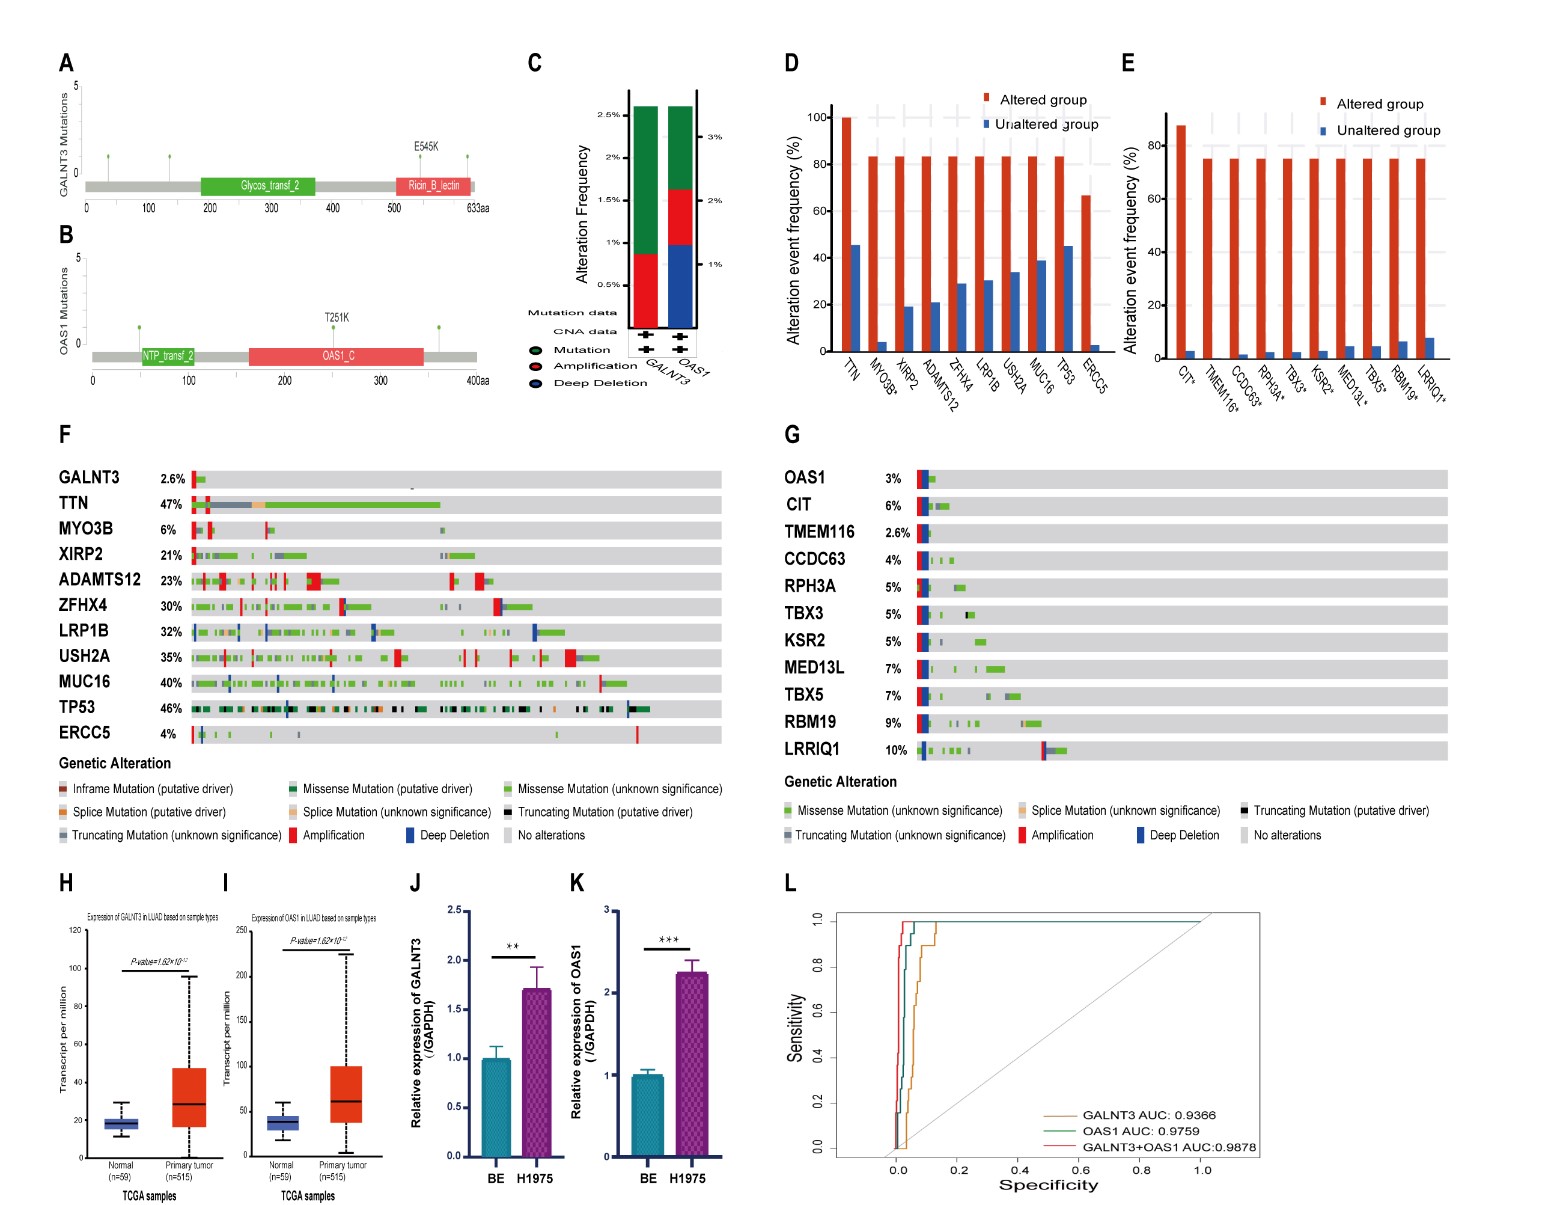 Fig. 7.
DNA mutation, confirmation of mRNA expression, and diagnostic
value of GALNT3 and OAS1 in LUAD. (A,B) Location of mutations
in GALNT3 and OAS1 in LUAD. (C) GALNT3 and
OAS1 genetic alteration types in LUAD. (D,E) Bar plots showing the top 10 gene
alterations in LUAD with the highest frequency of co-occurrence with
GALNT3 and OAS1 alterations. (F,G) Waterfall plots showing the
co-occurrence pattern of GALNT3 and OAS1 gene mutations with
the most frequent genetic changes in LUAD. (H,I) mRNA expression levels of
GALNT3 and OAS1 in LUAD from the TCGA database. (J,K) mRNA
expression levels of GALNT3 and OAS1 in LUAD cells (H1975) were
higher than those in normal bronchial epithelial cells (BEAS-2B). (L) Receiver operating characteristic (ROC) curve
analysis showing the diagnostic value of GALNT3 and OAS1
expression in LUAD, both individually and in combination (**p
GALNT3 and OAS1 mRNA expression was confirmed in LUAD and normal tissue from the TCGA database. They were again found to be significantly elevated in primary LUAD tissue compared with corresponding adjacent normal tissue (Fig. 7H,I). In addition, RT-PCR was used to examine GALNT3 and OAS1 mRNA expression levels in the normal cell line BEAS-2B and in the LUAD cell line H1975. This confirmed the overexpression of both genes in LUAD cells (Fig. 7J,K). The overexpression of GALNT3 and OAS1 in LUAD was further validated in the GEO and TCGA databases (Figs. 3E,H,7H,I).
ROC curve analysis showed AUC values of 0.9366 and 0.9759 for GALNT3 and OAS1 expression, respectively (Fig. 7L), thus highlighting their diagnostic value for LUAD. Logistic regression analysis for the combination of GALNT3 and OAS1 expression revealed an AUC of 0.9878 (Fig. 7L), indicating a very high diagnostic value for this biomarker combination in LUAD.
LUAD is the most common type of lung cancer and shows multi-step development [37]. Despite continuous improvements in treatment, the prognosis of LUAD has not changed significantly [38]. The main reasons for the poor prognosis are inadequate early diagnosis and a lack of effective treatment targets. Since EMT is thought to be an essential process in the development of LUAD, EMT-related genes are likely to be an excellent candidate group for the discovery of novel biomarkers.
GALNT3, a member of the GalNAc transferase
(GALNAC-Ts) gene family, is an EMT-related gene that is differentially
expressed in various tumor types and has been implicated in cancer development
[39, 40, 41]. This gene is highly expressed in ovarian and colon cancer [42, 43, 44, 45].
GALNT3 was more highly expressed in non-squamous cell carcinoma than in
squamous cell carcinoma [46], which is consistent with the high expression of
GALNT3 in adenocarcinoma cell lines [47]. OAS1 is a member of
the 2
EMT is one of the main mechanisms for the invasion and metastasis of cancer cells. It is an important biomarker for tumor prognosis and also one of the factors that affect response to treatment [52]. Previous research showed that overexpression of GALNT3 was an independent prognostic factor for poor outcomes in patients with peripheral LUAD less than two centimeters in diameter [53]. GALNT3 was also reported to be highly expressed in well-differentiated LUAD and associated with the degree of tumor differentiation, as well as being an independent factor of poor prognosis and early recurrence [54]. High OAS1 expression in breast cancer and pancreatic cancer has been associated with a worse prognosis [49, 55]. In the current study, high GALNT3 and OAS1 expression in LUAD was also associated with a worse prognosis, consistent with previous results in other cancer types. In addition, the expression of “response to drug and drug metabolism-other enzymes” genes was enriched in LUAD with high GALNT3 and OAS1 expression. These pathways are closely connected with resistance to anti-tumor drugs [56, 57]. LUAD has a high frequency of EGFR mutations, while EGFR-TKI resistance remains a serious clinical problem [58]. Previous studies reported that T790M mutations and MET amplification were not present in tumor cells from EGFR-TKIs-resistant patients. Instead, these cells exhibit EMT features, with abnormal EMT-related molecular indicators and enhanced ability for migration and invasion [59, 60]. Some researchers have also suggested that EMT may be a marker of resistance to EGFR-TKI [61, 62]. EMT may therefore be a mechanism for acquiring resistance to EGFR-TKIs in lung cancer. The potential role of the EMT-related genes GALNT3 and OAS1 in EGFR-TKI resistance will thus be an interesting topic for future research. This may have practical value in the clinic, as well as provide a theoretical basis for overcoming EGFR-TKI resistance.
DNA methylation is the most widely studied epigenetic marker in cancer [63, 64, 65]. Deregulation of the normal methylation status of gene promoters can lead to aberrant gene expression [66, 67]. In previous research, aberrant expression of GALNT3 has been related to changes in DNA methylation [68]. In the present study, decreased methylation in the GALNT3 promoter region was found to be associated with poor prognosis of LUAD patients. Promoter methylation of OAS1 was inversely correlated with expression levels in LUAD, but not with poor prognosis. Genomic instability is also an important cause of tumorigenesis [69]. GALNT3 gene amplification and mutations are found in LUAD and co-occur with mutations in essential genes such as TTN, MYO3B, XIRP2, ADAMTS12 and ZFHX4. OAS1 gene amplification, mutation and deletion were also observed, and these alterations co-occurred with mutations in CIT, TMEM116, CCDC63, RPH3A and TBX3. Therefore, alterations in the GALNT3 and OAS1genes may affect the development and prognosis of LUAD. Upstream miRNAs can also affect the stability of target genes and negatively regulate the expression of downstream genes [70, 71]. There is evidence that GALNT3 and OAS1 may be regulated by miRNA [72, 73, 74]. We identified 27 potential upstream miRNAs that target GALNT3, and two that target OAS1. Co-expression of hsa-miR-122-5p and GALNT3 was observed, suggesting this upstream miRNA may regulate the expression of GALNT3. No co-expression was found between any miRNA and OAS1 in the current research, although in future studies the miRNA search database should be expanded.
Infiltrating immune cells are a key part of the tumor microenvironment and have major effects on cancer development and prognosis [75, 76]. GALNT3 and OAS1 expression are known to be closely associated with immune cell infiltration in various tumors [77, 78, 79]. In the present study, we confirmed that GALNT3 and OAS1 expression were associated with immune cells, immune cell markers, TILs, MHC molecules and immune modulators. High GALNT3 expression was associated with poor prognosis in LUAD subgroups that were enriched with macrophages, regulatory T cells, and type 2 T helper cells. High OAS1 expression was also associated with poor prognosis in LUAD that was enriched with CD8+ T cells, macrophages, mesenchymal stem cells, and type 2 T helper cells. These results suggest that GALNT3 and OAS1 expression may be associated with poor prognosis in LUAD because of their link to immune cell infiltration, however the specific mechanism requires further investigation.
There are several limitations to this study. First, the study samples were derived from public databases. Although strict screening criteria and repeated correction were applied, the quantity and quality of the tissue samples were limited. In-house follow-up data and increased sample size are needed to improve the quality of data in future studies. Second, this study only included LUAD samples, so the pathological type was restricted. Finally, this study explored the pathogenesis of GALNT3 and OAS1 using multiple omics only, and additional experimental studies are required to confirm the findings.
In summary, the EMT-related genes GALNT3 and OAS1 were highly expressed in LUAD and positively correlated. Their overexpression may be linked to gene mutation and methylation, and regulate the miRNA-GALNT3/OAS1 network, which could in turn affect tumor infiltration with immune cells. The diagnostic value of GALNT3 and OAS1 expression combined was very high, and greater than that of the single markers. GALNT3 and OAS1 expression may therefore have clinical value for improving the accuracy of diagnosis and possibly also for improving the efficacy of treatment for LUAD.
The EMT-related genes GALNT3 and OAS1 are highly expressed in LUAD and are associated with significantly worse prognosis. The diagnostic value of the combined GALNT3 and OAS1 markers was greater than that of the individual genes. GALNT3 and OAS1 expressions in LUAD are likely to be affected by DNA mutations, upstream miRNA, and DNA methylation levels. These factors may affect the survival of LUAD patients by regulating immune cell infiltration into the tumor. Various aspects of GALNT3 and OAS1 expression were analyzed in this study, and these genes may be new molecular markers for the diagnosis and prognosis of LUAD. However, further studies are needed to confirm these findings.
EMT, Epithelial-mesenchymal transition; NSCLC, Non-small-cell lung cancer; SCLC,
Small cell lung cancer; LUAD, Lung adenocarcinoma; DEGs, Differentially expressed
genes; GALNT3, Polypeptide N-Acetylgalactosaminyltransferase 3;
OAS1, 2
The original contributions presented in the study are included in the article/Supplementary Material. Further inquiries can be directed to the corresponding authors.
Conceptualization, DL, LY, XF and QW; Data curation, DL, MF, MC, WW; Formal analysis, DL, LS, JY, XG; Funding acquisition, XF; Investigation, XG; Methodology, DL, JW, LY; Project administration, QW; Resources, WW; Software, DL, MF, MC, JY; Supervision, XF; Validation, DL, MF and YL; Visualization, DL; Writing—original draft, DL, JW; Writing—review and editing, LS, LY and QW. All authors contributed to editorial changes in the manuscript. All authors read and approved the final manuscript. All authors have participated sufficiently in the work to take public responsibility for appropriate portions of the content and agreed to be accountable for all aspects of the work in ensuring that questions related to its accuracy or integrity.
Not applicable.
All the experiments were conducted at Laboratory Animal Center of Southwest Medical University and Model Animal and Human Disease Research of Luzhou Key Laboratory.
This study was funded by the Southwest Medical University School-level Scientific Research Project (No. 2021ZKQN095), the Science and Technology Development Fund, Macau SAR (File No.: 0098/2021/A2, 130/2017/A3, and 0099/2018/A3), the Science and Technology Planning Project of Guangdong Province (No. 2020B1212030008), the Natural Science Foundation of Sichuan Province (No.2022NSFSC0046), and Sichuan Science and Technology Program (No.2022YFS0631).
The authors declare no conflict of interest.
Publisher’s Note: IMR Press stays neutral with regard to jurisdictional claims in published maps and institutional affiliations.