


1 Department of Biomedical Engineering, Wenzhou Medical University, 325035 Wenzhou, Zhejiang, China
2 Department of Research and Development, Hooke Instruments, 130033 Changchun, Jilin, China
3 Key Laboratory of Optical System Advanced Manufacturing Technology, Changchun Institute of Optics, Fine Mechanics and Physics, Chinese Academy of Sciences, 130033 Changchun, Jilin, China
†These authors contributed equally.
Abstract
Background: Due to antibiotic abuse, the problem of bacterial
resistance is becoming increasingly serious, and rapid detection of bacterial
resistance has become an urgent issue. Because under the action of antibiotics,
different active bacteria have different metabolism of heavy water, antibiotic
resistance of bacteria can be identified according to the existence of a C-D peak
in the 2030–2400 cm
Graphical Abstract
Keywords
- image stitching
- Raman spectrum
- image recognition
- antibiotic resistance
- multiple fields of view
- heavy water labeling
The first discovery of antibiotics was in 1982, which was an outstanding milestone in the history of antibiotic development. However, the overuse of antibiotics has produced bacteria resistant to multiple antibiotics [1, 2]. The emergence of antibiotic resistance in bacteria has caused a great deal of public health concern [3]. An analysis of the global burden of antimicrobial resistance found that in 2019, resistant bacteria were responsible for 4.95 million deaths, of which 1.25 million were directly due to resistance [4]. Human health is at great risk due to the massive spread of antibiotic resistance [5, 6]. Therefore, it is necessary to obtain an ultrasensitive and rapid way to detect bacterial antibiotic resistance [7, 8, 9], which is of great significance for protecting human health.
In 1928, Indian scientist C.V. Raman discovered the Raman scattering effect.
Since the molecular vibrations of different substances are different, the Raman
spectrometer can absorb Raman scattered light to form a spectrum, thereby
providing the “fingerprint” of the substance, that is, analyzing the biological
information of the substance through the Raman spectroscopy system [10]. In
contrast to traditional single-cell analysis methods, Raman spectroscopy has the
characteristics of using less sample, rapid analysis, and no injury to cells [11, 12]. Using single-cell Raman spectroscopy to detect the vibrational modes of
biomolecules in cells can reflect biochemical characteristics or phenotypes at
the single-cell level. Cells exhibit characteristic Raman spectral shifts due to
the replacement of isotope atoms with molecules of matter [6]. Detection of
single-cell activity is key to the study of cellular antibiotic resistance. Raman
spectroscopy now has proven applications in the fields such as microbial
classification and analysis of cellular drug resistance [13, 14]. In recent years,
the heavy water (D
To avoid contingency, the more bacterial Raman spectra analyzed when measuring antibiotic-resistant bacteria, the more accurate and reliable the experimental conclusions. The method researched in this paper focuses on single-cell Raman spectra. However, after a certain dilution, there are still exist impurities and cluster phenomena in microbial samples. Since the traditional Raman acquisition method scans through small fields of view one by one and there are impurities, cluster phenomena, and too few single cells in a single small field of view, it is necessary to manually screen the single cell in a single field of view and it is not feasible to automate the acquisition of a large number of bacterial Raman spectra. Bacteria at the edge of the small field of view by the camera are often segmented by the field of view. Resulting in the same bacterium being scanned up to four times, or even removed as impurities because the segmented area is too small, which can lead to loss of bacteria or repeated measurement of a certain bacterium. When each field of view is collected, the position of the bacteria cannot be automatically positioned, and only by manual selection. The traditional method [19] can only scan a single field of view to identify bacteria, and it is necessary to manually select the bacteria to be tested. If there are too many fields of view, it will increase the volume of the experiment, the operation is cumbersome, and the efficiency will be reduced. In addition, the existing Raman spectrum preprocessing methods mainly include two functions: filtering and baseline correction. Since each parameter in the algorithm has different effects on performance, the parameters need to be adjusted manually. After the Raman spectrum is collected, the traditional peak-seeking method is to find the peak manually or through third-party software, which cannot realize the whole automated process.
In this paper, we used the single-cell Raman heavy water isotope labeling
technology and introduced an image stitching algorithm and automatic recognition
algorithm, which can automatically calculate the number of fields to be spliced
based on the set number of single cells, effectively avoiding redundant splicing
and improving the efficiency of splicing and recognition, so as to realize fully
automated image stitching and single cell recognition. Moreover, in the
peak-seeking part of the Raman spectrum, the adaptive iteratively reweighted
Penalized Least Squares (airPLS) algorithm and the peak-finding algorithm are
added to achieve precise positioning of the Raman spectrum fingerprint, as well
as rapid identification of the Raman spectrum within the range of 2030–2400
cm
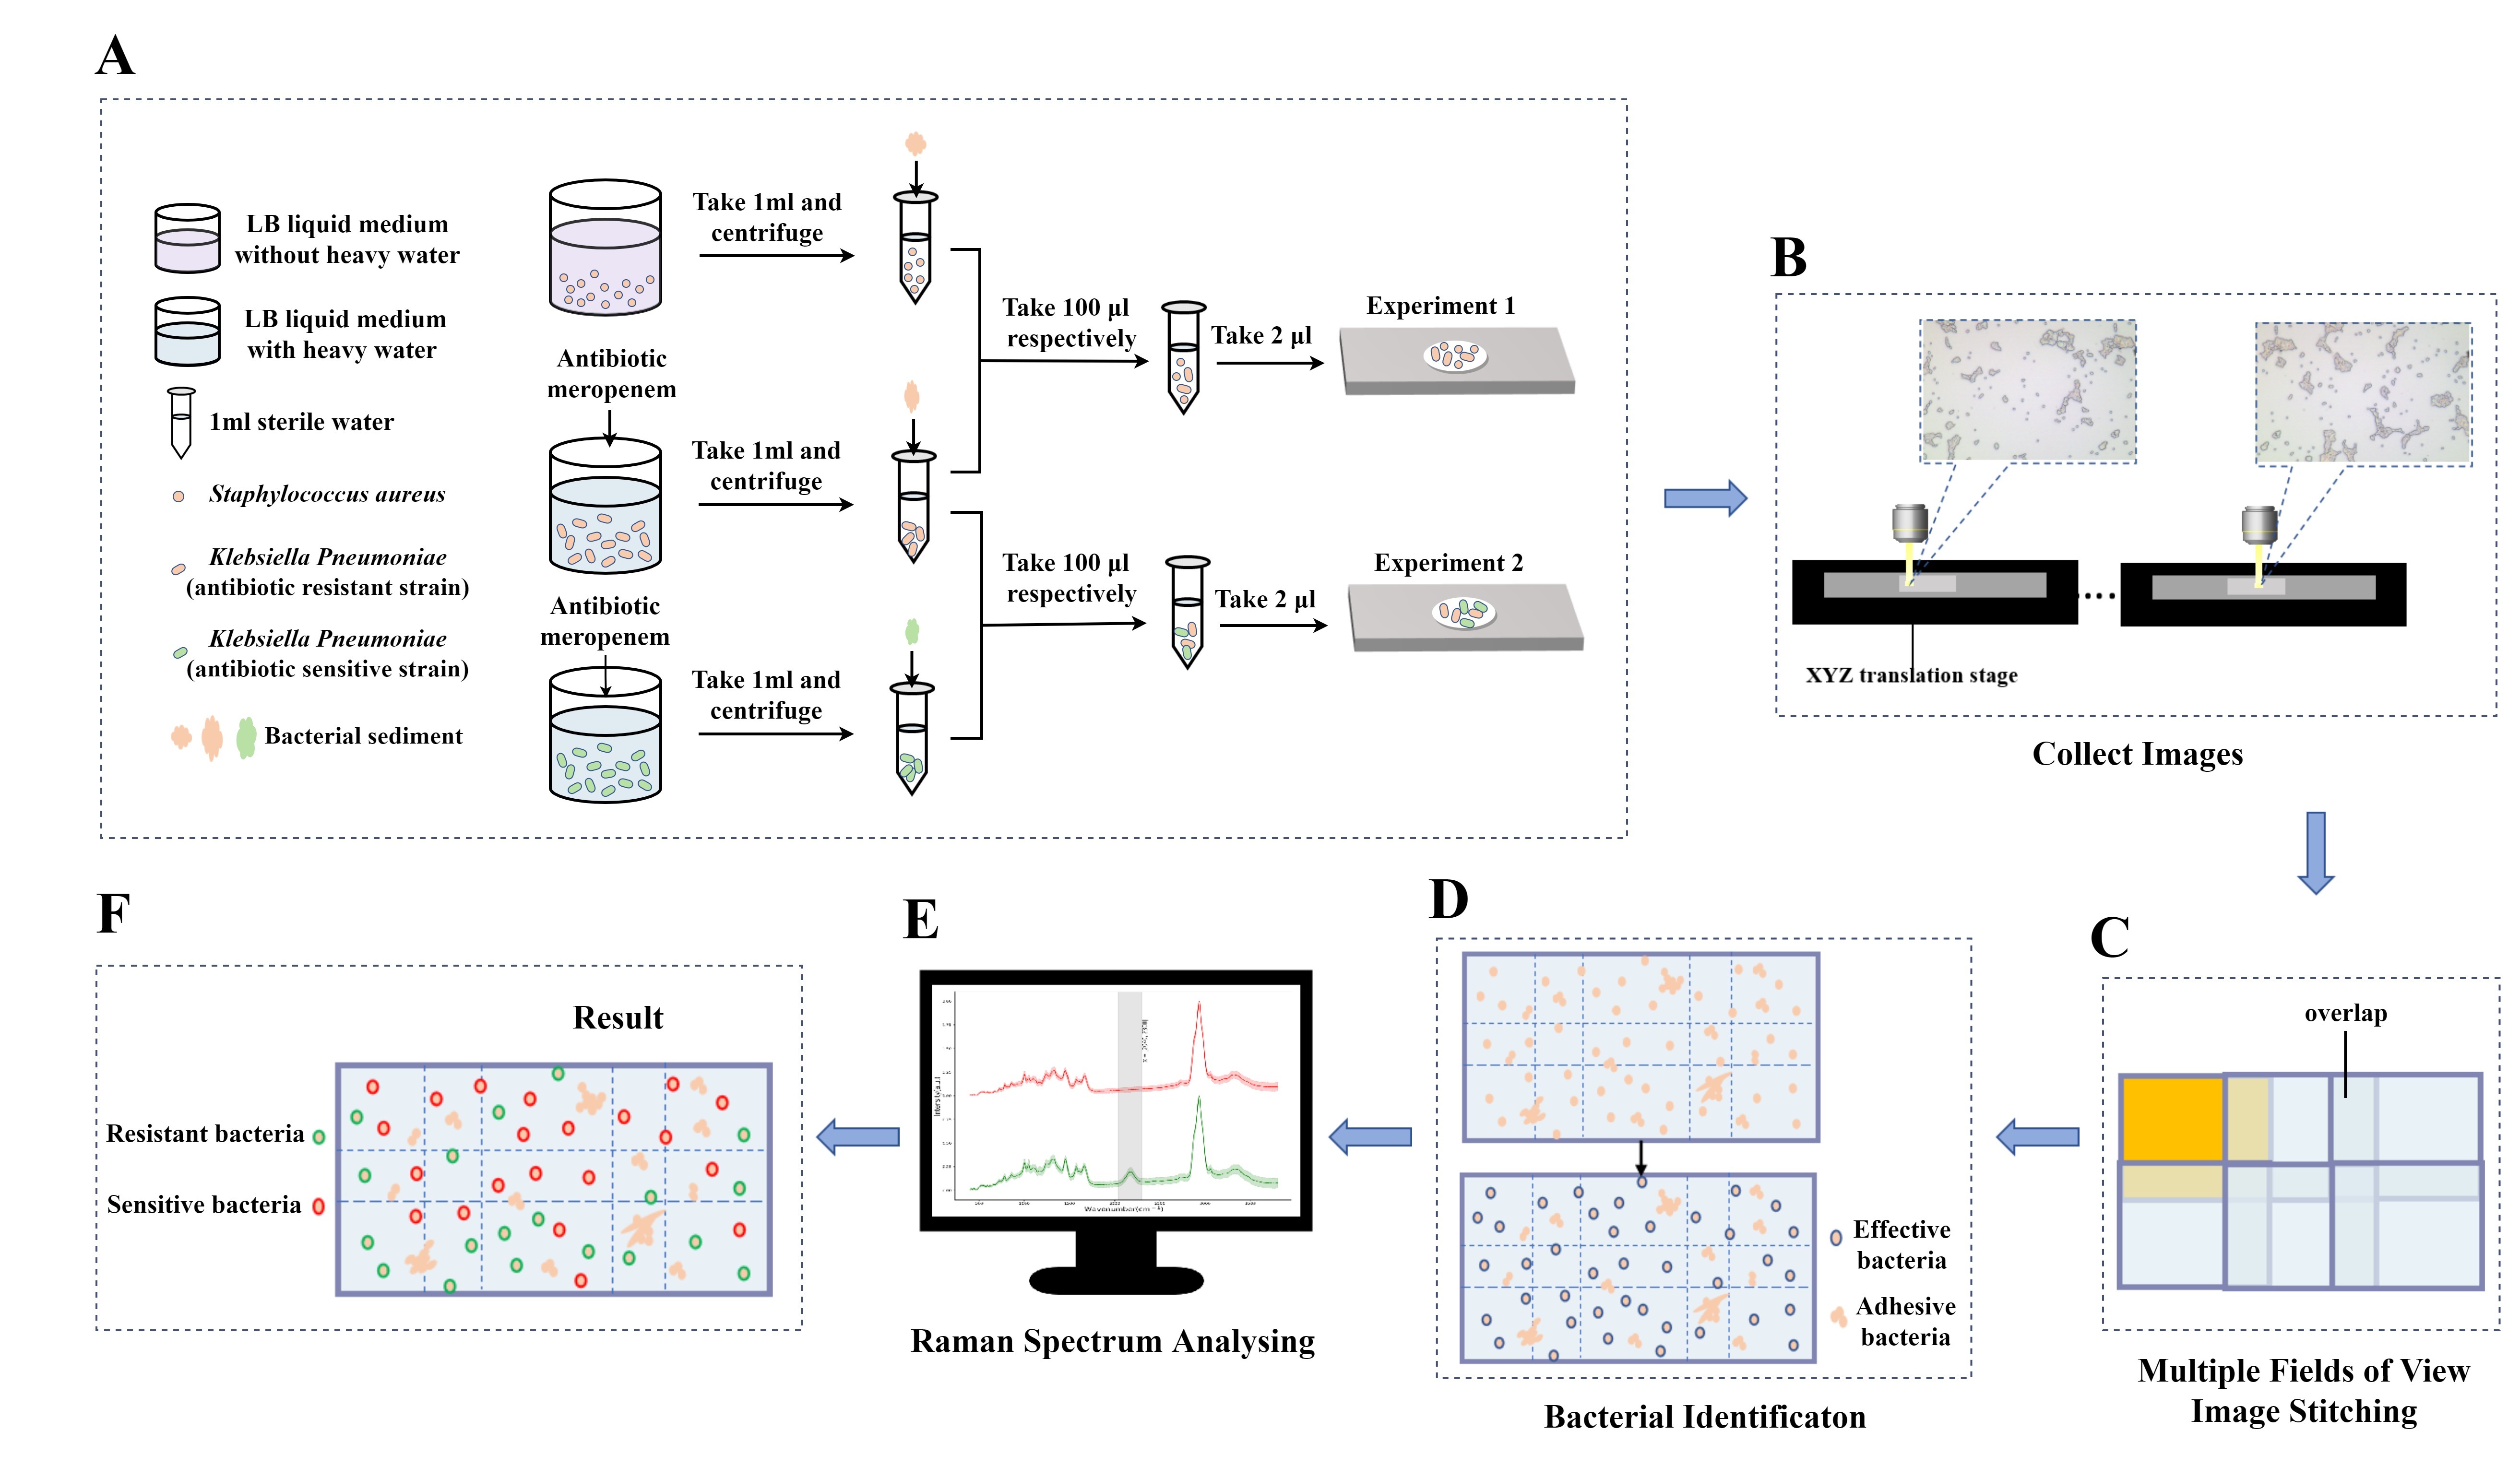
Two pathogenic bacteria were selected for this study, including Klebsiella pneumoniae and Staphylococcus aureus. Among them, Klebsiella pneumoniae included meropenem-resistant strains (minimum inhibitory concentration (MIC) = 8) and sensitive strains, and Staphylococcus aureus was a sensitive strain.
Configure Luria-Bertani (LB) liquid medium with a 30% concentration of heavy water (Sigma-Aldrich). The Klebsiella pneumoniae resistant strains and Klebsiella pneumoniae sensitive strains were cultured in a 30% heavy water medium, in which the antibiotic meropenem was added at a concentration of 8 µg/µL and cultured overnight at 37 °C. Staphylococcus aureus was cultured using LB medium and culture at 37 °C overnight.
① Take 1 mL each of Klebsiella pneumoniae and Staphylococcus aureus cultured overnight, and centrifuge at 9000 rpm for 2 min to collect the bacterial sediment, and then use sterile water to wash the bacterial sediment three times, each time at 9000 rpm for 2 min, and finally dissolve the bacterial sediment in 1 mL of sterile water, shake and mix well. Take 100 µL of two groups of samples and shake and mix to prepare a mixed sample. 2 µL of the pure samples of Klebsiella pneumoniae and Staphylococcus aureus and the mixed samples of the two groups were spotted on the Raman chip (Champion Optics, Changchun, Jilin, China), respectively, and air-dried for Raman detection.
② Take 1 mL each of Klebsiella pneumoniae resistant strains and Klebsiella pneumoniae sensitive strains cultured overnight, the treatment conditions are the same as above, and the mixed sample is prepared. 2 µL of the pure samples of Klebsiella pneumoniae resistant strains and Klebsiella pneumoniae sensitive strains and the mixed samples of the two groups were spotted on the Raman chip, respectively, and air-dried for Raman detection.
The purpose of image stitching is to automatically calculate the number of fields of view needed by scanning small fields of view with the number of bacteria entered by the user, and to stitch these overlapping small field of view images into one multiple fields of view image to obtain a panoramic image with enough bacteria. Image stitching mainly includes four stages: image identification, image registration, global optimization, and image blending. To realize the automatic calculation of the number of visual fields to be spliced to improve efficiency, the method adopted in this paper is to calculate the final number of visual fields to be spliced by the number of bacteria to be tested input by the user. The flow chart of image stitching is shown in Fig. 1.
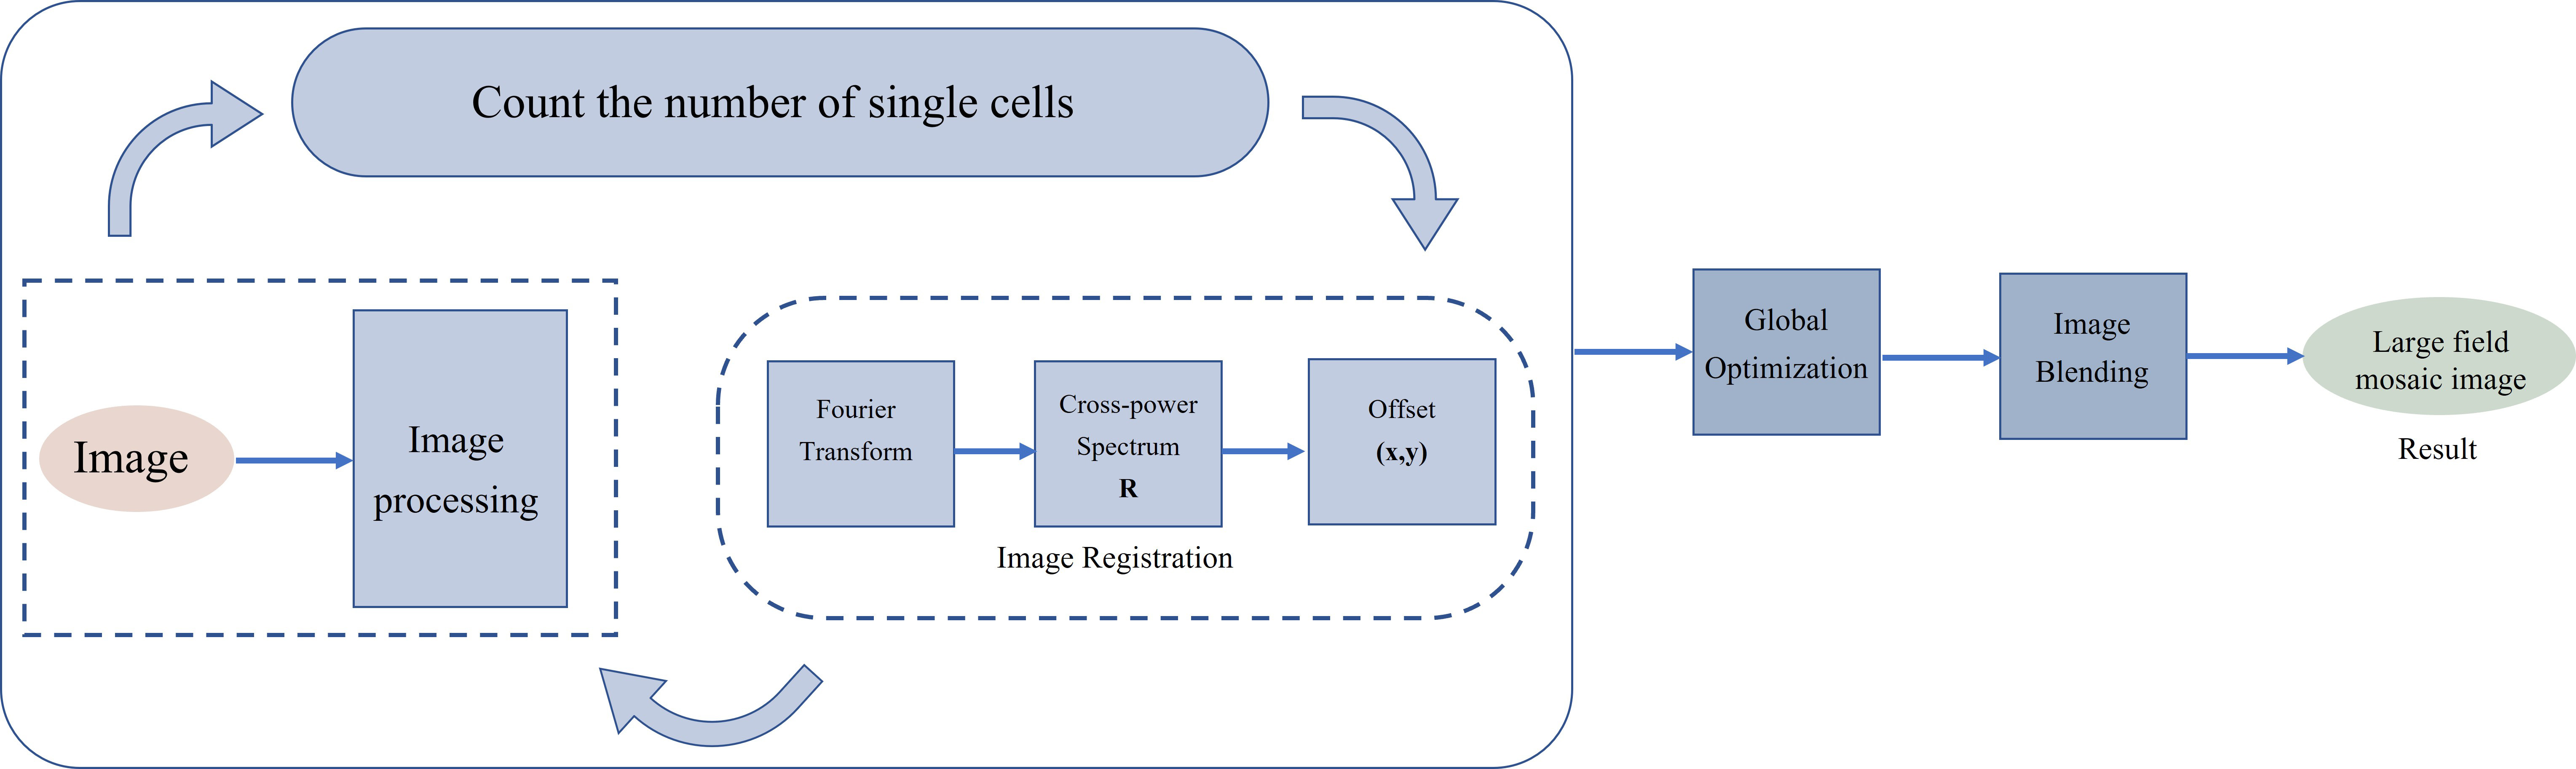 Fig. 1.
Multiple fields of view image stitching flowchart.
In order to automatically calculate the number of stitched images, image recognition is performed at the same time as the acquisition of small field of view images. The number of identified bacteria in the unoverlapped area of the acquired image is accumulated and compared with the number of bacteria that the user has set to be detected to determine whether to continue acquiring images. To ensure the number of bacteria after splicing, if the accumulated bacteria do not reach the user-set number after scanning a certain line, all bacteria in the next line will be directly scanned.
Filtering and binarization of the acquired small-field images, use the
FindContours() function of the OpenCV library to roughly calculate the
number of single cells based on the size of the contours found.
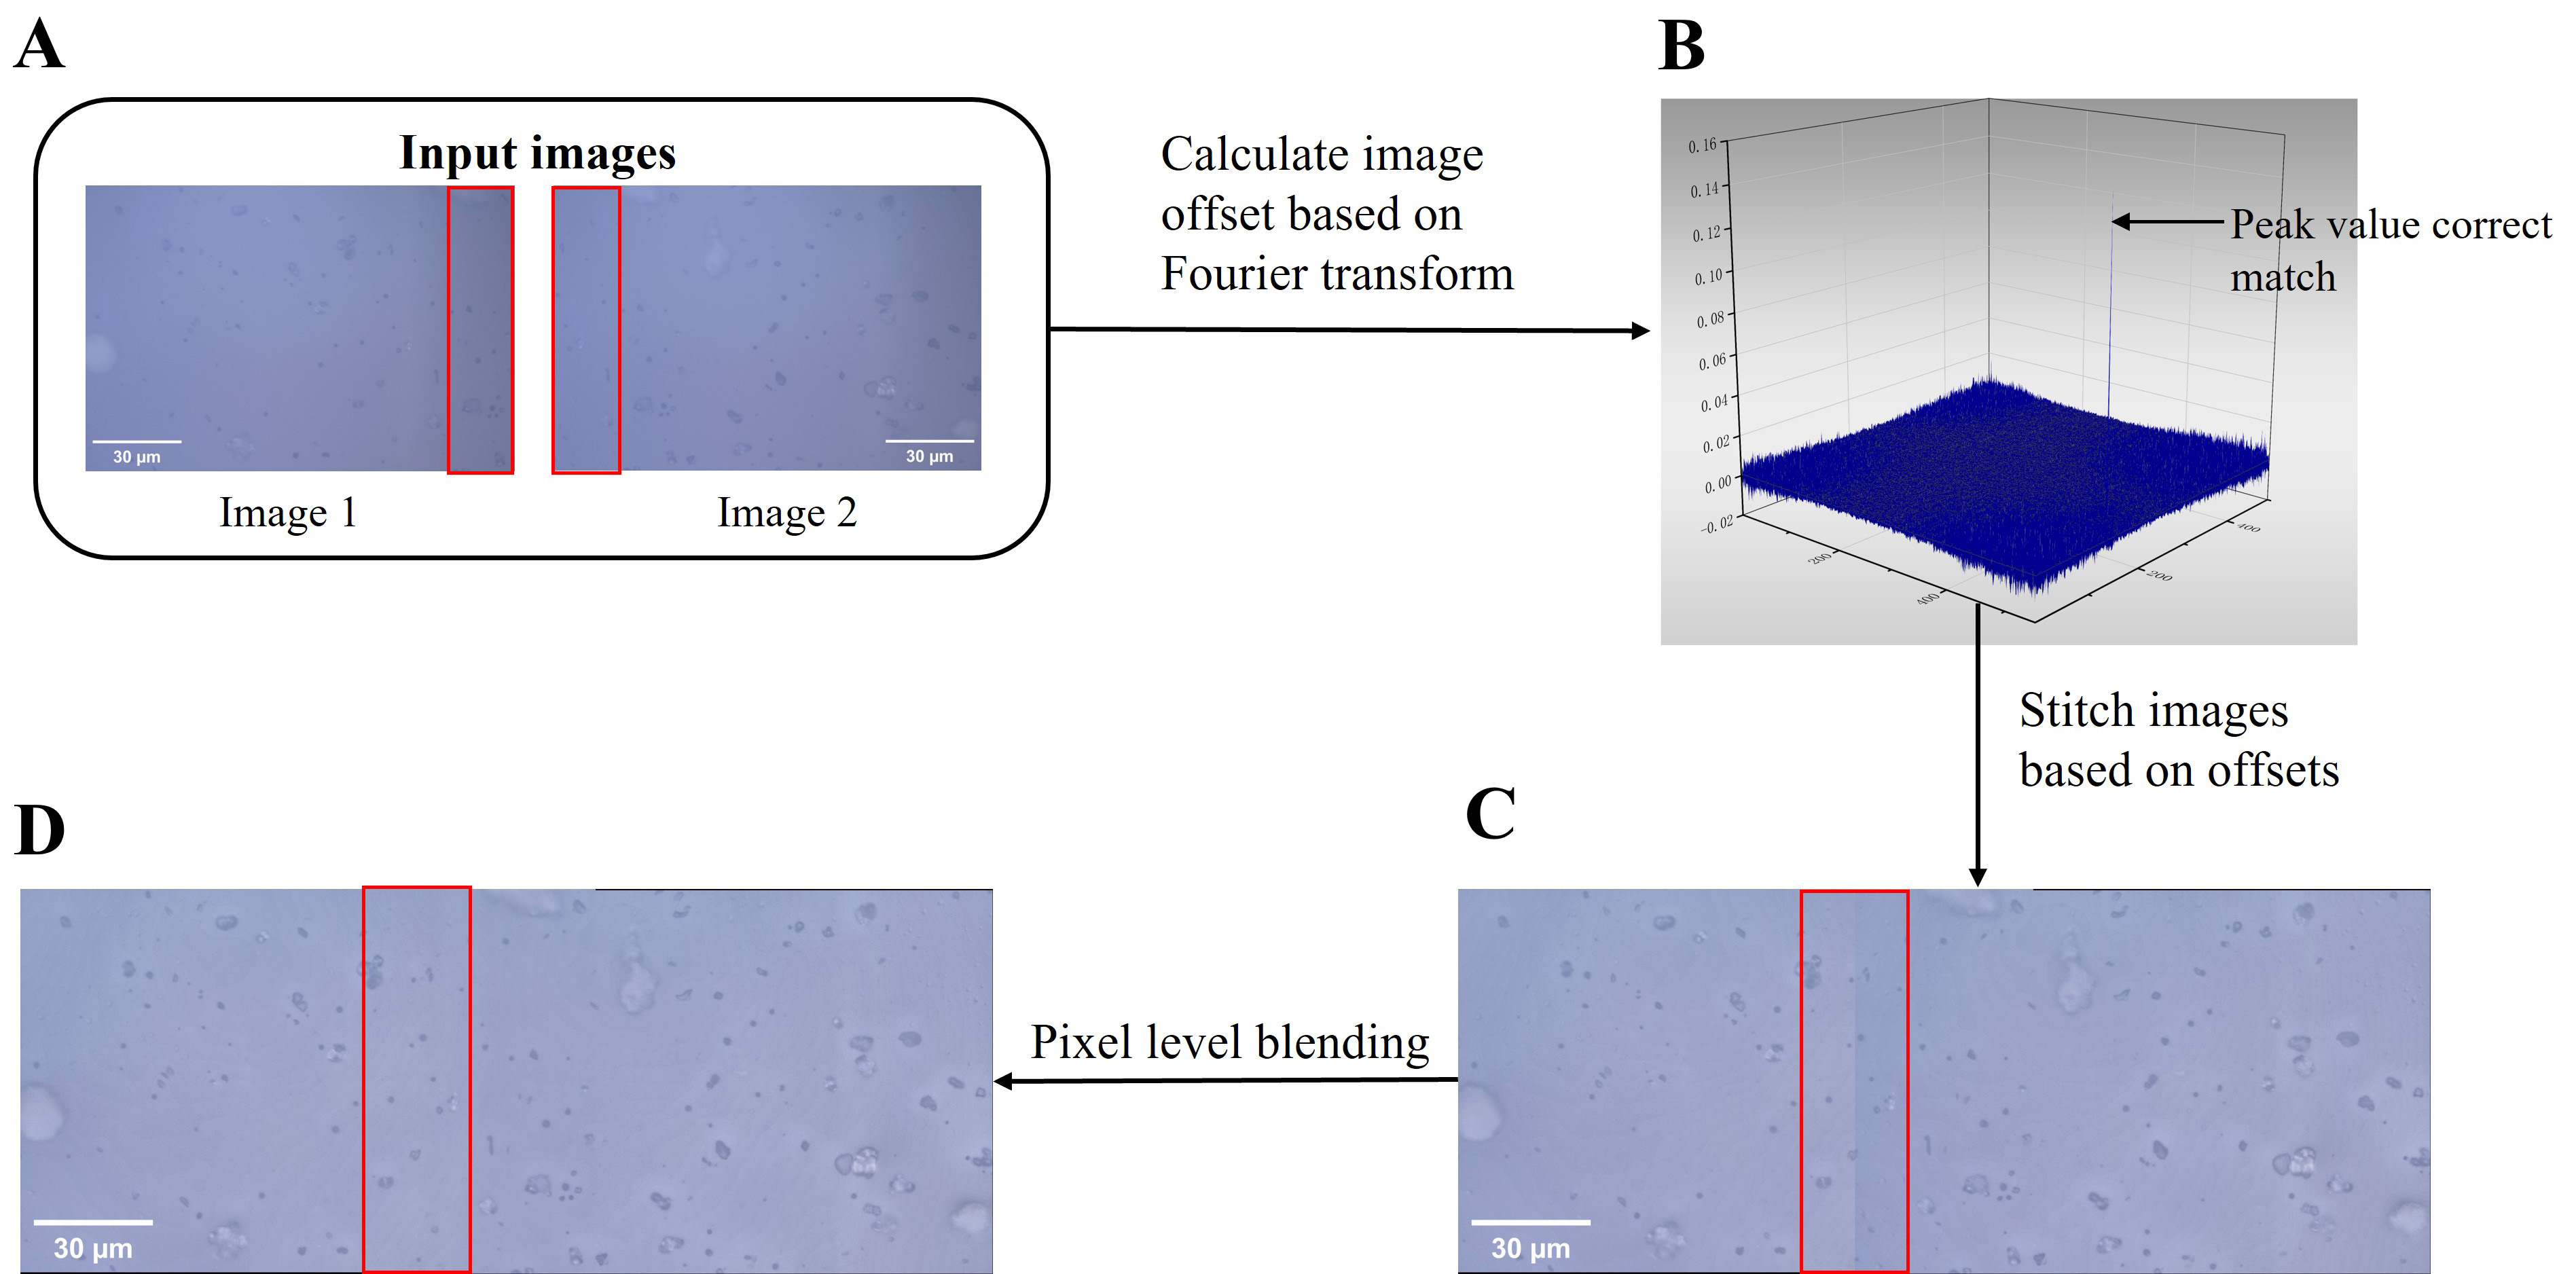
Finding the spatial mapping link between the pixels of one picture and the pixels of another image and aligning them spatially with the least amount of error is known as image registration. To determine the offset between each field of view, a phase-correlation method is used. The phase correlation technology is based on the Fourier transform search concept. The offset is determined using the cross-power spectrum when there is just a translation between the two pictures. The position of the largest peak in the cross-power spectrum is the relative translation of the two images [20, 21, 22, 23].
Let
Taking the Fourier transform of both yields the following connection, according to the shift theorem:
The following is the definition of the cross-power spectrum between
* Denotes complicated conjugation. Applying the inverse Fourier transform to
formula (3) yields the Dirac function (impulse function)
 Fig. 2.
Schematic diagram of fusion of two images. (A) Input two images with overlapping areas. (B) The impulse function picture was computed from the two photographs. (C) Direct stitching. Stitching seams frequently show up in panoramic stitched photos because of the associated changes in ambient light and cameras. (D) Pixel-level blending. Following pixel-level fusion processing, the stitching seams can be efficiently eliminated.
Global optimization is necessary to filter out any paired registrations that do
not fit into the remainder of the connection network, identify the consistency
across all pairs, and decrease errors since there are inconsistencies between the
computed image offsets [24]. Fit the displacement connection of the other fields
of view concerning the reference field of view using the least squares approach
[25]. There is a set of transformations P = (
In general, the overlapping portions will exhibit variances in light and dark
intensity and degree of distortion due to the difference in sample time and
sampling angle between the two pictures, and there will unavoidably be seams
along the edge of the stitching. Therefore, it is necessary to add an
illumination compensation algorithm to remove dark corners from the image: divide
an image into M
Above all, it is required to apply a smooth transition fusion procedure to the
image to make the spliced image appear to have no seams [24, 27, 28, 29]. Linear fusion
of the pixels in the overlapped area is the fusion technique employed in this
work (Fig. 2C). By using linear blending, the weight of the pixels in the
overlapped region is determined using the contribution block
The following formula defines the separation between each pixel and the picture border:
There are 6 steps to identify and locate single cells and excluded the
impurities and cluster phenomena. Fig. 3E, F in the image after stitching
scanning areas: (1) Preprocess the input image: The colorful image should be
transformed into a gray image; use a filter to reduce noise on the gray image
(Fig. 3A). (2) The gray image reduced noise should be transformed into multiple
binary images by increasing from the minimum threshold to the maximum threshold
by threshold step. Fig. 3B shows one of the binary images. (3) Use the
FindContours() function of the OpenCV library (Open Source Computer
Vision Library) [31] to detect the blobs of the binary images (Fig. 3C) [32]. (4)
The blob center coordinates of binary images are grouped by the minimum distance
between connected components. From each group, estimate the final center of the
blobs and their radius, and return the location and area of the points (Fig. 3D).
(5) Filter the returned blobs with the following characteristics: Area; roundness
calculated by
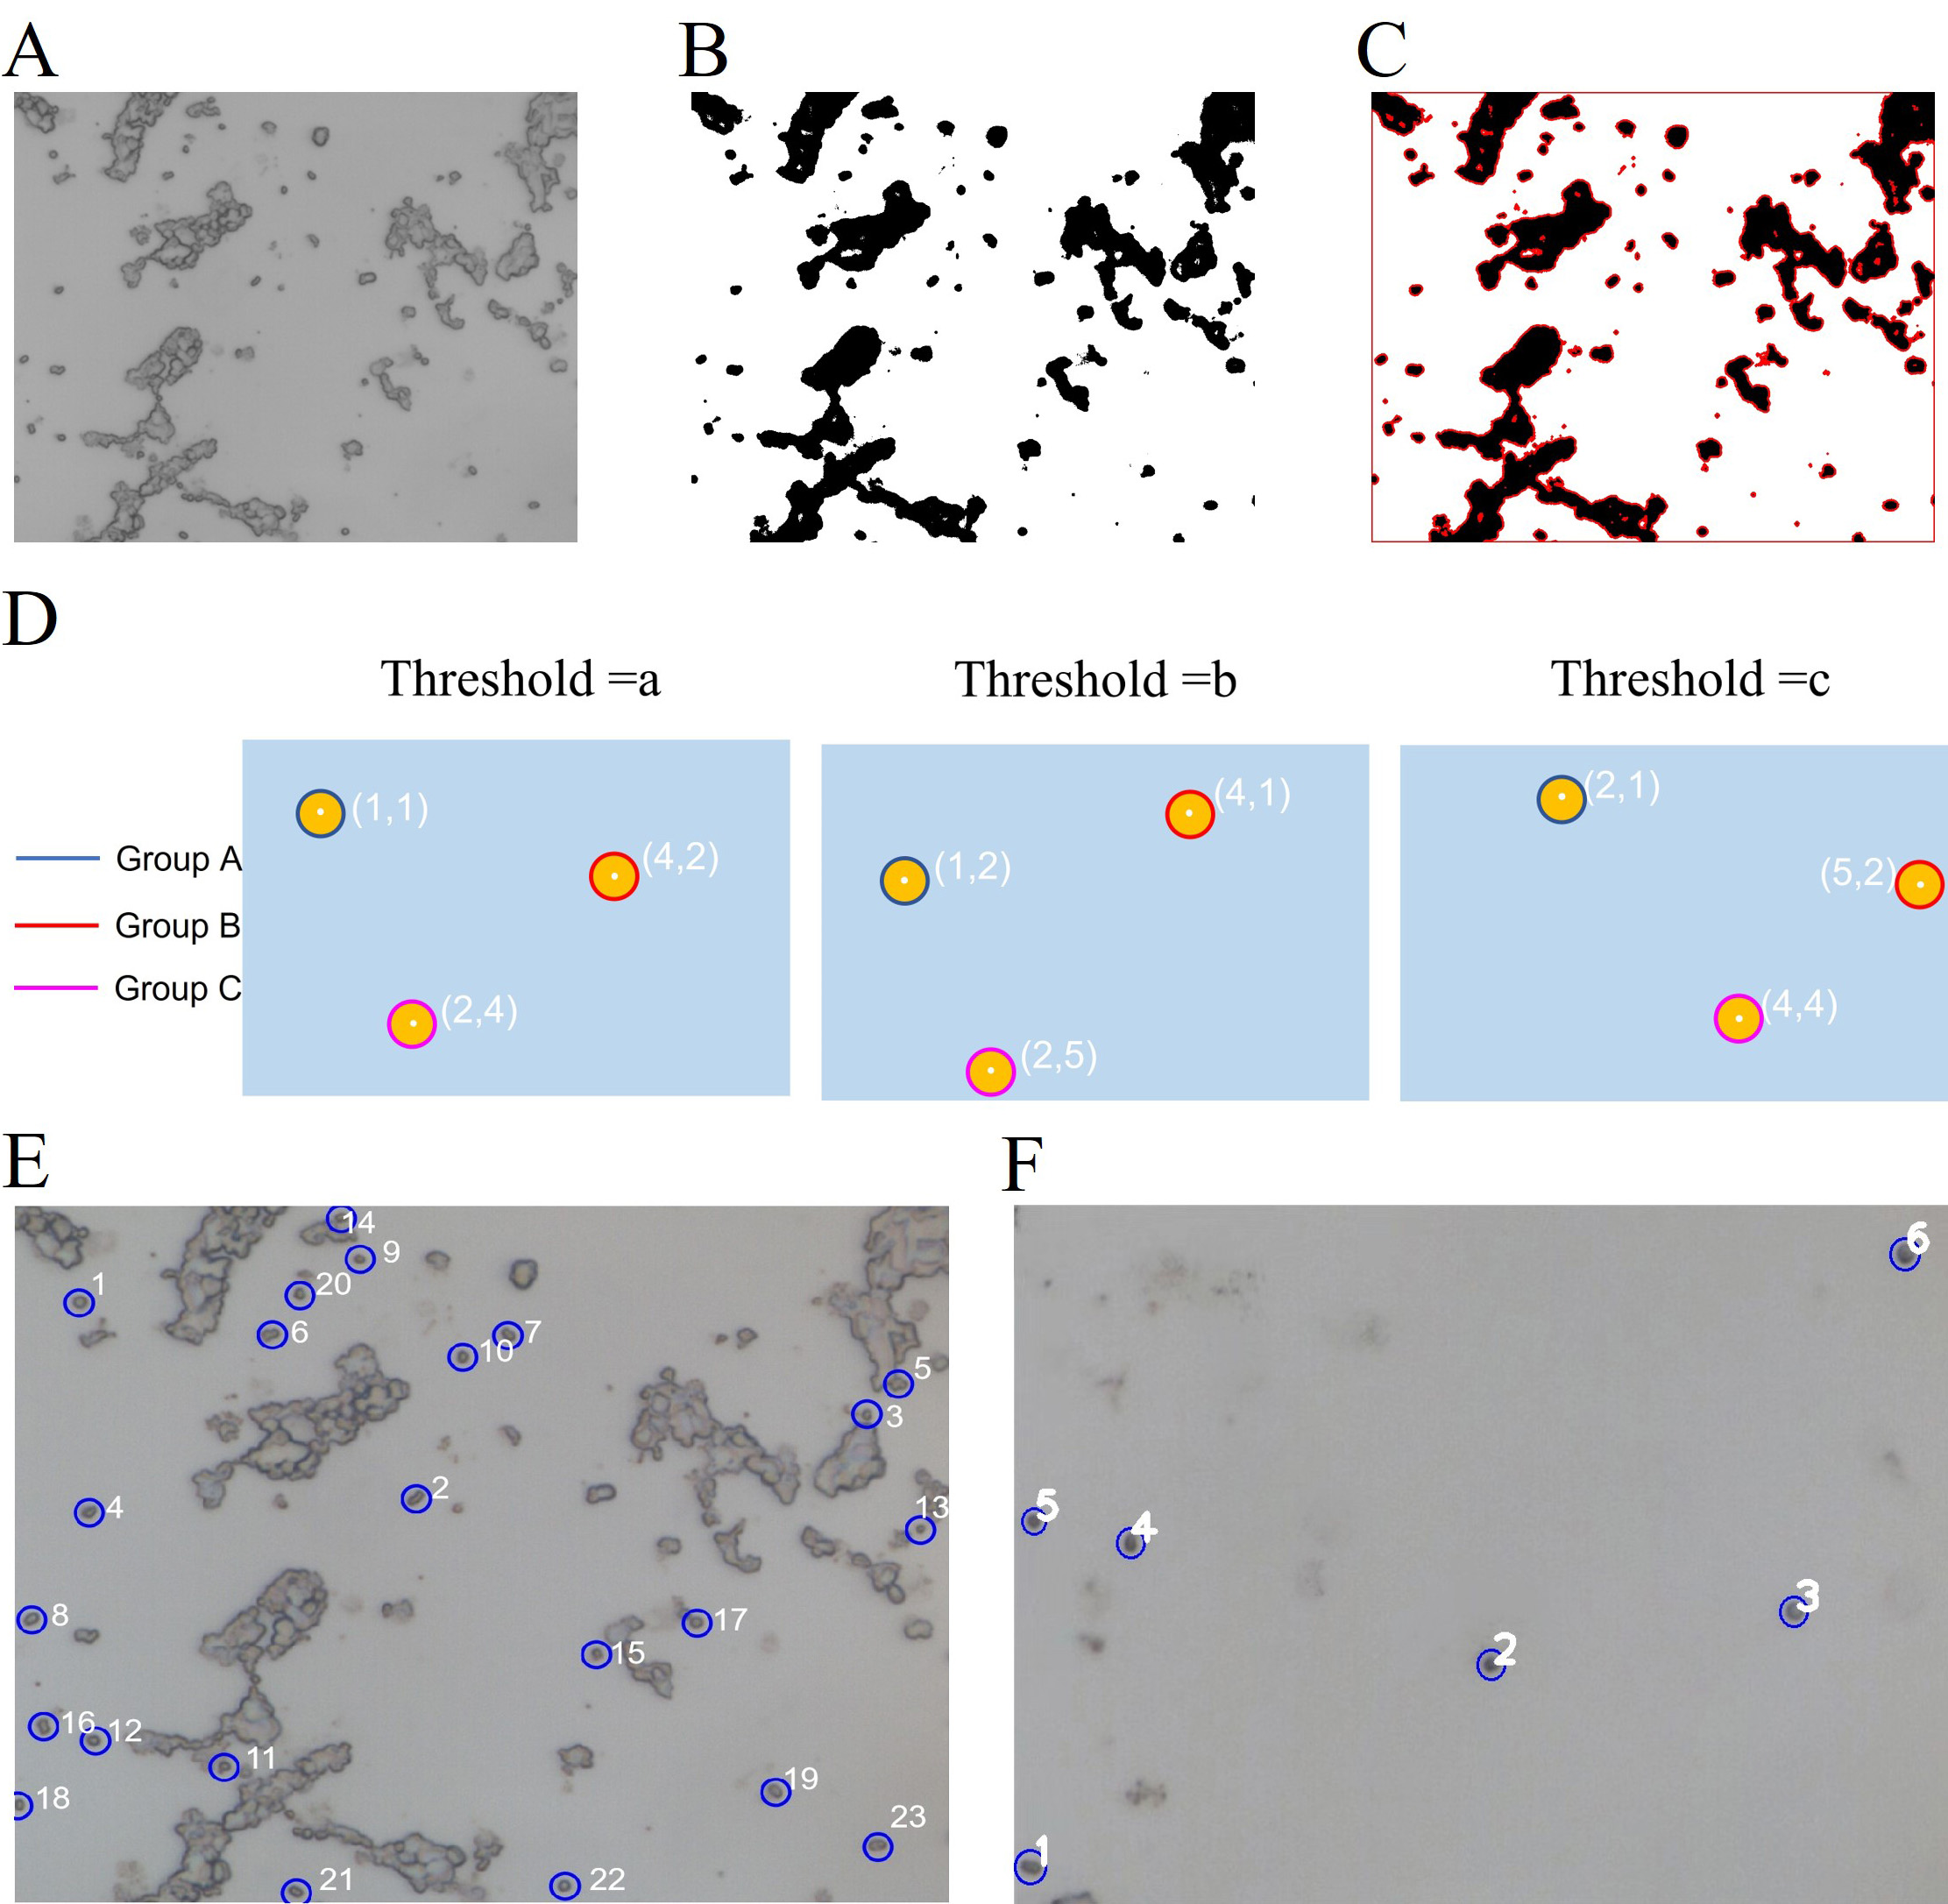 Fig. 3.
Schematic diagram of image recognition. (A) Pre-processed gray image. (B) One of the binary images. (C) Use the FindContours() function to detect the contours of (B). (D) The contours detected in multiple binary images are grouped according to the coordinates of their center points. (E) Screening single cells in a small field of view with excessive cluster phenomena. (F) Screening single cells in a small field of view with too few single cells.
By analyzing the antibiotic resistance of 2530 sensitive bacteria (Staphylococcus aureus) and 2224 resistant bacteria (Klebsiella pneumoniae) in experiment 1, respectively (Table 1), we evaluated the accuracy of identifying bacterial resistance (in %) derived from the ratio of the number of bacteria with correct identification of resistance to the total number of bacteria detected.
| Predicted | Actual | Total | |
| Bacteria with a heavy water (antibiotic-resistant bacteria) | Bacteria without a heavy water (antibiotic-sensitive bacteria) | ||
| Bacteria with a heavy water (antibiotic-resistant bacteria) | TP (2216) | FP (8) | 2224 |
| Bacteria without a heavy water (antibiotic-sensitive bacteria) | FN (2) | TN (2528) | 2530 |
| Total | 2218 | 2536 | 4754 |
| Accuracy = (TP + TN) / (TP + TN + FP + FN) = 0.998 | |||
| Precision = TP / (TP + FP) = 0.996 | |||
| Recall = TP / (TP + FN) = 0.999 | |||
TP, it is predicted that bacteria with C-D peak have a C-D peak; FP, the bacteria predicted to have a C-D peak have no C-D peak; FN, it is predicted that bacteria without C-D peak have a C-D peak; TN, it is predicted that bacteria with no C-D peak have no C-D peak.
Raman Spectra from microorganisms were acquired with the confocal Raman
spectrometer HOOKE R300 (Hooke Instrument Ltd., Changchun, Jilin, China) and
HOOKE P300 (Hooke Instrument Ltd., Changchun, Jilin, China) for experiment 1 and
experiment 2, respectively. Diffraction gratings with groove densities of 600
g/mm (spectral resolutions of 3–4 cm
Identify and locate single cells on multiple fields of view image after
stitching 9
In order to reduce the initial Raman Spectrum burr caused by signal jitter and other factors, the Savitzky-Golay (SG) filtering method [33, 34] is used to wight filter the Raman Spectrum to obtain smooth signal change information (Fig. 4A).
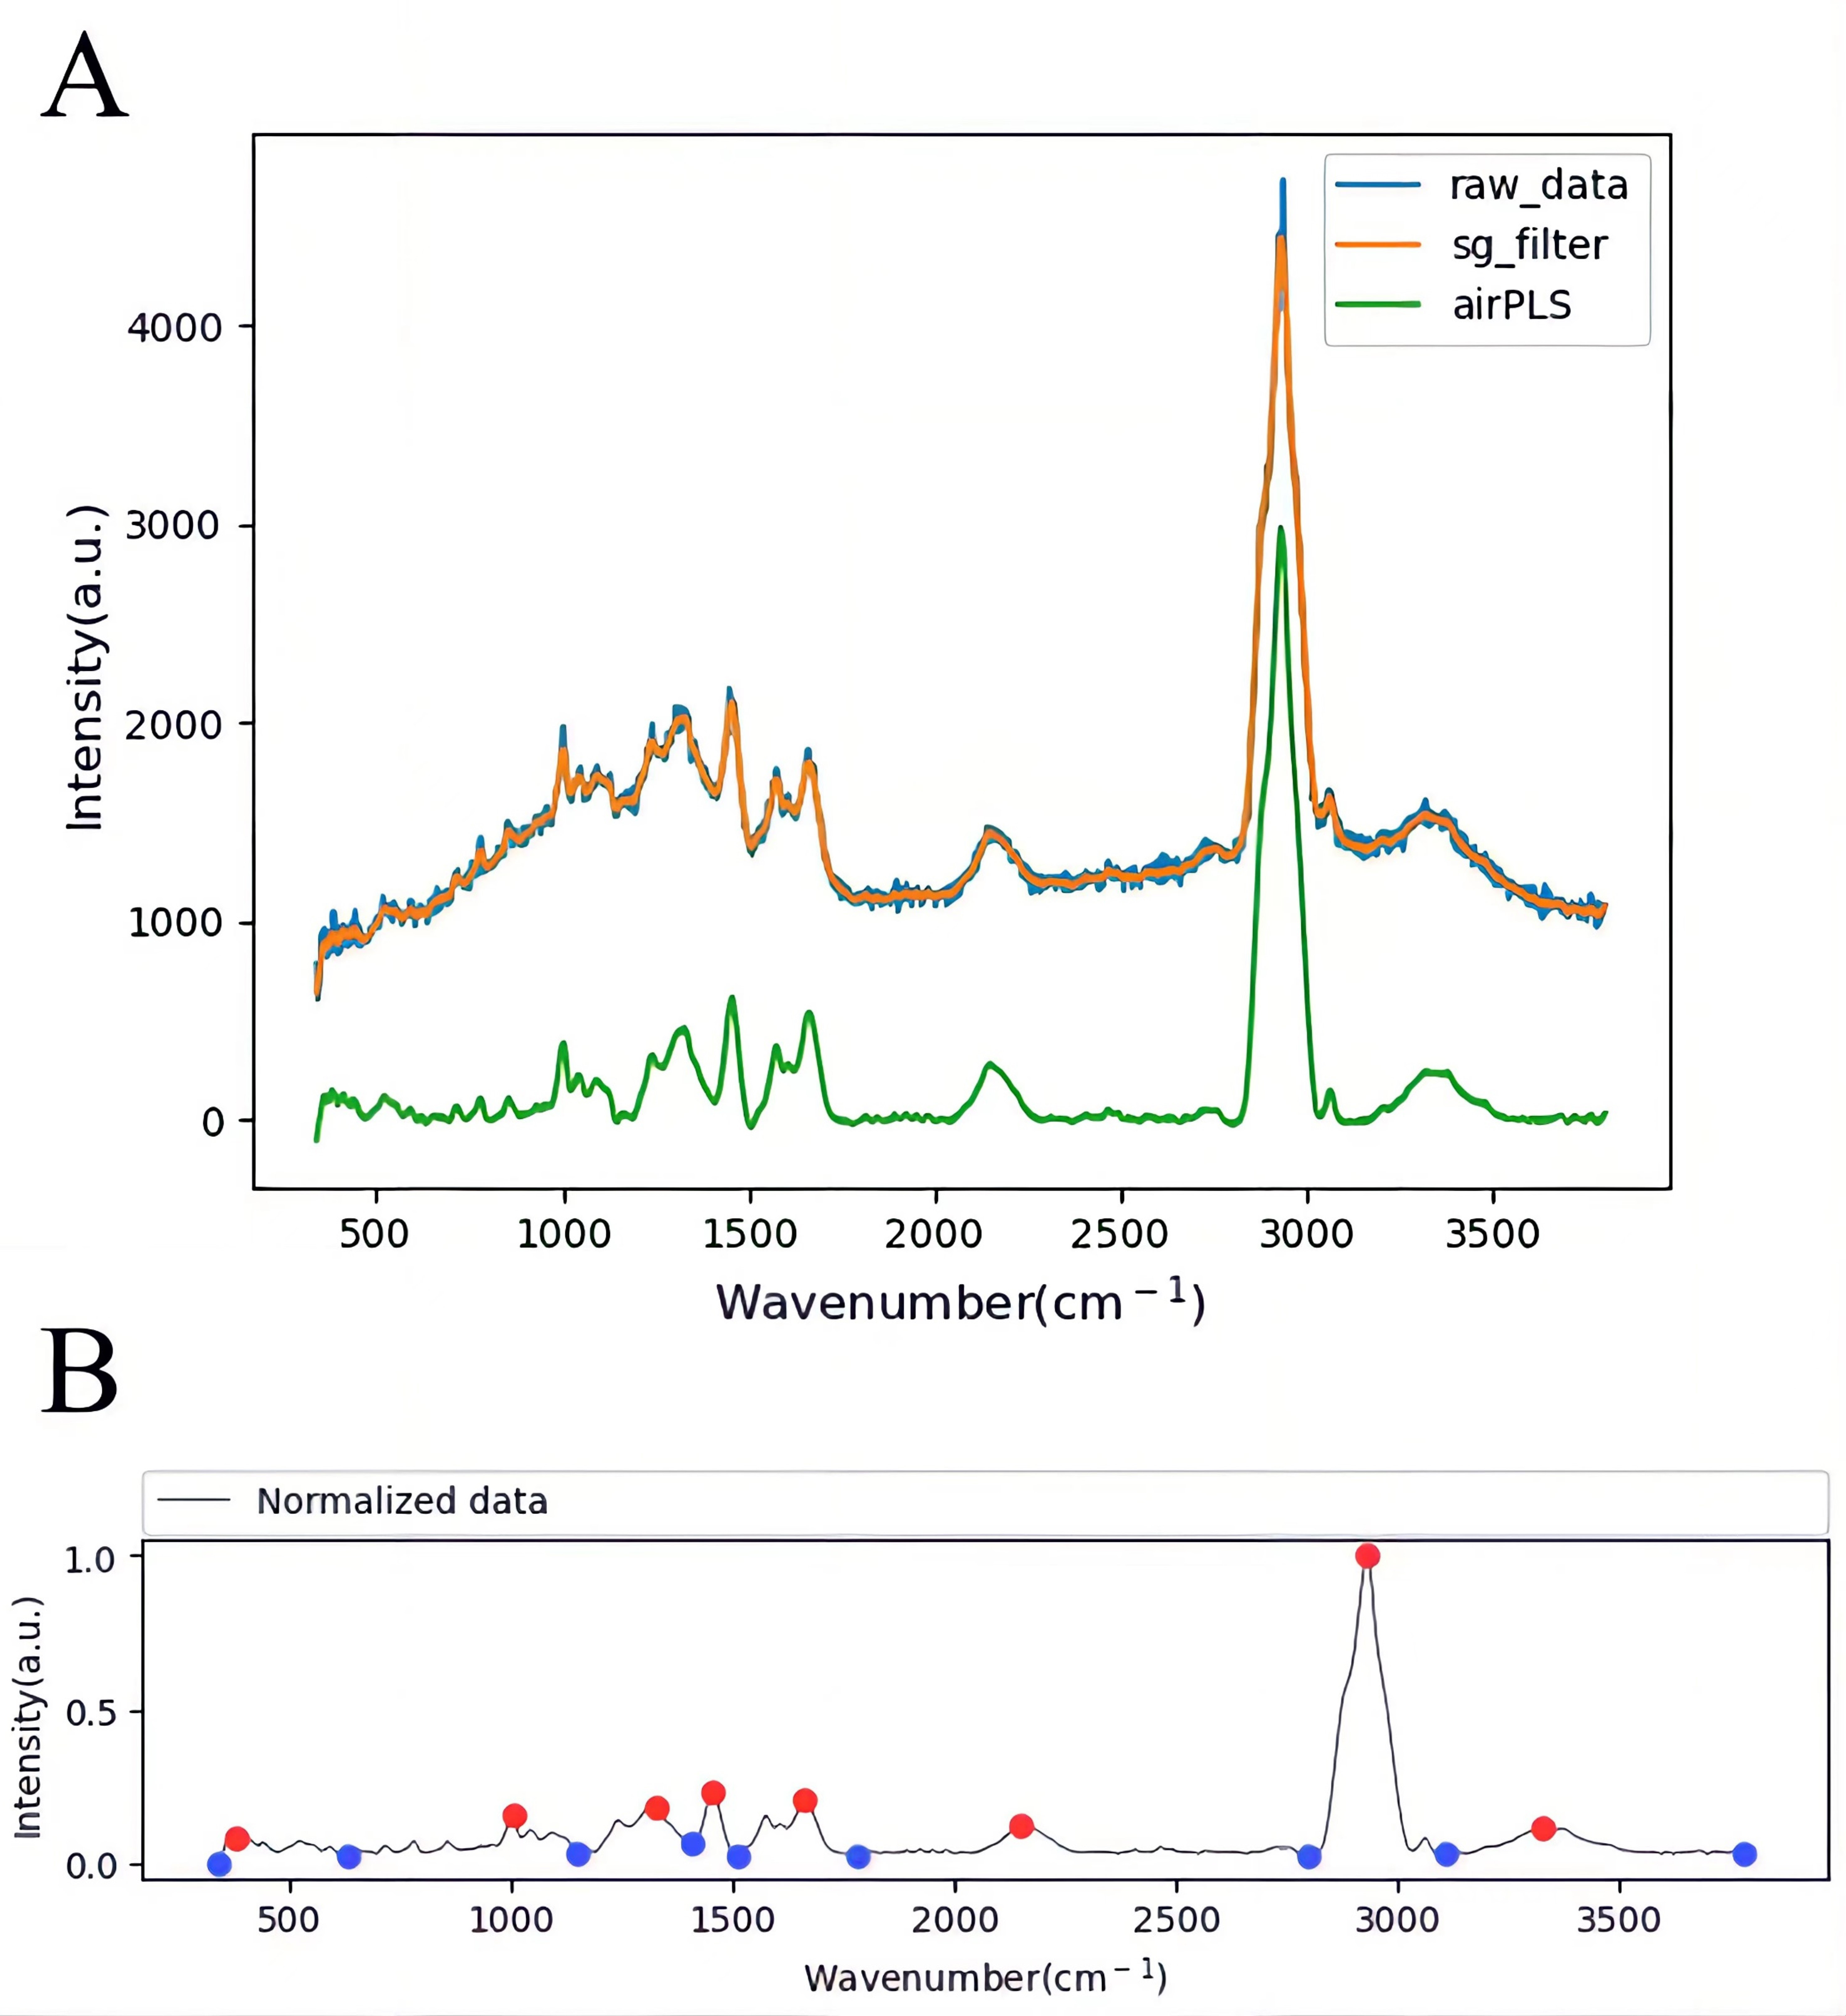 Fig. 4.
Raman Spectrum pretreatment and peak searching. (A) Raman Spectrum pretreatment with SG filter and adaptive iteratively reweighted Penalized Least Squares (airPLS). (B) Raman Spectrum peak searching.
To eliminate the background noise, we calibrate the baseline of the smoothed Raman Spectrum using an adaptive iteratively reweighted Penalized Least Squares (airPLS) algorithm [35, 36] (Fig. 4A). Adaptive iteratively reweighted Penalized Least Squares (airPLS) algorithm doesn’t require any user intervention and prior information, such as detected peaks. It iteratively changes weights of sum squares errors (SSE) between the fitted baseline and original signals, and the weights of SSE are obtained adaptively using previously fitted baseline and original signals. This baseline estimator is fast and flexible in fitting the baseline [37].
Automatic peaking of Raman spectra using Persistence1D to extract [38], pair, and sorted local minima and local maxima according to their persistence (Fig. 4B). Scan and save the Raman spectrum of each bacterium in the sample, then analyze antibiotic resistance by Automatic peaking Raman Spectroscopy. Therefore, a completely automated process is realized.
For experiment 1, the number of bacteria set by the user is 2500, and the actual
number of collected bacteria is 2706. 9
For experiment 2, the number of bacteria set by the user is 2000, and the actual
number of collected bacteria is 2048. 11
For both multiple fields of view images, the illumination compensation algorithm is used to reduce the dark corners around the image. In image registration, the error caused by redundant information was reduced because only phase correlation is used for overlapping areas. Stitching accomplished without losing information based on the prior knowledge of the offset of the shift table.
Numerous studies have reported that there are differences in molecular structure
between antibiotic-resistant bacteria and sensitive bacteria [39, 40]. By
collecting Raman Spectra of bacteria and determining whether there is a C-D peak,
antibiotic-resistant bacteria and sensitive bacteria can be quickly
distinguished. In this study, we analyze whether the Raman Spectra of bacteria
have a peak in the wave number range of 2040–2300 cm
Fig. 5C,D shows the Raman Spectra images of antibiotic-resistant bacteria and
sensitive bacteria from experiment 1 and experiment 2, respectively. The
comparison shows that the C-D characteristic peak appeared in the range of Raman
Spectra wave number 2040–2300 cm
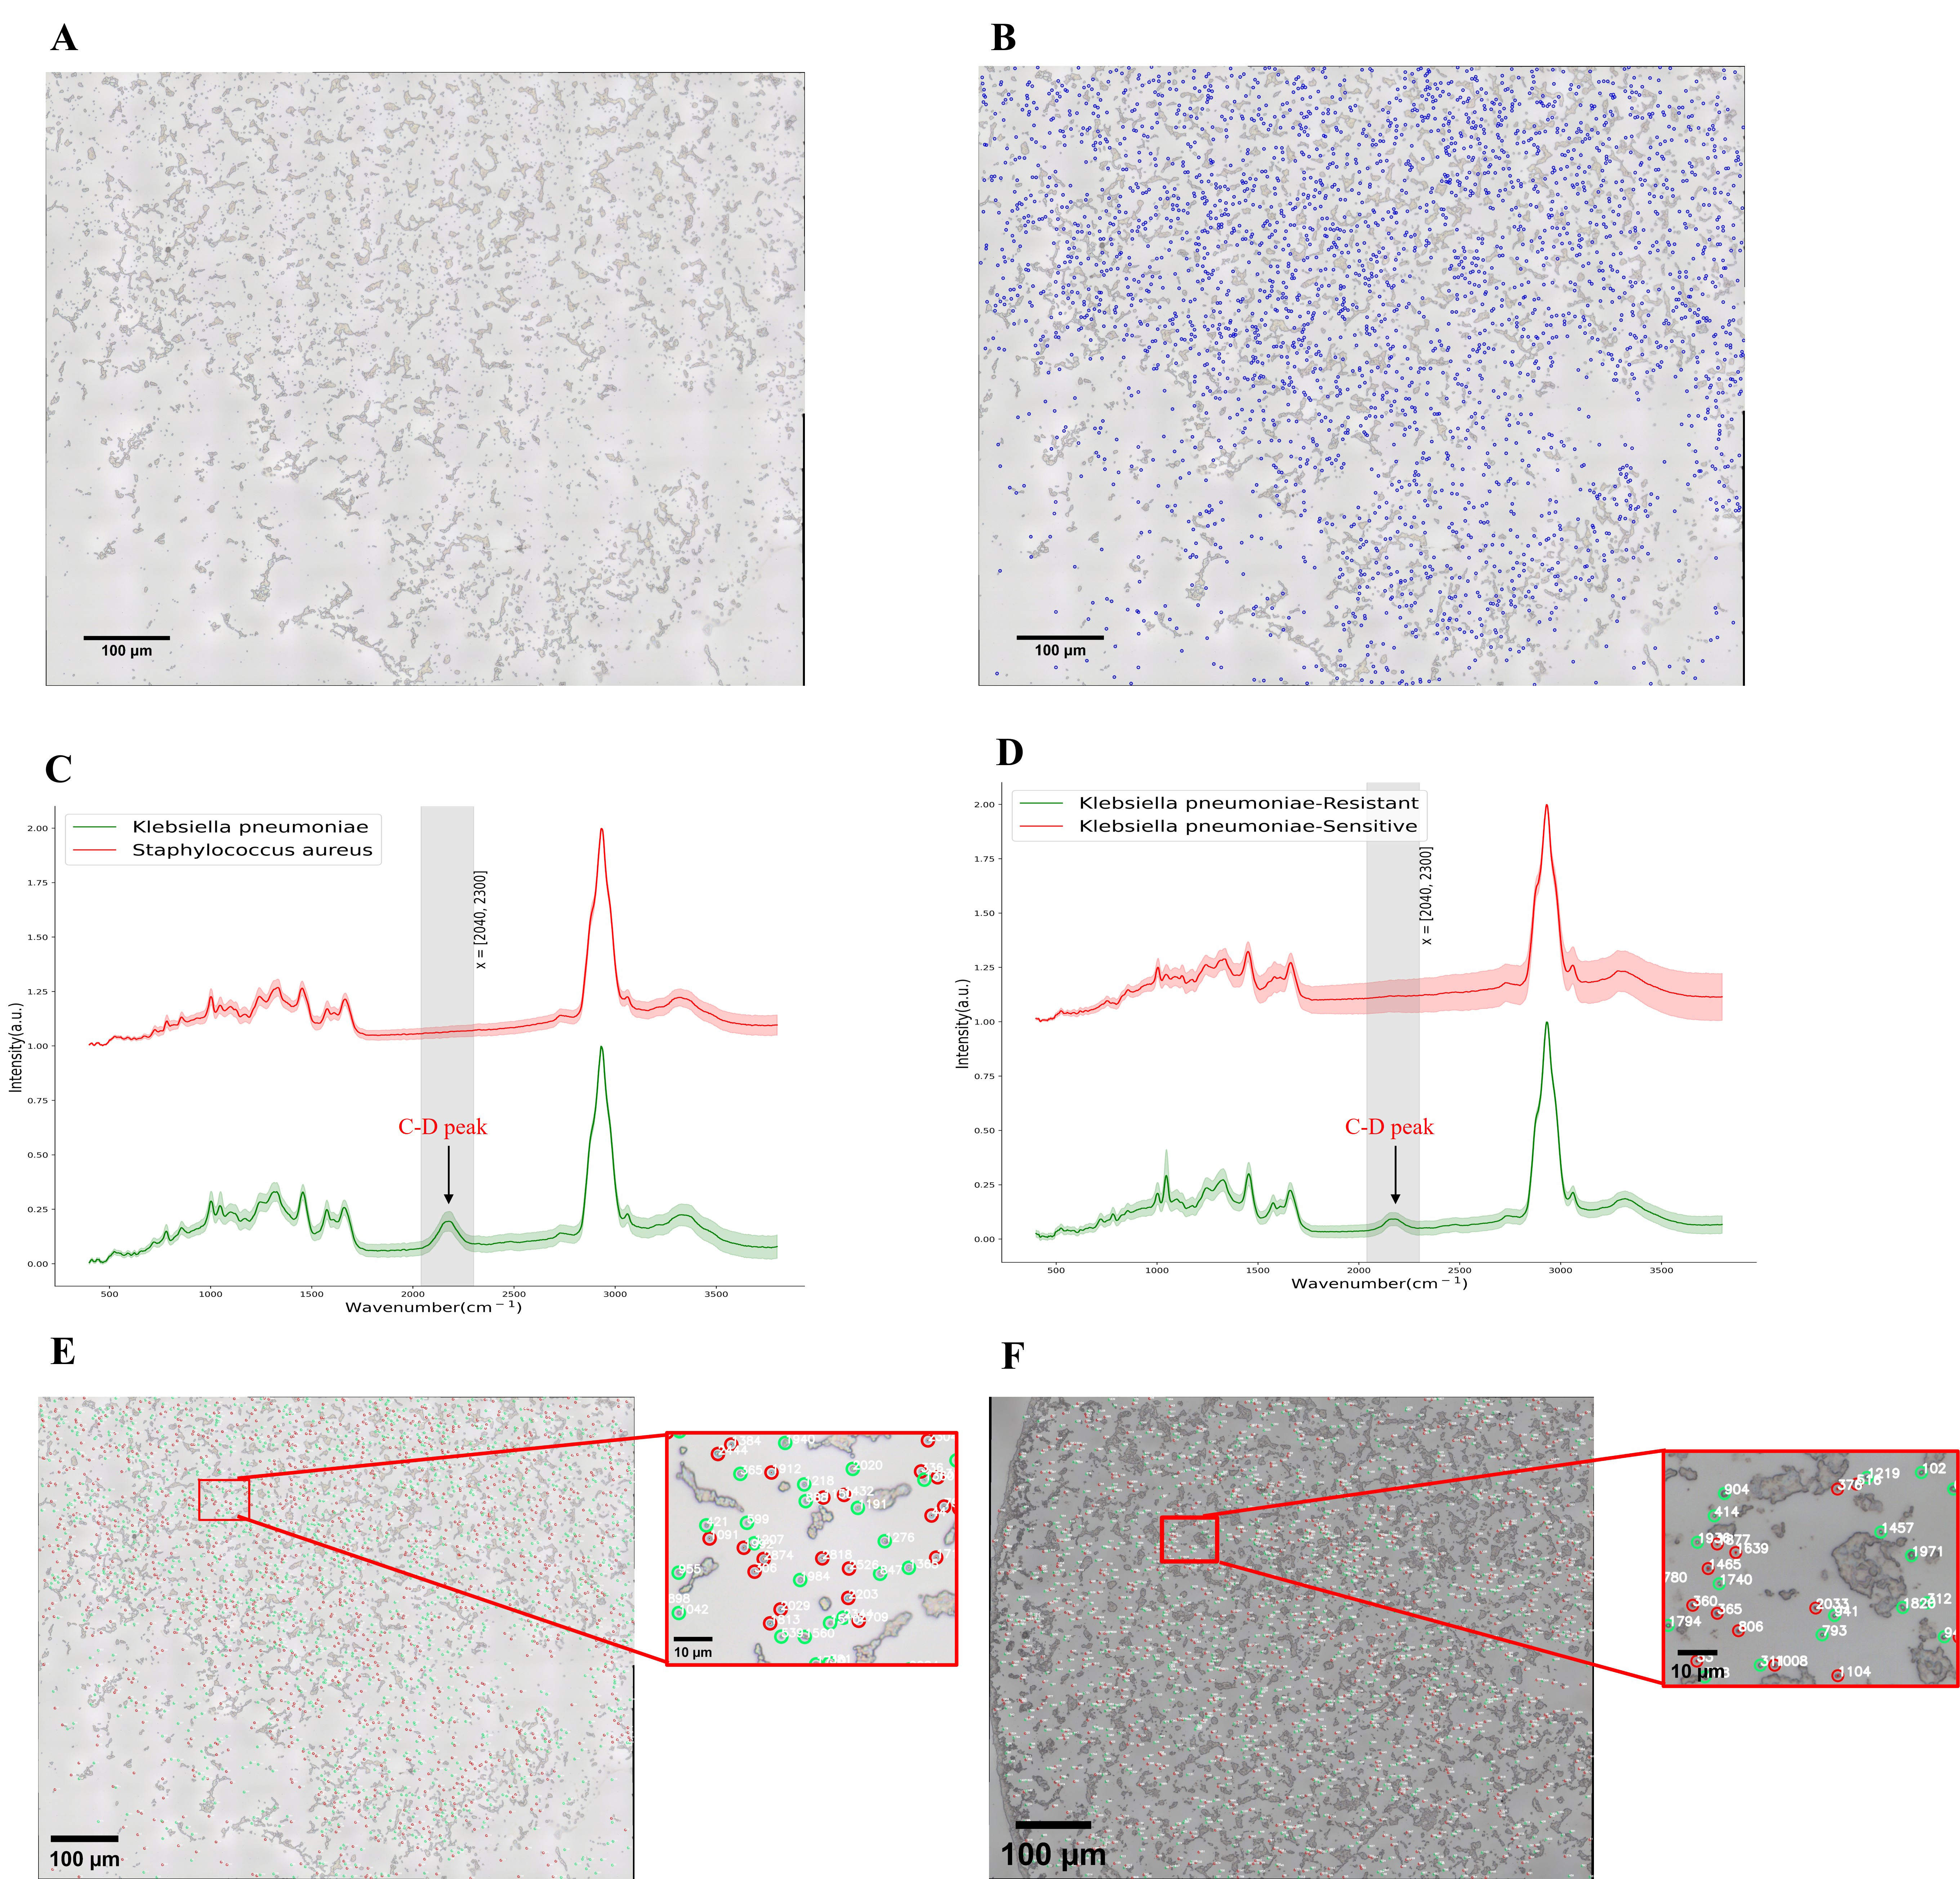 Fig. 5.
The conclusion diagram following data processing. (A) Multiple
fields of view image after stitching 9
Whether the bacteria are antibiotic resistant can be identified by the presence
of a C-D peak in the range of 2040–2300 cm
Table 1 shows that the number of bacteria with a C-D peak detected in 2224 antibiotic-resistant bacteria is 2216; The number of bacteria without a C-D peak detected in 2224 antibiotic-resistant bacteria is 8; The number of bacteria without a C-D peak detected in 2530 antibiotic-sensitive bacteria is 2528; The number of bacteria with a C-D peak detected in 2530 antibiotic-sensitive bacteria is 2. The results showed that the accuracy of identifying was 99.8% which used rapid detection and analysis of Raman Spectra of bacteria in multiple fields of view based on an image stitching technique. Experiment 1 shows that the number of antibiotic-resistant bacteria was 1137, accounting for 42%; The number of sensitive bacteria was 1569, accounting for 58%. Experiment 2 shows that the number of antibiotic-resistant bacteria was 1087, accounting for 53%; The number of sensitive bacteria was 961, accounting for 47%.
Fig. 5E,F shows the distribution of antibiotic-resistant bacteria and sensitive bacteria in experiment 1 and experiment 2, respectively.
To achieve high throughput, rapid and accurate detection of antimicrobial-resistance by Raman spectroscopy, we have proposed rapid detection and analysis of Raman Spectra of bacteria in multiple fields of view based on an image stitching technique. The method researched in this paper focuses on single-cell Raman spectra, combined with isotope labeling, and integrates multiple algorithms for optimization to automatically calculate of the number of stitched small fields of view by the number of bacteria entered by the user and determine the presence or absence of peaks in a set peak interval to achieve unattended, automated identification of bacterial antimicrobial resistance. Currently available products, such as the ParticleScout program and Fiji, there is no doubt that they are very mature software at present. In the part of image stitching, both of them can perform accurate and seamless stitching according to the set stitching range, and Particlescout can be used in environmental science, food technology, and other fields. Carry out localization and classification, and further study the samples by confocal Raman imaging. The method studied in this paper is mainly applied to the biomedical field. According to the number of single cells to be identified entered by the user, the range of image stitching is automatically calculated. Combined with heavy water labeling and Raman spectroscopy, the whole process of automatic and unsupervised analysis of single-cell antibiotic resistance in antibiotic sensitivity tests is realized in multiple fields of view. Then we have calculated the accuracy of this method. The automatically analyze bacteria Raman spectra method in multiple fields of view can accurately identify single cells and accurately identify bacterial antibiotic resistance (The accuracy rate is 99.8%). The results indicate that the automatically analyze bacteria Raman spectra method in multiple fields of view can rapidly and accurately analyze antimicrobial resistance. As a result, the automatically analyze bacteria Raman spectra method in multiple fields of view can be used as a high-throughput, rapid and accurate method to detect antimicrobial resistance by Raman spectroscopy for researching the persistence and spread of antibiotics in bacterial pathogens, which will benefit the medical field and microbiology field.
The authors are unable or have chosen not to specify which data has been used. The data used in this study is for commercial use and readers may contact the corresponding author if they would like this data.
XD and FY designed the study, wrote the software, collected the data, and wrote the manuscript. YX prepared samples. NW analyzed data. HH participated in the analysis of the data as well as the revision of the manuscript. BL contributed to experimental design and manuscript revisions. All authors contributed to editorial changes in the manuscript. All authors read and approved the final manuscript. All authors have participated sufficiently in the work and agreed to be accountable for all aspects of the work.
Not applicable.
We would like to thank the study participants for actively participating. Thanks for the support of the bacterial drug resistance rapid detection instrument based on Raman technology project.
This study was supported by the bacterial drug resistance rapid detection instrument based on Raman technology project (grant no. 20190302015GX).
Given his role as Guest Editor, Bei Li had no involvement in the peer-review of this article and has no access to information regarding its peer-review. Full responsibility for the editorial process for this article was delegated to Josef Jampílek. The authors declare no conflict of interest.
References
Publisher’s Note: IMR Press stays neutral with regard to jurisdictional claims in published maps and institutional affiliations.