1. Introduction
Systemic lupus erythematosus (SLE) is characterized by the dysregulation of
immunocompetent cells that can generate pathogenic autoantibodies after
self-antigen exposure to attack systemic organs [1]. The pathogenesis of SLE are
multifactorial [2, 3]. However, few studies have discussed the potential roles of
plasma cell-free DNA (DNA) [4].
Under normal circumstances, DNA molecules are located intracellularly and
embedded compactly in the nucleus as nuclear DNA (nDNA) or in the mitochondrial
nucleoid as mitochondrial DNA (mtDNA) [5]. On the contrary, cell-free DNA
(DNA) are the DNA molecules that are released into the tissue fluid from
cells all over the whole body [6]. They have been detected in cerebrospinal fluid
[7], pleural fluid [8], saliva [9], urine [10] and plasma [11] for different
purposes. The DNA present in blood circulation is called “plasma
cell-free DNA (DNA)”, and most of them are originated from circulating
hematopoietic cells [12]. Analysis of DNA has been employed for the
diagnosis of acute myeloid leukemia as a non-invasive tool, which is as accurate
as the invasive bone marrow aspiration or biopsy [13]. Human DNA was
first described by Mandel and Metais in 1948 [11]. From then on, the clinical
usefulness of DNA has been emphasized in predicting the outcomes of
critical patients with myocardial infarction [14], sepsis [15] or stroke [16].
High levels of DNA were first found in SLE patients in 1966 [17]. Later
on, some studies suggested that DNA might serve as an exposed
self-antigen to trigger the pathogenesis of SLE [18]. Because the DNA is
mainly derived from intracellular mtDNA or nDNA, it is of great interest and
clinical relevance to explore the roles of mitochondrial DNA
(mtDNA) and nuclear DNA (nDNA) simultaneously in SLE
patients.
Dysregulated antioxidant capacity with imbalanced production of reactive oxygen
species (ROS) has been speculated in the development of SLE [19, 20]. Abnormal
ROS levels would cause oxidative damages or oxidative modifications in the
intracellular or extracellular components of cells in situ,
nearby, or remotely. These components may include DNA, lipid, proteins, and
phospholipids. The events would trigger subsequent cellular dysfunction or
autoimmune reactions in SLE patients [19, 20, 21]. Elevated plasma
8-hydroxy-2’-deoxyguanosine (8-OHdG) representing oxidative DNA damage [21, 22, 23]
and plasma malondialdehyde (MDA) representing lipid peroxidation [21, 22, 24]
have been reported in SLE patients with different clinical implications. The
levels of accumulated 8-OHdG and/or MDA in the plasma could be effective
surrogates to represent the oxidative stress in SLE patients [25].
Viral infection causing
incidental self-antigen presentation has been proposed as a possible mechanism
underlying the autoimmune reaction in SLE. Similar to the immune interaction
implicating high levels of interferon (INF) observed between invading virus and
host pattern/pathogen recognition receptors (PRRs), a phenomenon of type I INF
signature has also been recognized as a prominent feature
of SLE [26]. A clinical
trial revealed that the treatment of anti-INF-alpha monoclonal antibody,
sifalimumab, could achieve a significant improvement of symptoms/signs in
moderate to severe SLE patients [27]. Recently, the importance of human C-type
lectin domain family 5 member A (CLEC5A, a member of PRRs) in interacting with
the invading virus was reported [28]. Teng et al. [29] reported that
through toll-like receptor 3 (TLR, a subtype of PRRs), influenza virus infection
in bone marrow-derived macrophages from CLEC5A mice would result in an
increase of IFN-alpha. Based on these findings, we have speculated that decreased
or dysregulated leukocyte CLEC5A expression might be involved in SLE
pathogenesis.
In this study, we focused on the measurement of copies of mtDNA and
nDNA to explore their association with the levels of plasma 8-OHdG and
plasma MDA as well as the leukocyte CLEC5A mRNA transcripts in SLE patients. We
aimed to elucidate the role of DNA in the pathogenesis of SLE.
2. Materials and Methods
2.1 Recruitment of SLE Patients and the Healthy Controls (HCs)
According to the classification criteria for SLE and scored by the SLE Disease
Activity Index (SLEDAI)-2000 [30, 31, 32], a total of 80 non-acute SLE patients
(female/male = 67/13, mean age 45.4 12.7 years) under regular follow-up
and treatment in the outpatient department (OPD) of the Division of Allergy,
Immunology and Rheumatology in Taipei Veterans General Hospital were recruited in
this sudy. Their medications consisted of steroids, hydroxychloroquine,
azathioprine, mycophenolate mofetil or NSAID according to clinical conditions.
Another 43 healthy individuals, who had no evidence of systemic diseases, e.g.,
autoimmune diseases, diabetes, infections, cardiovascular diseases or malignancy
and matched for age (within 10 years, 40.2 10.4 years) and sex
(female/male = 35/8), were recruited as the healthy controls (HCs) for
comparative study. The demographic data of SLE patients regarding organ
involvement and laboratory profiles were recorded in detail. Regarding the lupus
nephritis, it was defined by a protein-to-creatinine ratio (or 24-hour urine
protein) exceeding 500 mg protein/24 hours or by red blood cell casts in the
urine [30]. Disease activity/severity was evaluated by using the SLEDAI-2000
scoring system [32, 33].
Besides, another 3 active SLE patients with severe clinical presentations were
enrolled. These included Case A with nephritis, pleuritis and pericarditis, Case
B with acute lupus nephritis and rapidly progressive glomerulonephritis who was
undergoing dialysis, and Case C with severe pulmonary arterial hypertension.
Their therapeutic regimens consisted of intravenous rituximab
(Mabthera™, 500 mg) on days 1 and 14 preceded by a pre-medication
with 100 mg of intravenous methylprednisolone. Blood samples were drawn before
rituximab treatments on days 1 and 14.
2.2 Purification of Plasma Cell-Free DNA (DNA) and
Extraction of the mRNA & DNA from Leukocytes
Approximately 10 mL of peripheral venous blood was drawn into a tube containing
EDTA (VACUETTE® with EDTA, Greiner Bio-One). After centrifugation
at 3000 g for 10 minutes at 4 °C, the supernatant plasma and
leukocyte-enriched buffy coat were collected, respectively. An aliquot of 200
L plasma was subjected to the purification of plasma cell-free DNA
(DNA) using Quick-cfDNA™ Serum and Plasma Miniprepkit
(Epigenetics) according to the manufacturer’s instructions [34]. The eluted
DNA was kept at –20 °C until use.
The leukocytes from 42 SLE patients and 24 HCs were isolated for RNA extraction
using the TRI™ reagent (Sigma-Aldrich Chemical Co., St. Louis, MO,
USA). With oligo-dT primers in a 50-L reaction buffer, an aliquot of 2
g of purified RNA was reverse-transcribed to cDNA (1X) by the Ready-To-Go
reverse transcription – polymerase chain reaction (RT-PCR) kit (GE Healthcare,
Amersham, UK ). The cDNA thus obtained was kept at –20 °C until use
[20].
Genomic DNA of the leukocytes from a healthy control (HC-No.42) was purified
through the standard phenol-chloroform extraction and isopropanol precipitation
procedure as described previously [35]. The DNA pellet was dissolved in
nuclease-free distilled water and kept at –20 °C until use.
2.3 Standard Curves for DNA and cDNA Quantification
Quantitative real-time PCR (Q-PCR) using SensiFAST SYBR® Hi-ROX
Kit (BIOLINE, London, UK) was applied to determine the DNA copies and cDNA copies
through a standard curve and their threshold cycle (Ct) values. To establish
standard curves for calculations, genomic DNA and cDNA from the leukocytes of
HC-No.42 were serially diluted by 4-fold, from 30 to 0.0018310546875 ng/L
for DNA and from 0.25 (4 dilution) to 0.00390625 (256
dilution) for cDNA, respectively, and were then subjected to Q-PCR for the
determination of their Ct values.
The oligonucleotide sequences of the primers used for amplification of mtDNA
(the tRNA gene region) and nDNA (the 18S rRNA gene
region) were mtF3212: 5′-CACCCAAGAACAGGGTTTGT-3′/mtR3319: 5′-TGGCCATGGGATTGTTGTTAA-3′ and 18SF1546:
5′-TAGAGGGACAAGTGGCGTTC-3′/18SR1650: 5′-CGCTGAGCCAGTCAGTGT-3′,
respectively [36]. The equations for mtDNA and nDNA quantifications were
established as follows:
(Ct value of analyzed sample mtDNA) = (–3.6972) log (mtDNA copies of
analyzed sample/mtDNA copies of reference sample) + 20.6390 (R =
0.9967) and (Ct value of analyzed sample nDNA) = (–3.8037) log (nDNA
copies of analyzed sample/nDNA copies of reference sample) + 21.014
(R = 0.9980), respectively.
Using these 2 equations, the mtDNA copies and nDNA copies of the analyzed sample
relative to mtDNA copies and nDNA copies of the reference sample were calculated.
The primer sequences for CLEC5A cDNA amplification and 18S rRNA cDNA
amplification were CLEC5AF: 5′-GTTTCACCACCACCAGGAGC-3′/CLEC5AR: 5′-
GGCATTCTTCTCACAGATCC-3′ and 18S rRNAF: 5′-CTCAACACGGGAAACCTCAC-3′/18S
rRNAR: 5′-CGCTCCACCAACTAAGAACG-3′, respectively [20, 37].
The equations for CLEC5A and 18S rRNA cDNA quantifications were set as follows:
(Ct value of analyzed sample CLEC5A cDNA) = (–3.3563) log (CLEC5A
cDNA copies of analyzed sample/CLEC5A cDNA copies of reference sample) + 23.418
(R = 0.9922) and (Ct value of analyzed sample 18S rRNA cDNA) =
(–3.2571) log (18S rRNA cDNA copies of analyzed sample/18S rRNA cDNA
copies of reference sample) + 18.824 (R = 0.9973), respectively.
Using these 2 equations, the CLEC5A cDNA copies and 18S rRNA cDNA copies of the
analyzed sample relative to CLEC5A cDNA copies and 18S rRNA cDNA copies of the
reference sample were calculated, respectively.
2.4 Determination of mtDNA Copies, nDNA Copies and
the Leukocyte CLEC5A mRNA Expression Levels
Q-PCR was used for the quantification of mtDNA, nDNA, leukocyte
CLEC5A cDNA and leukocyte 18S rRNA cDNA copies, respectively. For each Q-PCR
tube, 1 L of
DNA/or 1 L of cDNA (16 dilution) of analyzed sample was
amplified in a 10-L reaction mixture that contained 0.25 L of each
primer (20 M), 5 L of SensiFAST SYBR® Hi-ROX
premix, and 3.5 L of PCR-grade water. Simultaneously, 1 L of
HC-No.42 leukocyte DNA (1 ng/L)/or cDNA (16 dilution) and
PCR-grade water were used as the reference (positive) and negative controls,
respectively. The Q-PCR protocol contained a hot start at 95 °C for 10
minutes followed by 45 cycles of amplifications at 95 °C for 15 seconds
and 60 °C for 60 seconds. By equations established above, the
mtDNA copies, nDNA copies, leukocyte CLEC5A cDNA copies and
leukocyte 18S rRNA cDNA copies of analyzed samples relative to those of HC-No.42
leukocyte, were calculated, respectively. We defined the CLEC5A mRNA expression
level as total CLEC5A cDNA copies divided by total 18S rRNA cDNA copies in the
present study. Finally, relative mtDNA copies, nDNA copies and
CLEC5A mRNA expression levels of analyzed samples were calculated after adjusting
with the mtDNA copies, nDNA copies and leukocyte CLEC5A mRNA
expression level of HC-No.42 as 1.000. Each reaction was done in duplicate to get
the average of data.
2.5 Determination of Plasma 8-OHdG
Part of the results of plasma 8-OHdG in the present analyses had been reported
in other studies for different purposes [20, 38]. An aliquot of 200 L of
plasma, filtered by an ultra-filter (CENTRICON®, Ultracel YM-10
membrane, Millipore, Amicon, USA) with a cut-off molecular weight of 10 kDa, was
subjected to centrifugation at 10,000 g at 4 °C for 2 hours to get rid
of the interfering substances. Then, an aliquot of 50 L of filtered plasma
was employed for the measurement of 8-OHdG content
by
using the highly sensitive 8-OHdG Check ELISA kit (Japan Institute for the
Control of Aging, Nikken SEIL Co., Ltd. Haruoka, Fukuroi, Shizuoka, Japan)
according to the manufacturer’s instructions. Each reaction was done in duplicate
to get the average for data presentation [20, 38].
2.6 Determination of Plasma MDA
In the present study, we measured the plasma MDA, without the hydrolysis of
plasma sample, by a spectrophotometric assay kit (MDA-586, OxisResearch, Inc.
Portland, OR, USA) according to the procedure recommended by the manufacturer,
which involved the reaction with a chromogenic reagent N-methyl-2-phenylindole
(NMPI) to form an intensely colored carbocyanine dye with a maximum absorption at
586 nm. A standard curve was established by using the referenced MDA samples at
the concentration range of 0–4 M and the plasma MDA levels in clinical
samples were then calculated [39].
2.7 Statistical Analysis
The results are presented as the mean standard deviation (mean
S.D.). The continuous variables between HCs and SLE patients were compared using
the t-test or Mann-Whitney U test when appropriate. The
continuous variables among HCs, SLE patients with SLEDAI 8 and SLE
patients with SLEDAI 8 or among HCs, SLE patients without clinical
manifestations and SLE patients with clinical manifestations were compared using
Jonckheere-Terpstra
trend test to demonstrate their trends of distributions. Alterations of
continuous variables before and after the treatment of rituximab were compared by
Wilcoxon signed-ranks test. Relationships between two continuous variables were
evaluated by using Pearson’s or Spearman’s rho correlation and are
presented with the correlation coefficient (CC). Differences and associations
were considered significant when p-values were less than 0.05.
3. Results
3.1 Demographic Data of the 80 SLE Patients
A total of 80 SLE patients (13 men) with a mean age of 45.4 years were
recruited. Their demographic data are listed in Table 1. Their mean and median
SLEDAI were 9.4 and 8, respectively. Their mean and median anti-dsDNA antibody
titers, serum complement 3 (C3) levels and serum complement 4 (C4) levels were
122.4 and 80 IU/ mL, 83.0 and 76.9 mg/dL, and 16.5 and 15.3 mg/dL, respectively.
Using the cutoff values of 15 IU/mL, 90 mg/dL and 10 mg/dL, 66 (82.5%),
52 (65.0%) and 9 (11.3%) SLE patients were classified as harboring positive
anti-dsDNA antibody, hypo C3 and hypo C4, respectively. Regarding the clinical
manifestations, 39 (48.8%) suffered from CNS involvement, 31 (38.8%) nephritis,
18 (22.5%) skin rash, 24 (30.0%) alopecia, 12 (15.0%) oral ulcer and 52
(65.0%) complement decrease, respectively.
Table 1.Demographic data of the 80 SLE patients recruited for this
study.
| Demographic data |
Mean S.D./n (%) |
| Gender |
|
|
Female/Male |
67 (83.8)/13 (16.3) |
| Age (yrs) |
45.4 12.7 |
| SLEDAI |
9.4 6.0 |
|
Median |
8 |
| Anti-dsDNA antibody titers (IU/mL) |
122.4 127.4 |
|
Median |
80.0 |
|
Positive anti-dsDNA antibody (15 IU/mL) |
66 (82.5) |
| Serum complement 3 (C3) levels (mg/dL) |
83.0 25.8 |
|
Median |
76.9 |
|
Hypo C3 (90 mg/dL) |
52 (65.0) |
| Serum complement 4 (C4) levels (mg/dL) |
16.5 7.4 |
|
Median |
15.3 |
|
Hypo C4 (10 mg/dL) |
9 (11.3) |
| CNS involvement |
39 (48.8%) |
| Nephritis |
31 (38.8%) |
| Skin rash |
18 (22.5%) |
| Alopecia |
24 (30.0%) |
| Ulcer |
12 (15.0%) |
| Complement decrease (Hypo C3, hypo C4 or both) |
52 (65.0%) |
| SLE, systemic lupus erythematosus; SLEDAI, SLE disease activity index; CNS,
central nervous system; , 15 IU/mL was classified as positive anti-dsDNA
antibody; , 90 mg/dL was classified as hypo C3; , 10 mg/dL was
classified as hypo C4; , hypo C3, hypo C4 or both were classified as
complement decrease. |
3.2 Distributions of mtDNA Copies, nDNA Copies,
Plasma MDA, Plasma 8-OHdG and Leukocyte CLEC5A mRNA Expression Levels among 43
HCs and 80 SLE Patients
SLE patients had lower mtDNA copies than did the HCs (median, 2.28
vs. 2.76; mean S.D., 4.81 6.33 vs. 9.83
14.20, p = 0.032, Table 2). On the contrary, SLE patients had higher
nDNA copies than the HCs (median, 2.12 vs. 1.77; mean
S.D., 2.84 1.99 vs. 2.00 0.88, p = 0.002, Table 2). Regarding the plasma markers reflecting oxidative damages, SLE patients had
higher levels of plasma 8-OHdG than HCs (median, 0.207 vs. 0.187; mean
S.D., 0.227 0.085 vs. 0.199 0.041, p =
0.016); but they had lower levels of plasma MDA than HCs (median, 1.82
vs. 4.06; mean S.D., 3.02 2.20 vs. 4.37
2.16, p = 0.001, Table 2). The leukocyte CLEC5A mRNA expression levels
did not differ significantly between SLE patients and HCs (median, 0.781
vs. 0.965; mean S.D., 1.21 1.17 vs. 1.26
1.05, p = 0.870, Table 2).
Table 2.Distributions of mtDNA copies, nDNA copies,
plasma MDA, plasma 8-OHdG and leukocyte CLEC5A mRNA among 43 HCs and 80 SLE
patients.
| Parameters |
HCs (n = 43) |
SLE (n = 80) |
p-value |
| Plasma cell-free DNA (DNA) |
|
|
|
|
mtDNA copies |
|
|
|
|
|
Mean S.D. |
9.83 14.20 |
4.81 6.33 |
0.032 |
|
|
Median |
2.76 |
2.28 |
|
|
nDNA copies |
|
|
|
|
|
Mean S.D. |
2.00 0.88 |
2.84 1.99 |
0.002 |
|
|
Median |
1.77 |
2.12 |
|
| Plasma oxidative damage markers |
|
|
|
|
8-OHdG (ng/mL) |
|
|
|
|
|
Mean S.D. |
0.199 0.041 |
0.227 0.085 |
0.016 |
|
|
Median |
0.187 |
0.207 |
|
|
MDA (M) |
|
|
|
|
|
Mean S.D. |
4.37 2.16 |
3.02 2.20 |
0.001 |
|
|
Median |
4.06 |
1.82 |
|
| Parameter |
HCs (n = 24) |
SLE (n = 42) |
p-value |
| Leukocyte CLEC5A mRNA level |
|
|
|
|
Mean S.D. |
1.26 1.05 |
1.21 1.17 |
0.870 |
|
Median |
0.965 |
0.781 |
|
| mtDNA, mitochondrial DNA; mtDNA copies, plasma cell-free mtDNA copies;
nDNA, nuclear DNA; nDNA copies, plasma cell-free nDNA copies; MDA,
malondialdehyde; 8-OHdG, 8-hydroxy-2’-deoxyguanosine; CLEC5A, C-type lectin
domain family 5 member A; HC, healthy control; SLE, systemic lupus erythematosus;
comparison between HC
and SLE patients, using t-test or Mann-Whitey U test when
appropriate. |
3.3 Distributional Changes in mtDNA Copies and nDNA
Copies among 43 HCs and 80 SLE Patients without or with the Presence of Different
Clinical Manifestations
Among HCs, SLE patients with less activity (SLEDAI 8) and SLE patients
with higher activity (SLEDAI 8), they exhibited a trend of decreasing
mtDNA copies in order (median, 2.76, 2.73 and 2.14; mean S.D.,
9.83 14.20, 6.28 7.91 and 3.19 3.35, p = 0.054;
Table 3, Left). Although not significant, such a trend of decrease was also
observed among HCs, SLE patients without complement decrease and SLE patients
with complement decrease (median, 2.76, 2.62 and 2.03; mean S.D., 9.83
14.20, 5.02 5.49 and 4.70 6.79, p = 0.062; Table 3, Left) and among HCs, SLE patients without nephritis and SLE patients with
nephritis (median, 2.76, 2.27 and 2.28; mean S.D., 9.83 14.20,
5.38 6.95 and 3.90 5.18, p = 0.082; Table 3, Left).
However, such a trend in mtDNA copies were not conspicuous regarding the abnormal
anti-dsDNA antibody (p = 0.360), CNS involvement (p = 0.133),
skin rash (p = 0.254), alopecia (p = 0.273) nor oral ulcer
(p = 0.343), respectively (Table 3, left).
Table 3.Fluctuation of the distributions in mtDNA copies and
nDNA copies from 43 HCs to 80 SLE patients with the absence or presence
of different clinical manifestations.
|
mtDNA copies |
nDNA copies |
| Mean S.D. |
Median |
p-value |
Mean S.D. |
Median |
p-value |
| Disease activity index (DAI) |
|
|
0.054 |
|
|
0.333 |
|
HCs (n = 43) |
9.83 14.20 |
2.76 |
|
2.00 0.88 |
1.77 |
|
|
SLEDAI 8 (n = 42) |
6.28 7.91 |
2.73 |
|
3.14 2.22 |
2.21 |
|
|
SLEDAI 8 (n = 38) |
3.19 3.35 |
2.14 |
|
2.50 1.67 |
1.96 |
|
| Anti-dsDNA antibody status |
|
|
0.360 |
|
|
0.475 |
|
HCs (n = 43) |
9.83 14.20 |
2.76 |
|
2.00 0.88 |
1.77 |
|
|
SLE with anti-dsDNA antibody 15 IU/mL (n = 14) |
3.72 5.87 |
1.75 |
|
4.43 2.77 |
4.62 |
|
|
SLE with anti-dsDNA antibody 15 IU/mL (n = 66) |
5.04 6.44 |
2.43 |
|
2.50 1.62 |
2.00 |
|
| CNS status |
|
|
0.133 |
|
|
0.696 |
|
HCs (n = 43) |
9.83 14.20 |
2.76 |
|
2.00 0.88 |
1.77 |
|
|
SLE without CNS involvement (n = 41) |
6.17 8.04 |
2.02 |
|
3.23 2.03 |
2.42 |
|
|
SLE with CNS involvement (n = 39) |
3.38 3.36 |
2.28 |
|
2.42 1.89 |
1.80 |
|
| Renal status |
|
|
0.082 |
|
|
0.043 |
|
HCs (n = 43) |
9.83 14.20 |
2.76 |
|
2.00 0.88 |
1.77 |
|
|
SLE without nephritis (n = 49) |
5.38 6.95 |
2.27 |
|
2.63 1.74 |
2.01 |
|
|
SLE with nephritis (n = 31) |
3.90 5.18 |
2.28 |
|
3.16 2.34 |
2.53 |
|
| Skin status |
|
|
0.254 |
|
|
0.069 |
|
HCs (n = 43) |
9.83 14.20 |
2.76 |
|
2.00 0.88 |
1.77 |
|
|
SLE without skin rash (n = 62) |
4.41 5.22 |
2.16 |
|
2.83 2.06 |
2.03 |
|
|
SLE with skin rash (n = 18) |
6.17 9.28 |
2.30 |
|
2.87 1.80 |
2.29 |
|
| Scalp status |
|
|
0.273 |
|
|
0.073 |
|
HCs (n = 43) |
9.83 14.20 |
2.76 |
|
2.00 0.88 |
1.77 |
|
|
SLE without alopecia (n = 56) |
4.49 5.41 |
2.27 |
|
2.78 2.03 |
2.12 |
|
|
SLE with alopecia (n = 24) |
5.55 8.18 |
2.3 |
|
2.96 1.95 |
2.22 |
|
| Oral mucosa |
|
|
0.343 |
|
|
0.188 |
|
HCs (n = 43) |
9.83 14.20 |
2.76 |
|
2.00 0.88 |
1.77 |
|
|
SLE without ulcer (n = 68) |
4.56 6.03 |
2.03 |
|
2.90 2.01 |
2.21 |
|
|
SLE with ulcer (n = 12) |
6.23 7.98 |
3.12 |
|
2.45 1.94 |
1.87 |
|
| Complement status |
|
|
0.062 |
|
|
0.411 |
|
HCs (n = 43) |
9.83 14.20 |
2.76 |
|
2.00 0.88 |
1.77 |
|
|
SLE without complement decrease (n = 28) |
5.02 5.49 |
2.62 |
|
3.22 1.96 |
2.40 |
|
|
SLE with complement decrease (n = 52) |
4.70 6.79 |
2.03 |
|
2.63 2.00 |
1.98 |
|
| mtDNA, mitochondrial DNA; mtDNA copies, plasma cell-free mtDNA copies;
nDNA, nuclear DNA; nDNA copies, plasma cell-free nDNA copies; HC, healthy
control; SLE, systemic lupus erythematosus; SLEDAI, SLE disease activity index;
CNS, central nervous system; Comparison among HCs, SLE patients with SLEDAI
8 and SLE patients with SLEDAI 8 or among HCs, SLE patients without
clinical manifestations and SLE patients with clinical manifestations (e.g.,
abnormal anti-dsDNA antibody, CNS involvement, nephritis, skin rash, alopecia,
oral ulcer or complement decrease), using Jonckheere-Terpstra trend test to
demonstrate their trends of distributions. |
Regarding the distributions of nDNA copies among HCs, SLE patients
without nephritis and SLE patients with nephritis, they exhibited a tendency of
increase (median, 1.77, 2.01 and 2.53; mean S.D., 2.00 0.88, 2.63
1.71 and 3.24 2.40, p = 0.043; Table 3, Right). Although
there seemed to have an inclination, such a trend was present regarding the
individual domain of involvement including skin rash (p = 0.069) and
alopecia (p = 0.073) (Table 3, Right). Otherwise, the distributions of
nDNA copies were irrelevant to the score of SLEDAI (p = 0.333),
abnormal anti-dsDNA antibody (p = 0.475), CNS involvement (p =
0.696), oral ulcer (p = 0.188) nor complement decrease (p =
0.411) (Table 3, Right).
3.4 The
Distributions of mtDNA and nDNA Copies and Their Association with
Plasma 8-OHdG, Plasma MDA and Leukocyte CLEC5A mRNA Expression Levels in 43 HCs
and 80 SLE Patients
As shown in Table 4, among 80 SLE patients, their distributions of mtDNA
copies were not related to the distribution of plasma 8-OHdG (p = 0.471)
nor plasma MDA (p = 0.132). However, it is interesting that their
distributions of nDNA copies were positively correlated with plasma
8-OHdG (p 0.001; CC = 0.457) and negatively correlated with plasma
MDA (p = 0.019; CC = –0.262), respectively.
Table 4.The distribution of mtDNA and nDNA copies along
with their association to plasma 8-OHdG, MDA and leukocyte CLEC5A mRNA in 43 HCs
and 80 SLE patients.
|
mtDNA copies |
nDNA copies |
| Association of |
Overall (n = 123) |
HCs (n = 43) |
SLE (n = 80) |
Overall (n = 123) |
HCs (n = 43) |
SLE (n = 80) |
| Plasma 8-OHdG |
|
|
|
|
|
|
|
CC |
0.100 |
0.392 |
0.082 |
0.460 |
0.366 |
0.457 |
|
p-value |
0.273 |
0.009 |
0.471 |
0.001 |
0.016 |
0.001 |
| Plasma MDA |
|
|
|
|
|
|
|
CC |
–0.142 |
–0.214 |
–0.170 |
–0.251 |
0.030 |
–0.262 |
|
p-value |
0.117 |
0.167 |
0.132 |
0.005 |
0.849 |
0.019 |
| Association of |
Overall (n = 66) |
HCs (n = 24) |
SLE (n = 42) |
Overall (n = 66) |
HCs (n = 24) |
SLE (n = 42) |
| Leukocyte CLEC5A mRNA level |
|
|
|
|
|
|
|
CC |
–0.344 |
–0.677 |
–0.200 |
0.253 |
0.501 |
0.199 |
|
p-value |
0.005 |
0.001 |
0.205 |
0.040 |
0.013 |
0.207 |
| mtDNA, mitochondrial DNA; mtDNA copies, plasma cell-free mtDNA copies;
nDNA, nuclear DNA; nDNA copies, plasma cell-free nDNA copies; 8-OHdG,
8-hydroxy-2’-deoxyguanosine; MDA, malondialdehyde; CLEC5A, C-type lectin domain
family 5 member A; HC, healthy control; SLE, systemic lupus erythematosus; CC,
correlation coefficient; , Pearson or Spearman’s rho correlation
coefficient (CC) if appropriate. |
Among the 43 HCs, their distributions of mtDNA copies (p =
0.009, CC = 0.392) and nDNA copies (p = 0.016, CC = 0.366) were
positively correlated with the levels of plasma 8-OHdG, significantly. On the
contrary, their distributions of mtDNA copies (p = 0.167) and
nDNA copies (p = 0.849) were not related to the levels of plasma
MDA (Table 4).
Significantly, the leukocyte CLEC5A mRNA levels were related inversely to
mtDNA copies (p 0.001, CC = –0.677) and positively to
nDNA copies (p = 0.013, CC = 0.501) among the analyzed 24 HCs.
However, leukocyte CLEC5A mRNA levels were not related to mtDNA copies
(p = 0.205) and nDNA copies (p = 0.207), respectively,
among the 42 analyzed SLE patients.
3.5 Alterations of mtDNA Copies, nDNA Copies and
Plasma 8-OHdG, Plasma MDA and Leukocyte CLEC5A mRNA Expression Levels in 3 SLE
Patients Undergoing Rituximab Treatment
In Table 5, changes of mtDNA copies, nDNA copies and plasma
8-OHdG, plasma MDA and leukocyte CLEC5A mRNA expression levels in 3 SLE patients
undergoing rituximab treatment are listed. Because only the data of 3 patients
were analyzed, the clinical relevance was limited and insufficient to draw a
conclusion. Nevertheless, regarding the alterations of mtDNA copies and
leukocyte CLEC5A mRNA expression levels, the changes were universally increased
although not statistically significant (p = 0.109).
Table 5.Alterations of mtDNA copies, nDNA copies and
plasma 8-OHdG, plasma MDA and leukocyte CLEC5A mRNA expression levels in 3 SLE
patients undergoing rituximab treatment.
|
Case |
Pre-rituximab |
Post-rituximab |
Alterations |
p-value |
| Plasma cell-free DNA (DNA) |
|
|
|
|
|
|
mtDNA |
|
|
|
|
0.109 |
|
|
A |
0.37 |
5.96 |
Increase |
|
|
|
B |
1.11 |
2.02 |
Increase |
|
|
|
C |
3.35 |
142.67 |
Increase |
|
|
nDNA |
|
|
|
|
0.285 |
|
|
A |
0.14 |
0.30 |
Increase |
|
|
|
B |
1.94 |
1.01 |
Decrease |
|
|
|
C |
8.05 |
3.68 |
Decrease |
|
| Plasma oxidative damage markers |
|
|
|
|
|
|
8-OHdG (ng/mL) |
|
|
|
|
0.593 |
|
|
A |
0.532 |
1.251 |
Increase |
|
|
|
B |
0.949 |
0.706 |
Decrease |
|
|
|
C |
0.572 |
0.687 |
Increase |
|
|
MDA (M) |
|
|
|
|
0.593 |
|
|
A |
2.25 |
2.76 |
Increase |
|
|
|
B |
5.03 |
3.84 |
Decrease |
|
|
|
C |
1.06 |
1.03 |
Decrease |
|
| Leukocyte CLEC5A mRNA level |
|
|
|
|
0.109 |
|
|
A |
0.60 |
3.16 |
Increase |
|
|
|
B |
2.54 |
3.25 |
Increase |
|
|
|
C |
0.74 |
3.24 |
Increase |
|
mtDNA, mitochondrial DNA; mtDNA copies, plasma cell-free mtDNA copies;
nDNA, nuclear DNA; nDNApcf copies, plasma cell-free nDNA copies; 8-OHdG,
8-hydroxy-2’-deoxyguanosine; MDA, malondialdehyde; CLEC5A, C-type lectin domain
family 5 member A; , Wilcoxon signed-rank test.
Case A, nephritis, pleuritis and pericarditis; Case B, acute lupus nephritis and
rapidly progressive glomerulonephritis undergoing dialysis; Case C, severe
pulmonary arterial hypertension. |
4. Discussion
In summary, we have demonstrated that: (1) SLE patients tended to have lower
mtDNA copies, higher nDNA copies, higher levels of plasma 8-OHdG,
and lower levels of plasma MDA than did HCs, but they had similar leukocyte
CLEC5A mRNA levels (Table 2). (2) SLE patients with higher SLEDAI tended to have
lower mtDNA copies, and SLE patients with nephritis had higher
nDNA copies but lower mtDNA copies (Table 3). (3) In SLE
patients, higher nDNA copies were correlated with higher levels of plasma
8-OHdG but lower levels of plasma MDA (Table 4). (4) In HCs, higher nDNA
or lower mtDNA copies were associated with higher leukocyte CLEC5A mRNA
expression levels, which showed no associations in SLE patients (Table 4) and (5)
In active SLE patients, increases in mtDNA copies and leukocyte CLEC5A
mRNA levels were found after rituximab treatment (Table 5). We have thus
speculated that lower mtDNA copies, higher nDNA copies, oxidative
damages/stress as well as dysregulated leukocyte CLEC5A expression might be
implicated in the pathogenesis of SLE. A proposed mechanism is illustrated in
Fig. 1.
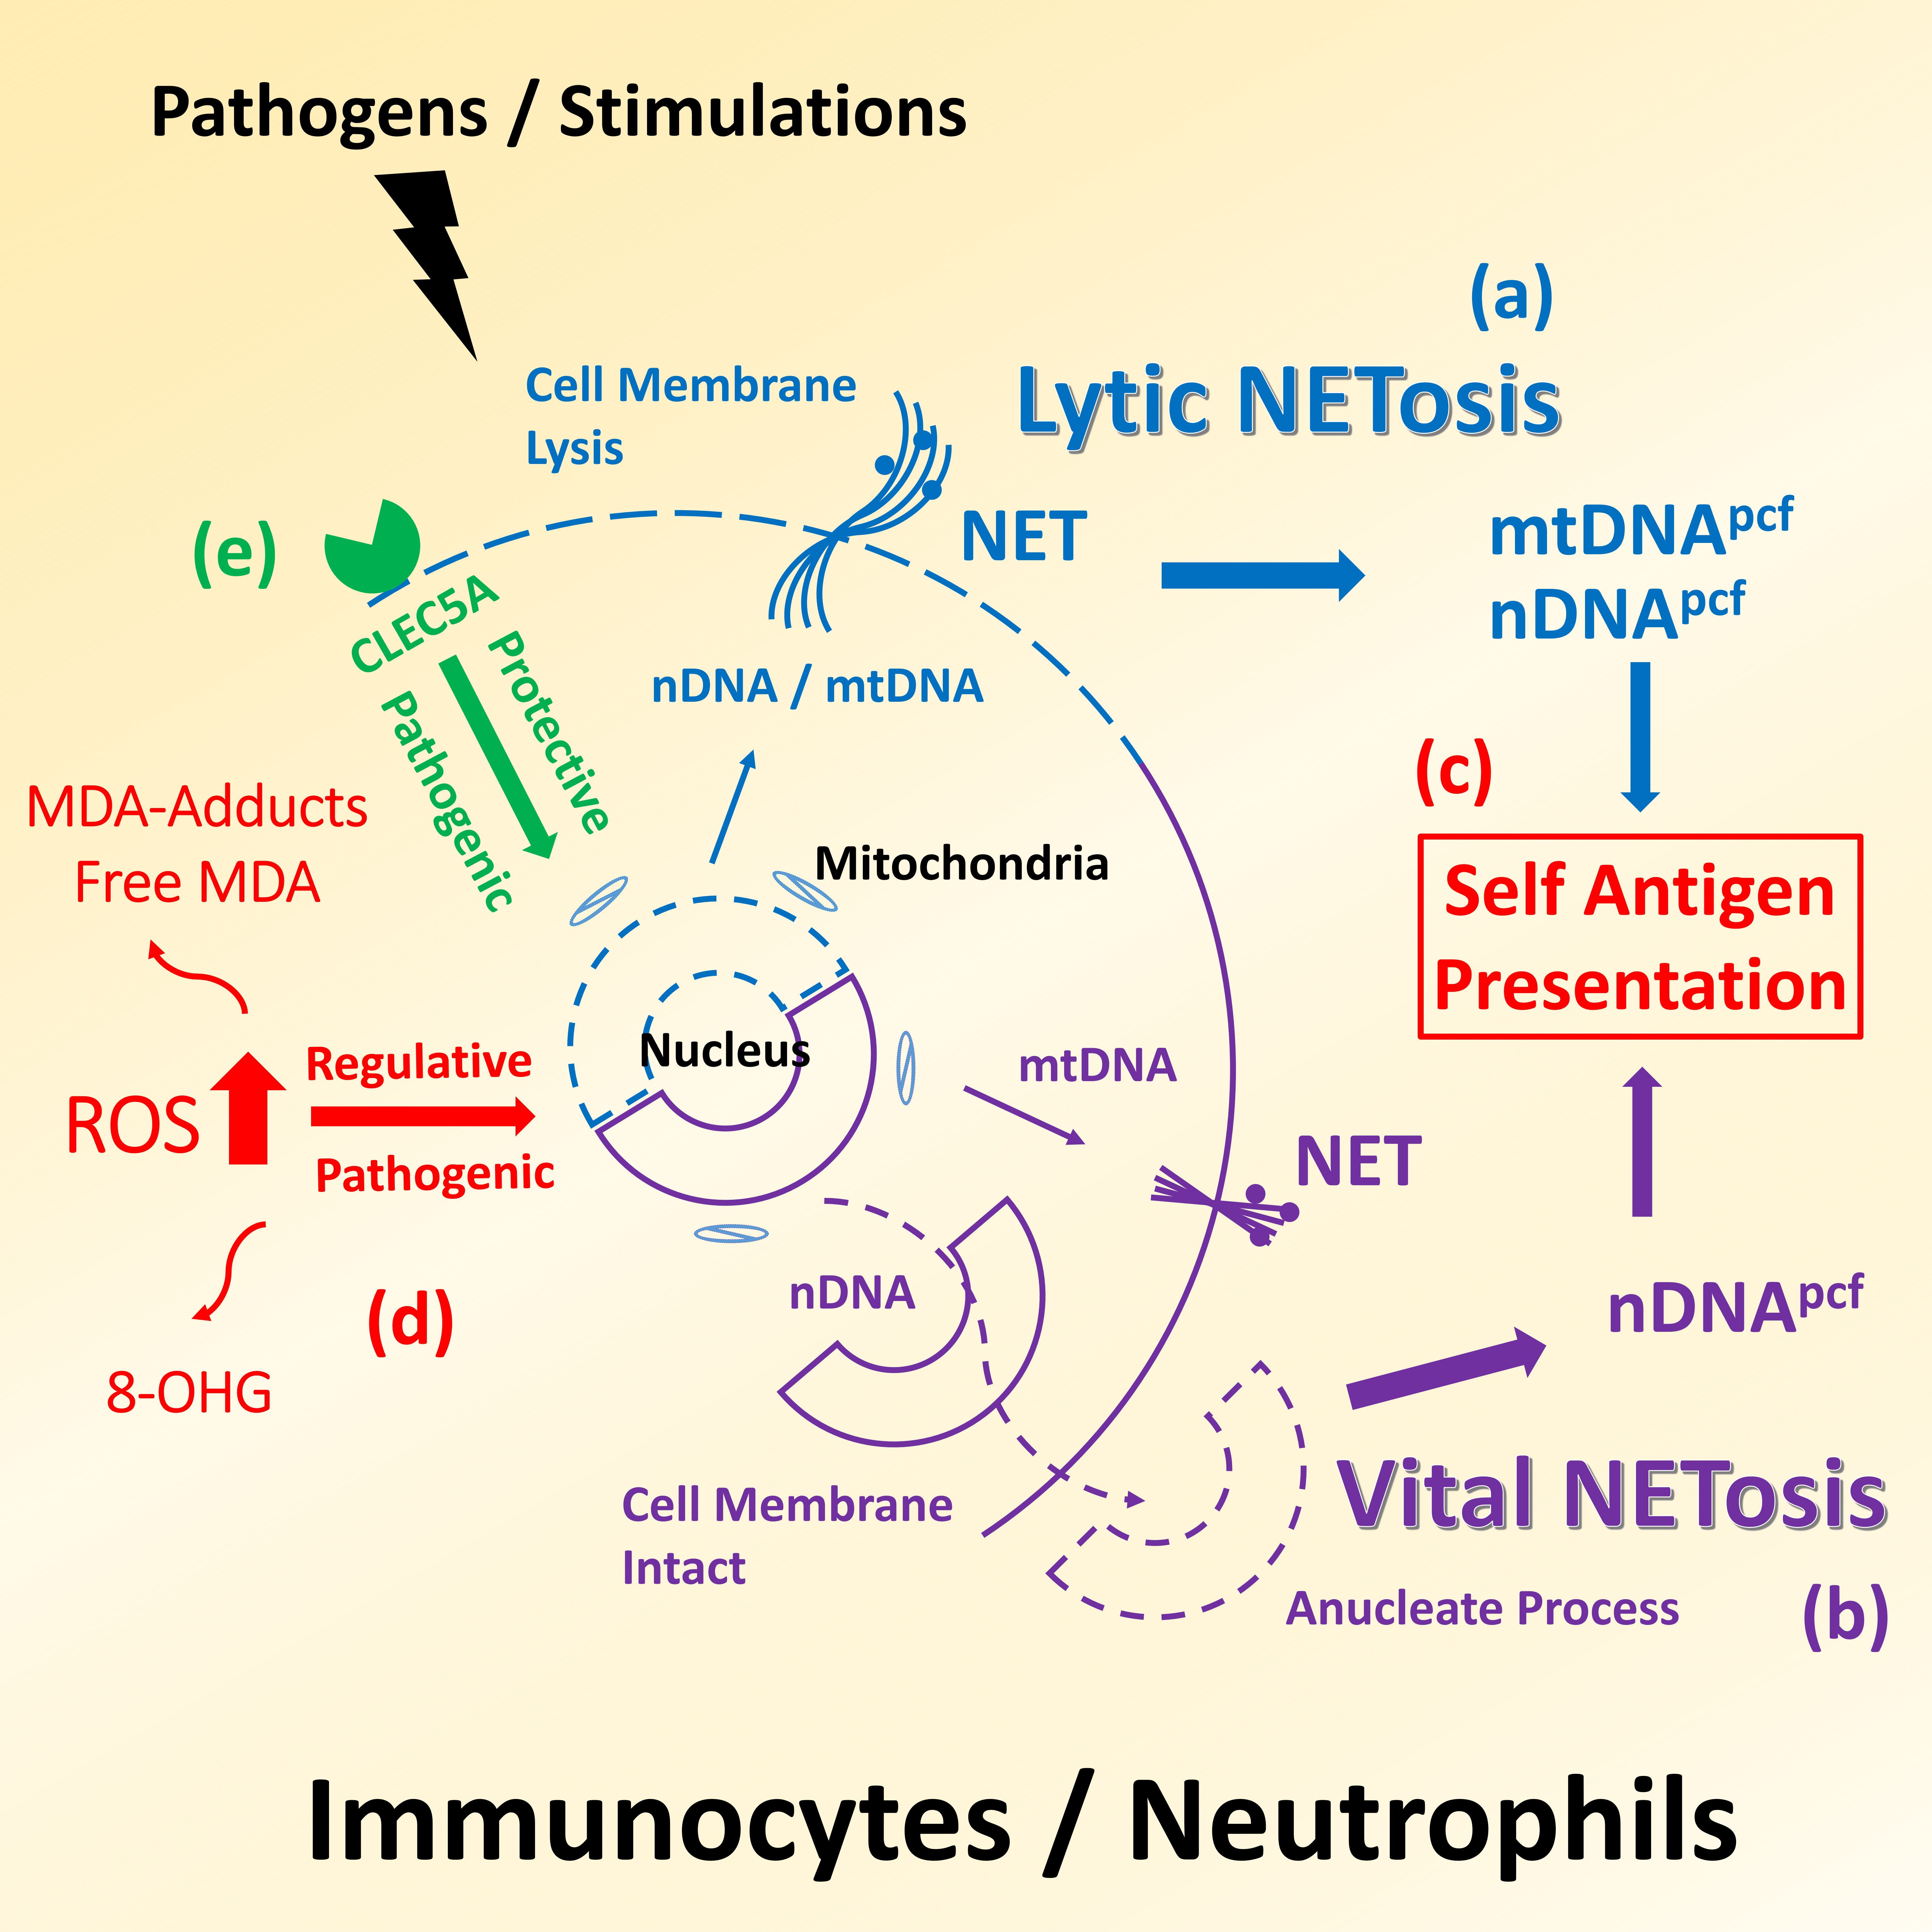 Fig. 1.
Illustration is a proposed mechanism of DNA released
from immunocytes/neutrophils under pathogen invasion or stress stimulations,
which is involved in the self-antigen presentation in SLE pathogenesis. (a)
Lytic NETosis, DNA molecules, including nDNA and mtDNA, as well as other proteins
in extruded NET can entangle the pathogens and trigger immune reactions to result
in a subsequent lysis of their own cell membrane and the death of invading
microbes. (b) Vital NETosis, different from the cell death during lytic NETosis,
some immune cells secrete only mtDNA, harboring high immunogenicity, into NET,
which enable them to maintain alive even if they become anucleate. (c) Both lytic
and vital NETosis could cause the release of DNA into blood circulation and
involve the presentation of self-antigen. (d) ROS plays an important regulator in
adjusting NETois, and the degrees of ROS-elicited modifications could be
reflected by the abundance of 8-OHdG and MDA. (e) CLEC5A can drive human immune
response to defend viral infections and is a critical receptor in innate immune
system causing NETosis.
Higher levels of DNA in SLE patients was first described by Tan
et al. in 1966 [17]. Up to now, DNA has been regarded as an
important biomarker in autoimmune rheumatic diseases [40]. Nevertheless,
DNA including mtDNA and nDNA and their potential
implications in disease development were less explored in SLE. Giaglis et
al. [41] reported that a high level of DNA is resulted from
mtDNA rather than from nDNA in SLE. However, Truszewska
et al. [42] found that high DNA is due to high nDNA in
SLE. They also failed to find differences in mtDNA copies between SLE
patients and HCs. The present investigation has revealed higher nDNA but
lower mtDNA copies in SLE patients compared with those of HCs (Table 2).
Similar to the Q-PCR protocol described by Giaglis and Truszewska and those
reported in the literature [41, 42, 43], we measured the mtDNA and
nDNA copies in a given volume through the established standard curves.
There are small differences between the absolute copies reported by Giaglis and
Truszewska and the relative copies detected in the present investigation.
Although the data by Giaglis and Truszewska were generated in more precise
manner, the results of the present study could still provide useful information.
So to speak, our patients exhibited higher SLEDAI of 8 in median than the cohort
in Truszewska’s of 7.42 in average or in Giaglis’ of 2 in median, indicating more
severe clinical manifestations in our patients. These similarities and
disparities suggest that the mechanism underlying the release of intracellular
DNA into plasma to become nDNA or mtDNA in SLE patients needs
re-appraisal. Through cell death, degradation or damage and
extrusion of intracellular
molecules, partial or complete genomes from in situ or nearby tissue
cells that may or may not contain invading viruses or microbes, would be
continuously shed into human body fluids to form DNA [44]. Different from
the other types of DNA, most DNA are originated from hemopoietic
cells [12]. As a result, necrosis, apoptosis, degradation or damages of
dysregulated SLE-immunocytes might be the major contributors to the release of
SLE-DNA [40, 45]. Among the different types of immunocytes, neutrophil is
the most abundant one with plenty of DNA molecules and has been implicated in the
trigger and perpetuation of SLE [46]. DNA from dysregulated neutrophils
might be involved in the pathogenesis of SLE.
Similar to necrosis, apoptosis or exocytosis of general cells, neutrophils are
able to undergo a unique mechanism of metamorphosis resulting in neutrophil
extracellular trap (NET), which is accordingly called “NETosis”, to deal with
the invading pathogens or sterile inflammation (Fig. 1). Stimulated by ROS and
extruding web-like NET, which is composed of a nucleus-derived decondensed DNA
coated with histones, granular proteins, and cytoplasmic proteins, into the
extracellular space, some neutrophils can entangle the pathogens and trigger
immune reactions to result in a lysis of their own cell membrane and the death of
invading microbes, termed lytic NETosis (Fig. 1a) [47]. Different from the lytic
NETosis, some “immortal neutrophils” may undergo vital NETosis to keep intact
cell membranes, in which they only extrude a small amount of mtDNA into NET,
allowing themselves to remain alive and continue to exert antimicrobial activity,
even if they become anucleated (Fig. 1b) [48, 49]. Through the release of
neutrophil nDNA and mtDNA, NETosis might lead to a self-antigen
exposure and participate in the pathogenesis of SLE (Fig. 1c) [40, 50, 51].
As shown in Fig. 1, both lytic and vital NTEosis in neutrophils could contribute
to the release of nDNA molecules, which could account for our results of higher
nDNA in SLE patients than in HCs (Table 2). In our cohort, SLE patients
tended to present lower levels of mtDNA (Table 2) and such a decrease was
highly correlated with the high SLEDAI (Table 3). This implies that mtDNA are
captured in the NET without releasing into the plasma, which is a possible result
of vital NETosis. The mtDNA-enriched NET may triggered a vicious cycle of immune
response because the high CpG motif in mtDNA that would propagate immunogenicity
cascade in innate immunity [52]. Therefore, based on the findings of low
mtDNA copies and higher median SLEDAI of 8 as demonstrated in our cohort,
similar mtDNA copies and less higher mean SLEDAI of 7.42 in Truszewska’s
cohort [42] or high mtDNA copies but low median SLEDAI of 2 in Giaglis’
cohort [41], we speculated that the different results of mtDNA or
nDNA might be hybrid results from diverse proportions of lethal (lytic)
and vital NETosis (Fig. 1a–c) regulated by oxidative stress (Fig. 1d). To
validate this speculation, we need again to evaluate the NETosis activity and the
differences among intracellular DNA, cell membrane-bound DNA and DNA of
SLE patients in the future.
Lupus nephritis is an important clinical manifestation in SLE, and the role of
oxidative DNA damage has been evaluated [53]. However, the role of DNA
remained unclear. Because 8-OHdG is a stabilized product after oxidative DNA
damage, it is an optimal marker to reflect the ROS levels. Our preliminary
results showed that SLE patients harbored higher levels of plasma 8-OHdG and
higher nDNA copies than did HCs’ (Table 2), and the high plasma 8-OHdG
levels were related to high nDNA copies among SLE patients (Table 4). It
is suggested that high oxidative stress might cause an abundant release of
nDNA from impaired leukocytes during NETosis. We also found that SLE
patients with nephritis had higher nDNA copies (Table 3), suggesting that
damaged kidney might be related to impaied clearance of NET remnant or
nDNA. As a result, higher nDNA copies were detected and the
vicious cycle sustained. On the contrary, we did not find any association between
the levels of plasma 8-OHdG and mtDNA copies in SLE patients, but SLE
patients with nephritis tended to have a lower mtDNA copies (p =
0.082) (Table 3). However, Fernandez et al. [54], reported that an
elevation in mtDNA would define a subgroup of SLE patients with
membranous lupus nephritis. Due to the dynamic changes of intracellular and
extracellular mtDNA molecules and the inconsistency in reported literature,
Truszewska normalized their ratios between intra to extra cellular mtDNA copy
number to correlate the occurrence of nephritis, and it showed good association
[42]. Besides the mtDNA, the high levels of urine mtDNA contents from
damaged kidney (i.e., a kind of mtDNA in urine) have been advocated to
correlate severity of nephritis [55, 56]. The precise role of mtDNA either
intracellular or extracellular to reflect lupus nephritis needs further
investigation.
On the other hand, we failed to observe a higher level of plasma MDA in SLE
patients (Table 2) and the levels of plasma MDA were inversely correlated with
that of nDNA (Table 4). Unlike the stabilized 8-OHdG, MDA is the
peroxidized product of lipid with highly reactive activity, the unstable free
form could conjugate with proteins through covalent alterations of amide and
amine groups of peptides to form MAD adducts at a post-translational level,
giving rise to neo-epitopes that can elicit autoantibody responses [52]. The
literature has demonstrated that high levels of MDA adducts would trigger obvious
autoimmune reactivity in SLE patients [57]. Similar to oxidized low density
lipoprotein, MDA adducts could induce the formation of NET and propagate immune
reaction [58]. More precisely speaking, MDA could exist in free and conjugated
(adduct) forms, and a free form MDA could positively extrapolate total MDA to
predict oxidative stress in exhaled breath condensate as well as urine. But the
relevant role of free MDA in plasma/serum, nasal fluid, or saliva to predict
total MDA remained controversial and dismal. Different proportions of free MDA
and conjugated MDA (MDA-adducts) in different clinical samples might account for
these discrepancies [59, 60]. In the present study, what we measured was the free
plasma MDA rather than MDA adducts and lower levels of plasma MDA were inversely
correlated with high nDNA copies in SLE patients (Table 4). It is
suggested that large amounts of MDA were underestimated because of the presence
of high proportion of MDA-protein adducts in SLE patients.
CLEC5A can drive human immune response to defense viral infections [29, 37].
Recent studies showed that CLEC5A is a critical receptor in innate immune system,
causing NETosis to deal with Dangue virus [28, 37] or Japanese encephalitis virus
[61]. Among the 24 HCs, we found that higher levels of leukocyte CLEC5A mRNA
level were associated with higher nDNA copies or a lower mtDNA
copies, suggesting a possible role of DNA in CLEC5A related immune
response (Table 4). High nDNA in the NET is required for neutrophils to trigger
suicidal NETosis and to defend against invading pathogens [62]. The present
results have indicated that the leukocytes in healthy subjects hold functional
CLEC5A to trigger proper immune reaction. In contrast, such function may vanish
or be dampened in SLE patients, because the above association becomes absent
among SLE leukocyte CLEC5A mRNA transcripts and nDNA copies, suggesting
an impaired leukocytes/neutrophils in SLE [46]. Influenza infection in bone
marrow-derived macrophages of CLEC5A mice (dampened CLEC5A) would induce
an increase in the secretion of IFN- [29], which is similar to the IFN
signature in SLE [26]. Of note, although the added cohort of 3 SLE patients was
small in number, the present preliminary results showed an increase of leukocyte
CLEC5A mRNA level after the treatment with rituximab (Table 5). Taken together,
we propose that an aberrant expression and impaired function of CLEC5A may be
implicated in the pathogenesis of SLE.
Similar to CLEC5A, cyclic guanosine monophosphate (GMP) - adenosine
monophosphate (AMP) synthase (cGAS) is also a member of PRR to act as an
additional first-line host immune defense that can
induce type I IFN response through its
interaction with downstream stimulator of interferon genes (STING), i.e., the
cGAS-STING pathway [63]. Recently, many immunological studies have focused on the
cGAS-STING pathway as another player in the pathogenesis of autoimmune diseases,
including SLE [64]. It is speculated that cGAS could sense and interact with free
plasma intrinsic or extrinsic DNA fragments derived from engulfed NETs to trigger
immune cascade [65]. This process would be more potent if the cGAS is stimulated
by free mtDNA fragments [66, 67]. Intriguingly, in the present investigation, we
observed that SLE patients with higher SLEDAI tended to have lower mtDNA
copies extracellularly. But we have also demonstrated a lower mtDNA copy number
intracellularly in our previous report [35]. In addition, the mtDNA
copies was increased after rituximab treatment in severe SLE patients (Table 5).
These dynamic alterations of mtDNA strengthen the possibility of the interaction
among mtDNA molecules and consumption of mtDNA fragments through PRR,
cGAS or CLEC5A, which might contribute to the pathogenesis of SLE.
Viral infection has been proposed to play a role in the SLE pathogenesis. A
meta-analysis demonstrated that SLE patients express higher IgG titers to EBV
viral capsid antigen (VCA) and early antigen (EA), and exhibit higher positive
rates for EBV DNA [68]. Furthermore, thanks to the new computational methods to
account for the genetics of human diseases, it has been found that nearly half of
SLE risk loci are occupied by the Epstein-Barr nuclear antigen 2 (EBNA2) protein
and many co-cluster with human transcription factors [69]. As to the lupus
nephritis, some studies have revealed that a higher serum EBV load is associated
with renal damage, and the involved kidneys can express higher EBV-latent
membrane protein‑1 (EBV-LMP1) and EBV-encoded RNA 1 (EBER-1) [70, 71]. Notably,
higher EBV loads were correlated with higher DNA levels in SLE patients
[70]. The measurement of DNA copies to dissect the interrelations between
EBV infection and self-antigen presentation in SLE requires further
investigations.


 , Yau-Huei Wei 7,*