


 , Konstantin Lepikhov 2, Charlotte Dahlem 1, Hanna S. Schymik 1, Jessica Hoppstädter 1, An-Kristin Geber 2, Konrad Wagner 3, Sonja M. Kessler 1,4,5, Martin Empting 1,3, Alexandra K. Kiemer 1,6,*
1 Department of Pharmacy, Pharmaceutical Biology, Saarland University, 66123 Saarbrücken, Germany
2 Department of Genetics, Saarland University, 66123 Saarbrücken, Germany
3 Department of Drug Design and Optimization, Helmholtz Institute for Pharmaceutical Research Saarland (HIPS), Saarland University, 66123 Saarbrücken, Germany
4 Halle Research Centre for Drug Therapy (HRCDT), 06120 Halle, Germany
5 Institute of Pharmacy, Experimental Pharmacology for Natural Sciences, Martin Luther University Halle-Wittenberg, 06120 Halle, Germany
6 Center for Gender-Specific Biology and Medicine (CGBM), 66421 Homburg, Germany
Abstract
Background: The RNA-binding protein IGF2BP2/IMP2/VICKZ2/p62 is an oncofetal protein that is overexpressed in several cancer entities. Employing IMP2 knockout colorectal cancer cells, we could show the important role of IMP2 in several hallmarks of cancer. This study aimed to functionally characterize IMP2 in lung (A549, LLC1) and hepatocellular carcinoma (HepG2, Huh7) cell lines to assess its role as a potential target for these cancer entities. Methods: IMP2 knockouts were generated by CRISPR/Cas9 and its variant approach prime editing; the editing efficiency of two single guide RNAs (sgRNAs) was verified via next-generation sequencing. We studied the effect of IMP2 knockout on cell proliferation, colony formation, and migration and employed small-molecule inhibitors of IMP2. Results: Despite multiple attempts, it was not possible to generate IMP2 biallelic knockouts in A549 and Huh7 cells. Both sgRNAs showed good editing efficiency. However, edited cells lost their ability to proliferate. The attempt to generate an IMP2 biallelic knockout in LLC1 cells using CRISPR/Cas9 was successful. Monoallelic knockout cell lines of IMP2 showed a reduction in 2D cell proliferation and reduced migration. In 3D cultures, a change in morphology from compact spheroids to loose aggregates and a distinct reduction in the colony formation ability of the IMP2 knockouts was observed, an effect that was mimicked by previously identified IMP2 inhibitor compounds that also showed an inhibitory effect on colony formation. Conclusions: Our in vitro target validation supports that IMP2 is essential for tumor cell proliferation, migration, and colony formation in several cancer entities.
Keywords
- RNA binding protein
- IGF2BP2/IMP2
- CRISPR/Cas9
- hallmarks of cancer
- cell proliferation
- colony formation
- cell migration
- live cell imaging
RNA-binding proteins (RBPs) play an essential role in several cellular functions related to the maturation, stabilization, and localization of mRNAs, as well as the translation of mRNA targets [1]. Insulin-like growth factor 2 (IGF2) mRNA binding proteins (IGF2BPs/IMPs/VICKZs) are oncofetal RBPs overexpressed in several cancers [2], such as lung [3, 4], colorectal [5], and liver cancer [6, 7]. The term IMP2 denotes the protein form, while IGF2BP2 and Igf2bp2 refer to the human and murine gene expression, respectively.
High IGF2BP2 expression is associated with reduced patient survival and poor prognosis in colon [8, 9, 10, 11], liver [10, 12], and lung carcinomas [3]. Several studies have suggested a crucial role of IMP2 in promoting tumor cell hallmarks, such as cell proliferation, colony formation, and migration, in cancer [9, 13, 14, 15]. These studies utilized siRNA-mediated knockdown of IGF2BP2. However, siRNA only provides temporary gene silencing at the mRNA level and might exert distinct unspecific effects [16], while CRISPR/Cas9 enables complete and permanent silencing at the DNA level, inducing mutations that result in protein knockout [17]. CRISPR/Cas9-generated single-cell clones are valuable for investigating protein function, gene loss consequences, and target specificity of potential compounds [18].
Biallelic and monoallelic IMP2 knockout has been achieved in both the CRISPR/Cas9-prime editing-based approach in HCT116 colorectal cancer cells [10]. Small molecule IMP2 inhibitors were identified previously and showed target-dependent effects in wild-type and knockout cells [10]. In this paper, by employing gene editing and small molecule inhibitors, we could verify IMP2 as a tumor-promoting protein in liver, colon, and lung cancer entities.
Complete protease inhibitor cocktail tablets (#04693124001, Roche, Mannheim,
Germany), primers, and gRNAs were ordered from Eurofins Genomics, Ebersberg,
Germany. SW480 (human, male, colon cancer), and HepG2 (human, male, liver cancer)
cells were maintained in Dulbecco’s modified Eagle’s medium (DMEM, #21969-035,
Gibco™, Darmstadt, Germany), and Huh7 (human, male, liver cancer),
A549 (human, male, lung cancer), and LLC1 (C57BL mouse, male, primary Lewis lung
carcinoma) cells were maintained in Roswell Park Memorial Institute (RPMI-1640
medium, #R0883, Sigma Aldrich, Taufkirchen, Germany). The media were
supplemented with 10% fetal calf serum (FCS, #P30-3306, PAN-Biotech, Aidenbach,
Germany), 1 mM glutamine (#X0551-100, Biowest, Nuaillé, France), 100 U/mL
penicillin, and 100 µg/mL streptomycin (#15070- 063,
Gibco™, Darmstadt, Germany). Cell lines were obtained from ATCC.
The validation of all cell lines was performed through Short Tandem Repeat (STR)
profiling conducted by the Cell Line Authentication Service at Eurofins Genomics
in Ebersberg, Germany. PCR-mediated mycoplasma testing was performed regularly.
Cells were cultured at 37 °C and 5% CO
The prime editor 2 system was used to achieve IMP2 knockout in A549, Huh7, and
LLC1 cells. pCMV-PE2-P2A-GFP (Addgene plasmid #132776) and pU6-
pegRNA-GG-acceptor (Addgene plasmid #132777) were a gift from Anzalone
et al. [19]. pU6- pegRNA-GG-acceptor plasmid was employed as a vector to
deliver the pegRNA component and the designed pegRNA encoding sequences were
inserted into the vector by golden gate cloning. A previously validated spacer
targeting exon 6 in IGF2BP2 was used [10], and two different spacers
targeting different loci of exon 6 in Igf2bp2 were utilized for pegRNA
assembly (Table 1, Ref. [10]). Desired mutations were planned to disrupt the
protospacer adjacent motif (PAM) of the spacer sequences. The scaffold sequence
used was: 5
| Gene name | pegRNA abbreviation | sgSpacer (5 |
pegRNA 3 |
PBS length | RTT length |
| IGF2BP2 | pegRNA4_16 | AGAGCCATGGAGAAGCTAAG | TCAAACTGATGCGCTTAGCTTCTCCATGG | 13 | 16 |
| Igf2bp2 | pegRNA1 | GAGAGCTCACCTCTTCATCG | AAGATTTCCTACATCCGATGAAGAGGTGAGCTC | 15 | 18 |
| pegRNA2 | GATGATGGCACCAACAAACT | GATCCTGGTCCCCACAGTTTGTTGGTGCCA | 12 | 18 |
Note: pegRNA4_-GG_16ntRT (pegRNA4_16) was validated as described previously [10].
IGF2BP2, Insulin-like growth factor 2 (IGF2) mRNA binding protein-2; PBS, Primer-binding site; RTT, Reverse transcription template.
The knockout procedure: 100,000 cells/well were seeded into 24-well plates and
cultivated overnight (16–24 hours). The transfection was initiated when
confluence reached approximately 60%. Lipofectamine 3000 (#L3000008, Thermo
Fisher Scientific, Darmstadt, Germany) was used for transfection, and an
equimolar ratio of the two vectors was employed to obtain a total DNA content of
2 µg, along with lipofectamine reagent in volumes as recommended by the
manufacturer. For Huh7 cells, jet-PEI hepatocyte DNA transfection reagent
((#101000053, Polyplus, Illkirch, France) was used according to the
manufacturer’s instructions. Based on previous trials, media was changed 4 h
post-transfection to prevent toxicity associated with the transfection reagents;
24 h post-transfection, cells were gently washed with 1
Design of CRISPR/Cas9 system: The CRISPR/Cas9 system was utilized to achieve IMP2 knockout in A549, Huh7, and LLC1 cells. Here, pSpCas9(BB)-2A-GFP (PX458, Addgene plasmid #48138) plasmid construct was used. Cas9-GFP fusion protein expression cassette was combined with U6-promotor driven sgRNA expression in the single plasmid. Restriction enzyme cloning was employed to insert designed gRNA sequences into the PX458 plasmid construct. Two different gRNAs, namely gRNA1 and gRNA2, were used to target IGF2BP2, while gRNAI and gRNAII were used for editing in Ifg2bp2 (Table 2). The knockout cell lines generation, selection, and isolation procedures were as described in 2.1; however, the total DNA used for transfection was 1 µg.
| Name | Sequence (5 |
Target region of IGF2BP2 |
| IGF2BP2 gRNA1 | GGGCTCGCTGAGGGGGCGAA | Exon 6 |
| IGF2BP2 gRNA2 | GTGGGGACCAGGATCCGCAG | Exon 6 |
| Igf2bp2 gRNAI | GAGAGCTCACCTCTTCATCG | Exon 6 |
| Igf2bp2 gRNAII | GATGATGGCACCAACAAACT | Exon 6 |
gRNA, guide RNA.
The transfection of the cells was performed as described in section 2.2. After
24 h of transfection, the cells were washed with 1
Amplification of the specific target region in IGF2BP2 (Table 2) was
carried out by PCR using the following primers: hIMP2 exon 6_for
5
In the second PCR, the primers bound to NGS-sequencing adapters (Table 3) were used, and the KAPA2G Fast Hot Start Genotyping Mix (KK5620, Sigma Aldrich, Taufkirchen, Germany) was employed following the manufacturer’s instructions. The PCR product was subjected to agarose gel purification. Subsequent sequencing was performed on an Illumina NextSeq platform using single-end sequencing. The sequencing results were analyzed using the CRISPResso2 software package [21].
| Name | Primers | Sequence (5 |
| gRNA1 adapter pair | gRNA1 Fwd | TCTTTCCCTACACGACGCTCTTCCGATCTCCTTCAAGATTTCCTACATC |
| gRNA1 Rev | GTGACTGGAGTTCAGACGTGTGCTCTTCCGATCTGCCCTCCTTTCCGATGATG | |
| gRNA2 adapter pair | gRNA2 Fwd | TCTTTCCCTACACGACGCTCTTCCGATCTGCCCTCCTTTCCGATGATG |
| gRNA2 Rev | GTGACTGGAGTTCAGACGTGTGCTCTTCCGATCTCCTTCAAGATTTCCTACATC |
Western blots were performed as described earlier [6], employing antibodies
specific for IMP2/p62 [22] and
The IncuCyte® S3 system (Sartorius, Goettingen, Germany) was employed to monitor 2D cell proliferation; 3000 cells per 100 µL per well were seeded into a 96-well plate. For compound treatment, solvent control (0.1% DMSO dissolved in respective media) was also tested, and compounds were added to the cell the day after seeding. Cell confluency was measured every 8 h starting from the time point of treatment or seeding (for experiments without compound treatment) until 72 h and analyzed using the basic analyzer software. Cell confluency was normalized to the 0 h time point. Metabolic activity was measured 72 h after seeding using the MTT assay. For each compound, the inhibition of cell viability was calculated for each concentration and normalized to its respective DMSO control or untreated control (if DMSO control showed viability above 90%).
60,000 cells per 100 µL per well were seeded into a 96-well plate. For compound treatment, solvent control (0.1% DMSO dissolved in respective media) was also tested, and compounds were added to the cells the day after seeding. Metabolic activity was measured 72 h after treatment using the MTT assay. For each compound, the inhibition of cell viability was calculated for each concentration and normalized to its respective DMSO control or untreated control (if DMSO control showed viability above 90%).
To assess the spheroid-forming ability of cells in 3D, the IncuCyt® S3 system was used. 3000 cells per 100 µL per well were seeded into low-attachment U-bottom 96-well plates. Spheroid formation was monitored over 6 days after seeding.
Using serial dilution, 300 cells per 2 mL per well were seeded into a 6-well
plate. For compound treatment, solvent control (0.1% DMSO dissolved in
respective media) was also tested, and compounds were added to the well at the
time of seeding. Cells were allowed to grow for 1–2 weeks to assess the colony
formation ability. The media was removed, and cells were washed once carefully
using 1
A total of 70,000 cells were seeded per 100 µL per well into an Image Lock 96-well plate. On the following day, the wound maker tool was used to perform scratches into the cell monolayers. The media containing the detached cells were removed and replaced with media without FCS. Migration was observed every 8 h up to 48 h after scratching. Cell confluency in the wound area was analyzed using IncuCyte® S3 migration software.
The raw data was analyzed using Microsoft Excel, and statistical analysis was
performed using Origin Pro® version 2023b software (Northampton,
MA, USA). Non-linear regression analysis was used to
calculate the inhibitory concentration 50 (IC
Prime editing, a CRISPR/Cas9 variant, had previously achieved biallelic IMP2 HCT116 knockout cells [10]. However, despite multiple trials, IMP2 knockout generation using this approach (Table 1) in HepG2, Huh7, SW480, A549, and LLC1 cells was not successful.
Multiple attempts to generate IMP2 knockouts in A549 and Huh7 cells using the CRISPR/Cas9 approach also failed. To rule out any effect of the manual single-cell picking procedure and further culture, we applied the entire single-cell colony expansion procedure on non-transfected A549 and Huh7 cells. While both non-transfected and GFP-negative cells, which had undergone the same transfection technique, formed colonies, no edited clones in either cell line were obtained.
To test the hypothesis that the inability of the successfully edited single cells to proliferate into a colony was since IMP2 is necessary for cell survival and proliferation, we performed next-generation sequencing of the GFP-positive cells picked up 24 h post-transfection that were successfully transfected with gRNA1 or gRNA2 individually in A549 cells or combination in Huh7 cells. Furthermore, as a control for the next-generation sequencing method, we simultaneously analyzed a separate batch of A549 and Huh7 cells that were not transfected at all. These cells are referred to as the non-transfected cells.
The sequencing analysis of GFP-positive A549 cells transfected with gRNA1 revealed a modification of 21.97% (Fig. 1A), while transfection with gRNA2 exhibited a higher editing efficiency of 83.66% (Fig. 1B). Similarly, GFP-positive Huh7 cells transfected with gRNA1 showed a comparable editing efficiency (Supplementary Fig. 1D), providing further evidence that gRNA editing efficiency is independent of the cell line.
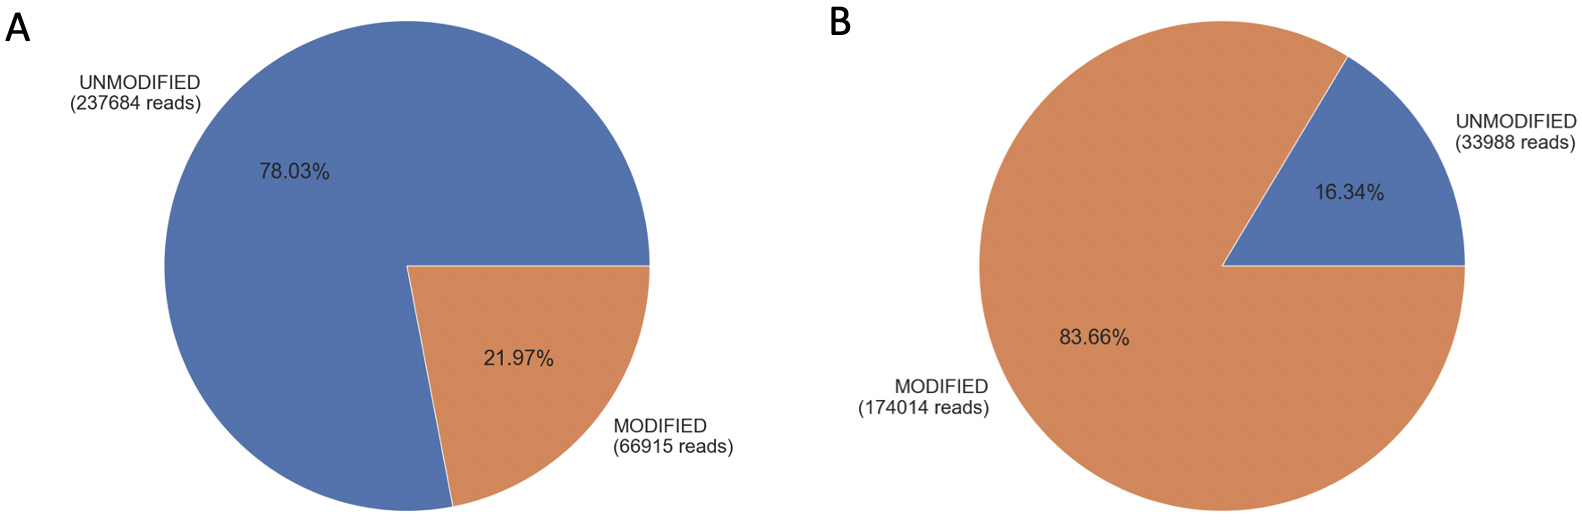 Fig. 1.
Editing efficiency of gRNA1 and gRNA2 in A549 cells. Panel (A) represents gRNA1-transfected A549 cells analyzed using gRNA1 adapter primers, while panel (B) represents gRNA2-transfected A459 cells using gRNA2 adapter primers. The pie charts display the percentage and number of reads, indicating the presence of unmodified alleles (blue) and modified alleles (orange).
In the case of non-transfected A549 cells, the analysis using gRNA1 and gRNA2 adapter primers showed that 99% (Supplementary Fig. 1A) and 98.9% (Supplementary Fig. 1B) of the alleles matched the reference sequence near the gRNA target site, respectively. Similar results were observed for non-transfected Huh7 cells analyzed using gRNA1 adapter primers (Supplementary Fig. 1C). It is important to note that the modifications depicted in Fig. 1 and Supplementary Fig. 1 include base insertions, deletions, and substitutions.
The next-generation sequencing analysis of Huh7 cells transfected with both gRNA1 and gRNA2 revealed a deletion of 96 base pairs between the expected cut sites of the two sgRNAs, as determined using the gRNA1 adapter primer system (Fig. 2). This finding provides additional evidence supporting the high editing efficiency of gRNA1 and gRNA2.
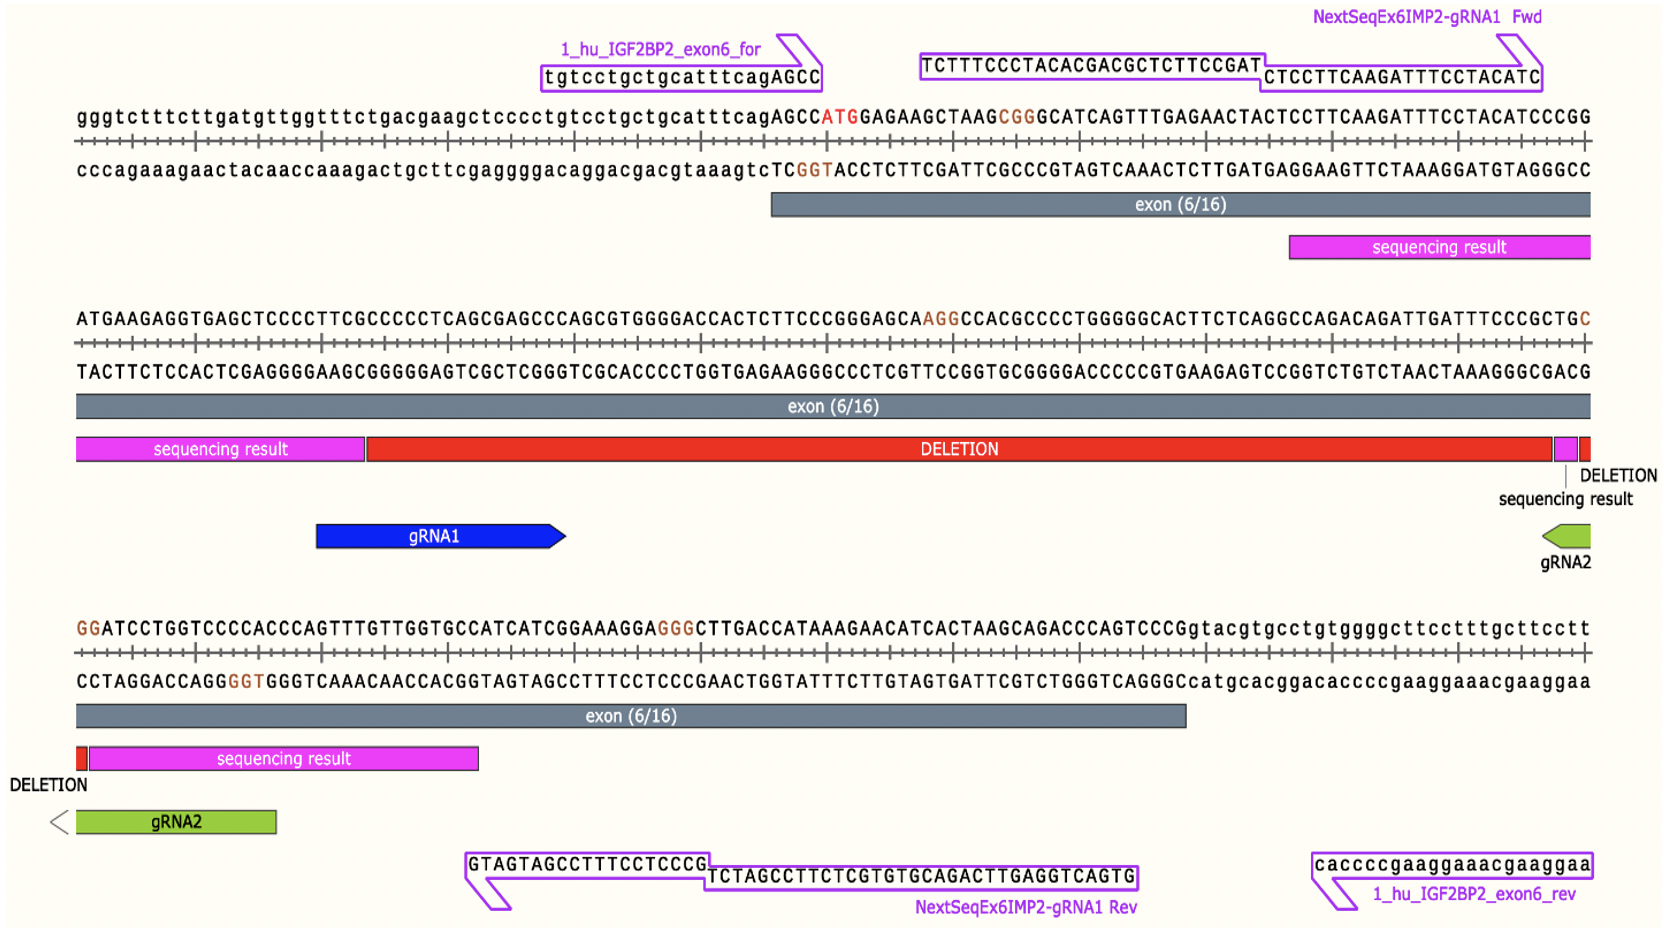 Fig. 2.
Editing efficiency of gRNA1 and gRNA2 in combination in Huh7 cells. The sequence alignment with the reference genome is presented in the sequence view. Nucleotides indicated by the pink bar represent the sequencing result. Additionally, the red bar represents a 96 bp deletion between the gRNA1 and gRNA2, represented by blue and green bars, respectively. This deletion occurs in the target region of exon 6 of IGF2BP2. The image was generated using SnapGene Viewer version 6.2 (San Diego, CA, USA).
IMP2 biallelic knockout LLC1 cells were generated using gRNAI and gRNAII (Table 2). The editing was confirmed through Sanger sequencing analysis, and six different mutation types were observed (Supplementary Fig. 2). A representative clone of each mutation type was selected for further investigation. The reduction in IMP2 expression was confirmed through western blot analysis (Supplementary Fig. 3). However, the clone bKO6 exhibited up to 65% expression of IMP2 compared to LLC1 wild-types (WT1) and was therefore excluded from further analysis. The remaining five clones, designated as bKO1, bKO2, bKO3, bKO4, and bKO5, were utilized for subsequent characterization. To assess the potential off-target effects of the CRISPR/Cas9-mediated knockout procedure, an editing control LLC1 clone named WT2 was included in the experimental analysis. This control clone was obtained from an experiment in which cells had undergone transfection with both gRNAI and gRNAII but were selected from non-GFP positive cells. Sanger sequencing confirmed that WT2 was a wild-type clone.
To conduct the in vitro IMP2 target analysis, biallelic knockout clones were utilized where available. However, for cell lines in which achieving a biallelic knockout (bKO) was not possible, monoallelic knockout (mKO) clones were employed. The IMP2 protein levels in the monoallelic knockouts have been previously published. The mean values were close to 80% for Huh7, 44% for HepG2, and 57% for SW480 [10], while the expression of IMP2 in the biallelic LLC1 knockouts is shown in Supplementary Fig. 3.
Compared to the WT2 control, which had undergone the same treatment as the
knockout clones, clones bKO1-3 showed reduced proliferation (bKO1: p = 0.037;
bKO2: p = 0.005; bKO3: p
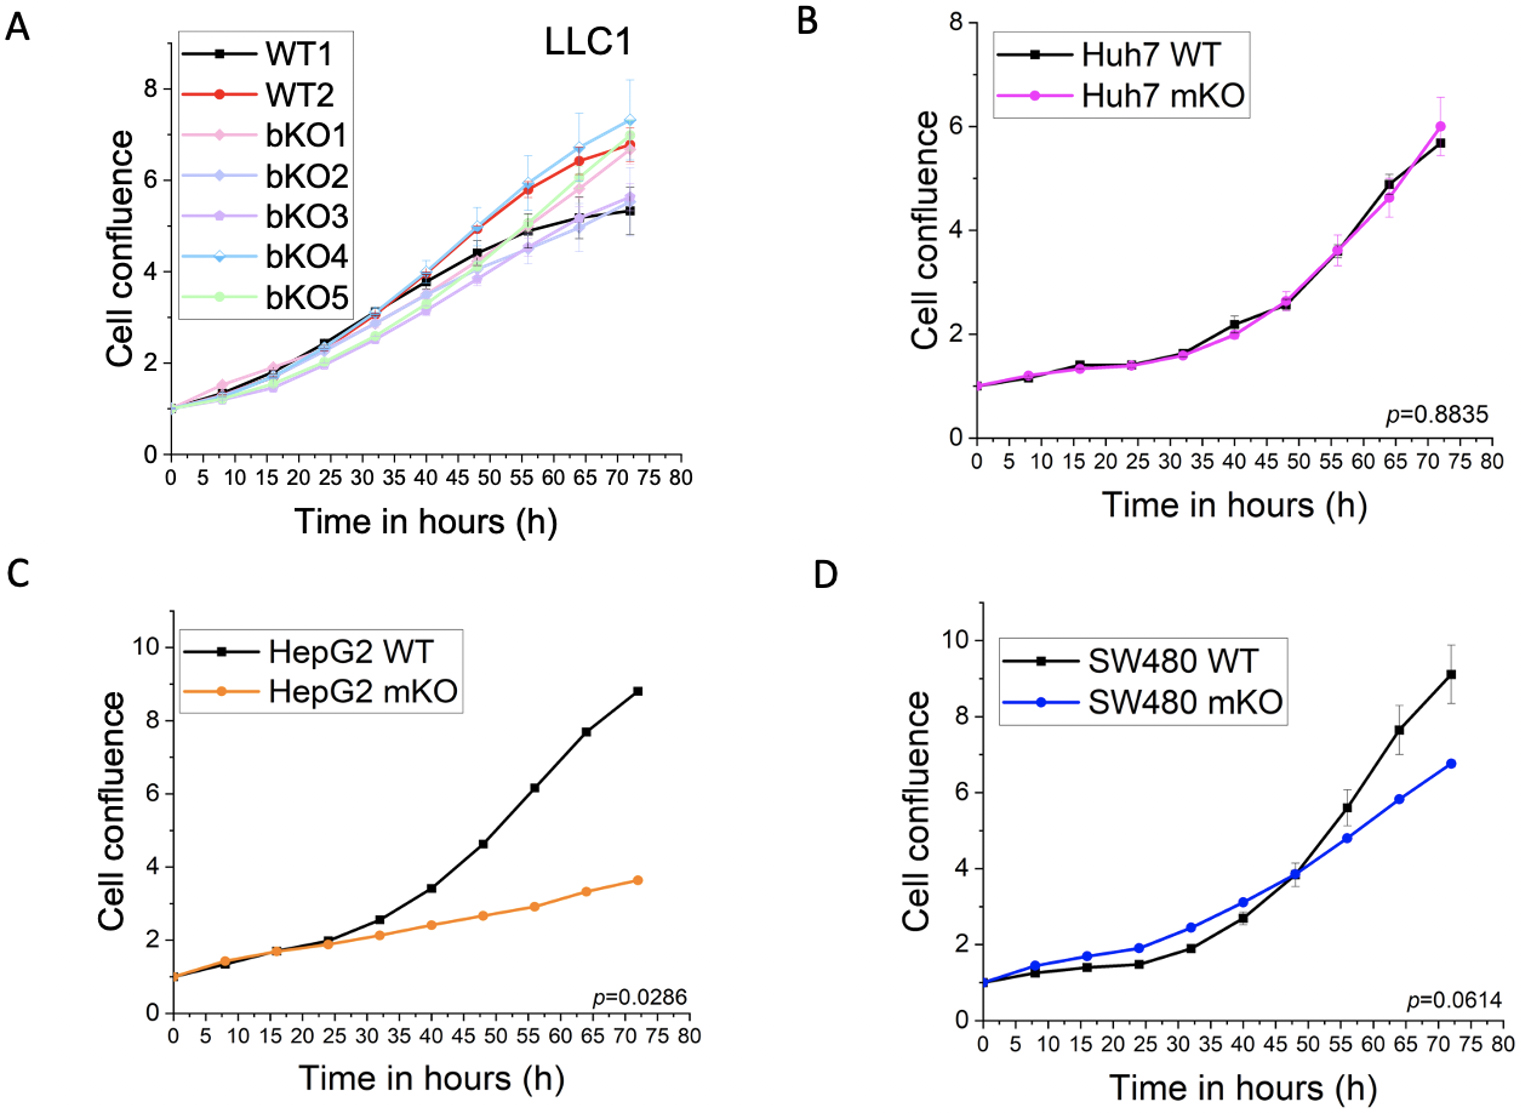 Fig. 3.
Effect of IMP2 knockout on 2D cell proliferation. (A) LLC1, (B)
Huh7, (C) HepG2, and (D) SW480 were assessed for their effect on 2D cell
proliferation using the IncuCyte® S3 live cell imaging
system. LLC1 IMP2 knockouts were biallelic (bKO), while the Huh7, HepG2, and
SW480 cells were monoallelic IMP2 knockouts (mKO). Data were normalized to time
point 0 h and are represented as mean
No effect was seen in the proliferation of the monoallelic knockout clones of Huh7 (Fig. 3B). Although not statistically significant, a trend towards reduced proliferation was observed for the SW480 monoallelic knockout clone at later time points (Fig. 3D). Importantly, a significant reduction in proliferation was observed in the HepG2 IMP2 knockout clone (Fig. 3C).
3D cell culture models, also known as multicellular tumors (MCTs) or spheroids, closely resemble the structural organization, oxygen and nutrient gradients, and pH conditions of in vivo solid tumors [23]. Based on the compactness, the spheroid/multicellular tumors (MCTs) are categorized as compact spheroids and loose aggregates of cells [23]. Compact spheroids are tightly bound to each other, making it difficult to distinguish single cells, whereas loose spheroids cannot form complete spheres and can be easily disintegrated [23]. In some tumor cell types, they fail to aggregate into one single entity and exist as several small colonies of cells, which are referred to as satellite colonies. We observed a loss in the ability to form compact spheroids upon the knockout of IMP2. All wild-type clones except for Huh7 successfully formed compact spheroids three days after seeding. In contrast, the biallelic IMP2 knockout LLC1 cells and the monoallelic IMP2 knockout SW480 cells showed a change in cell adhesion and formed loose aggregates, while the monoallelic HepG2 IMP2 knockouts formed satellite colonies. This characteristic persisted even after 6 days of observation (Fig. 4). Parental Huh7 cells also showed the formation of satellite colonies and did not form spheroids throughout the 6-day observation period (data not shown).
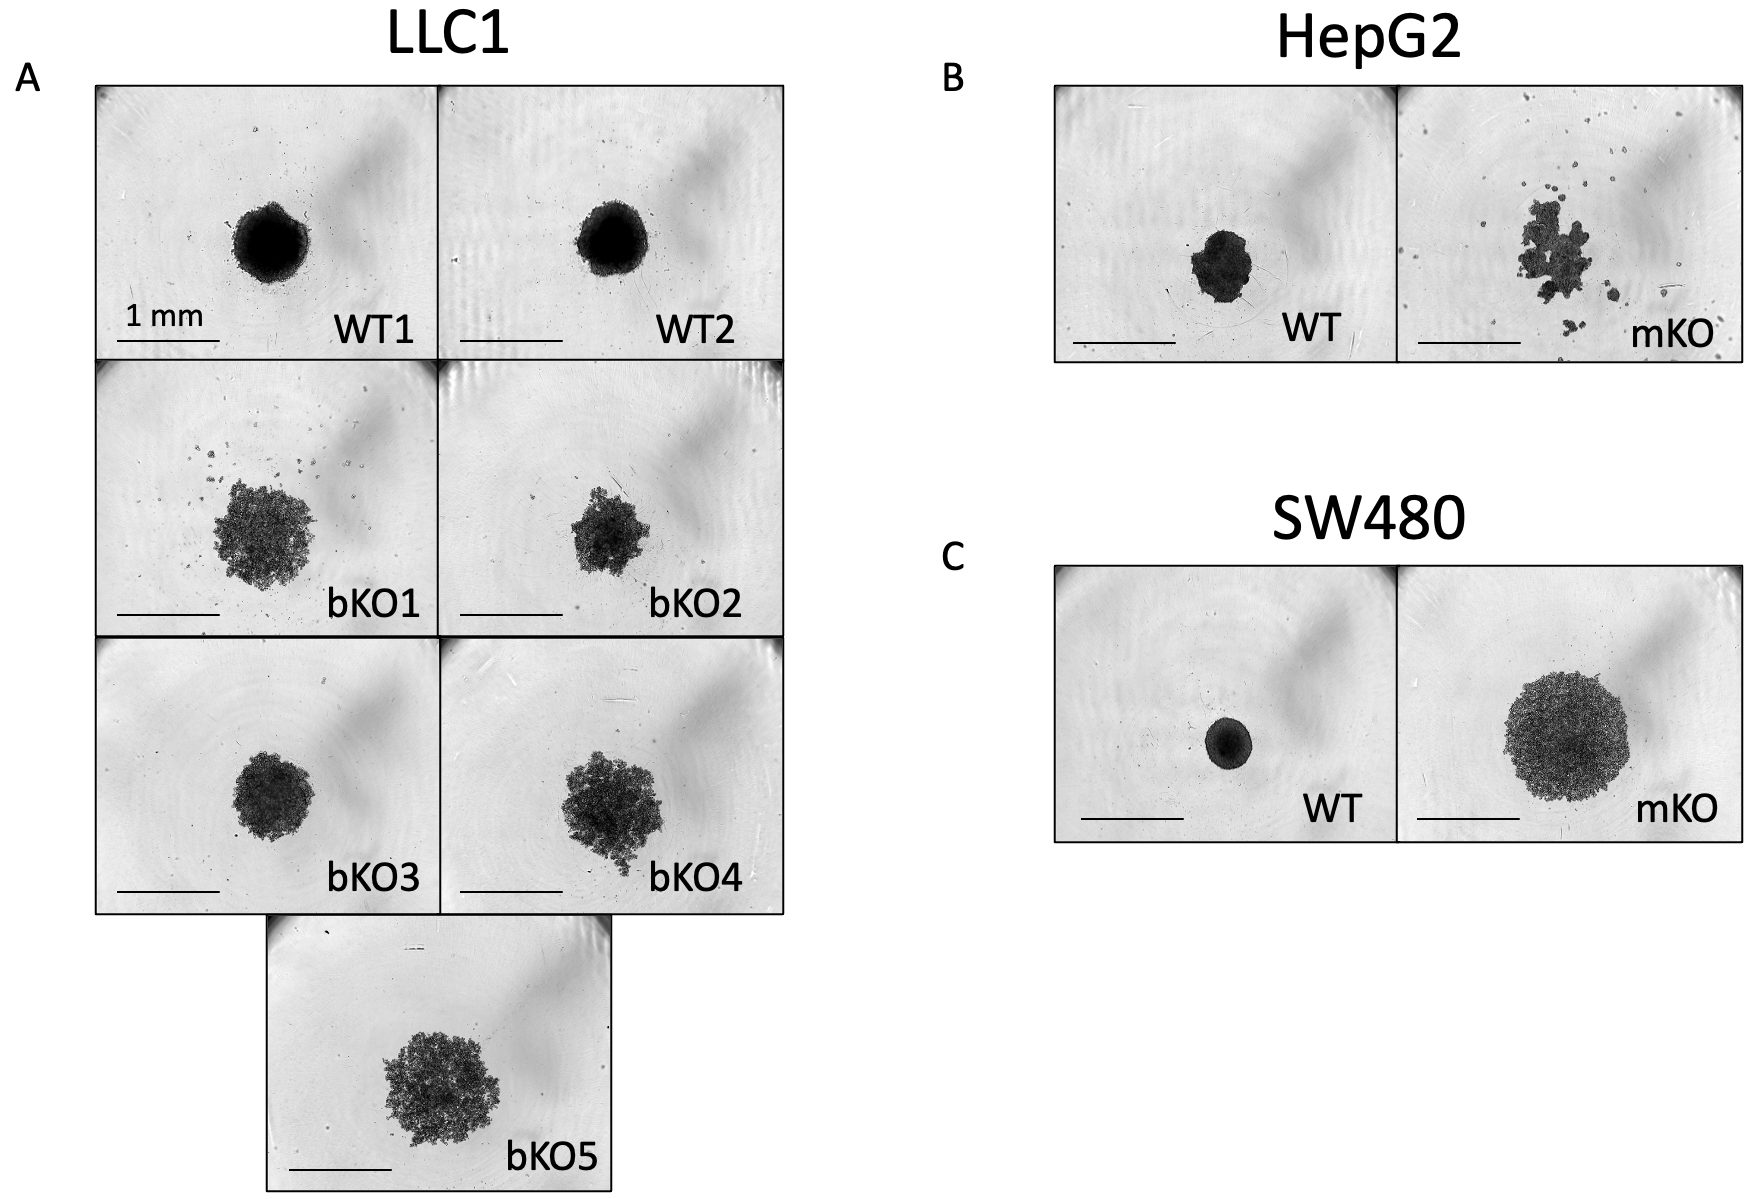 Fig. 4.
Comparison of spheroid formation between wild-type and IMP2 knockout clones. (A) LLC1, (B) HepG2, and (C) SW480 clones were assessed for their spheroid forming ability using the live cell imaging system IncuCyte® S3 at the 6-day time point after cell seeding. Representative images were chosen, and the scale was adjusted to 1 mm. The Huh7, HepG2, and SW480 IMP2 knockout cells were monoallelic knockouts.
The colony formation assay (CFA) provides insight into the ability of single cells to survive and reproduce [24] and has been extensively used to test the effect of cytotoxic agents on a cancer cell’s ability to form a viable colony [25]. The CFA was employed to understand the role of IMP2 in tumor growth. The LLC1 IMP2 biallelic knockout cells exhibited a significant decrease in both the number of colonies formed (Fig. 5A) and the average area of the colonies (Fig. 5B). While the wild-type cells formed colonies in the form of spheroids, the knockout clones lost this ability (Fig. 5C). Furthermore, monoallelic IMP2 knockouts of Huh7, HepG2, and SW480 cells also exhibited a significant reduction in colony formation ability, as observed in terms of both colony number and area (Fig. 6).
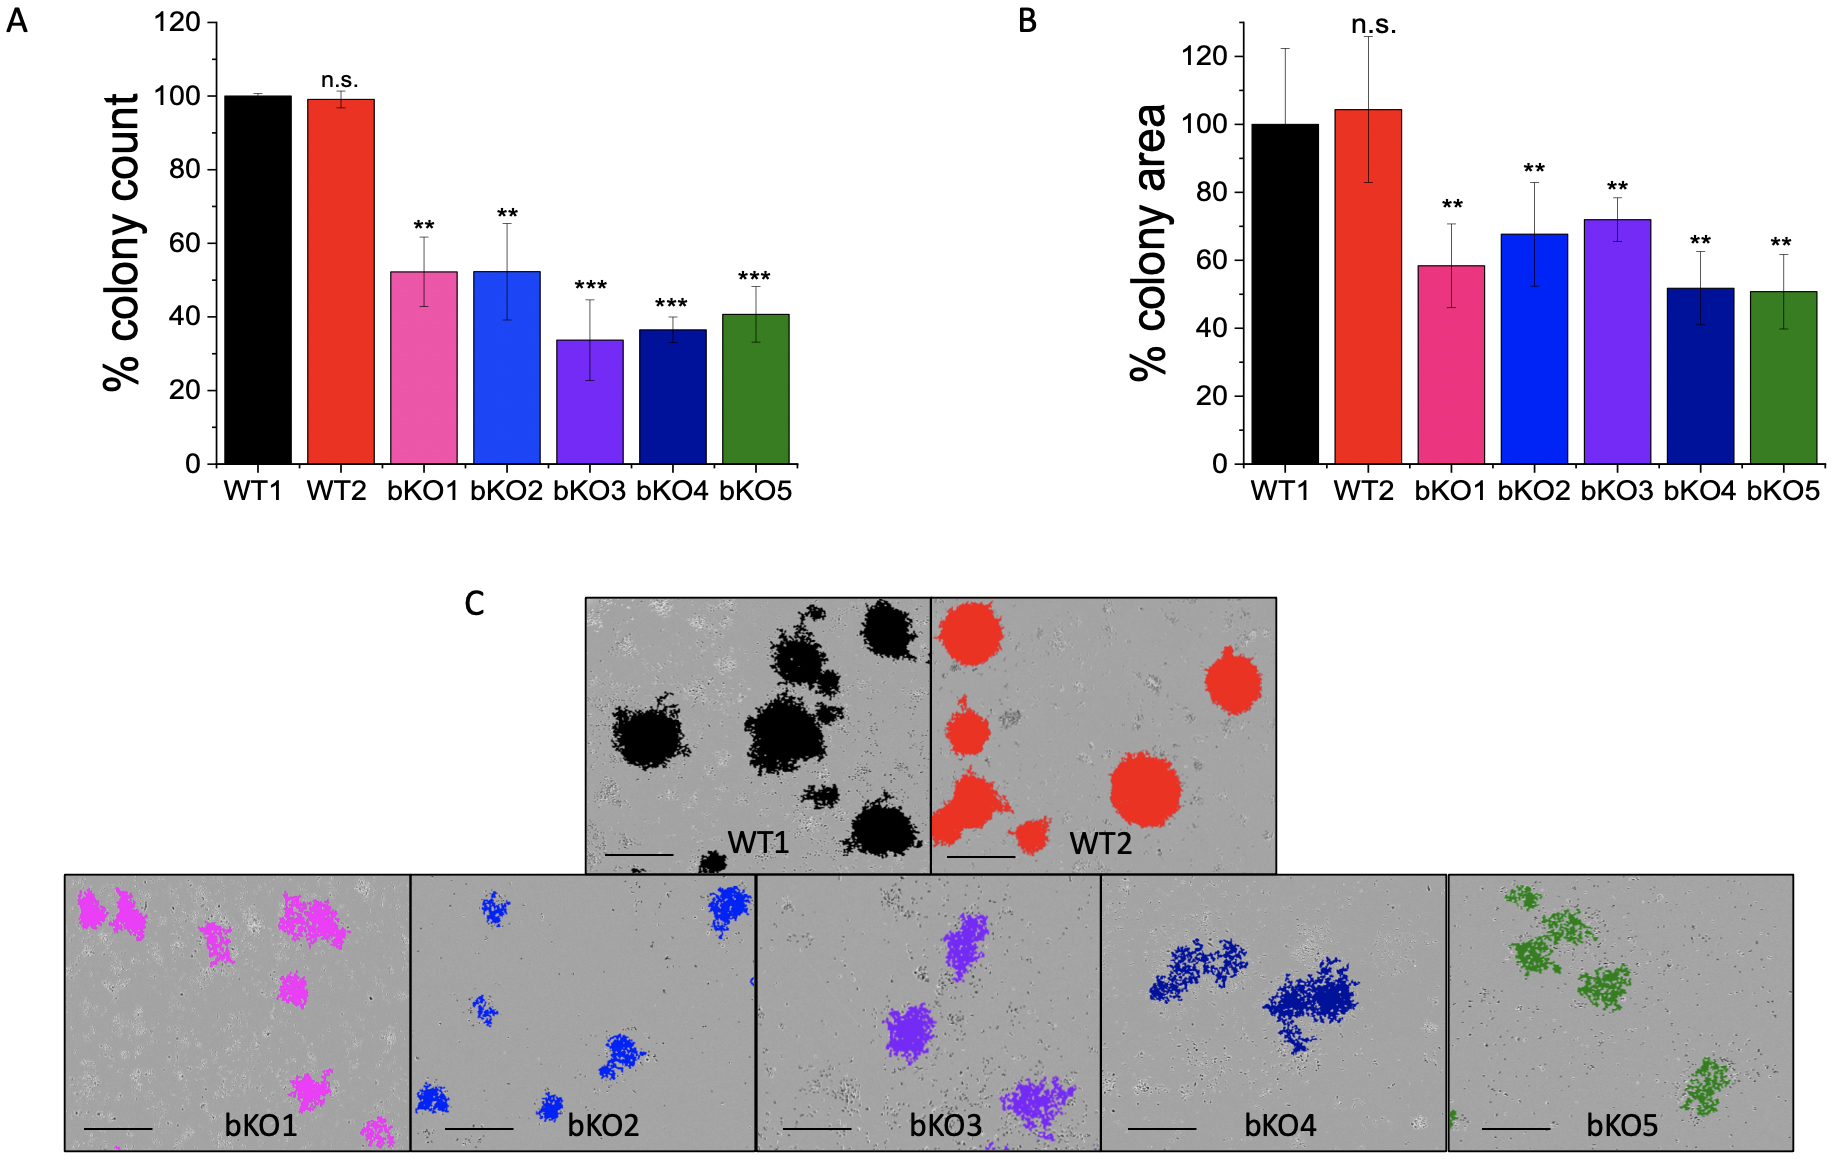 Fig. 5.
Effect of IMP2 knockout in LLC1 cells on the colony formation
ability. The results are presented as follows: (A) number of colonies, (B)
average area of colonies, and (C) representative images of colonies with the
scale adjusted to 1 mm. Colony counting and measurement of average area were
performed using the IncuCyte® S3 live cell imaging system.
It should be noted that WT1 represents the LLC1 wild-type clone, while WT2 serves
as the LLC1 editing control. The data was normalized to the WT1 cells and are
represented as mean
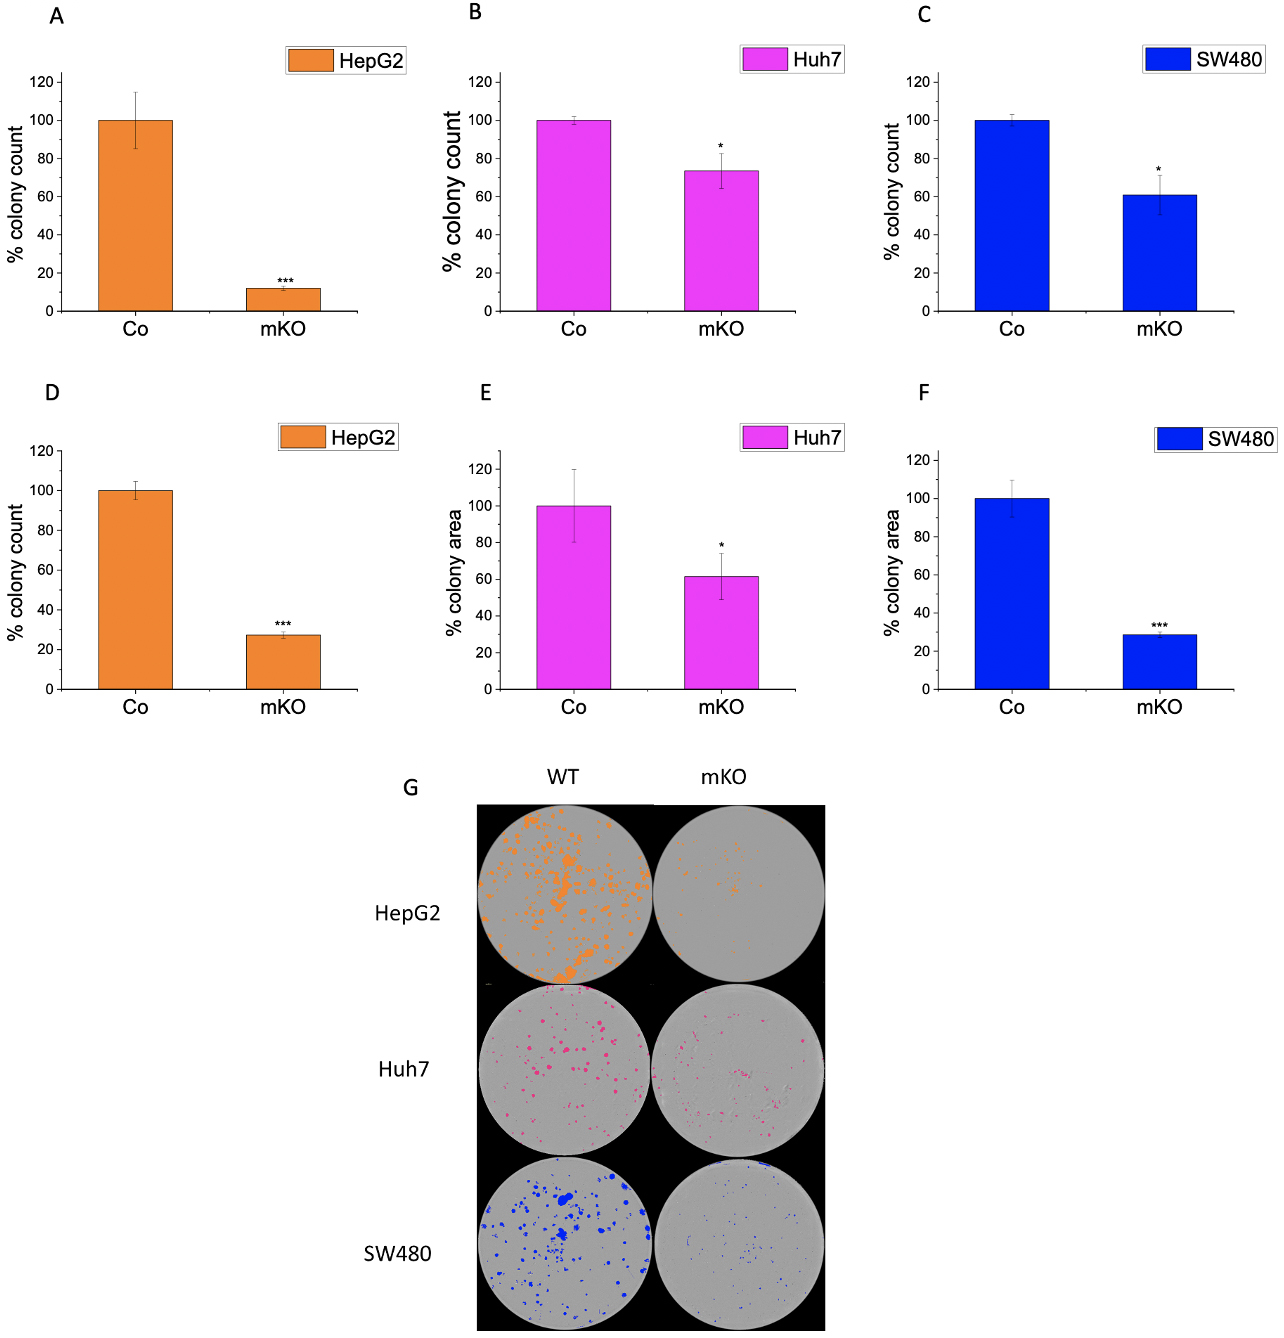 Fig. 6.
Effect of IMP2 knockout on colony formation ability of Huh7,
HepG2, and SW480. Figures illustrate the number of colonies for wild-type (WT)
or monoallelic IMP2 knockout (mKO) (A) Huh7, (B) HepG2, and (C) SW480 cells, and
the average area of colonies for (D) Huh7, (E) HepG2, and (F) SW480. (G)
Representative images of colonies seen in a 6-well plate. The colonies were
counted, and the average colony area was measured using the
IncuCyte® S3 live cell imaging system. Huh7, HepG2, and
SW480 were monoallelic IMP2 knockouts. Data were normalized to wild-type
cells/control (Co) and represented as mean
Furthermore, we investigated the impact of IMP2 inhibitor compounds # 4, 6, and 9, which had been identified by a screening approach [10], on the 2D proliferation and metabolic activity of wild-type LLC1 cells. The compounds demonstrated a significant reduction in the proliferation rate at concentrations of 15 µM and 30 µM (Fig. 7A–C), and a dose-dependent decrease in the cells’ metabolic activity, as assessed by MTT assay, was observed at concentrations ranging from 5 µM to 100 µM (Fig. 8A–C). The cells did not exhibit distinct morphological changes (Supplementary Fig. 4B).
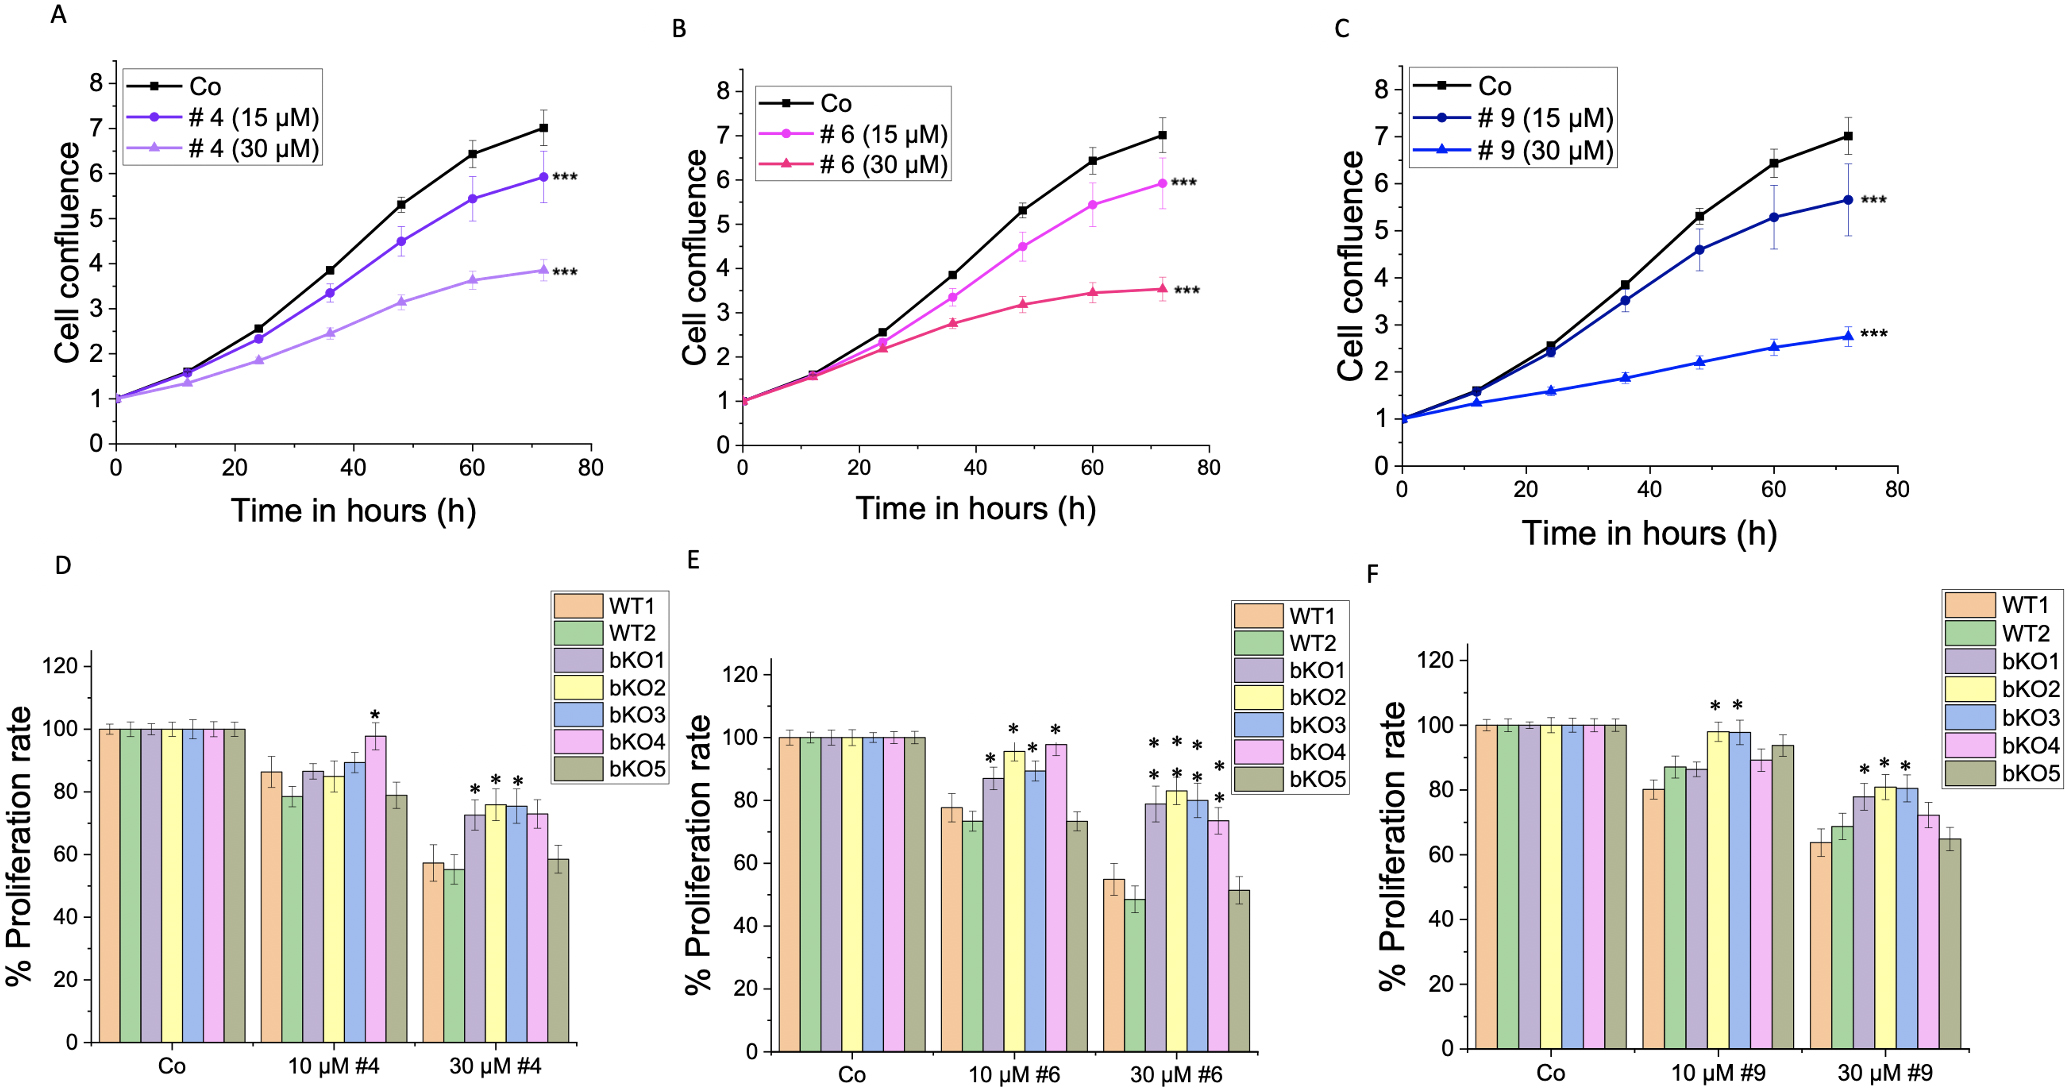 Fig. 7.
Effect of IMP2 inhibitors on the 2D cell proliferation of
wild-type and biallelic IMP2 knockout LLC1 cells. The effects on 2D
proliferation of LLC1 cells upon treatment with published IMP2 inhibitors, i.e.,
(A,D) compound 4, (B,E) compound 6, and (C,F) compound 9 at the indicated
concentrations over 3 days were assessed using the IncuCyte® S3
live cell imaging system. The time point shown in panels (D–F) is 72 h
post-treatment. Data is normalized to time point 0 h of the respective control
and represented as mean
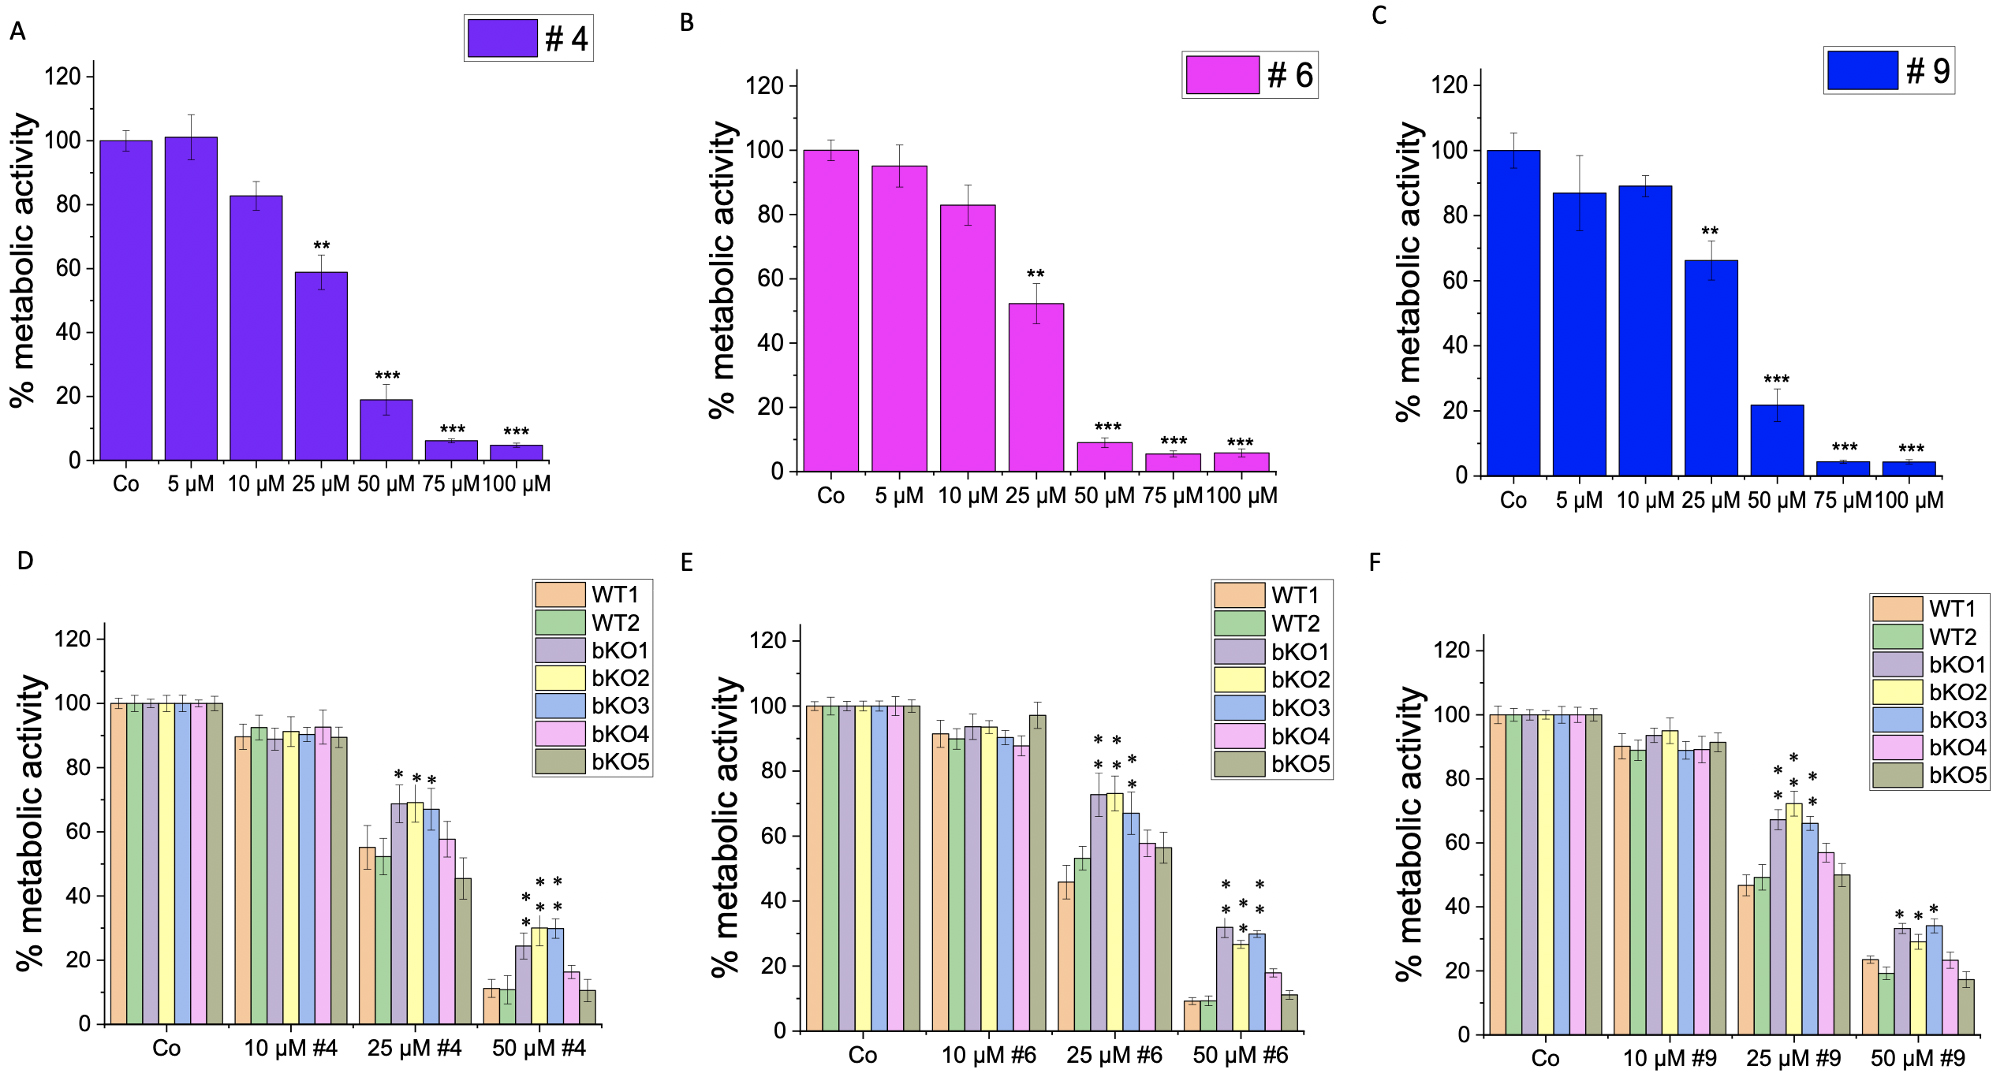 Fig. 8.
Effect of IMP2 inhibitors on the metabolic activity (MTT assay)
of wild-type and biallelic IMP2 knockout LLC1 cells. The effects on the
metabolic activity of LLC1 cells upon treatment with published IMP2 inhibitors,
i.e., (A,D) compound 4, (B,E) compound 6, and (C,F) compound 9 at the indicated
concentrations after 3 days were assessed by MTT assay. Data are normalized to
solvent controls (Co) and represented as mean
To investigate the specificity of the compounds on IMP2 in terms of their effect on 2D proliferation (Fig. 7D–F) and metabolic activity (Fig. 8D–F), we compared their action on bulk WT1 and the editing control WT2 and the five biallelic IMP2 knockout LLC1 clones. Notably, the knockout clones bKO1-4 displayed a lower sensitivity to the treatments compared to wild-type LLC1 cells (WT1 and WT2). The bKO5 displayed a similar response to the wild-type LLC1 cells.
Based on the IC
| Compound (#) | IC |
| 4 | 25.23 µM |
| 6 | 23.90 µM |
| 9 | 28.45 µM |
IC
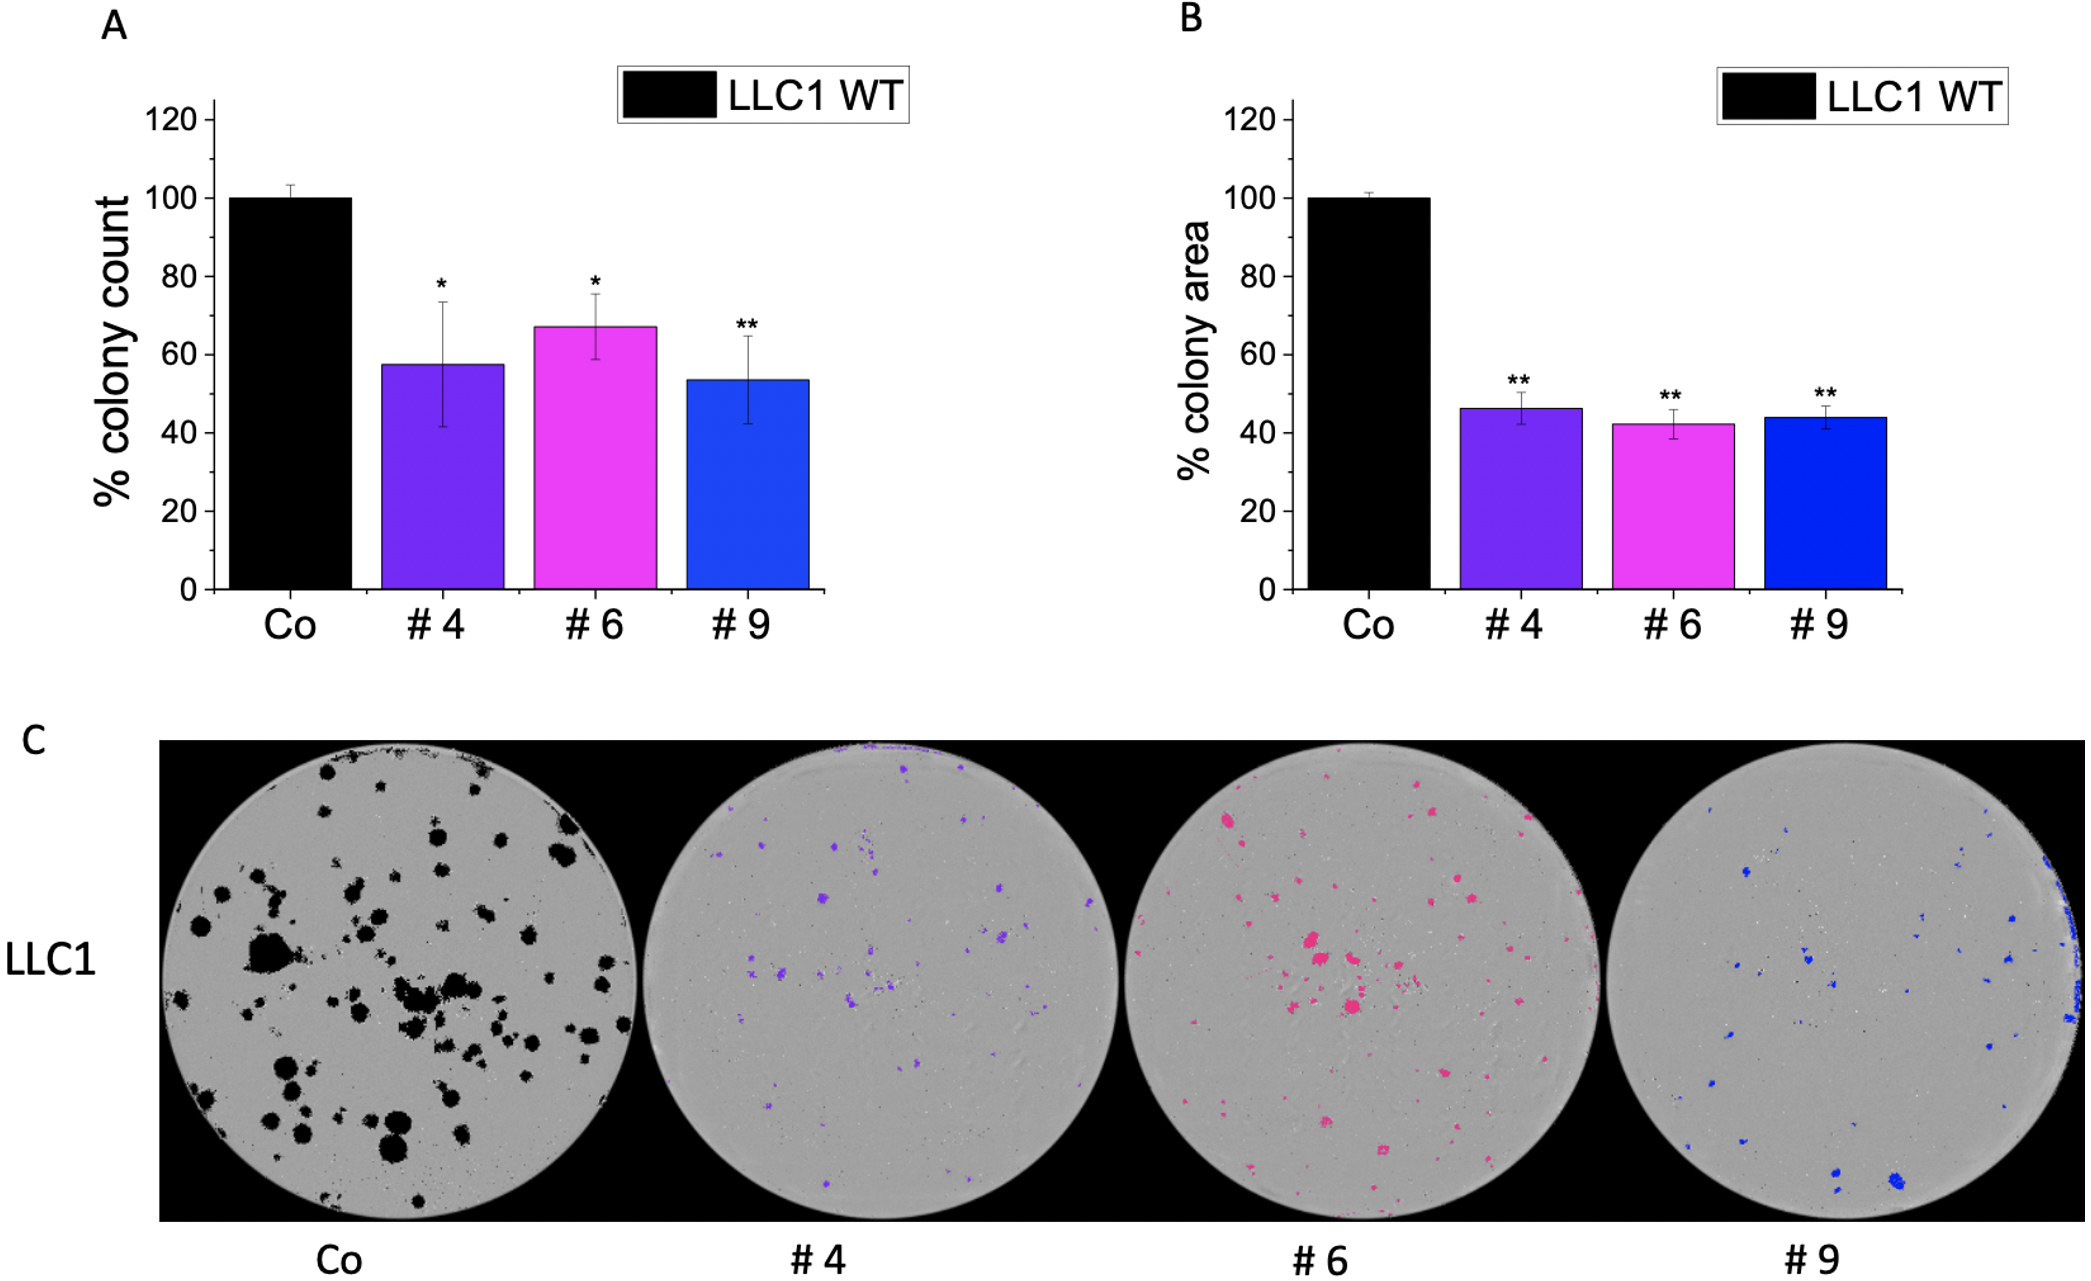 Fig. 9.
Effect of IMP2 inhibitors on wild-type LLC1 cells in colony
formation assay. Figures illustrate the (A) number of colonies, (B) average area
of colonies, and (C) representative images of colonies seen in a 6-well plate.
Colonies were counted, and the average area of colonies was determined using the
IncuCyte® S3 live cell imaging system. A treatment concentration
of 25 µM was applied for each compound. Data was normalized to untreated
wild-type LLC1 cells/control (Co) and represented as mean
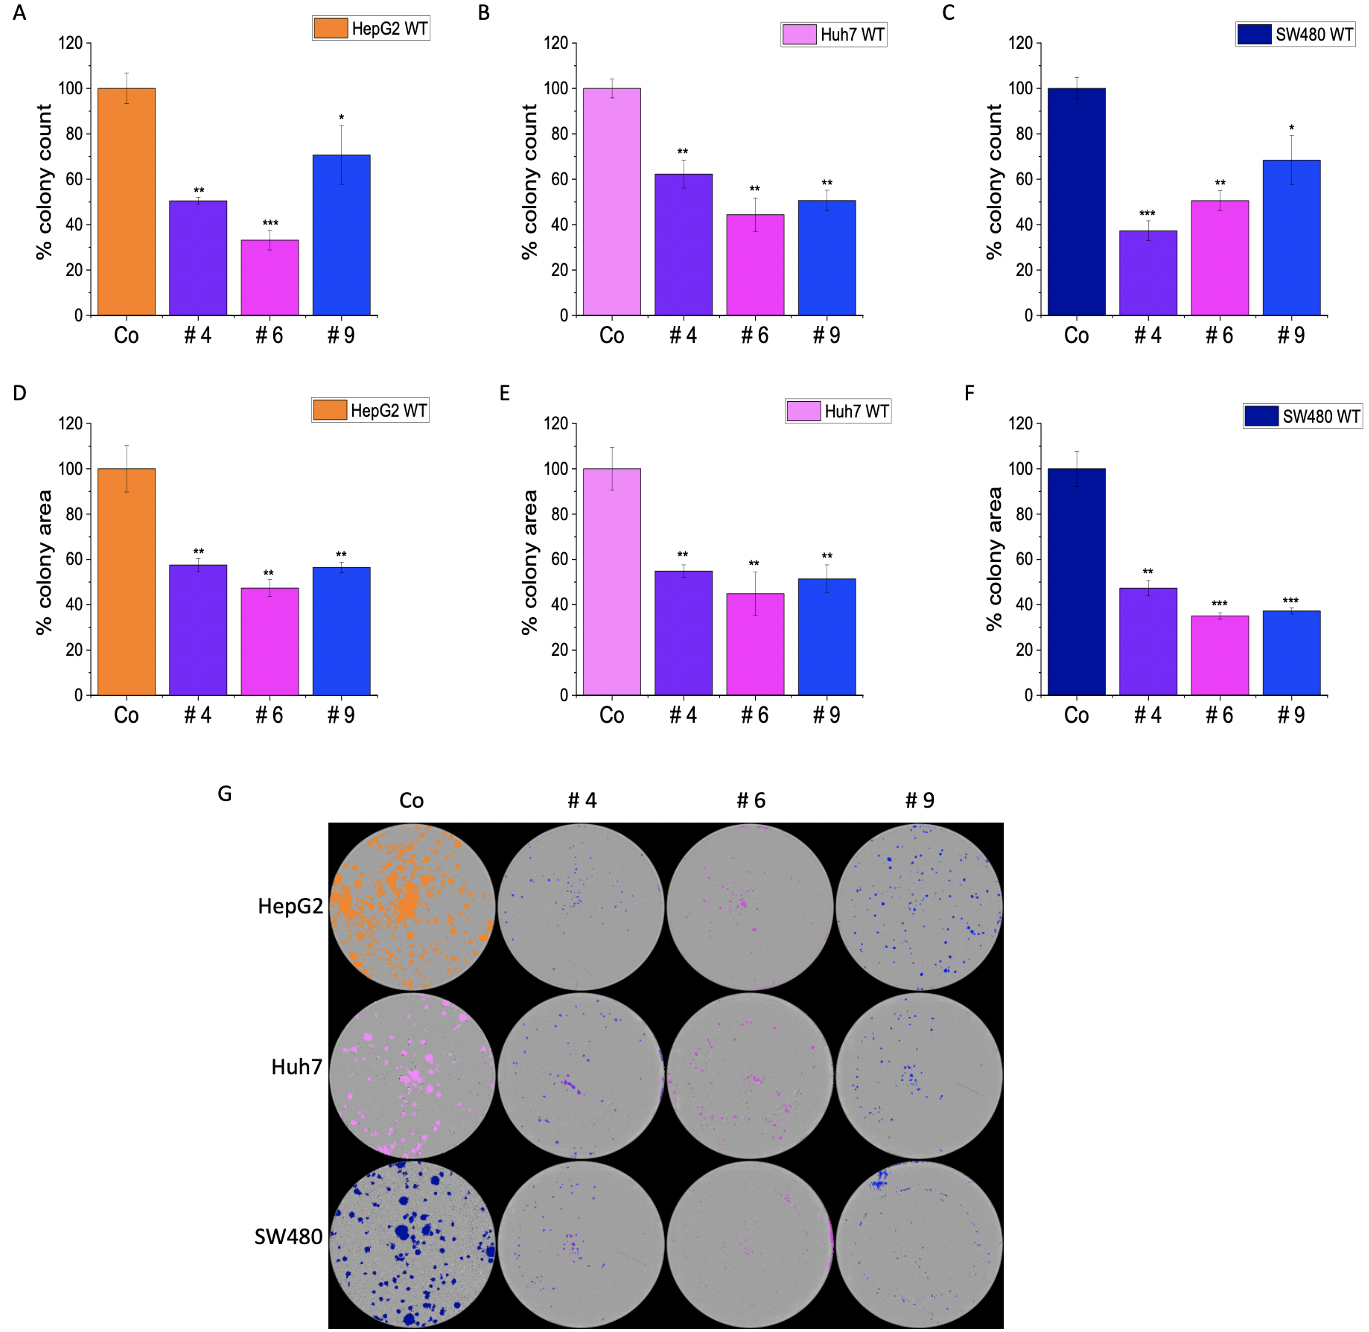 Fig. 10.
Effect of IMP2 inhibitors on Huh7, HepG2, and SW480 cells in
colony formation assays. Results present the number of colonies for (A) Huh7,
(B) HepG2, and (C) SW480, as well as the average area of colonies for (D) Huh7,
(E) HepG2, and (F) SW480 cells. Additionally, (G) representative images of
colonies are shown as seen in a 6-well plate. The colonies were counted, and the
average colony area was determined using a live cell imaging system,
IncuCyte® S3. The Huh7, HepG2, and SW480 were monoallelic
IMP2 knockouts. Data was normalized to untreated wild-type cells and represented
as mean
The effect of IMP2 knockout on cell migration was investigated (Fig. 11). The
two parental LLC1 cell lines, namely WT1 and WT2, differed significantly (p
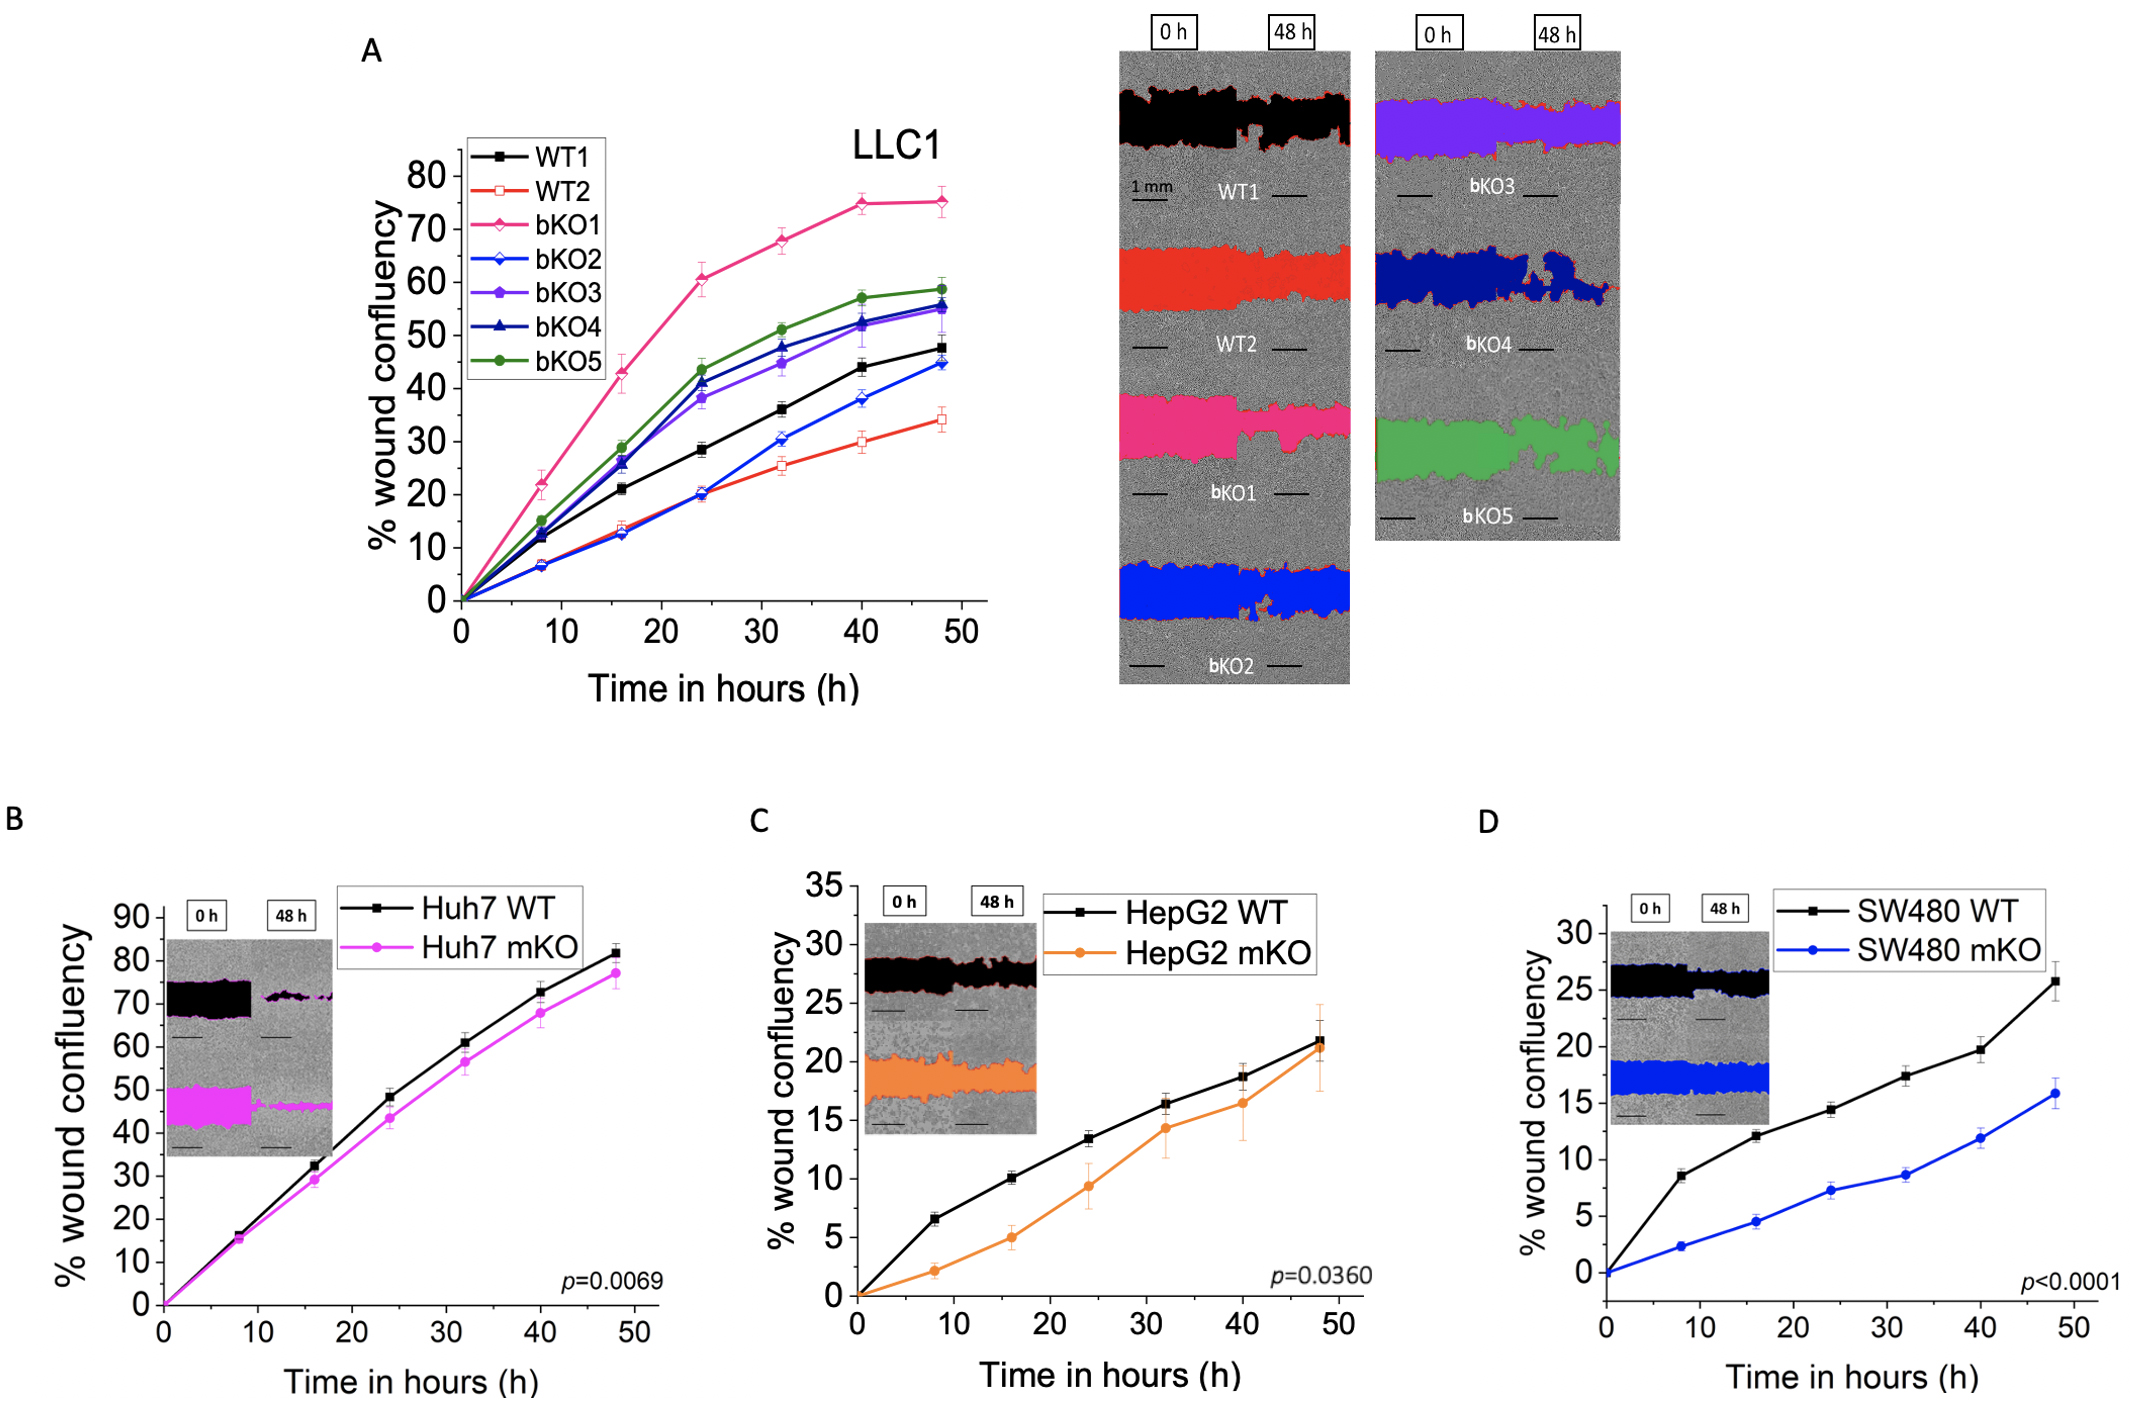 Fig. 11.
Effect of IMP2 knockout on cell migration in a wound healing
assay. (A) LLC1 (B) Huh7, (C) HepG2, and (D) SW480 cells were analyzed for cell
migration using the IncuCyte® S3 system over a 48 h period.
Representative pictures show the wound area in color at the starting point, 0 h,
and 48 h after wounding, and the scale was set to 1 mm. The LLC1 wild-type clone
is referred to as WT1, and the LLC1 editing control is referred to as WT2. The
Huh7, HepG2, and SW480 were monoallelic IMP2 knockouts. Data are normalized to
time point 0 h. Data is represented as mean
Overexpression of IGF2BP2 has been reported in several cancers, highlighting its prognostic role [2]. Previous studies have characterized the role of IMP2 as a tumor promoter in cancer through siRNA-mediated knockdown of IGF2BP2 [9, 13, 14, 15]. Our study aimed to generate IMP2 knockouts using CRISPR/Cas9-prime editing approaches to validate IMP2 as a potential anti-cancer target.
Previous research has used CRISPR/Cas9 to inactivate IMP2 and observed a decrease in 2D proliferation in various cell lines, including Hep3B, HeLa, RD, HCC-1359, MB-231, and SNU-423, over 5 days. This was determined by assessing growth and cell numbers using a mixture of edited and non-edited cells [2]. These findings support our hypothesis that obtaining a single-cell derived IMP2 knockout is challenging in cancer cell lines, and thus, earlier studies have used a polyclonal mixture for analysis, which potentially only had a monoallelic gene deletion. In our study, we encountered difficulties in generating single-cell derived IMP2 biallelic knockouts in A549 and Huh7 cell lines despite successfully validating the sgRNAs used in the CRISPR/Cas9 system. This suggests that the absence of IMP2 may impair the ability of cells to form colonies and affect cancer cell proliferation.
Using our CRISPR/Cas9 approach, we successfully generated biallelic IMP2 knockouts in LLC1 cells. However, we were unable to achieve knockouts using the variant approach, prime editing. Our findings are consistent with previous observations that the prime editor 2 (PE2) system is challenging to use in the murine system [26]. Strategies that aim to reduce the size of the PE2 system have been proposed to improve the efficiency of prime editing [27, 28, 29].
Sanger sequencing confirmed that biallelic IMP2 knockout LLC1 cells exhibited reduced protein expression, ranging from 7% to 65%. Despite several attempts, we could not generate biallelically edited IMP2 knockouts in SW480, Huh7, and HepG2 cells, supporting the notion that IMP2 is crucial for cell proliferation [10]. These monoallelic IMP2 knockouts, verified by Sanger sequencing, also demonstrated protein expression levels of 40% to 80%, as previously reported [10]. While successful editing disrupted gene integrity in the IMP2 knockout clones, the genomic effects did not consistently result in reduced RNA levels or explain the protein abundance in the CRISPR-generated knockout cell lines [30].
Other studies have investigated the impact of IMP2 knockdown using siRNA/shRNA-mediated approaches on colorectal carcinoma (CRC) cell lines. IMP2 knockdown exhibited reduced colony formation ability in HCT116 and SW480 [31], and also in SW620 and SW480 cells [5]. Similarly, IMP2 knockdown in SW480, SW620, and HCT-8 cells led to inhibition of 2D cell proliferation and reduced migration [9]. Our recent study focused on CRISPR/Cas9-prime mediated biallelic IMP2 knockout in HCT116 cells, which showed no effect on 2D proliferation but demonstrated reduced 3D proliferation, cell migration, and adhesion [10]. Recent research revealed that IMP2 is involved in the induction of chemoresistance in HCT116 [32]. Our data exhibited reduced proliferation at later time points, as well as decreased cell migration in CRISPR/Cas9-generated monoallelic IMP2 knockout SW480 cells.
Likewise, studies on hepatocellular carcinoma (HCC) cells have also demonstrated
the impact of shRNA-mediated IMP2 knockdown. In HepG2 and Huh7 cells, IMP2
knockdown impeded cell proliferation and reduced clonogenicity [12]. Employing an
siRNA knockdown of p62, HepG2 cells showed no effect on 2D cell proliferation
[6, 7]. CRISPR/Cas9-mediated IMP2 knockout in HepG2 and SNU449 cells in a
polyclonal mixture of transfected cells showed inconsistent effects on cell
proliferation but reduced colony formation upon IMP2 inactivation [7].
Additionally, IMP2 inactivation in HepG2 cells reduced cell migration, while IMP2
overexpression in SNU449 cells promoted migration through epithelial-mesenchymal
transition (EMT) induction via the Wnt/
In non-small cell lung cancer cell lines A549 and H1975, sh-RNA-mediated IMP2 knockdown resulted in reduced proliferation and colony formation ability [3]. Our data showed no consistent effect on 2D proliferation but reduced colony formation in LLC1 biallelic IMP2 knockouts. In a study by Xu et al. [35], 2022, it was demonstrated that single-cell-derived cell lines (SCDCLs) from LLC1 cells display varying growth patterns. This discovery can help shed light on our findings regarding the proliferation of LLC1 cells. Specifically, our data indicate that bulk LLC1 cells (designated as WT1) exhibit slower growth than WT2, which have been derived from cells that underwent the CRISPR procedure without an edit of the IMP2 gene. Compared to this WT2 clone, three of the knockout clones grew slower (bKO1-3), while bKO4 grew faster. The action of IMP2 inhibitors on cell proliferation was reduced in four of the five knockout clones; this further supports an involvement of IMP2 in cell proliferation, but it is challenging to establish a clear trend due to the heterogeneous nature of the SCDCLs.
3D cell culture models provide valuable insights into tumor characteristics, such as proliferation, invasion, and metastatic potential [23]. The formation of MCTs relies on cell-cell adhesion molecules that initiate loose bonds between integrins and the extracellular matrix (ECM). The interaction through N-cadherin-to-E-cadherin plays a crucial role in the aggregation of cells into compact spheroids [23]. Previous studies have demonstrated a loss of spheroid-forming ability in colon cancer cells [36]. In our study, we investigated the effect of IMP2 knockout on the ability of HCC, CRC, and lung cancer cells to form spheroids. The knockout of IMP2 in all tested cell lines resulted in a loss of their ability to form compact spheroids. This can be attributed to a reduction in cell adhesion, as previously shown in biallelic edited IMP2 knockout HCT116 cells [10]. The role of IMP2 in spheroid formation in cancer has not been extensively studied before.
In our previous work, we examined the effects of newly identified IMP2 inhibitors on 2D cell proliferation in HCT116 and Huh7 cells and on 3D cell proliferation in HCT116 and SW480 cells [10]. These inhibitors showed inhibition of both 2D and 3D proliferation, which aligns with our findings of reduced 2D proliferation in LLC1 cells upon compound treatment. It is important to note that while the inhibition is not entirely specific to IMP2, the fact that the effect is more pronounced in wild-type cells compared to IMP2 knockout clones suggests a significant reliance on IMP2 inhibition [10]. In this work, we present novel findings indicating that these compounds also exert an effect on a mouse cancer cell line, i.e., LLC1. Interestingly, we observed a reduced sensitivity towards these compounds in biallelic IMP2 knockout LLC1 cells when compared to their parental cell lines. It is worth mentioning that these compounds represent hits, which were identified through a screening approach [10] and have not been optimized for targeting IMP2 specifically. Nevertheless, the level of specificity we observed is quite noteworthy. Additionally, we observed reduced colony formation ability in LLC1, SW480, HepG2, and Huh7 cells following compound treatment.
In conclusion, our study validates IMP2 as a potential anti-cancer target in lung, liver, and colon cancer using in vitro models with the CRISPR/Cas9-prime editing-based gene knockout approach. This further supports the essential role of IMP2 in tumor cell proliferation, colony formation, and migration.
All data points generated or analyzed during this study are included in this article and there are no further underlying data necessary to reproduce the results.
AKK conceptualized and initiated the study. AKK, KL, CD, and SC designed the research study and reviewed the literature. SC, KL and JH performed the investigation and formal analysis. AKG helped analyze NGS results. HS analyzed the data on the effect of IMP2 inhibitors on 2D cell proliferation and metabolic activity in wild-type LLC1 cells. AKK contributed to the funding acquisition. ME and KW synthesized IMP2 inhibitors. SMK provided supporting data for the revision of the manuscript. SC wrote the original draft. SC, AKK, KL, JH, SMK, CD, KW, AKG, ME, and HS engaged in the review and editing of the manuscript. All authors read and approved the final manuscript. All authors have participated sufficiently in the work and agreed to be accountable for all aspects of the work.
Not applicable.
The authors gratefully acknowledge the invaluable contributions of Ms. Lisa Flöck for her assistance in maintaining the LLC1 IMP2 knockout clones in culture. We also extend our acknowledgment to Ms. Elena Celine Reckel, who conducted the experiments to test the effect of IMP2 inhibitors on 2D cell proliferation and metabolic activity in LLC1 cells. Their expertise and dedication have significantly improved the quality of this paper.
This project was funded, in part, by the German Research Foundation (DFG, KI702).
The authors declare no conflict of interest.
References
Publisher’s Note: IMR Press stays neutral with regard to jurisdictional claims in published maps and institutional affiliations.