


 , Yixiao Jiang 2, Ting Le 1, Yixin Wu 1, Ziqi Li 1, Guoqiang Zhang 2, Feiyue Wu 3,*
 , Haijie Ma 1,*
1 Cellular and Molecular Biology Laboratory, Zhoushan Hospital, Wenzhou Medical University, 316021 Zhoushan, Zhejiang, China
2 Department of General Surgery, Zhoushan Hospital, 316021 Zhoushan, Zhejiang, China
3 Department of Pharmacy, Zhoushan Hospital, 316021 Zhoushan, Zhejiang, China
†These authors contributed equally.
Abstract
Background: Despite the substantial impact of methylenetetrahydrofolate dehydrogenase 2 (MTHFD2) on cancer progression, its significance in the regulation of hepatocellular carcinoma (HCC) cell proliferation and chemosensitivity remains poorly defined. Methods: We evaluated MTHFD2 expression in a total of 95 HCC tissues by immunohistochemistry and analyzed the association of MTHFD2 with clinicopathologic features. qRT-PCR and Western blotting were conducted to verify MTHFD2 expression levels. Bioinformatics analysis such as gene set enrichment analysis (GSEA) and kyoto encyclopedia of genes and genomes (KEGG) enrichment analysis were used to predict the signaling pathways involved in MTHFD2. In addition, to investigate the anti-tumor effects of MTHFD2 knockdown, Cell Counting Kit-8 (CCK-8) and EdU assays were used. Results: We found that MTHFD2 was frequently upregulated in HCC, and the combination of increased expression of MTHFD2 and Ki67 was associated with poor HCC prognosis. MTHFD2 knockdown significantly inhibited HCC cell proliferation and effectively sensitized HCC cells to sorafenib and lenvatinib. PI3K/AKT pathway was involved in MTHFD2-mediated modulation of proliferation and chemosensitivity. Conclusions: These findings indicate that MTHFD2 plays an important role in proliferation and chemosensitivity of HCC, indicating that it may serve as a novel pharmacological target for improving HCC therapy.
Keywords
- MTHFD2
- proliferation
- chemosensitivity
- HCC
- Ki-67
Hepatocellular carcinoma (HCC) poses a major health problem worldwide as it ranks as the sixth most prevalent tumor and the third-leading cause of cancer-related deaths [1, 2]. Despite improvements in surgical methods and systemic chemotherapy, the long-term survival rate for patients with HCC still remains unsatisfactory [3, 4]. Hence, it is imperative to identify the mechanisms contributing to HCC progression and chemoresistance.
Accumulating evidence has indicated that tumor cells often rewire their metabolic signaling pathways for adaption to nutrient stress and/or promote cancer cell proliferation [5, 6], such as folate-mediated one-carbon metabolism (FOCM) [7]. In the folate cycle, the transfer of a single carbon unit from tetrahydrofolate to downstream acceptors in the mitochondrial and cytoplasmic compartments is linked with the three major metabolic cycles of the liver [8, 9]. The distinctive single-carbon pathway generates necessary metabolites for cellular development, including nucleotides and the nicotinamide adenine dinucleotide phosphate hydrogen (NADPH) [10, 11]. Therefore, a detailed analysis aimed at understanding the molecular mechanism of folate cycle metabolism may provide key insight into developing novel therapeutic strategies.
Methylenetetrahydrofolate dehydrogenase 2 (MTHFD2), a key formyltetrahydrofolate synthetase and cyclohydrolase enzyme, efficiently drives the folate cycle in embryonic tissue to support growth and proliferation [12]. Interestingly, MTHFD2 is also upregulated in several tumors to promote cancer cell proliferation and tumor progression by meeting the high demands for amino acid and nucleotide biosynthesis [13], while its expression is negligible in most healthy adult tissues [14]. Given this expression pattern, MTHFD2 has attracted much attention in cancer research. However, the functions of MTHFD2 in the regulation of HCC proliferation and chemosensitivity remain unclear.
In the present study, we found that MTHFD2 was frequently upregulated in HCC tissues, and combining its high expression with high Ki67 was correlated with the poor HCC prognosis. Furthermore, downregulation of MTHFD2 significantly inhibited cell proliferation and effectively sensitized HCC cells to sorafenib and lenvatinib by downregulating PI3K/AKT signaling. Our study strongly highlights the significance of MTHFD2 in HCC cell proliferation and chemosensitivity and therefore provides a potential strategy for improving HCC treatment strategies.
Chemicals and reagents were acquired from designated suppliers: SC79 (Cat No. T2274; TargetMol, Shanghai, China), DMSO (Cat No. D4540; Sigma-Aldrich, Darmstadt, Germany), Sorafenib (Cat No. HY-10201; MCE, Monmouth Junction, NJ, USA), Lenvatinib (Cat No. HY-10981; MCE, Monmouth Junction, NJ, USA), LY345899 (Cat No. T15827; TargetMol, Shanghai, China), FBS (Cat. No. 10099141C; Gibco, Grand Island, NY, USA), Lipofectamine RNAiMAX Transfection Reagent (Cat No. 13778500; Thermo Fisher Scientific, Waltham, MA, USA), CCK-8 Kit (Cat No. C008; 7Sea, Shanghai, China), Detergent Compatible Bradford Protein Assay Kit (Cat No.P0006C; Beyotime, Hangzhou, China), MycoBlue Mycoplasma Detector (Cat No. D101-01; Vazyme, Nanjing, China), Cell-Light EdU In Vitro Kit (Cat No. C10310; RiboBio, Guangzhou, China), TRIzol reagent (Cat No. 15596026; Thermo Fisher Scientific, Waltham, MA, USA), SYBR Premix Ex Taq Kit (Cat No. AKA1105; TaKaRa, Tokyo, Japan), PrimeScript II 1st Strand cDNA Synthesis Kit (Cat No. 6210A; TaKaRa, Tokyo, Japan), 1X SDS-PAGE Sample Loading Buffer (Cat No. P0015A; Beyotime, Hangzhou, China), SuperSignal West Femto (Cat No. 34094; Thermo Fisher Scientific, Waltham, MA, USA), BSA (Cat No. 4240GR500; Saiguo, Guangzhou, China).
Antibodies were obtained from the following sources: p-AKT (Ser473) (1:1000, Cat
No. 4060; CST, Danvers, MA, USA), AKT (1:1000, Cat No. 4691; CST, Danvers, MA,
USA), MTHFD2 (1:1000, Cat. No. H00010797-M01; Abnova, Taipei, China), Ki-67
(1:500, Cat No. ET1609-34; HUABIO, Hangzhou, China), and
The HCC tissue microarray (Cat No. HLiv-HCC180Sur-05) was obtained from Outdo BioTech (Shanghai, China). The HLiv-HCC180Sur-05 contained 95 HCC tissues and 85 adjacent tissues, 85 of which were paired tissues. Detailed clinicopathological features of the cohorts were also provided by Outdo BioTech (Shanghai, China). And other 35 pairs of matched HCC tissue samples were obtained from Zhoushan Hospitital (Zhoushan, China). An Ethics Committee approved by the appropriate hospital obtained written informed consent from each subject or subject’s guardian.
Tumor tissues and adjacent normal tissues were fixed with 10% neutral formalin
for a duration of 48 h, following standard procedures for paraffin embedding.
Subsequently, the tissues were sliced into sections measuring 4 µm. The tissue
sections were then subjected to treatment with 1 mM EDTA (pH = 8.0) and 3%
H
The human HCC cell lines, SMMC-7721 and HepG2, were obtained from the National
Collection of Authenticated Cell Cultures. Cells were cultured in Dulbecco’s
Modified Eagle Medium (DMEM) supplemented with 10% fetal bovine serum (FBS) at
37 °C in a humidified atmosphere of 5% CO
In accordance with the manufacturer’s protocol, the cells were transfected with 100 nM of siRNAs targeting MTHFD2 or the control. The target sequences of siRNAs were shown in the Supplementary Material.
A quantity of 5 µg of RNA was extracted from HCC tumor tissues and matched
adjacent tissues using TRIzol reagent. Subsequently, the entire RNA was
transcribed into cDNA using the PrimeScript II 1st Strand cDNA Synthesis Kit. The
SYBR Premix Ex Taq Kit was employed for conducting quantitative PCR with the
Applied Biosystems 7500 Real-Time PCR System (Applied Biosystems, Hammonton, NJ,
USA). The relative expression was obtained using the
2
Cells were washed twice using ice-cold PBS, and protein extracts were prepared
using RIPA reagent. The concentration was quantified using the Bradford assay.
Subsequently, 30 µg of proteins were subjected to SDS-PAGE and transferred onto
PVDF membranes. Protein analysis was conducted using antibodies against MTHFD2,
p-AKT (Ser473), AKT, and
A total of 3
The EdU proliferation test was performed according to the manufacturer’s protocol. After incubation at 37 °C, cells were added with 50 µM EdU and incubated for 2 h. Cells were then treated with 4% paraformaldehyde and then subjected to staining using Apollo Dye Solution. Nucleus was stained with hoechst33342. The images were taken using Leica Application Suite (version 3.0.0, Leica Microsystems, Wetzlar, Germany).
The bioinformatics analysis software and website were presented in the Supplementary Material.
All data were analyzed with GraphPad Prism 6.0 (GraphPad Software, Inc., San
Diego, CA, USA). The bar graphs depict the fold changes or percentage relative to
the control, along with a standard deviation of three independent experiments.
Student’s t-test was employed for the analysis of normally distributed
data, while one-way ANOVA with Tukey’s multiple comparisons was utilized for the
analysis of more than two groups. Survival was estimated by the Kaplan–Meier
method and compared by the log-rank test. Statistical significance was determined
as a p value below 0.05. Levels of significance were denoted as
*p
To investigate the role of folate metabolism-related genes in liver cancer, we first analyzed the changes in mRNA expression profiles and kyoto encyclopedia of genes and genomes (KEGG)/gene ontology (GO) pathways using the gene expression omnibus (GEO) database (GSE112790) (Fig. 1A; Supplementary Fig. 1). Then, we focused our initial efforts on 5 differentially-expressed genes (DEGs) with overlapping functions with folate metabolism-related genes (Fig. 1B). Of these, two genes (TYMS and MTHFD2) were upregulated and three genes (ALDH1L1, MTHFD2L, and FTCD) were reduced in HCC tumors relative to normal liver tissue (Fig. 1C,D).
 Fig. 1.
Analysis of folate metabolism-related genes in liver cancer.
(A) Heat map of differentially expressed mRNAs in GEO112790. (B) Venn diagram of
the differentially expressed genes (DEGs) in GSE112790 and genes associated with
the folate cycle (C) Volcano plots of the DEGs. (D) Differential expression
analysis of five genes in GSE112790. (E) The LASSO partial likelihood deviance
plot and the coefficient profiles of these 5 genes. *p
Next, we performed LASSO regression analysis for the 5 genes related to folate
metabolism to establish a prognostic model (Fig. 1E). Specifically, the model is
a RiskScore formula containing multiple genes where each gene is assigned a
numeric weight, a negative number represents a protective gene (FTCD),
and the positive number represents risk genes (TYMS, MTHFD2,
ALDH1L1, and MTHFD2L). The calculated Riskscore = (0.0129)
These 5 DEGs were subsequently used to divided HCC patients into high-risk and
low-risk groups (Fig. 2A). Their survival status is shown in Fig. 2B. There was a
highly significant difference in survival between the high and low-risk groups
(p = 1.86
 Fig. 2.
MTHFD2 is overexpressed in hepatocellular carcinoma (HCC)
tissues. (A) Distribution of risk scores for the 5-genes model. (B) Kaplan-Meier
survival curve of the patients in the high-risk and low-risk groups for OS. (C)
Time-related ROC analysis proved the prognostic performance of the risk score in
the training set. (D) The methylenetetrahydrofolate dehydrogenase 2 (MTHFD2) mRNA
expression between tumor and normal tissues was detected by qRT-PCR (n = 35). (E)
Immunohistochemical staining images of the tumor and normal tissues. (F)
Kaplan-Meier analysis according to different combinations of MTHFD2 and Ki67
expression. ***p
MTHFD2 is a key enzyme in the folate-mediated metabolism pathway that is often
hyperactivated in human cancers [17, 18, 19]. Thus, we examined its expression in 35
pairs of matched HCC/normal tissue samples using qRT-PCR. As shown in Fig. 2D,
MTHFD2 mRNA abundance was significantly higher in HCC tissues compared with their
adjacent counterparts in 18 out of 35 (51.4%) cases (p
| Group | Overall (n = 95) | MTHFD2 expression | p value | Ki-67 expression | p value | |||
| Low (n = 32) | High (n = 63) | Low (n = 63) | High (n = 32) | |||||
| Age (years) | 0.337 | 0.066 | ||||||
| 54 (56.8) | 16 (50.0) | 38 (60.3) | 40 (63.5) | 14 (43.8) | ||||
| 41 (43.2) | 16 (50.0) | 25 (39.7) | 23 (36.5) | 18 (56.2) | ||||
| Gender | 0.794 | 0.333 | ||||||
| Male | 85 (89.5) | 29 (90.6) | 56 (88.9) | 55 (87.3) | 30 (93.7) | |||
| Female | 10 (10.5) | 3 (9.4) | 7 (11.1) | 8 (12.7) | 2 (6.3) | |||
| Tumor size (cm) | 0.517 | 0.509 | ||||||
| 43 (45.3) | 13 (40.6) | 30 (47.6) | 27 (42.9) | 16 (50.0) | ||||
| 52 (54.7) | 19 (59.4) | 33 (52.4) | 36 (57.1) | 16 (50.0) | ||||
| Liver cirrhosis | 0.162 | 0.696 | ||||||
| Without | 59 (62.1) | 23 (71.9) | 36 (57.1) | 40 (63.5) | 19 (59.4) | |||
| With | 36 (37.9) | 9 (28.1) | 27 (42.9) | 23 (36.5) | 13 (40.6) | |||
| Portal vein invasion | 0.594 | 0.594 | ||||||
| Without | 88 (92.6) | 29 (90.6) | 59 (93.7) | 59 (93.7) | 29 (90.6) | |||
| With | 7 (7.4) | 3 (9.4) | 4 (6.3) | 4 (6.3) | 3 (9.4) | |||
| Histologic grade | 0.040 | |||||||
| G1 | 3 (3.2) | 0 (0.0) | 3 (4.8) | 3 (4.8) | 0 (0.0) | |||
| G2 | 58 (61.0) | 25 (78.1) | 33 (52.3) | 47 (74.6) | 11 (34.4) | |||
| G3 | 34 (35.8) | 7 (21.9) | 27 (42.9) | 13 (20.6) | 21 (65.6) | |||
| TNM | 0.826 | 0.516 | ||||||
| I&II | 46 (48,4) | 16 (50.0) | 30 (47.6) | 32 (50.8) | 14 (43.8) | |||
| III&VI | 49 (51.6) | 16 (50.0) | 33 (52.4) | 31 (49.2) | 18 (56.2) | |||
| Metastasis | 0.308 | 0.622 | ||||||
| Without | 93 (97.9) | 32 (100.0) | 61 (96.8) | 62 (98.4) | 31 (96.9) | |||
| With | 2 (2.1) | 0 (0.0) | 2 (3.2) | 1 (1.6) | 1 (3.1) | |||
| Survival | 0.108 | 0.511 | ||||||
| Deceased | 61 (64.2) | 17 (53.1) | 44 (69.8) | 39 (61.9) | 22 (68.7) | |||
| Alive | 34 (35.8) | 15 (46.9) | 19 (30.2) | 24 (38.1) | 10 (31.3) | |||
| Ki-67 | 0.028 | |||||||
| 63 (66.3) | 26 (81.3) | 37 (58.7) | ||||||
| 32 (33.7) | 6 (18.7) | 26 (41.3) | ||||||
TNM, tumor node metastasis.
Ki-67 is a traditional proliferation marker widely used in studies of various
cancer types, including HCC. Furthermore, tumor histologic grade has also been
found to be tightly associated with tumor prognosis [20, 21]. Consequently, we
examined the influence of MTHFD2 and Ki-67 expression on the survival of patients
using Kaplan-Meier analysis with the long-rank test. Findings obtained indicated
that the poorer overall survival was associated with the combination of high
MTHFD2 and high Ki-67 levels (p
Next, we explored the biological significance of MTHFD2 expression on various
signaling pathways using gene set enrichment analysis (GSEA) analysis, and found
that comparing the MTHFD2-high versus the MTHFD2-low groups indicated a
significantly enrichment in multiple proliferation-related pathways. It is
generally believed that the
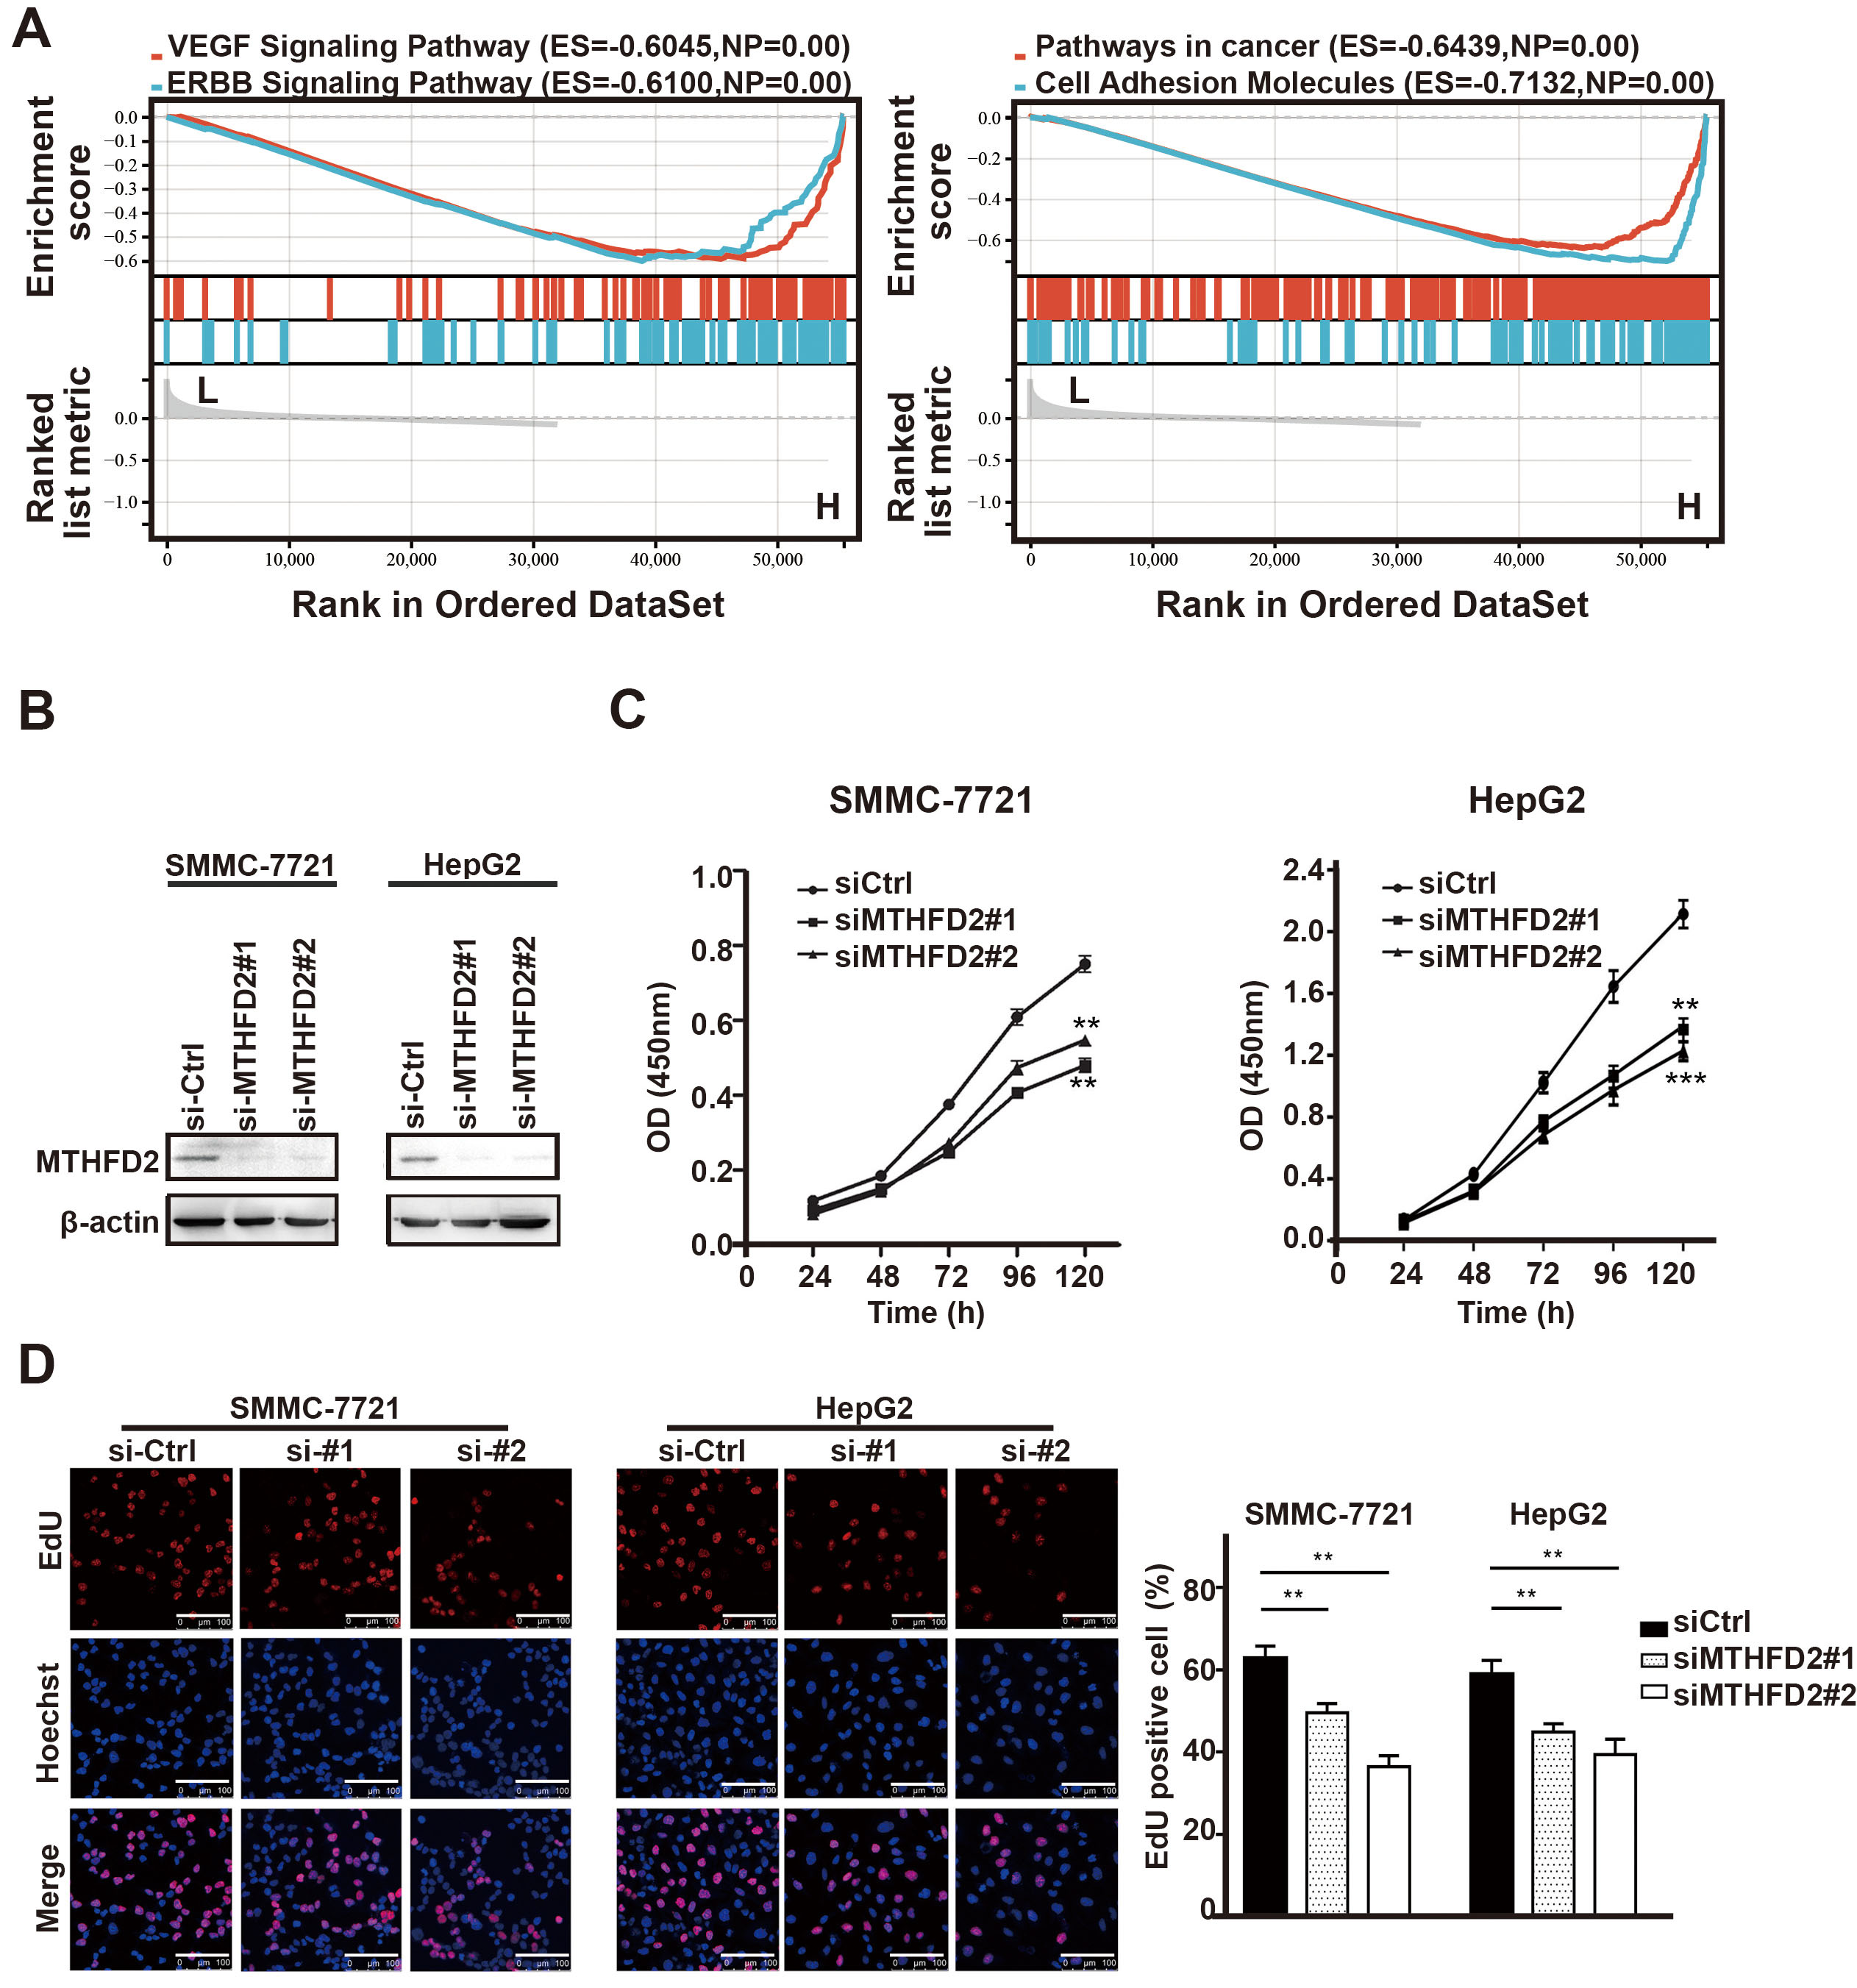 Fig. 3.
Downregulation of MTHFD2 inhibits the proliferation of HCC. (A)
Gene set enrichment analysis (GSEA) showed that several Proliferation-related
signal pathways were inhibited in the MTHFD2-low group. (B) Western blotting
analysis showed the MTHFD2 knockdown efficiency with two unique siRNAs (#1, #2)
in SMMC-7721 and HepG2 cells. (C) Effects of MTHFD2 knockdown on cell
proliferation were assessed by CCK-8 cell proliferation assay. (D) DNA synthesis
in SMMC-7721 and HepG2 cells was measured using the EdU assay. Photographs were
taken under an optical microscope with a magnification of 400
Therefore, to evaluate the effect of MTHFD2 on HCC cell proliferation, MTHFD2 was knocked down in SMMC-7721 and HepG2 HCC cell lines (Fig. 3B). As shown in Fig. 3C,D, knockdown of MTHFD2 considerably decreased cell proliferation ability, suggesting a significant role in modulating HCC cell activity. Additionally, the MTHFD2 inhibitor LY345899 also reduced the proliferation of HCC (Supplementary Fig. 3).
To investigate the mechanism underlying the effect of MTHFD2 on cell proliferation, bioinformatic analysis was utilized to analyze the correlation between signaling pathways and MTHFD2 expression. Firstly, the expression profile data and corresponding clinical information from liver cancer patients in the cancer genome atlas (TCGA) dataset were downloaded. Second, bioinformatic analysis was applied and results show that PI3K/AKT signaling is the most enriched pathway associated with MTHFD2 expression with 90 up-regulated genes participating in this signaling axis, and its GeneRatio score is the highest among all signals (Fig. 4A,B; Supplementary Fig. 2).
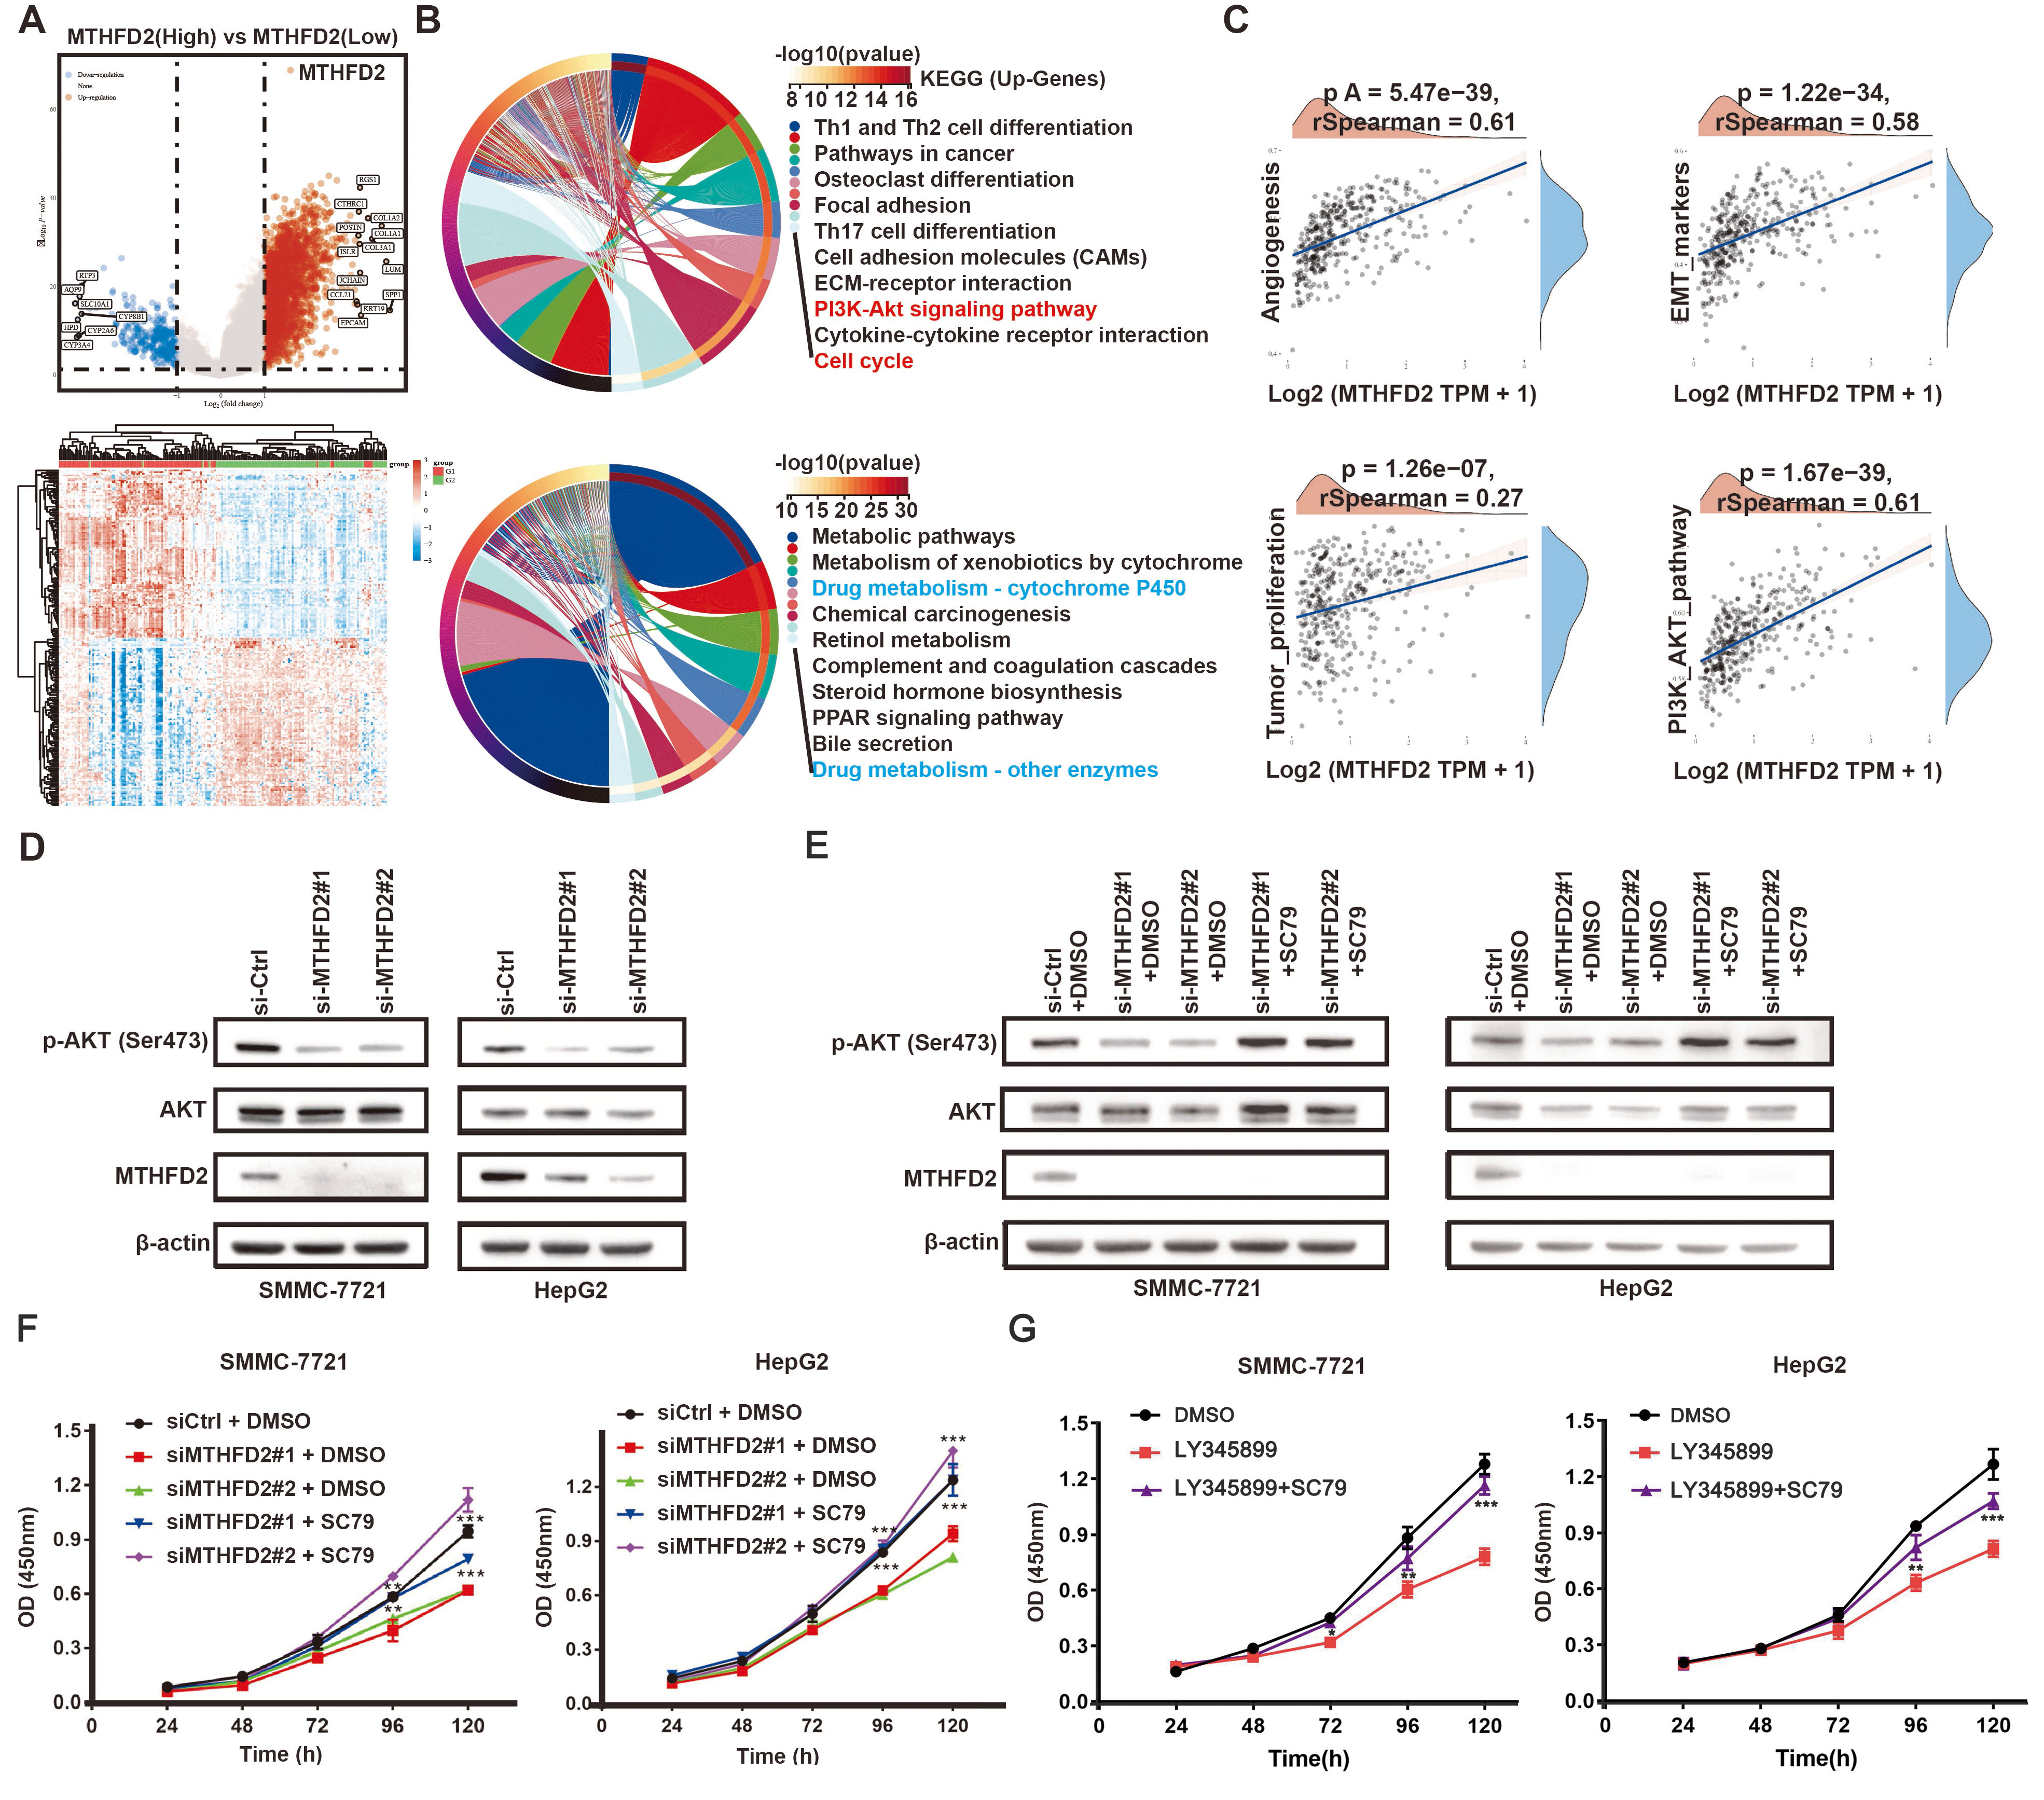 Fig. 4.
MTHFD2 regulates HCC cell proliferation via PI3K/AKT signaling
pathway. (A) Volcano plots of the DEGs between MTHFD2-high and MTHFD2-low
groups. (B) Results of KEGG enrichment analysis of DEGs between high-expression
and low-expression groups of MTHFD2. (C) Correlation analysis between MTHFD2 and
signal pathways. (D,E) Protein levels of p-AKT, AKT, and MTHFD2 were analyzed
using Western blotting in cells transfected with MTHFD2 siRNA, as well as cells
treated with or without the AKT pathway activator SC79 (15 µM, 24 h). (F) CCK-8
assay was used to assess cell proliferation in cells transfected with MTHFD2
siRNAs, with or without the AKT activator SC79 (15 µM, 24 h). (G) CCK-8 assay was
used to assess cell proliferation in cells incubated with LY345899 (50 µM, 72 h),
with or without SC79 (15 µM, 24 h). Experiments were performed three times
independently and the data were represented as the means
The correlations between MTHFD2 and pathway scores were examined using Spearman
analysis. We selected four pathways that were significantly correlated with tumor
malignancy and analyzed their correlation with MTHFD2 expression. Results
indicated that all four pathways showed a significant positive correlation with
MTHFD2 (r
To confirm whether MTHFD2 expression impacts HCC cell chemosensitivity, MTHFD2 was knocked down in SMMC-7721 and HepG2 cell lines followed by treatment with sorafenib or lenvatinib. As shown in Fig. 5 and Supplementary Fig. 4, MTHFD2 knockdown resulted in decreased proliferative ability compared with control groups, indicating that knockdown of MTHFD2 effectively sensitizes HCC cells to sorafenib and lenvatinib.
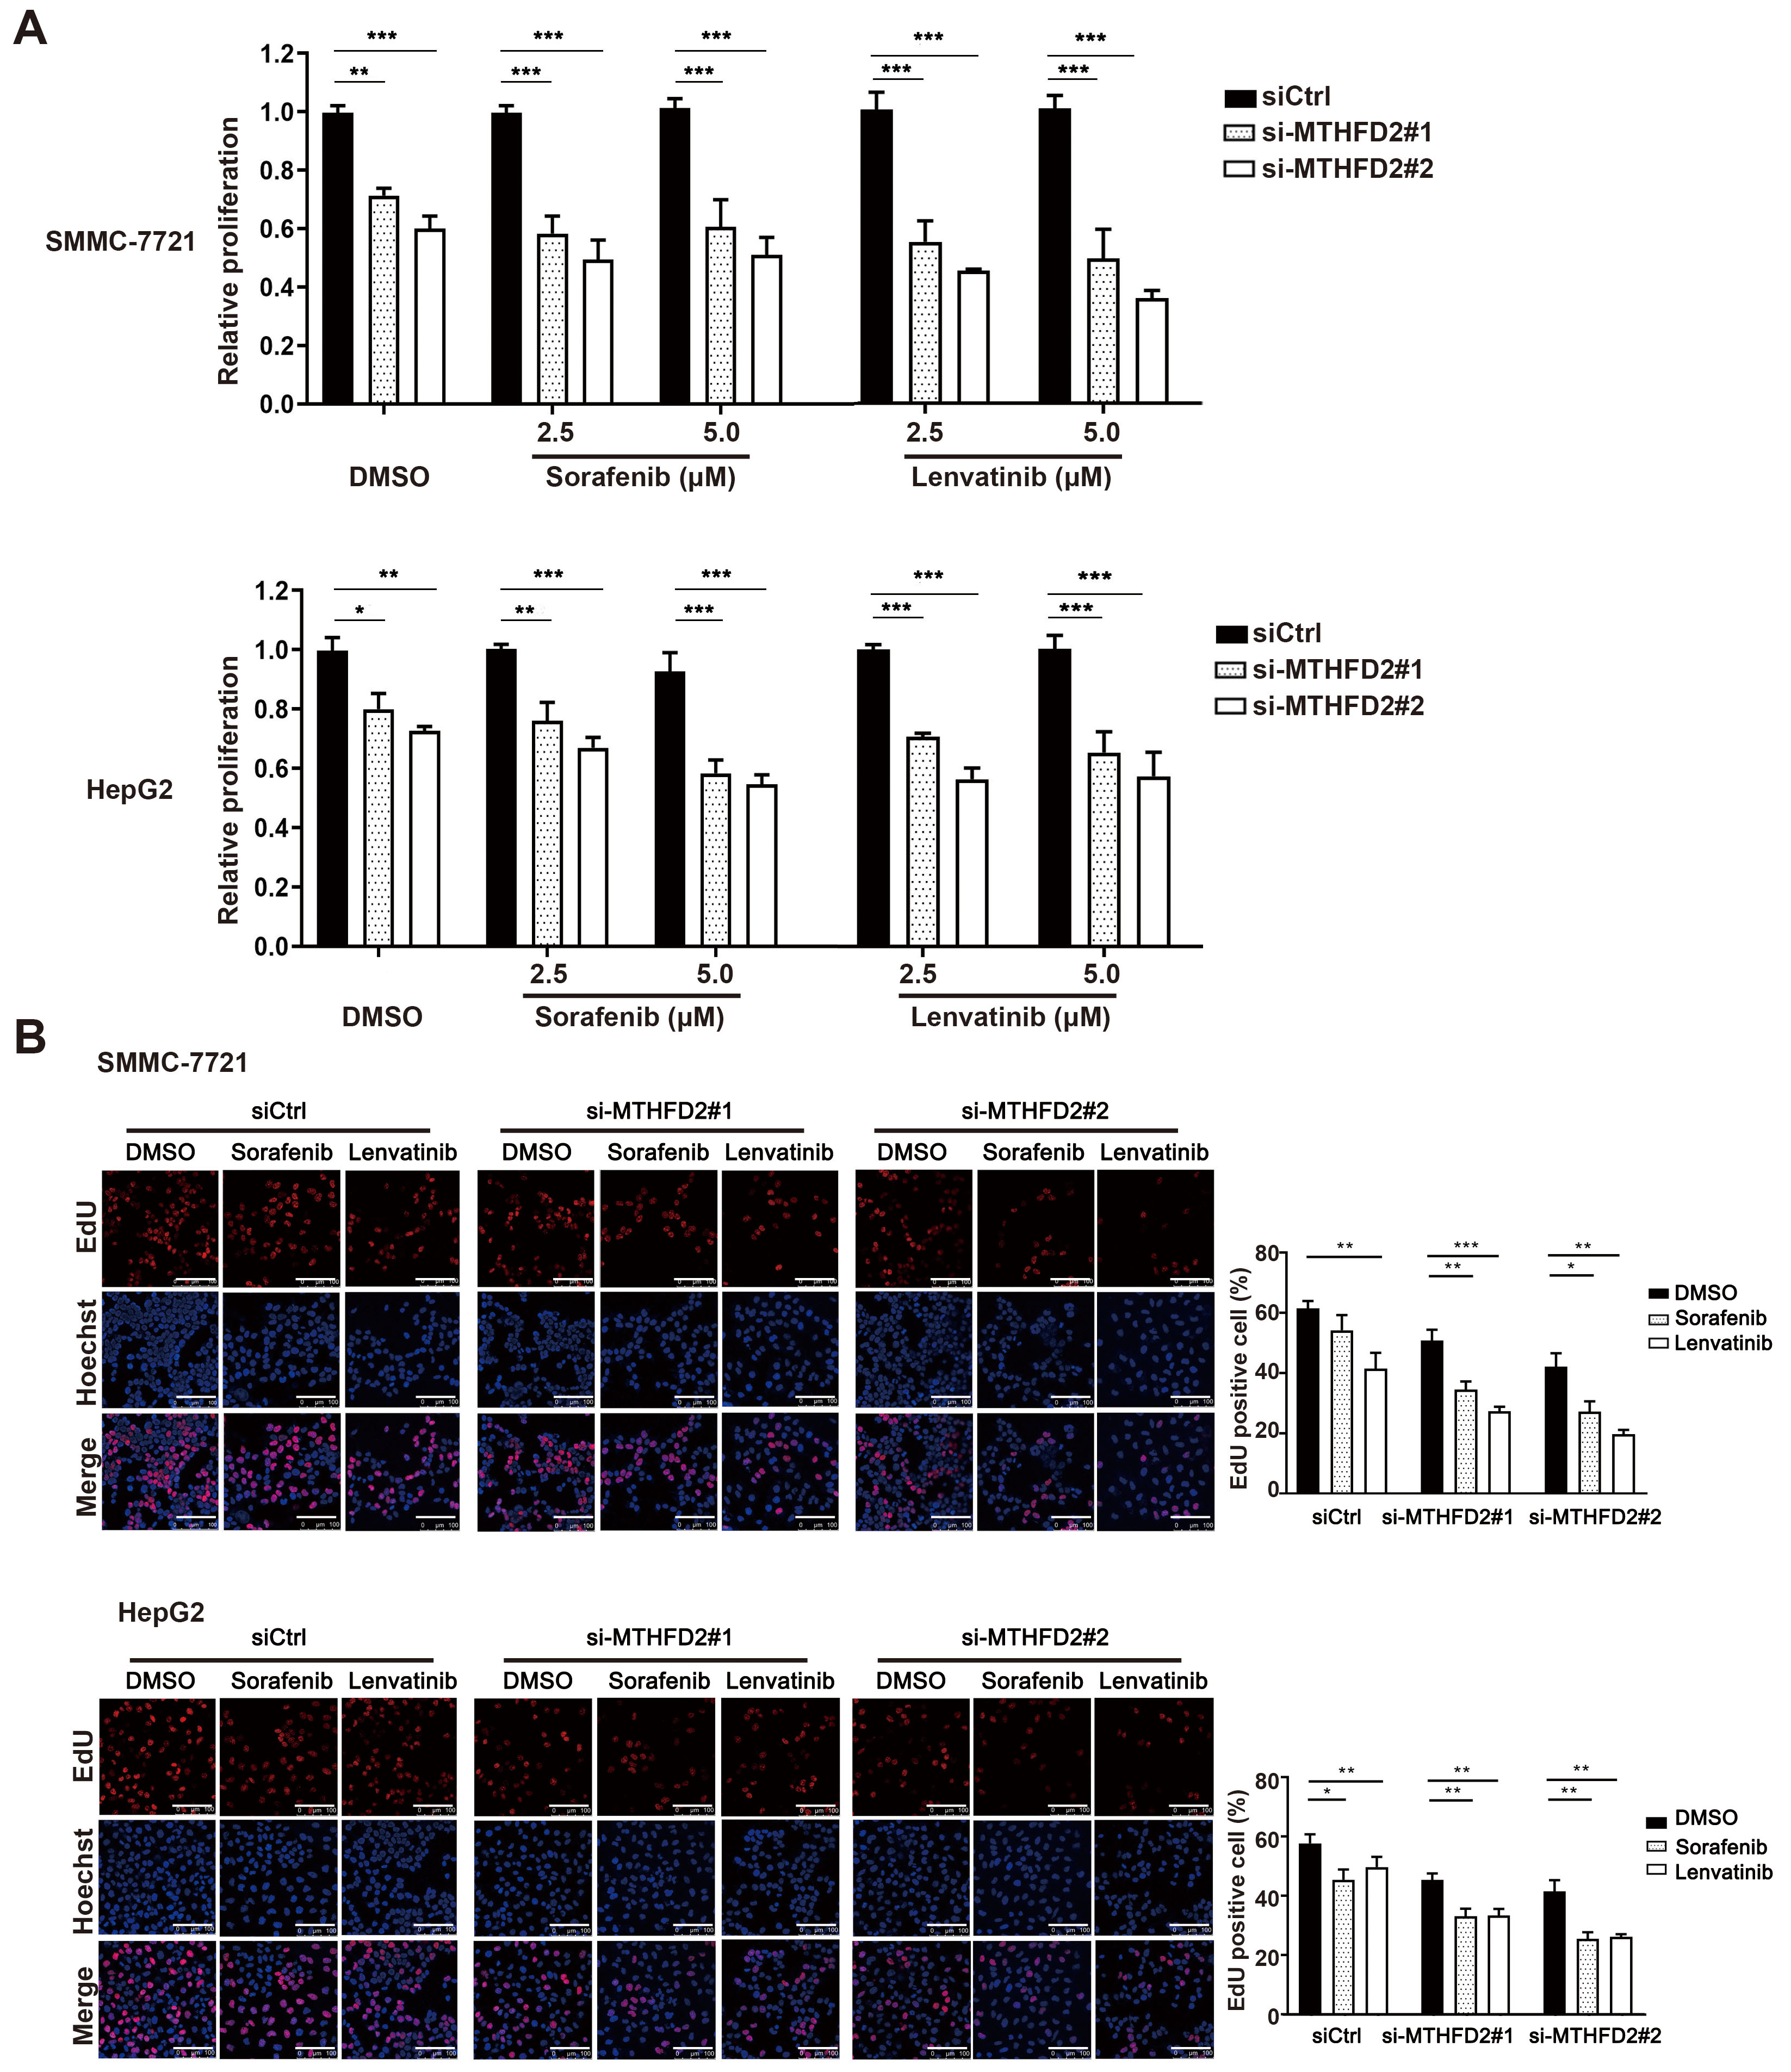 Fig. 5.
Knockdown of MTHFD2 sensitized HCC cells to sorafenib and
lenvatinib treatment. (A) Proliferation of SMMC-7721 and HepG2 cells treated
with MTHFD2 siRNAs in the presence of control, different concentrations of
sorafenib or lenvatinib. (B) DNA synthesis in SMMC-7721 and HepG2 cells treated
with MTHFD2 siRNAs in the presence of DMSO, sorafenib, or lenvatinib. Photographs
were taken under an optical microscope with a magnification of 400
Accumulating evidence indicates the combination of Ki-67 and other molecular markers can be used to more accurately predict patient prognosis in various cancers [22, 23, 24, 25, 26]. In this study, the heightened expression of MTHFD2 is positively associated with increased Ki-67 expression in HCC. Moreover, combining MTHFD2 with Ki-67 notably predicted poorer prognosis for HCC patients, while either MTHFD2 or Ki-67 alone showed no significant impact on HCC patient overall survival, suggesting the clinical value in diagnosing HCC. However, due to small overall sample sizes for HCC patients, analyses such as Cox regression may be affected by bias; thus, further validation are required.
Several studies have suggested that mitochondrial FOCM, which is highly correlated with cancer malignancy [27], acts as a critical regulator of NAD(P)H, ATP, glycine, and one-carbon unit biosynthesis used for cytoplasmic biosynthetic reactions [11, 28]. For example, serine hydroxymethyltransferase-2 (SHMT2) over-expression significantly affects intracellular oxidative phosphorylation, purine metabolism, and serine/glycine metabolism in breast cancer cells [29]. Additionally, MTHFD2 silencing could trigger apoptosis by altering NADPH/NADP levels in cancer cells [30]. Driven by our initial observation that MTHFD2 is associated with poor HCC prognosis, we investigated the role of MTHFD2 in HCC development. We noted that knockdown of MTHFD2 led to reduced cell proliferation, suggesting the importance of this enzyme in stimulating HCC growth and malignancy. Using bioinformatic analyses, we found that MTHFD2 may mediate HCC development through PI3K/AKT signaling. Subsequent examination of p-AKT displayed a decrease in abundance in response to MTHFD2 knockdown. In addition, the AKT agonist SC79 rescued the suppressive impact of MTHFD2 siRNAs on cellular growth. Taken together, our findings demonstrate that MTHFD2 facilitates HCC cell proliferation through enhanced PI3K/AKT signaling pathway activity.
Emerging evidence has indicated that mitochondrial enzymes in folate metabolism play critical roles in tumor chemosensitivity. For example, SHMT2-mediated compartmentalization of folate metabolism drives 5-FU resistance in colorectal cancer [31]. Further, knockdown of the circular RNA circ-MTHFD1L combined with olaparib sensitizes the pancreatic cancer cells to gemcitabine [32]. Also, downregulation of MTHFD2 restored gefitinib sensitivity and diminished stem-like characteristics in drug-resistant lung cancer cells [33]. In this study, we demonstrated that downregulation of MTHFD2 rendered HCC cells more sensitive to sorafenib and lenvatinib, suggesting a novel strategy for improving HCC chemosensitivity. However, the molecular mechanisms underlying this MTHFD2-dependent effect on chemoresistance in HCC require further exploration.
In summary, elevated expression of MTHFD2 mRNA and protein is commonly found in HCC, and overexpression of MTHFD2 is associated with aggressive clinical features in this tumor type. MTHFD2 expression, when combined with heightened Ki-67 expression, serves as a refined prognostic indicator for HCC patients. Furthermore, we demonstrated that MTHFD2 plays a critical role in HCC cell proliferation and chemosensitivity. Collectively, our findings provide new insights into the development of HCC, and the potential for MTHFD2 as a promising target for effective treatment of HCC.
HCC, hepatocellular carcinoma; MTHFD2, methylenetetrahydrofolate dehydrogenase 2; FOCM, folate-mediated one-carbon metabolism; NADPH, nicotinamide adenine dinucleotide phosphate hydrogen; siRNA, small interfering RNA; LI, labeling index; KEGG, kyoto encyclopedia of genes and genomes; GO, gene ontology; GEO, gene expression omnibus; GSEA, gene set enrichment analysis; DEG, differentially expressed genes; TCGA, the cancer genome atlas; TYMS, thymidylate synthetase; ALDH1L1, aldehyde dehydrogenase 1 family member L1; NES, normalized enrichment score; SHMT2, serine hydroxymethyltransferase 2; MTHFD1L, methylenetetrahydrofolate dehydrogenase 1 like.
The datasets used and/or analyzed during the current study are available from the corresponding author on reasonable request.
All authors contributed to the study conception and design. The research was conceived and designed by HM and FW. JW performed the majority of the experiments, while ZY was responsible for bioinformatics analysis and the design of figures. YJ, TL and YW analyzed data and collected clinical data. ZL and GZ contributed to analysis and interpretation of data. All authors contributed to editorial changes in the manuscript. All authors read and approved the final manuscript. All authors have participated sufficiently in the work and agreed to be accountable for all aspects of the work.
This study was performed in line with the principles of the Declaration of Helsinki. Approval was granted by the Ethics Committee of Zhoushan Hospital (Date.2019/No.066). Written informed consent are obtained from each subject or subject’s guardian.
Not applicable.
This research was supported by the Zhejiang Provincial Natural Science Foundation of China (LGF21H160020) and the Zhoushan Science and Technology Program (2019C31076).
The authors declare no conflict of interest.
References
Publisher’s Note: IMR Press stays neutral with regard to jurisdictional claims in published maps and institutional affiliations.