


 , Fatima 3, Zuhair Hasnain 4,*, Nazia Aslam 2, Naeem Iqbal 2, Sammar Abbas 5, Hui Li 6, Jia Li 1, Bo Chen 1, Arthur J. Ragauskas 7,8,9, Manzar Abbas 1,*
1 School of Agriculture, Forestry and Food Engineering, Yibin University, 644000 Yibin, Sichuan, China
2 Botany Department, Government College University, 38000 Faisalabad, Punjab, Pakistan
3 Department of Mathematics, University of Karachi, 75270 Karachi, Sindh, Pakistan
4 PMAS Arid Agriculture University, Rawalpindi, 44000 Rawalpindi, Punjab, Pakistan
5 College of Biological Sciences and Biotechnology, Beijing Forestry University, 100091 Beijing, China
6 College of Forestry, Inner Mongolia Agricultural University, 010019 Hohhot, China
7 Department of Forestry, Wildlife, and Fisheries, Center for Renewable Carbon, University of Tennessee Institute of Agriculture, Knoxville, TN 37996, USA
8 Joint Institute for Biological Science, Biosciences Division, Oak Ridge National Laboratory, Oak Ridge, TN 37831, USA
9 Department of Chemical and Biomolecular Engineering, University of Tennessee Knoxville, Knoxville, TN 37996, USA
Abstract
Biotic and abiotic stresses significantly affect plant fitness, resulting in a serious loss in food production. Biotic and abiotic stresses predominantly affect metabolite biosynthesis, gene and protein expression, and genome variations. However, light doses of stress result in the production of positive attributes in crops, like tolerance to stress and biosynthesis of metabolites, called hormesis. Advancement in artificial intelligence (AI) has enabled the development of high-throughput gadgets such as high-resolution imagery sensors and robotic aerial vehicles, i.e., satellites and unmanned aerial vehicles (UAV), to overcome biotic and abiotic stresses. These High throughput (HTP) gadgets produce accurate but big amounts of data. Significant datasets such as transportable array for remotely sensed agriculture and phenotyping reference platform (TERRA-REF) have been developed to forecast abiotic stresses and early detection of biotic stresses. For accurately measuring the model plant stress, tools like Deep Learning (DL) and Machine Learning (ML) have enabled early detection of desirable traits in a large population of breeding material and mitigate plant stresses. In this review, advanced applications of ML and DL in plant biotic and abiotic stress management have been summarized.
Graphical Abstract
Keywords
- biotic and abiotic stresses
- satellite
- unmanned aerial vehicle
- smart-phones
- artificial intelligence
- machine learning
- deep learning
- plant phenotyping
By 2050, it is expected that the world population will surpass ~10 billion people; hence, crop production must increase by 25–70% [1]. In order to improve crop yield, the selection of biotic and abiotic stress-resistant verities with the deployment of precise and robust tools is needed [2]. High throughput (HTP) tools integrated with AI to collect data, and analyze with ML and DL models have proven very effective (Fig. 1) [3, 4, 5]. ML deals with decision theories, visualization, optimization, and probability to analyze various combinations of numerous traits based on guided and unguided instructions (Fig. 1) [6, 7]. DL models include generative adversarial networks (GAN), convolutional neural networks (CNN), and multilayer perceptron (MLP) [8] for the interpretation of a large dataset via image detection, tracking, classification, and segmentation during plant stress monitoring [9]. In serial manners, ML follows the following four steps: identification, classification, quantification, and prediction to identify biotic stress in plants [10]. To analyze data from both healthy and infected plants, ML uses supervised discriminative models, an unsupervised model for the data of only healthy plants, and a simple deviation detection method for contaminated plants [11]. Unsupervised models are quite useful for quantification and even can be applied to small datasets. ML precisely predicts infection at the earliest stage.
 Fig. 1.
Classification of machine and deep learning models. Machine learning models are comprised of unsupervised learning, semi-supervised, supervised, and reinforcement learning.
In phenotyping, low-throughput methods are in practice, which need to be replaced by high-throughput, non-invasive methods [12]. To improve plant phenomics, non-invasive sensors, imaging techniques, analytical tools, and sensors have been invented [13]. The development of a single HTP imaging platform harboring all aforementioned devices and programs has enabled the precise collection of biotic and abiotic stress data (Table 1). For example, GROWSCREEN FLUORO is being used to measure chlorophyll fluorescence and leaf growth to analyze biotic and abiotic stress tolerance [14]. HyperART is being employed in non-destructive quantification of disease severity and chlorophyll contents of various plants like maize, rapeseed, barley, and tomato [15]. Similarly, PHENOVISION and PlantScreen™ Robotic XYZ System are being used to measure drought stress in maize and rice, respectively [16, 17]. LemnaTec 3D Scanalyzer system and Phenobox are being employed in the measurement of the effects of salinity stress on rice, maize, and tobacco [18, 19]. PhénoField® is very helpful in measuring the effects of numerous stresses on wheat [19]. HTP data about plant height, biomass, radiation use efficiency, leaf, shoot, root, early vigor, and photosynthesis is being recorded automatically (Fig. 2). CropQuant [20], RootReader3D [21], PHENOARCH [22], Zeppe-lin NT aircraft [7], MVS-Pheno [23], Field Scanalyzer [24], and GROWSCREEN-Rhizo [25] are promising HTP platforms for collection of biotic and abiotic stress resistance data of different crops (Table 1).
| AI Techniques | Algorithms | Application | Datasets | Model plant | Stress |
| Successive Approximation Model (SAM) | SAM | Identification | Remote sensing | Sugar beet (Beta vulgaris) | Pests and disease |
| Deep Learning | Convolutional Neural Networks (CNN), Alex Net, Google net, Inception V3, Least PLS-DA, LS-VSM | Identification | 1200 photos taken by camera under stress and non-stress conditions | Maize, okra, soybean | Water tension |
| SVM and Gaussian processes classifier (GPC) | SVM and Gaussian processes classifier (GPC) | Identification | Visible and thermal images | Spinach (Spanicia oleraceae) | Abiotic stress |
| Unsupervised Machine Learning | Convolutional Neural Networks (CNN), Alex Net, Google net, PLS-DA, Least squares support vector machine, LS-VSM | Identification | Hyperspectral images of canopy of tobacco plants | Tobacco | Heavy metal stress |
| Optic Disc (OD) segmentation | OD: 99.61% | Recognizes and removes the blood artery for correct segmentation of the Optic Disc (OD) | Images | Blood artery | |
| OBIA-based classification | OBIA-based classification | Identification | UAV-based RGB images and multispectral image | Sunflower (Helianthus annus) | Biotic stress |
| Deep Learning (Image) | CNN | Identification | 1426 images of rice diseases and pests from paddy fields | Rice | Biotic stress |
| Unsupervised Machine Learning (Video Imaging) | Hidden Markov’s model (HMMs) | Identification and Classification | Chlorophyll fluorescence digital profiles from Grow Tech Inc. | Phaseolus vulgaris | Stressor level groups (Low, medium, and high stressed) and drought, nutrient, and chemical stress |
| Deep Learning (Image) | K-nearest neighbors (KNN) | Identification and Classification | 1747 smart phone images of arabica coffee leaves | Arabica coffee | Biotic stress, cercospora leaf spot |
| Unsupervised Machine Learning, Partial Least Square Regression, Principal Component Analysis | CNN | Identification and Classification | Spectral signature of leaf samples obtained with a visible, near infra-red spectrometer | Rice | Salt stress |
| ANN variant | Artificial Neural Networks (ANN) variant | Identification | RGB images | Orchid (Phalaenopsis) | Disease |
| Supervised Machine Learning | Relief, Support vector machine | Identification and Classification | Images from four wheat lines | Wheat | Salt stress |
| Deep Learning (Image) | Identification and Classification | 1575 images (smart phones, compact cameras, DSLR) | Different plant specimen | Biotic stress | |
| Deep Learning | Identification and Classification | Hyperspectral images | Bromus inermis | Drought stress | |
| Supervised Machine Learning | Identification and Classification | RGB leaf images from Kaggle database | Brinjal leaves | Biotic stress |
 Fig. 2.
Schematic diagram of high throughput and automated artificial intelligence-based remote phenotyping platform based on satellite, unmanned aerial vehicle (UAV), smart phone, control shed, and ground imagery to record plant height, biomass, radiation use efficiency, leaf traits, herbs and insect identification, early vigor, and photosynthesis.
HTP imaging techniques have evolved significantly in recent years. Remote sensing is being employed to detect biotic and abiotic stress in plants via satellites (Fig. 2) [26, 27, 28]. HTP unmanned aerial vehicles (UAV) are very useful for capturing highly-resolution images with drones and handheld mobile phones (Fig. 2). Additionally, UAVs installed with HTP sensors capture photos of crop fields at once to identify drought stress and insect/pest attack [29]. On the other hand, ground-based imaging platforms can capture pictures of very small areas to analyze miniature changes in plant growth (Fig. 2). Notably, ground-based imaging platforms provide accurate and detailed images at the level of a single plant, branches, and even single leaf in a crop [30]. In addition, ground-based imaging platforms work in an auto-engaged, time-scheduled analysis manner. All these HTP methods of data collection generate terabytes (TB) of data per day, which can only be analyzed with DL and ML algorithms. A brief overview of available imaging techniques to investigate biotic and abiotic stresses is given below.
Satellites can cover and take images of a big part of ~1000 hectares or even an entire country. These observation satellites are integrated with multiple sensors to collect information from the ground (Fig. 2). These sensors don’t work the same way as thermal, time-of-flight, hyperspectral, multispectral, or RGB ones. Instead, gather data from the electromagnetic (EM) spectrum at various wavelengths. These sensors focus on 2–10 of the various bands in the EM spectrum, specifically the Green (G), Red (R), and Blue (B) bands. High-resolution RGB images are then produced using the data gathered from these distinctly necessary bands. In addition to RGB, bands near-infrared or infrared are also employed in satellite imagery [31].
Mobile phones are mostly provided with high-pixel cameras that can capture basic pictures. In order to capture 3D images, the integration of advanced sensors such as LiDAR is very useful [32]. Advanced mobile phones are equipped with high-resolution, influential, and AI computing cameras (Fig. 2). Other portable devices are also equipped with smart phone technology, which is helpful in strengthening and expanding the range of sensors. It provides broad range connectivity and portability as compared to traditional phenotyping equipment.
UAV imaging is used for large-scale HTP studies [33]. UAV works on an orthomosaic model to capture numerous images of various patches of the field (Fig. 2), which are combined into a large single image [34]. The following software, Pix4D, QGIS, and Open, are used to capture orthomosaic pictures with the help of UAVs [35]. Images taken from the ground are of high resolution as compared to the images taken from satellites or UAVs. This is an advantage for the hyperspectral sensors because they work on low spatial resolution.
One of the most advanced imaging techniques is the ground-based imaging platform (Fig. 2). It is very precise to measure biotic and abiotic stress in plants at very close ranges [36]. Its proximate values of phenotyping are very efficient, similar to manually captured pictures [37]. These ground-based platforms use on-board chips to analyze the characteristics of each plant organ in an automatic manner [38].
Images obtained using the mentioned methods require the use of spectral indices (SIs), such as vegetation indices (VIs) [39], to measure the rate of photosynthesis and canopy structure [40]. It involves the conduction of various operational sets working on different layers of the obtained images. In these operations, a number is assigned to mathematical calculations and wavelengths of spectral references to indicate comparative profusion of a feature of interest [41]. In this study, we have summarized how various VIs are used to deal with different aspects of captured images. Spectral calculations are measured through various spectral bands for measuring information about vegetation and decoding features of the images. VI provides a significant level of information about plant architecture, biomass, phenotype, canopy, rate of photosynthesis, and level of stress [42].
Big data problems are brought on by the increased volume of data obtained by HTP platforms in agricultural practices. In order to invent new and robust technologies, the demand for the capacity to analyze and comprehend data is increasing. Mckinsey industry reveals that there is a 50% increase in data generation every year, a 40-fold increase since 2001 [43]. Pictures are captured and analyzed using DL and ML to detect various amounts and types of challenges (Table 2), such as contents of aflatoxin in maize [44], salinity stress on chickpeas [3], cucumber’s powdery mildews [45], and rot on wheat leaves [46]. ML has proven an excellent approach for identifying biotic and abiotic stresses at an early stage and mitigating them in a precise way [2].
| AI Techniques | Algorithms | Application | Datasets | Model plant | Stressor |
| Deep Learning (Image) | Deep convolutional neural network (DCNN) | Identification, classification, and quantification | Collection of images of stressed and healthy soybean leaflets in the field | Soybean (Glycine max L.) | Bacterial blight (Pseudomonas savastanoi), bacterial pustule (Xanthomonas axonopodis), sudden death syndrome (Fusarium virguliforme), Septoria brown spot (Septoria glycines), Frogeye leaf spot, chlorosis due to iron deficiency, potassium deficit, and pesticide damage |
| KNN, quadratic discriminant analysis (QDA), and linear discriminant analysis (LDA) | KNN, quadratic discriminant analysis (QDA), and linear discriminant analysis (LDA) | Identification | Spectroradiometer | Citrus | Disease |
| Supervised Machine Learning | Random Forest (RF), Support Vector Machine (SVM), KNN | Classification and prediction | Real-time tetrahertz time-domain spectroscopic data (THz-TDS) | Basil, coriander, parsley baby-leaf, coffee, pea | Water stress |
| Supervised Machine Learning | RF, Artificial neural network (ANN), and confident multiple-choice learning | Classification | Multispectral images | Maize | Water stress |
| Supervised Machine Learning | Confident multiple-choice learning | Identification and prediction | Gene expression time series datasets | Arabidopsis thaliana | Heat, cold, salt, and drought |
| Single Ventricle Interactive Model (SViM) | SViM | Identification | Hyperspectral | Tomato | Water stress |
| Deep Learning (Image) | CNN | Classification | Images of Sorghum plant shoot from the Donald. Danforth plant science center | Sorghum plants | Nitrogen deficiency |
| Gaussian mixture model | Gaussian mixture model | Identification | RGB images | Wheat (Triticum aestivum L.) | Disease |
| Supervised Machine Learning | Decision tree (DT), SVM, Naive Bayes (NB) | Classification | Metabolite and protein content | Arabidopsis thaliana | Metabolic stress |
| Supervised Machine Learning | SVM | Classification | Biweekly RBG, stereo, and hyperspectral spatio-temporal images | Sugar beet plants | Drought and weed stress, nitrogen deficiency |
| Linear discriminant analysis (LDA) and K-means | Linear discriminant analysis (LDA) and K-means | Identification and Classification | RGB images | Clover (Trifolium subterraneum L.) | Pollution |
| Supervised Machine Learning | Hierarchical models | Classification | 5916 RGB images, plant introduction accessories (PI) in different time points | Soybean (Glycine max) | Iron deficiency chlorosis |
| Supervised Machine Learning | ANN, CNN, Optimum path stress, KNN, and SVM | Classification | Electrical signal under cold, low light, and osmotic stimuli | Soybean plants | Cold, low light, and osmotic stimuli |
| k-NN and Bayesian classifier | k-NN and Bayesian classifier | Classification | Fusion of RGB and multispectral image | Sugar beet | Disease |
| Supervised Machine Learning | RF | Classification | Hyperspectral dataset acquired from Indian Agricultural Research Institute (IARI) | Wheat | Water stress |
In order to divide the output into two or more classes, a linear combination of characteristics is used in linear discriminant analysis (LDA). In an experiment, images of citrus orchards were taken through visible near-infrared spectroscopy to identify Huanglongbing via different classification algorithms like soft independent modeling of classification algorithm (SIMCA), quadratic discriminant analysis (QDA), and LDA [47]. The accuracy obtained via SIMCA and QDA were 92% and 95%, respectively (Table 2).
SVM creates hyperplanes via maximum separation from the nearest training example [48]. In this hyperplane technique, the maximization of different classes is being performed with the clear separation of different classes [49]. SVM is basically used for the segmentation of images (Table 2). These images can be used to analyze the human pathogen, namely Salmonella typhimurium, which also affects Arabidopsis [50]. SVM and LDA techniques use thermal and hyperspectral images to identify verticillium wilt in Olea europaea [51].
Logistic regression classifies binary variables using the logistic function. This method uses all the predictors of odd ratios to classify the dependent variables into two different classes. Multinomial logistic regression uses outputs of more than two values. To identify the strategies of crop management and the application of pesticides in orchard plants, hyperspectral imaging was used to detect the apple scab at a very early stage [52]. Classification methods are used in logistic regression to distinguish between infected and healthy plants. This technique uses hyperspectral band classification algorithms (Table 2) [53].
The ensemble learning technique is the base of random forest (RF) functions (Fig. 3). This divides people into different nodes of the tree using the tree-building method. When compared to tree-based classification, the random forests technique has a number of advantages since it can handle noise, control model overfitting, and a variety of factors. Spectro-diameter is employed in this technique to pick out characteristics of various plant species [54].
 Fig. 3.
Application of different machine learning-based algorithms. These algorithms work on identification, classification, prediction, quantification, dimensionality reduction, and regression models. SVM, Support Vector Machine; ANN, Artificial Neural Network; DLA, Deep Learning Application; PCR, Polymerase Chain Reaction; NN, Neural Network; KNN, K-Nearest Neighbour; RF, Random Forest; BC, Bayesian Classifier; LDA, Linear Discriminate Analysis; QDA, Quadratic Discriminate Analysis; SOM, Self-Organizing Map; DLA, Deep learning Application; PLS, Partial Least Square; NSC, Nearest Shrunken Centroids; LR, Linear Regression; ML, Machine Learning.
Most phenomenological research employs linear regression because of its
comprehensive data interpretation and user-friendly interface. It deals with the
variation of the targeted factors. To measure water stress in maize plants, a
regression model was designed between vegetation indices (VI) and crop water
stress index (CWSI), which employ regression models and multispectral images to
accurately measure drought stress [55]. Another experiment examined the
relationships between leaf stomatal conductance (gs), stem water potential
(
The outcome is predicted using numerous explanatory variables using multiple regression, sometimes referred to as multiple linear regression (MLR). MLR simulates the linear relationship between the numerous experimental outcome components. Hyperspectral images are used to measure various diseases like powdery mildews by various data analysis techniques like Fisher linear discriminant analysis (FLDA), MLR, and PLSR. PLSR performs better than the MLR model in various aspects, whereas the highest accuracy is achieved by FLDA [57]. Various spectral images and data analysis techniques are used to measure disease-like bacterial spots in tomato (Table 2). The methods involve data analysis utilizing PLS, SMLR, and correlation coefficient spectrum analysis. For the measurement and investigation of the causes of bacterial spots, different types of predictive models are developed [58].
PLSR can manage collinearity across variables. So, PLSR is a very powerful technique for modeling numerous variables at the same time [59]. The best model is developed by the low values of RMSE and high values of correlation coefficient “r” [60]. The nitrogen concentration in rice is determined using ground-based hyperspectral imaging and the PLSR model (Table 2). The PLSR model was designed to link nitrogen contents and rice plant’s phenotype [61].
Dimensionality reduction deals with a few numbers of variables and can explain the whole dataset. It extracts the latent or useful variables from the dataset, which makes it accurate for the measurement. Principal Component Analysis (PCA) is the most common dimensionality lessening procedure. PCA reduces the dimensionality of data and extracts the completely independent variables. Principal Component Score (PCS) uses very few principal components to explain the variance of the dataset. In jujube, insect infestation was identified by stepwise discriminant analysis with the employment of NIR and visible spectroscopy [62].
DL is the best tool to obtain data with maximum accuracy. Evaluation of data obtained through DL is quite easy. DL uses layers and neurons in deep networks to interpret data (Fig. 1) [8]. DL has made outstanding advancements in consumer analytics, automated medical diagnosis, automated financial management, fraud detection, and autonomous vehicles [63]. Multiple DL models, such as GAN, recurrent neural networks (RNN), CNN, and multilayer perceptrons (MLP), are being widely used in phenomics (Table 3). CNN outperforms all other models for image analysis [64]. With the advancement in the model’s algorithms, DL is progressing significantly. For the purpose of training models, it helps in the careful estimation of complex hyperparameters [65].
| AI Technique | Algorithms | Application | Datasets | Model plant | Stressor |
| Deep Learning (Image) | CNN, SVM | Classification | 65,184 labeled images from GitHub resource | Soybean | Biotic and abiotic stresses |
| Supervised Machine Learning | MLP and probabilistic neural network (PNN) | Classification | 16 maize and 17 wheat genomic and phenotypic datasets with different trait-environment combinations | Maize and wheat | Drought |
| Bayesian classifier | Bayesian classifier | Classification | RGB images | Arabidopsis | Disease |
| Supervised machine Learning | Decision tree (DT) and NB | Prediction | miRNA concentration | Arabidopsis thaliana | Drought, salinity, cold, and heat |
| None Preprocessing via segmentation | None Preprocessing via segmentation | Quantification | RGB Images | Chili pepper | Disease |
| Supervised Machine Learning | Ridge regression, LASSO, elastic net, RF, reproducing kernel, Hilbert space, Bayes A and Bayes B | Prediction | A set of 29,619 cured single nucleotide polymorphisms. Genotyped across a panel of 240 maize inbred | Maize | Drought stress |
| Deep Learning | CNN | Prediction | Three maize arid and six wheat datasets | Maize and wheat | Environmental stress |
| Dirichlet aggregation regression (DAR) | Dirichlet aggregation regression (DAR) | Prediction | Hyperspectral images | Barley | Abiotic stress |
| SVM, generalized regression neural network (GRNN) | SVM, generalized regression neural network (GRNN) | Prediction | Manual severity rating | Rice | Disease |
| Supervised machine learning | Genomic random regression | Prediction | Complete genotypes, molecular markers, and phenotypic traits of stressed and control groups | Wheat | Environmental stress |
Field HTP saves time and labor for plant breeders to investigate the potential yield of different cultivars by sowing the field [66]. Cubist regression was used to measure plant maturity, seed size, and yield at early stages in 2551 genotypes of soybean (Glycine max) [67]. Similarly, many lines of wheat and barley were examined for desired traits at very early stages [68, 69]. In breeding programs, remote sensors are highly useful for the identification of desired traits as well as biotic and abiotic stress (Fig. 4). Various RGB pairings and thermal and multispectral data have been analyzed to forecast crop yield by DL models [70, 71]. These models are also used to estimate grain protein contents [72], measure plant height [73], and manage irrigations [74]. Van Klompenburg et al. [75] performed a review of the ML model and predicted grain yield. LSTM and CNNs are two examples of the architectures utilized in DL (Table 3).
 Fig. 4.
Plant traits improvement via high-throughput phenotyping techniques. These phenotyping techniques are used to instigate the breeding process by lowering breeding cycles, identifying novel genes, and identifying and mitigating biotic and abiotic stress to improve crop yield.
Transportable Array for Remotely sensed Agriculture and Phenotyping Reference Platform (TERRA-REF) has been developed to predict sensor, environmental, genomic, and phenotyping data to expedite the breeding process and farm management [76]. TERRA-REF involves ground-based robotic systems, UAV, satellite remote sensing, and phenotyping trailers to collect real-time data about agronomic traits and image-based phenotyping. TERRA-REF also provides a manuscript management section for researchers to register ongoing studies to avoid overlap and find potential collaborators (https://terraref.org).
To get a high yield, it is quite important to select crops adaptable to abiotic stresses such as climate change [77]. An updated dataset provides accurate information to mitigate the drastic impact of abiotic stressors on the growth and development of plants. For example, the Eschikon dataset deals in spatial pictures of beet under deficiency of nitrogen, weed stress, and numerous independent and combined drought conditions [78]. Eschikon dataset was employed to create a 3D model of the plants that accurately depicted their height, vegetation indices, canopy cover, agronomic attributes, biotic stress, abiotic stress (Fig. 5), and development of precise tools for computer-based stress identification [79]. Infrared thermography is being applied in the detection of crop water use efficiency [80] and enzyme efficiency under salinity and drought stress [81, 82, 83]. Infrared thermography revealed that cotton yield, micronaire, and fiber length were decreased at higher canopy temperatures [84]. Stomata conductance is influenced by evapotranspiration and canopy temperature; maps of these stressors were created and utilized to identify phenotypes [85]. Satellites provide thermal data of water resources by mapping ET [86].
 Fig. 5.
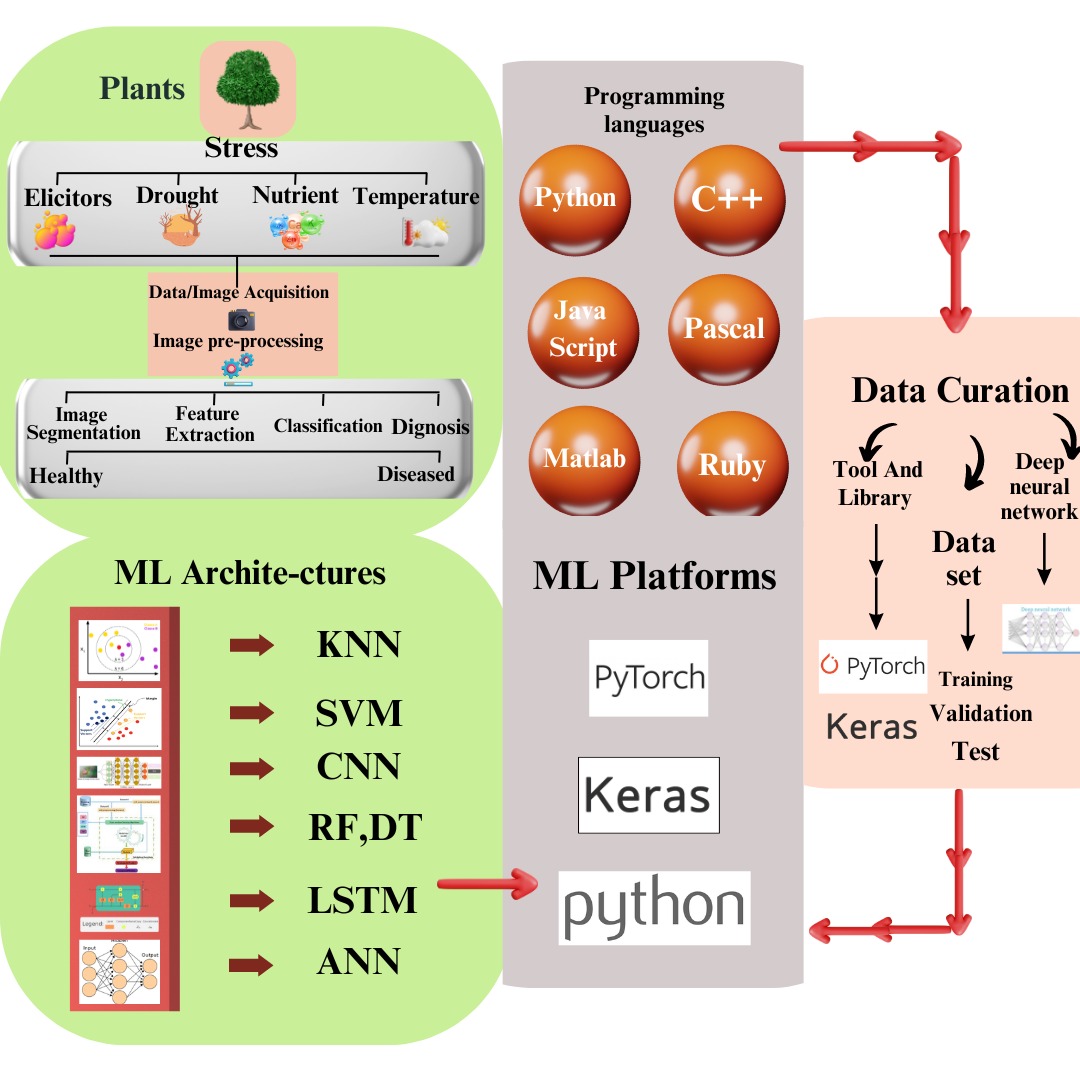
Image collection and processing by machine and deep learning-based phenotyping tools.
Pests and pathogens also migrate to different habitats with the change in environmental conditions [87]. Updated data about plant phenotype, host-pathogen interaction, and ecological conditions can be analyzed to provide recommendations for the management and selection of suitable crops [87]. Numerous datasets, including The Plant Village, RoCoLe, and BRACOL, are available to automatically identify pests and pathogens in cassava, apple, and citrus [30, 88, 89]. To improve the efficiency of identification of pathogens, ML models supported vector machines, self-attention CNNs, and CNNs-trained have been designed [90, 91].
For early disease detection, a variety of models have been developed, including combined HTP images from greenhouses [92], field experiments for quantifying root rot resilience in lentils, and UAV-collected images (Fig. 5) [93, 94]. In breeding programs, 12 normalized spectral indices have been developed to correlate the severity and symptoms of diseases. ML and hyperspectral data revealed early (3rd day of infection) detection of charcoal disease in soybean with 90% accuracy [95]. Compared to the broadcast method, image-based intelligent weed detection systems have reduced 60% use of herbicides [96]. Numerous ML and computer vision algorithms-based datasets comprised of multispectral and RGB images (Table 3) have been published to precisely identify different weeds [97]. Further improvement in datasets is required to develop robust tools that can devise the exact quantity of herbicides.
Root system architecture (RSA) plays a key role in nutrient and water uptake, stress tolerance, and high yield [98]. In crop breeding, the development of intelligent strategies for root phenotyping is of prime importance. To replace soil in order to get rid of pathogens and insects, hydroponic mediums and transparent gels have been developed, which are similar to soil-grown plants [21, 99, 100, 101]. For root phenotyping, strong sensors, hyperspectral imaging, magnetic resonance imaging, and CT scans were used to collect 2D and 3D images of plants grown in glasshouses [102, 103, 104, 105, 106].
The yield potential of a plant is influenced by its morphological characteristics, including its canopy cover, seeds, number of leaves, and number of blooms [107]. For measurement of stem segmentation, leaf area estimates, leaf counting, seed counting, and development stage identification, accurate tools based on ML models and NNs (Table 3) have been established [108, 109]. DL is being employed to analyze captured photos for various qualitative and quantitative properties, including fruit color, shape, size, and number (Fig. 4). For the development of dataset pipelines to measure quantitative traits from captured pictures, various phenotyping datasets have been released (Fig. 5), i.e., a dataset of hypocotyl of A. thaliana seedlings [110]. Image time-series growth of A. thaliana was observed for the prediction of presentation, and released dataset for class documentation [111].
Machine Learning is a powerful tool to assemble big data in terabytes (TB) and is used in the development of intelligent tools. Progress in HTP has made possible utilization of ML-based tools to perform precision agriculture. This review provides a precise overview of ML- and DL-based tools such as SVM and ANN to perform phenotyping of biotic and abiotic stress. This study also underlined several new avenues of application of ML techniques in agriculture. ML-based tools have replaced manual imaging with real-time automated high-throughput imaging systems and from individual plants to entire populations in a field. The application of ML-based intelligent tools has sped up the breeding process via the early detection of desired traits and increased yield via the detection of pests and insects at an early stage. ML and DL have successfully integrated seamless data analytics with data collection and curation pipelines. ML has accelerated the breeding process by providing a common platform, namely TERRA-REF, to avoid the repetition of research and connect with experts in the field. ML and DL have resolved fundamental genomics issues and enabled predictive phenomics. The application of ML- and DL-based tools in precision agriculture is a promising technique to feed a growing population.
Conceptualization, MA, SZ, and ZH; data curation, CG, F, SA and BC; analyzed the data, MA, SZ, F, ZH, NA, NI, HL, JL, AJR and CG; wrote the manuscript, CG, AJR, and MA; revised manuscript, AJR, MA, SA, and SZ; funding acquisition, CG, and JL. All authors reviewed the manuscript. All authors read and approved the final manuscript. All authors have participated sufficiently in the work and agreed to be accountable for all aspects of the work.
Not applicable.
The authors are very grateful to the kind administration of Yibin University, Yibin 644000, China, and Government College University, Faisalabad, Pakistan for providing us such a prestigious and well-equipped platform for research and development. The authors are also grateful to the kind administration of the department of Science and Technology of Sichuan province, P.R. China.
This work was supported by The Key Research and Development Projects Science and Technology Department of the Sichuan Province (NO. 2021YFS0343).
The authors declare no conflict of interest.
References
Publisher’s Note: IMR Press stays neutral with regard to jurisdictional claims in published maps and institutional affiliations.