
- Academic Editor
Background: Structural variations (SVs) are common
genetic alterations in the human genome. However, the profile and clinical
relevance of SVs in patients with hereditary breast and ovarian cancer (HBOC)
syndrome (germline BRCA1/2 mutations) remains to be fully elucidated.
Methods: Twenty HBOC-related cancer samples (5 breast and 15 ovarian
cancers) were studied by optical genome mapping (OGM) and next-generation
sequencing (NGS) assays. Results: The SV landscape in the 5 HBOC-related
breast cancer samples was comprehensively investigated to determine the impact of
intratumor SV heterogeneity on clinicopathological features and on the pattern of
genetic alteration. SVs and copy number variations (CNVs) were common genetic
events in HBOC-related breast cancer, with a median of 212 SVs and 107 CNVs per
sample. The most frequently detected type of SV was insertion, followed by
deletion. The 5 HBOC-related breast cancer samples were divided into SV
Breast cancer is one of the most common malignant tumor types worldwide [1]. Over the past decade, the study of breast cancer genomics has been greatly assisted by advances in large-scale next-generation sequencing (NGS) technology [2, 3]. Structural variations (SVs) are large-size genetic variations in the human genome, and include insertion, deletion, duplication, inversion, and translocation. SVs have been associated with different traits and with various diseases, including breast cancer [4, 5, 6]. They contribute to gene fusion, oncogene amplification, tumor suppressor gene deletion and other complex alterations leading to evolution of the cancer genome. These alterations have the potential to impact large stretches of DNA sequence, thereby disrupting genes and regulatory elements [7, 8, 9]. Many SVs are closely linked to tumorigenesis and have been used for tumor subtyping and diagnosis, as well as for effective targeted therapy [10, 11, 12, 13, 14]. SVs are very prevalent in breast cancer cell lines [12]. Deletions in breast cancer genomes can also affect enhancers and thus contribute to oncogenesis [15]. SVs have been reported in the breast cancer cell line SK-BR-3 and in patient-derived organoids. Detailed maps of the breast cancer genome have been established by integrating SV profiles, thereby revealing how SVs can disrupt the genome and also shedding light on the complex mechanisms involved in evolution of the cancer genome [8, 16].
Hereditary breast and ovarian cancer (HBOC) syndrome is most commonly characterized by deleterious germline mutations in the BRCA1 or BRCA2 genes. Advances in NGS technology have led to the discovery of several non-BRCA genes that are also responsible for HBOC syndrome, such as mutations in the PALB2, ATM, BRIP1, RAD51D and RAD51C genes, etc. [17]. The HBOC syndrome is estimated to cause 5–10% of all breast cancers [18, 19]. BRCA1 and BRCA2 are tumor suppressor genes that play a crucial role in the cell by rehabilitating damaged DNA in the homologous recombination repair (HRR) pathway [18]. Breast cancers with abnormal DNA repair functions (homologous recombination deficiency, HRD) are more likely to exhibit genomic instability, including abnormal SVs [20]. However, there is still only limited knowledge regarding structural abnormalities and SV heterogeneity in HBOC-related cancers, with more research required on this topic.
However, the genome-wide detection of SVs remains challenging. Karyotype analysis is the traditional approach used for identifying SVs, but is limited by the poor quality of mitotic chromosome metaphases and the low resolution of this technique [21]. More recently, NGS technology has greatly enhanced the resolution and throughput of genetic analysis and facilitated the discovery of SVs. However, because of the short read-length, NGS has difficulty with SVs located in repetitive regions and regions with high or low GC content [12, 22]. Moreover, algorithms that are used to interpret SVs from NGS data with short read-lengths have a high false-negative rate [6, 23]. Third-generation, long-read, single-molecule sequencing technologies from Pacific Biosciences (PacBio) and Oxford Nanopore Technologies (ONT) have proven more reliable in identifying SVs, with substantial improvements in both sensitivity and specificity. However, these technologies still have a relatively low accuracy and also require deep sequencing to detect SVs [6, 16, 23].
Recent advances in long-read sequencing technology have opened the possibility
of more precise and sensitive detection of SVs [24]. Optical genome mapping (OGM)
is a nanochannel-based genome mapping technology that can detect multiple classes
of SVs with high resolution. OGM can generate kilobase- to megabase-size genomic
maps by automatically tagging single molecules with fluorophores, thereby
providing images of labeled and linearized ultra-high molecular weight (UHMW,
The OGM technique was used in this study to investigate SVs in HBOC-related breast cancers with BRCA1 or BRCA2 mutation. This should help to determine the impact of intratumor heterogeneity in SVs on clinicopathological features and on the genetic alteration profile. To our knowledge, this is the first study that uses OGM technology to comprehensively analyze SVs in HBOC-related breast cancer with BRCA1 or BRCA2 mutation.
OGM analysis was performed on 20 HBOC syndrome patients, comprising 5 breast
cancer patients and 15 ovarian cancer cases. These were identified from more than
200 breast and ovarian cancer patients from our earlier studies [25, 26]. The 5
HBOC-related breast cancer patients were comprehensively investigated in the
present study. All 5 patients were diagnosed with invasive carcinoma (stage I/II)
and completed adjuvant therapy following surgery. Immunohistochemical staining
was performed for Ki-67, estrogen receptor (ER), progesterone receptor (PR), and
receptor tyrosine-protein kinase erbB-2 (HER2). Breast cancer samples were
identified as luminal A, luminal B, HER-2 overexpression, or triple negative
breast cancer (TNBC) subtypes according to the protein expression levels of ER,
PR and HER2. Ki-67 expression was classified as either Ki-67
| ID | Age | Pathlogy | Stage | Lymph node metastasis | Neoadjuvant therapy | Adjuvant systemic therapy | Relapse | ER status | PR status | HER2 status | HER2 FISH | Ki-67 | p53 | CDK5/6 | Luminal subtype | BRCA1/2 germline mutation | Oher risk genes germline mutation |
| P1 | 53 | invasive carcinoma | II | Yes | No | Yes | No | 1+ | NA | 50% | 80% | 50% | Triple-negative | BRCA1, p.Glu1836fs | NA | ||
| P2 | 35 | invasive carcinoma | I | No | Yes | Yes | No | 1% | 1+ | NA | 10% | 10% | Luminal B | BRCA1, p.Leu1306fs | NA | ||
| P3 | 44 | invasive carcinoma | II | Yes | No | Yes | No | 90% | 20% | 2+ | Negative, heterogeneity | 55% | 5% | Luminal B | BRCA2, p.Arg2520Ter | NA | |
| P4 | 28 | invasive carcinoma | II | No | No | Yes | No | 90% | 15% | 2+ | Negative | 30% | Luminal B | BRCA1, p.Gln1281Ter | NA | ||
| P5 | 64 | invasive carcinoma | II | No | No | Yes | No | 0 | NA | 70% | 40% | Triple-negative | BRCA1, p.Asp942fs | NA |
ER, estrogen receptor; PR, progesterone receptor; HER2, receptor tyrosine-protein kinase erbB-2; NA, not applicable.
UHMW genomic DNA (gDNA) was extracted from flash-frozen tissue stored at –80 °C. This was performed using the Bionano Prep Animal Tissue DNA Kit (Bionano Genomics, San Diego, CA, USA) as recommended by the manufacturer. The gDNA was left to homogenise overnight at room temperature. The next day, DNA molecules were labelled using the DLS (Direct Label and Stain) DNA Labeling Kit (Bionano Genomics, San Diego, CA, USA) as recommended by the manufacturer. A Proteinase K solution (Qiagen, Germantown, MD, USA) was then used to inactivate the enzyme, and successive membrane adsorption steps were used for cleanup. The DNA backbone was counterstained overnight before quantification, and the labelled gDNA solution was then loaded onto a Bionano Saphyr chip and scanned on the Bionano Saphyr instrument (Bionano Genomics, San Diego, CA, USA).
Genome analysis and the calling of structural variations was performed using the rare variant pipeline (RVP) in Bionano Solve (v3.7, Bionano Genomics, San Diego, CA, USA). The variant hg19 DLE-1 SV mask, which blocks difficult-to-map regions and common artifacts, was turned on for data filtering. The following recommended confidence scores were then applied: insertion, 0; deletion, 0; inversion, 0.7; duplication, –1; intra- and inter-translocation, 0.05; copy number, 0.99 (low stringency, filter set to 0). All SVs and CNVs detected in each sample were exported in SMAP files.
The HRD score combines three independent measures of genomic instability, namely
genome-wide loss of heterozygosity (LOH), telomeric allelic imbalance (TAI), and
large-scale state transitions (LST). These were calculated on the basis of the
label and coverage of the ultra-long DNA molecule. LOH calculation was based on
large deletions, which counts the number of regions representing one parental
allele longer than 15 Mb but shorter than the whole chromosome. TAI represents
the number of regions with CN gain, CN loss, and LOH that extend to one of the
subtelomeres, but do not cross the centromere, and are
The chromothripsis status was inferred by visual scoring according to the CNV. The number of switches between copy-number states was counted for each chromosome. Chromosomes containing 10 or more switches within 50 Mb were scored as chromothripsis-positive with high confidence. Chromosomes with 8 to 9, or 6 to 7 switches within 50 Mb were scored as chromothripsis-positive with intermediate and low confidence, respectively [27].
The variant allele frequencies (VAFs) for all SVs within a sample were divided
by the maximum VAF, thus normalizing them within the range of 0 to 1.
Subsequently, the 0–1 range was partitioned into a series of windows with a
width of 0.05, and the proportion of SVs falling within each window was
calculated. Finally, the Shannon diversity formula was applied to these
proportions in order to compute the ITH value as follows:
ITH
For each of the five HBOC-related breast cancer samples, DNA was extracted from paired tumor/normal tissues using the Invitrogen PureLink Genomic DNA Mini Kit (Invitrogen, Carlsbad, CA, USA) as recommended by the manufacturer. DNA enrichment and library preparation were carried out using the Agilent SureSelect Human All Exon V6 kit (Agilent Technologies, Santa Clara, CA, USA) according to routine protocols. Libraries were sequenced on the Illumina NovaSeq6000 platform (Illumina, San Diego, CA, USA) with 150-bp paired-end runs.
Quality control of raw reads was performed using fastp (v0.23.1) and Trimmomatic (v0.32) to trim reads with adapters and to remove low-quality reads. Clean reads were aligned to the reference genome using BWA (v0.7.16a), and the aligned reads were then analyzed to identify somatic variants, including SNPs and Indels using GATK (v4.1.6.0). Somatic variants were annotated using ANNOVAR (v2015Mar22) and summarized by R (v4.3.1) package maftools to gain insight into the genomic landscape of each cancer sample.
Total RNA was extracted from three HBOC-related breast cancer samples (P3, P4, P5) using TRIzol Reagent (Invitrogen, Carlsbad, CA, USA) and routine protocols. Transcriptome libraries were made using the Illumina TruSeq RNA sample preparation Kit (Illumina, San Diego, CA, USA) according to the manufacturer’s instructions. Libraries were sequenced on the Illumina NovaSeq6000 platform (Illumina, San Diego, CA, USA) to generate 150-bp paired-end reads.
Quality control of raw reads was performed using (v0.23.1) and Trimmomatic (v0.32) to trim reads with adapters and to remove low-quality reads. Clean reads were then aligned to the reference genome using Hisat2 (v9.2.1), and the reference-based assembly of transcripts was performed using StringTie (v1.3.3b) to quantify the expression level of exons, transcripts and genes. Gene expression levels [log2(FPKM+1)] in tumor samples were compared to those in normal samples using one-tailed T-test.
All COSMIC (https://cancer.sanger.ac.uk/cosmic) genes found by WES to contain a mutation underwent KEGG signaling pathway enrichment analysis using the KOBAS (v3.0) as previously reported [28] (http://bioinfo.org/kobas). Similarly, the COSMIC genes found by OGM to contain a SV were analyzed by KEGG enrichment. Cancer- and treatment-related signaling pathways that showed statistical significance was visualized.
Categorical variables were compared using Fisher’s exact test or the chi-square
test, while continuous variables were compared using the Wilcoxon rank sum test
or T-test. Statistical analysis was performed using SPSS 23 software
(IBM SPSS statistics, Chicago, IL, USA). p
We first evaluated the technical performance of OGM analysis in 20 HBOC-related
cancer samples. This gave the following results (median and interquartile range):
N50
A median of 223 SVs per sample were detected in 20 HBOC-related cancer samples
using the recommended confidence filter settings with control database
(
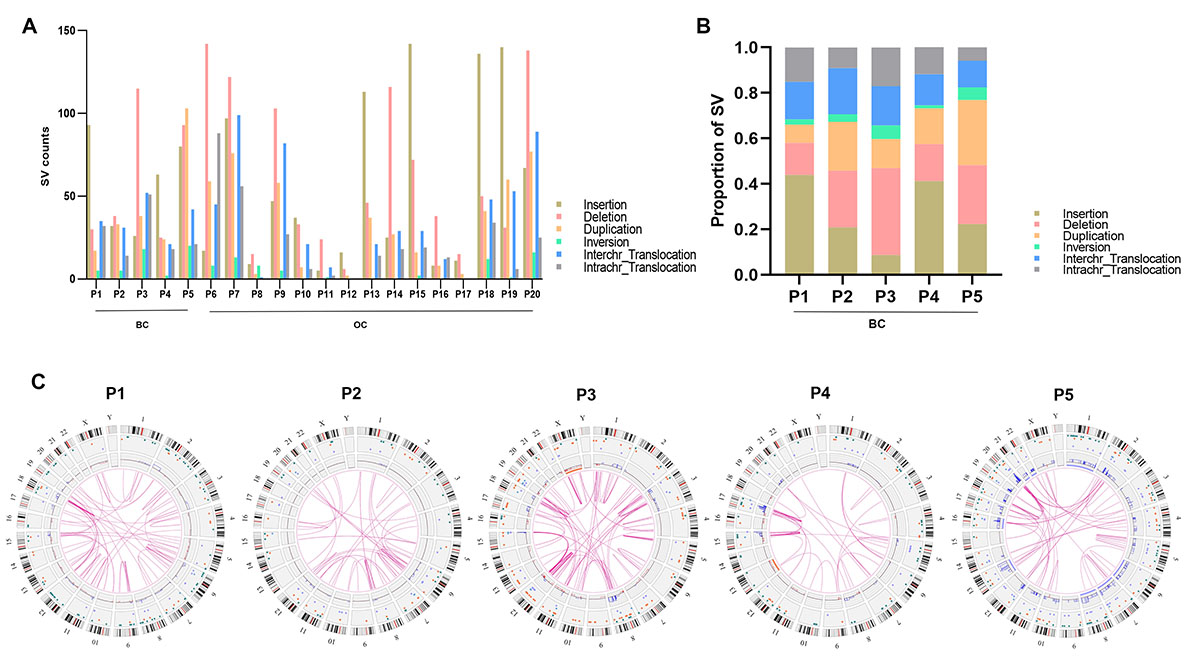 Fig. 1.
Structural variations (SVs) detected by optical genome mapping (OGM) in hereditary breast and ovarian cancer (HBOC) tissue samples. (A) SV counts in 20 HBOC tissue samples. (B) SV counts in 5 HBOC-related breast cancer tissue samples. (C) Circle plots showing the SVs and copy number variations (CNVs) in 5 HBOC-related breast cancer tissue samples. BC, breast cancer; OC, ovarian cancer.
| SV calls using the recommend confidence filter settings without control filter | ||||||
| P1 | P2 | P3 | P4 | P5 | Total | |
| Insertion | 691 | 610 | 628 | 641 | 639 | 3209 |
| Deletion | 565 | 619 | 705 | 530 | 640 | 3059 |
| Duplication | 93 | 116 | 124 | 77 | 163 | 573 |
| Inversion | 89 | 77 | 77 | 58 | 87 | 388 |
| Interchr_Translocation | 35 | 31 | 52 | 21 | 42 | 181 |
| Intrachr_Translocation | 32 | 14 | 51 | 18 | 20 | 135 |
| Total | 1505 | 1467 | 1637 | 1345 | 1591 | 7545 |
| SV calls using the recommend confidence filter settings with control | ||||||
| P1 | P2 | P3 | P4 | P5 | Total | |
| Insertion | 93 | 32 | 26 | 63 | 80 | 293 |
| Deletion | 30 | 38 | 115 | 25 | 93 | 301 |
| Duplication | 17 | 33 | 38 | 24 | 103 | 214 |
| Inversion | 5 | 5 | 18 | 2 | 20 | 50 |
| Interchr_Translocation | 35 | 31 | 52 | 21 | 42 | 181 |
| Intrachr_Translocation | 32 | 14 | 51 | 18 | 21 | 135 |
| Total | 212 | 153 | 300 | 153 | 359 | 1174 |
| CNV calls (non-masked only) and Aneuploidy (non-masked only) | ||||||
| P1 | P2 | P3 | P4 | P5 | Total | |
| Gain | 40 | 19 | 61 | 71 | 245 | 436 |
| Loss | 29 | 0 | 63 | 36 | 2 | 130 |
| Total | 69 | 19 | 124 | 107 | 247 | 566 |
| Aneuploidy Gain | 0 | 0 | 0 | 0 | 8 | 8 |
| Aneuploidy Loss | 0 | 0 | 1 | 1 | 0 | 2 |
| Total | 0 | 0 | 1 | 1 | 8 | 10 |
SVs, structural variations; CNVs, copy number variations; HBOC, hereditary breast and ovarian cancer; OGM, optical genome mapping.
We next examined the number of SVs in breast cancer subtypes. TNBC contained 93
insertions in P1 and 80 in P5, whereas luminal B breast cancer showed 32
insertions in P2, 26 in P3, and 63 in P4. TNBC showed a trend for more inversions
than luminal B breast cancer. The number of other SV types between the breast
cancer subtypes was similar (Fig. 2A). Furthermore, the total number of SVs in
Ki-67
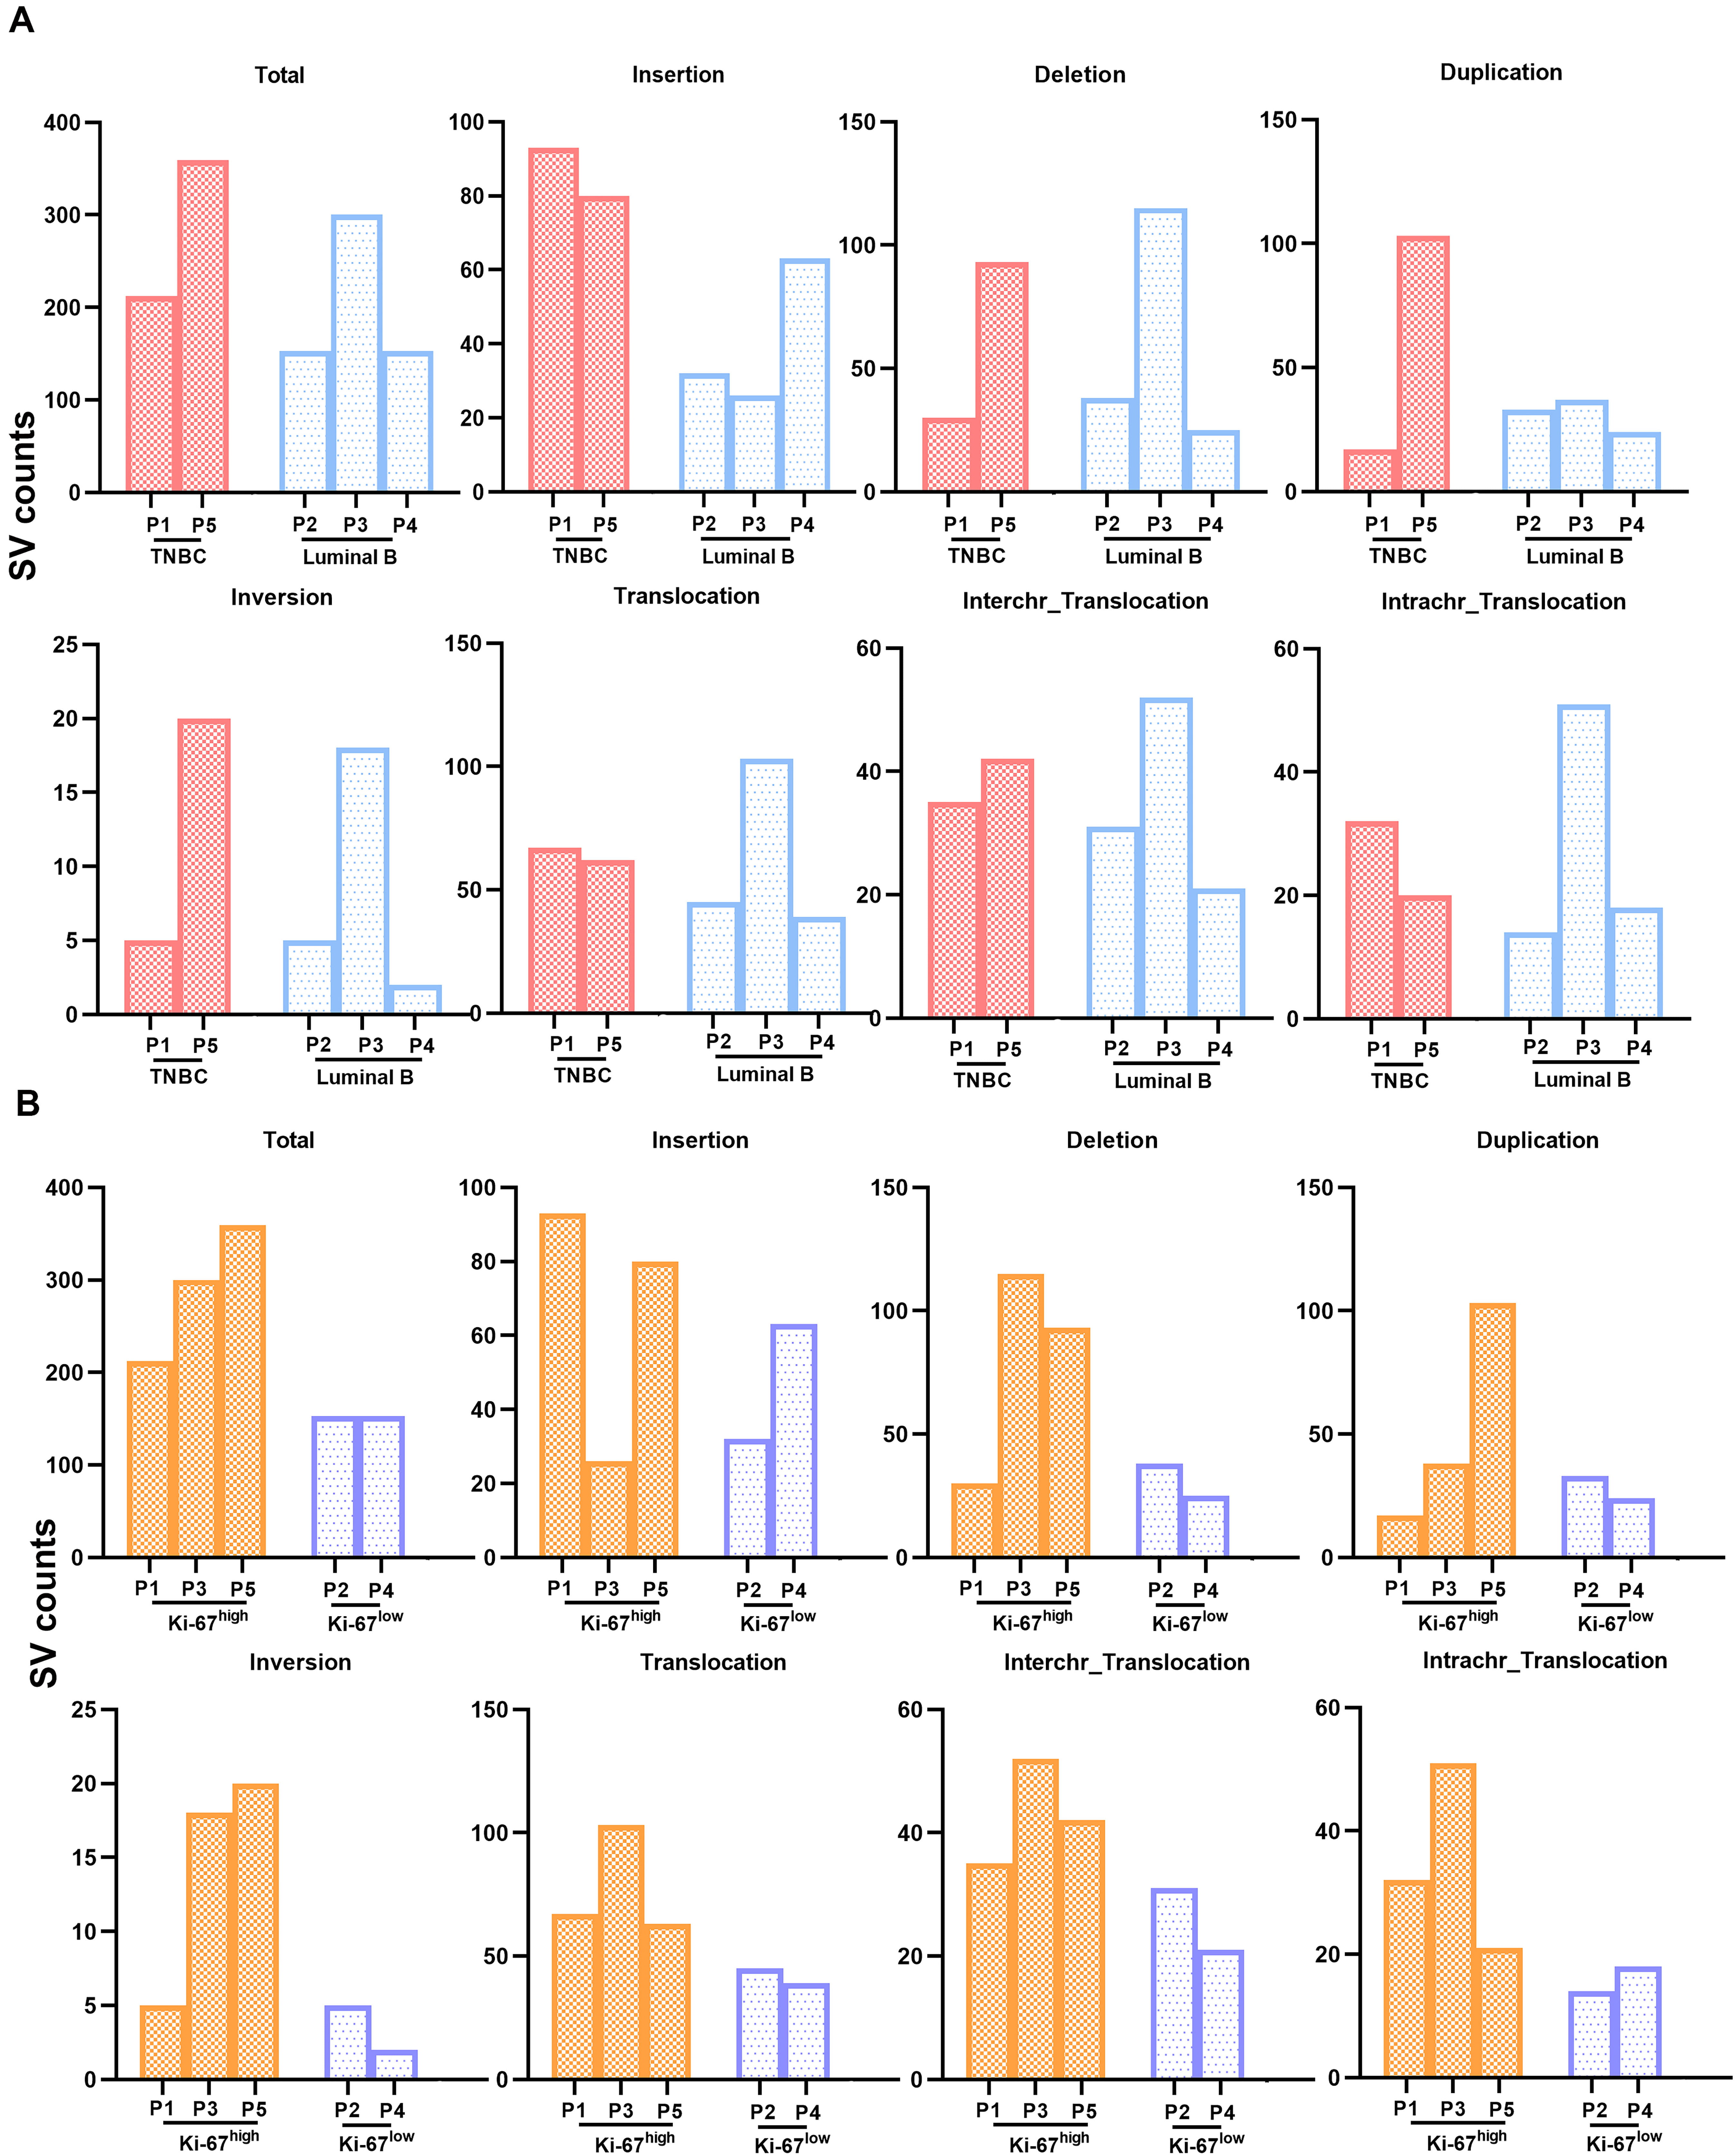 Fig. 2.
The relationship between SV counts and luminal subtype/Ki-67 expression in HBOC-related breast cancers, as detected by OGM. (A) SV counts in triple negative and in luminal B breast cancers. (B) SV counts in breast cancers with different levels of Ki-67 expression.
Next, three core indexes for HRD (LOH, TAL, LST) were calculated using OGM data.
The median HRD score for the three SV
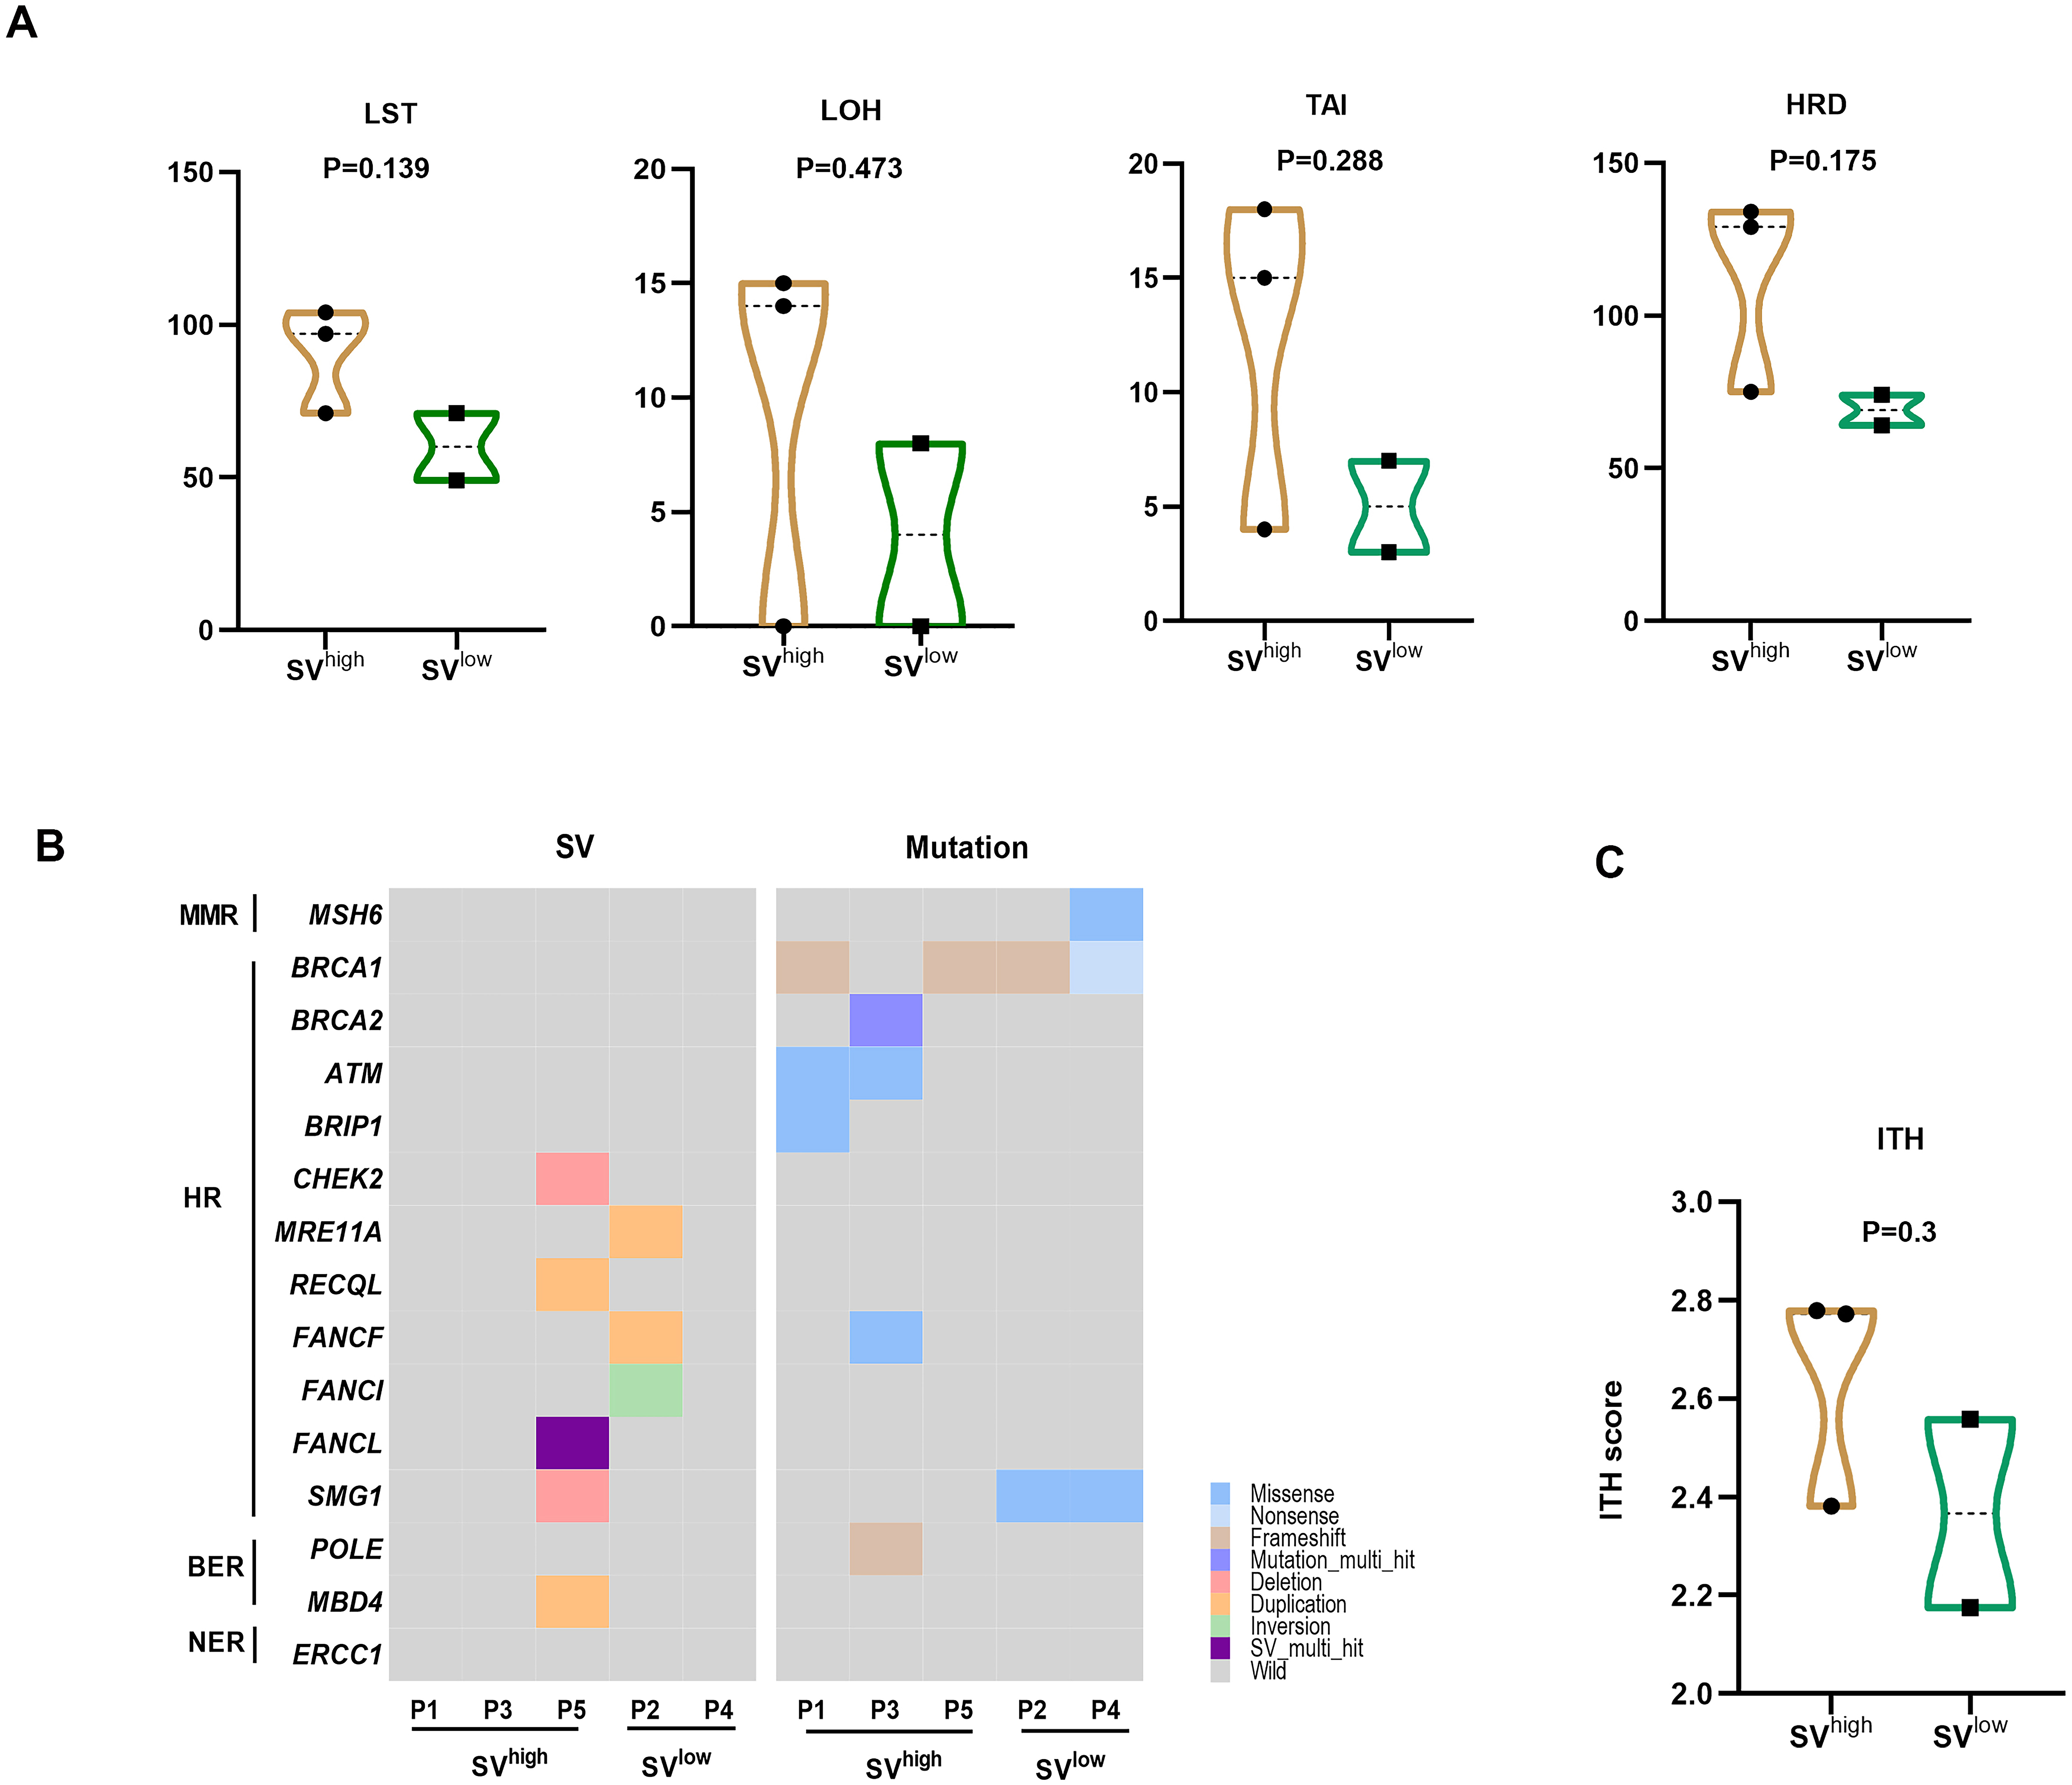 Fig. 3.
Associations between SV counts and homologous recombination
deficiency (HRD), mutations in DNA damage repair (DDR) genes, and intratumoral
heterogeneity (ITH) in HBOC-related breast cancers. (A) HRD core indexes in
SV
WES data analysis was performed to compare genetic mutations between
SV
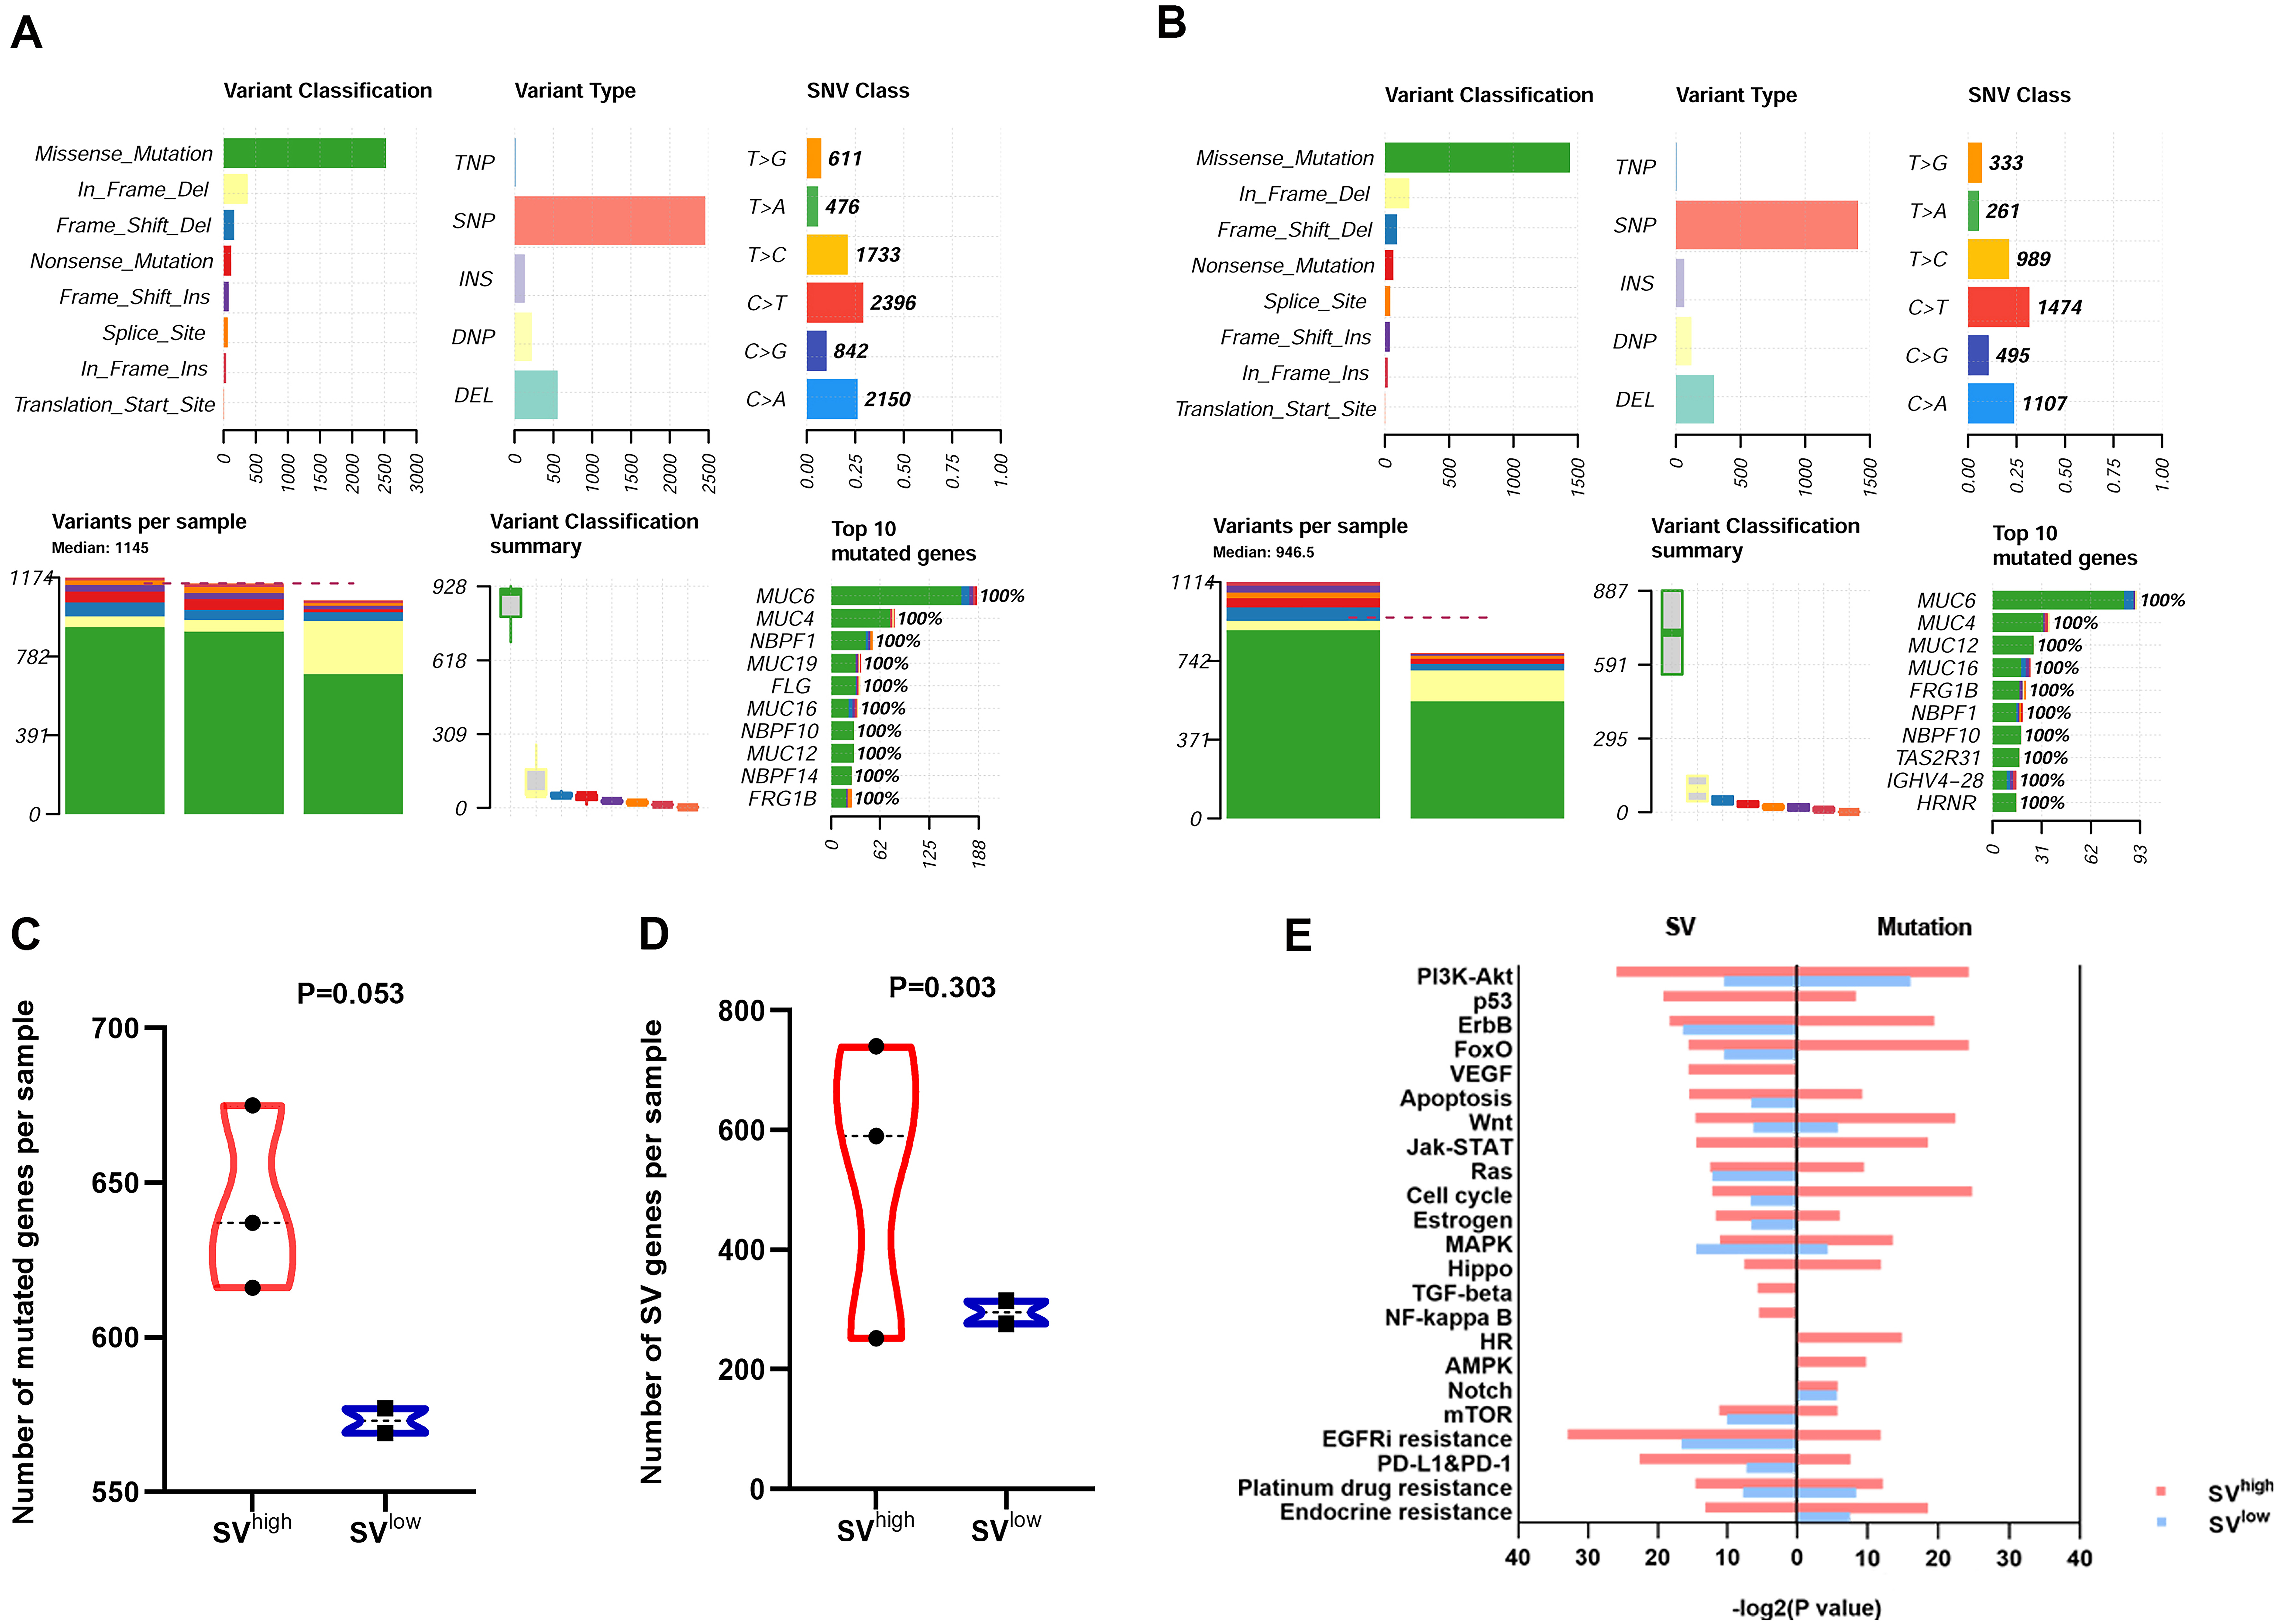 Fig. 4.
Comparison of genetic mutations and altered signaling pathways
between SV
We next examined whether the COSMIC genes with SVs and distinct mutations
(Supplementary Tables 3–6) were enriched
in tumor-related signaling pathways (Fig. 4E, Supplementary Table 7).
The SV
Three regions showed copy number gains in all 5 HBOC-related breast cancer
samples, including chromosome (Chr) 1q25-32 gain, Chr 1q41-44 gain and Chr
8q22-q24 gain (harboring MYC oncogene) (Fig. 5A). Chr 1q25.3-q44 gain,
Chr6p24.3 gain and Chr 8q22.3-q24.3 gain (harboring MYC oncogene) were
recurrent CNV regions in SV
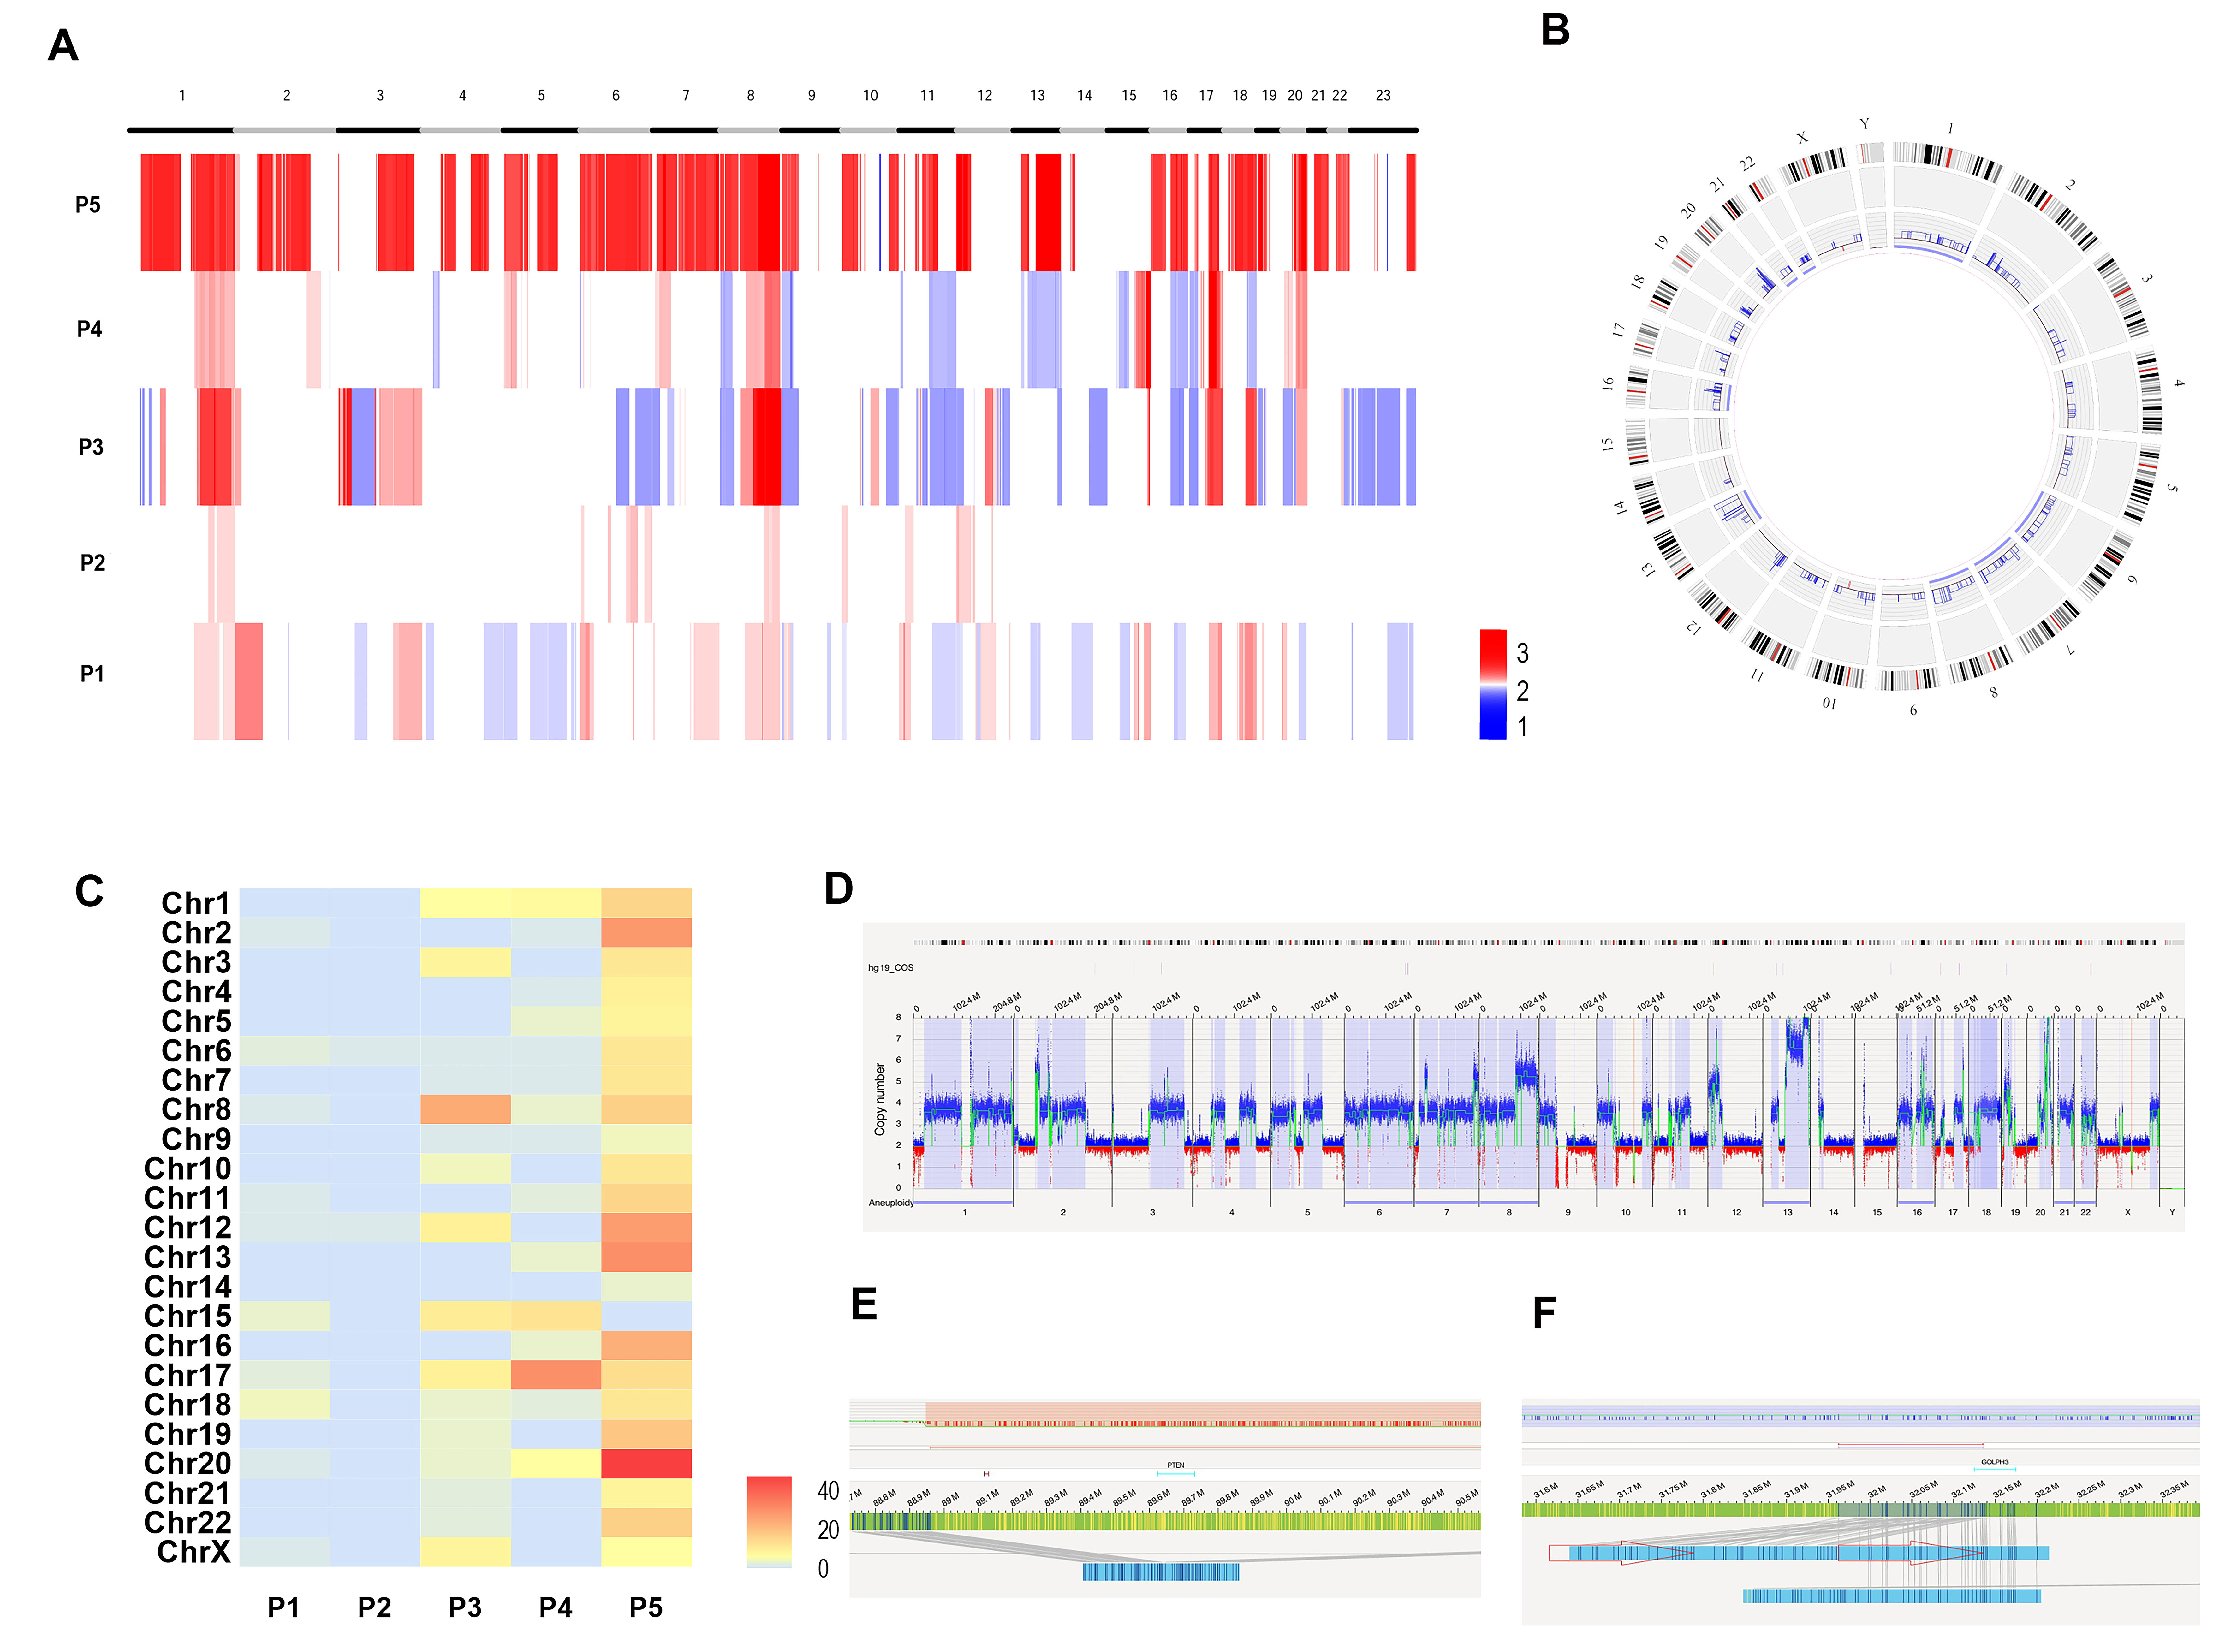 Fig. 5.
Copy Number Variations (CNVs) and chromothripsis detected by OGM in HBOC-related breast cancers. (A) The CNV landscape of the 5 samples. (B) The circle plot shows the abnormal CNV changes in P5. (C) The heat map shows the chromothripsis visual scores for the 5 samples. (D) The whole-genome CNV profiles illustrates the abnormal CNV changes in P5. (E) Schematic showing loss of the tumor suppressor gene PTEN in chromothriptic chromosome 10 in P5. (F) Schematic showing duplication of the Golgi-associated protein gene GOLPH3 in chromothriptic chromosome 5 in P5.
We further evaluated chromothripsis events in all 5 HBOC-related breast cancer samples according to CNV visual scoring as previously reported [27]. This revealed that 60% (3/5) of HBOC-related breast cancer samples showed chromothripsis (P3, P4, P5). The higher CNV visual score referred to more severe chromothripsis in tumor tissue (Fig. 5C). The most severe chromothriptic events were seen in P5. The circle plot (Fig. 5B) and CNV plot of the whole genome (Fig. 5D) for P5 revealed abnormal CNV changes and multiple chromosomes affected by chromothripsis. Of note, the tumor suppressor gene PTEN was lost in chromothriptic chromosome 10. Transcriptome sequencing showed that PTEN gene expression was significantly down-regulated in breast cancer tissues at the mRNA level compared to normal adjacent tissues (p = 0.009) (Fig. 5E). The Golgi-associated gene GOLPH3 was duplicated in chromothriptic chromosome 5. Transcriptome sequencing confirmed that GOLPH3 expression in breast cancer tissues was significantly up-regulated at the mRNA level compared with normal adjacent tissues (p = 0.014) (Fig. 5F). Both these genes are closely associated with platinum drug resistance, and hence it is interesting to note that patient P5 may show early relapse after platinum-based chemotherapy in the clinic.
OGM detected 8 novel gene fusions in HBOC-related breast cancers. These were
validated by RNA-Seq (Table 3). 50% fusions were due to interchr_trans or
intrachr_trans, 50% fusions were due to duplication. 75% (6/8) fusions were
detected in SV
| Sample ID | Fusion | LeftBreakpoint | RightBreakpoint | SV type |
| P3 | C12orf76::ZFAT | chr12:110486168 | chr8:135669980 | interchr_fusion |
| P4 | CLTC::DHX40 | chr17:57768072 | chr17:57676098 | dup |
| P5 | CKMT2-AS1::PDE4D | chr5:80597106 | chr5:58489362 | intrachr_fusion |
| P4 | NAV1::PKP1 | chr1:201687883 | chr1:201282294 | dup_split |
| P5 | EXOC6::NSMCE4A | chr10:94733989 | chr10:123727321 | intrachr_fusion |
| P5 | RBM38::RAE1 | chr20:55968389 | chr20:55929088 | dup |
| P5 | TOM1L2::TRPC4AP | chr17:17875576 | chr20:33642834 | interchr_fusion |
| P5 | EIF3L::TRIOBP | chr22:38254747 | chr22:38130406 | dup |
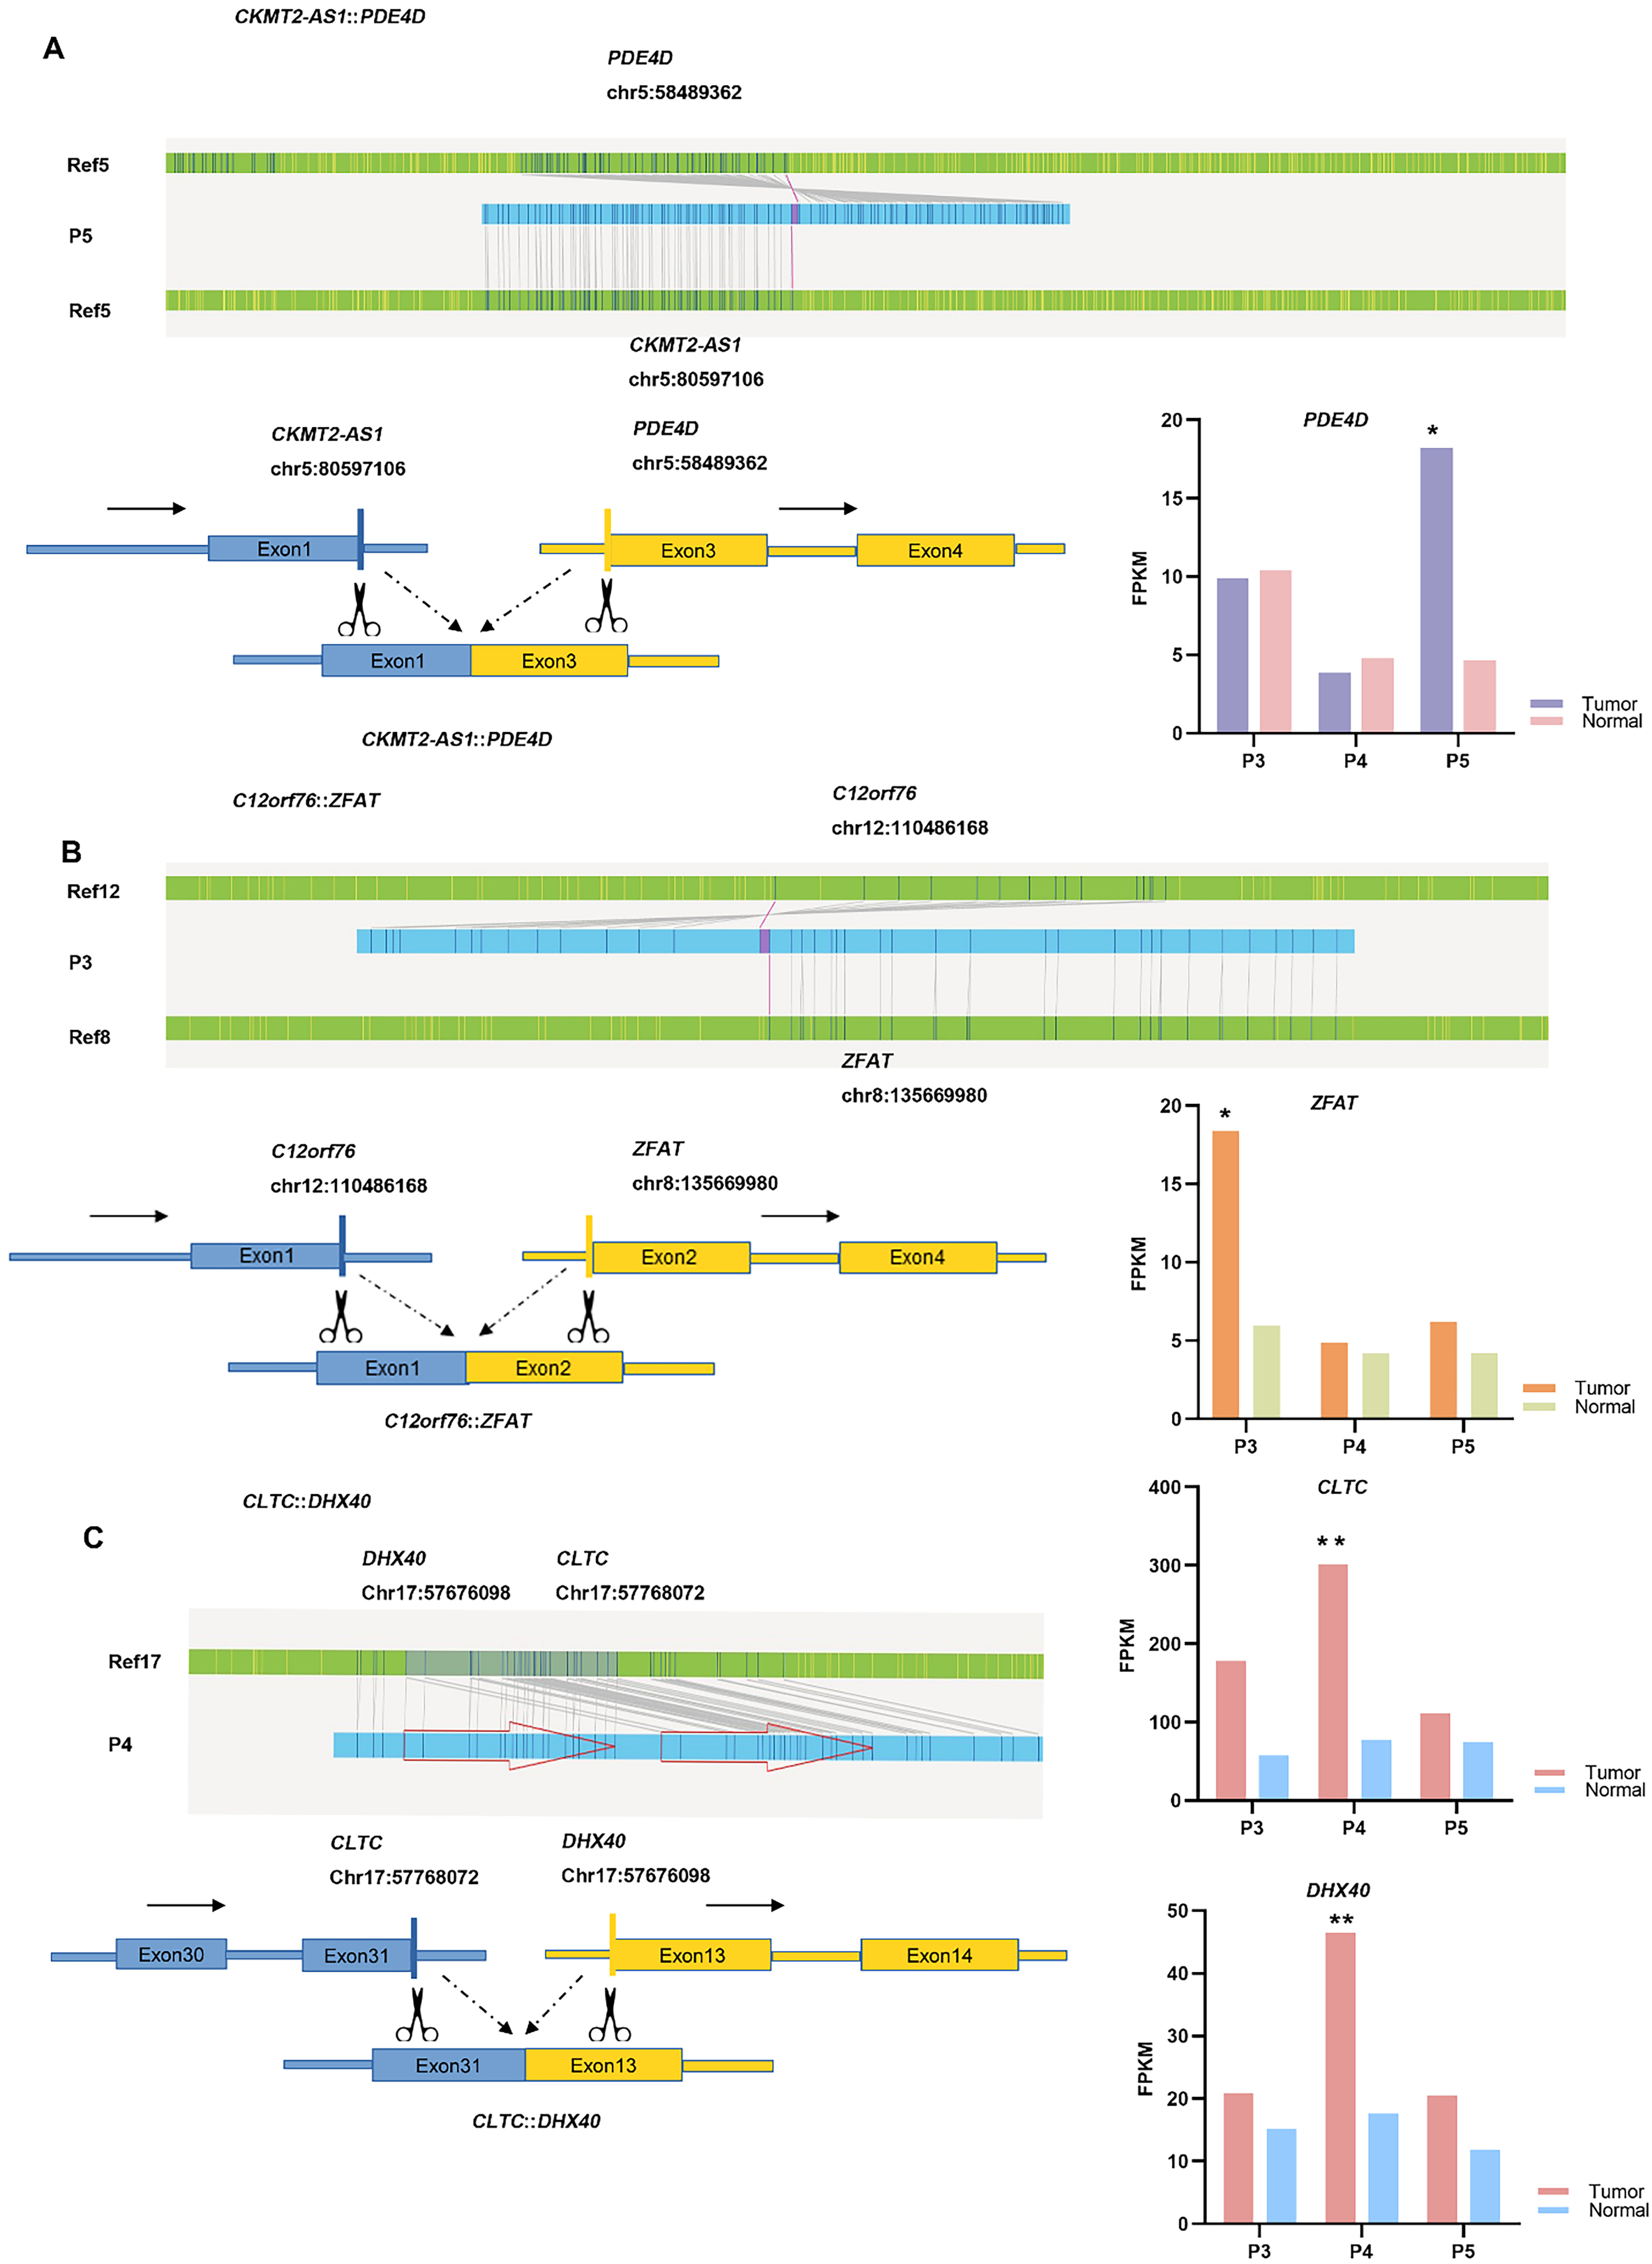 Fig. 6.
Identification of novel gene fusions using OGM. (A) The top and
bottom left panel show a detailed schematic of the
CKMT2-AS1::PDE4D fusion. The bottom right panel shows the
expression of PDE4D in tumor tissue compared with normal adjacent
tissue. (B) The top and bottom left panel show a detailed schematic of the
C12orf76::ZFAT fusion. The bottom right panel shows the
expression of ZFAT in tumor tissue compared to normal adjacent tissue.
(C) The left panel shows a detailed schematic of the
CLTC::DHX40 fusion. The right panel shows the expression of
CLTC and DHX40 in tumor tissue compared to normal adjacent
tissue. Note: *p
The aim of this study was to assess the utility of OGM for detecting SVs in HBOC-related breast cancers. OGM is an advanced technology that uses high-resolution imaging techniques to map the structure and organization of the genome, thus providing valuable insights into SVs. It can identify SVs that are often missed by traditional sequencing methods, allowing a more comprehensive understanding of the genome. Furthermore, OGM is a label-free technique, making it a non-destructive and cost-effective tool compared to other sequencing technologies. It also allows direct visualization and analysis of genomic features, thereby eliminating the need for time-consuming DNA amplification or labeling. OGM has demonstrated its utility in cancer research and in helping to advance precision medicine [21, 24]. In the present research, the landscape of SVs in HBOC-related breast cancer samples was comprehensively investigated by OGM to determine how the intratumor heterogeneity of SVs impacts clinicopathological features and the genetic alteration profile. OGM was also able to detect gene fusions with high accuracy, and several novel gene fusions were identified and validated.
Our results indicate that SVs are very common in HBOC-related breast cancers.
Manual inspection of all the SVs revealed a redundancy rate of 7.8%, which was
mainly focused on deletion. However, this SV type showed no difference in trend
between groups and did not affect the results for the association between number
of SVs and luminal type or Ki-67 expression, or the group based on the SV count.
Hence, no further analysis was performed and the data is shown in Supplementary
Table 8 for reference (Supplementary Table 8). The number of SVs was
found to be associated with Ki-67 expression, which is a nuclear marker of cell
proliferation and an important indicator of tumor cell activity. Breast cancers
that express high levels of Ki-67 are associated with faster tumor growth and
worse clinical outcome [29]. It has been suggested that SVs could provide
additional prognostic information for patients [30]. HBOC-related breast cancers
with SV
BRCA1/2 mutations are the main cause of HRD in the clinic. The HRD
scores in the 5 HBOC-related breast cancer patients examined in this study ranged
from 64 to 134, demonstrating they all had homologous recombination deficiency
[31]. We also observed that SV
We also explored the genetic alteration profile of HBOC-related breast cancers.
SV
SV
Eight novel gene fusions were identified in this study and validated by RNA-Seq.
We accessed the RNA-Seq reads, confirmed that the fusions were all in-frame, and
identified that the breakpoints were located at the edges of exons without
leading to premature termination codon (PTC), premature stop, and nonsense
mediated decay. The IGV screenshots of the 8 fusions are included in the
supplementary figures (Supplementary Figs. 2–9) to show the fusions
identified by RNA-Seq. Two of these fusions were intrachr_trans, which can be
called as either true translocation events or duplications/deletion events with
Bionano software. Intra-chromosomal fusion breakpoints typically involve regions
located at least 5 Mbp away from each other on the same chromosome. Meanwhile,
duplication
The newly identified gene fusion CKMT2-AS1::PDE4D in
SV
Using the OGM technique, we identified several gene fusions that interfere with
gene transcription and expression. Some were previously reported, including
RBM38::RAE1 [49], NAV1::PKP1 [50] and
EIF3L::TRIOBP [51]. A novel gene fusion in SV
The OGM technique also identified the novel gene fusion
CLTC::DHX40 in SV
This study has several limitations. Firstly, the relatively small number of cases meant there was low statistical power to assess the associations between SVs and other clinical or genomic features. Secondly, the observed chromothripsis and novel gene fusion events should be validated in larger cohorts and their potential biological functions investigated in HBOC-related breast cancers.
In conclusion, OGM is a promising tool for the detection of SVs and CNVs in
HBOC-related breast cancer. This method can efficiently characterize and quantify
chromothripsis events and novel gene fusions in cancer tissues. SV
The data presented in this study are available on request from the corresponding author.
YNC performed the experiment and wrote the manuscript, LD performed the experiment, LH tested the software, DCB and YZ interpretated the data and reviewed the article, JTL and XJG collected the samples and the clinal-pathological information, HLX performed bioinformatics analysis and wrote the manuscript, JPY conceived and designed this study. All authors contributed to editorial changes in the manuscript. All authors read and approved the final manuscript. All authors have participated sufficiently in the work to take public responsibility for appropriate portions of the content and agreed to be accountable for all aspects of the work in ensuring that questions related to its accuracy or integrity.
Informed consent was obtained from all subjects involved in the study. The study was conducted according to the guidelines of the Declaration of Helsinki and approved by the Ethics Committee of Tianjin Medical University (No. Ek2018050).
Not applicable.
This work was supported by the National Science and Technology Support Program of China (Grant No. 2018ZX09201015), National Natural Science Foundation of China (Grant No. 82072588, 82002601, 81872143, 81702280), and Projects of Science and Technology of Tianjin (Grant No. 18JCQNJC82700), Tianjin Key Medical Discipline (Specialty) Construction Project (TJYXZDXK-009A).
The authors declare no conflict of interest.
Publisher’s Note: IMR Press stays neutral with regard to jurisdictional claims in published maps and institutional affiliations.