
- Academic Editor
Background: Considering the remarkable heterogeneity of biological features of renal cell carcinoma (RCC), the current clinical classification that only relies on classic clinicopathological features is in urgent need of improvement. Herein, we aimed to conduct DNA methylation modification patterns in RCC. Methods: We retrospectively curated multiple RCC cohorts, comprising TCGA-KIRC, TCGA-KICH, TCGA-KIRP, and E-MTAB-1980. DNA methylation modification patterns were proposed with an unsupervised clustering algorithm based on 20 DNA methylation regulators. Immunological features were characterized using tumor-infiltrating immune cells and immunomodulators. Sensitivity to immuno- or targeted therapy was estimated with submap and Genomics of Drug Sensitivity in Cancer (GDSC). DNA methylation score (DMS) was developed with principal component analysis. Results: Three DNA methylation modification patterns were conducted across RCC patients, namely C1, C2 and C3. Among them, C3 displayed the most remarkable survival advantage. The three patterns presented in agreement with immune phenotypes: immune-desert, immune-excluded, and immune-inflamed, respectively. These patterns displayed distinct responses to anti-PD-1 and targeted drugs. DMS enabled the quantification of DNA methylation status individually as an alternative tool for prognostic estimation. Conclusions: The DNA methylation molecular patterns we proposed are an innovative complement to the traditional classification of RCC, which might contribute to precision medicine.
Renal cell carcinoma (RCC) accounts for 2% of all cancer cases across the globe [1]. In estimation, there are approximately 431,000 newly diagnosed RCC cases and 179,000 death cases globally in 2020 [2]. RCC is primarily divided into three histopathological types: clear cell RCC (ccRCC), papillary RCC (pRCC), as well as chromophobe RCC (chRCC) [3]. ccRCC represents the leading heterogeneous subtype, accounting for 75% of all RCC patients [4]. Meanwhile, pRCC, which can be subdivided into type 1 pRCC (basophilic) and type 2 pRCC (eosinophilic), and chRCC separately account for about 15% and 5% of all patients [4]. More than half of RCC cases are accidentally diagnosed during imaging as other diseases and there are no clinically reliable RCC-specific screening tools [5]. The five-year survival rate of localized cases is high following surgery. However, more than 30% of cases occur local or distant spread once diagnosed. Patients with metastases present high resistance to conventional chemotherapy. Novel therapeutic strategies have been developed, including tyrosine kinase inhibitors, mTORC1 inhibitors, immunotherapy, and multiple kinase inhibitors, with a response rate of 35% [6]. Nevertheless, resistance to the above treatment is frequent and most cases still die from RCC.
RCC pathogenesis has the features of diverse biological disorders involving epigenetic and genetic changes, and DNA methylation abnormality is regarded as a key event for cancer initiation and progression [7]. DNA methylation is primarily mediated by three writers (DNMT1, and DNMT3A/B), three erasers (TET1–3), as well as fourteen readers (MBD1–4, ZBTB33, ZBTB38, ZBTB4, UHRF1, UHRF2, MECP2, UNG, TDG, NTHL1, and SMUG1). Dysregulated DNA methylation regulators are indispensable for tumorigenesis, including RCC [8]. For instance, expression of DNMT1, and DNMT3A/B is elevated in RCC tissues [9]. DNMT1 facilitates the proliferation and invasion of RCC cells [10]. DNMT3A that is recruited by HOXA5 promotes the increase of DNA methylation of slug, thereby hindering EMT and metastases of RCC [11]. DNMT3B can interact with NEDD8-modified proteins [12]. Suppression of TET1 alleviates proliferation and metastases of RCC cells [13, 14]. TET2 inhibits VHL loss-induced RCC through down-regulating HIF pathway [15]. TET3 is an independent predictor of poor survival in RCC [16]. MBD2 associates with undesirable prognosis and confers an oncogenic role in the malignant development of RCC [17]. MBD3 controls epigenetic modulation on EPAS1 promoter in cancer [18]. MBD4 expression is elevated following oxidative stress and is associated with the malignant transformation of kidney epithelial cells [19]. MECP2 decreases the proliferative, migrative, and invasive capacities of RCC cells [20]. Finally, UHRF1 facilitates RCC progression via epigenetic modulation of TXNIP [21]. Nevertheless, the overall impact of known DNA methylation modifiers upon RCC prognosis and therapeutic response is still ill-defined. Here, we determined DNA methylation modification patterns in RCC through an unsupervised clustering algorithm by profiling the expression of 20 DNA methylation regulators. Three patterns presented diverse clinical and molecular features and therapeutic responses. Additionally, we developed a scoring system for quantifying DNA methylation status individually, which acted as an alternative tool for predicting prognosis and immunotherapeutic response.
The expression matrix and mutational data, along with clinicopathological information of the RCC patients were curated from the Cancer Genome Atlas (TCGA) project via Genomic Data Commons (GDC; https://portal.gdc.cancer.gov/) and the ArrayExpress project (https://www.ebi.ac.uk/arrayexpress/). We employed the following in our study: TCGA-kidney renal clear cell carcinoma (KIRC) cohort (containing 538 ccRCC tumor samples and 72 non-tumor samples) from the TCGA project (discovery cohort); TCGA-kidney chromophobe renal cell carcinoma (KICH) (containing 64 chRCC tumors and 24 non-tumors); TCGA-kidney renal papillary cell carcinoma (KIRP) (containing 286 pRCC tumors and 32 non-tumors) cohort from the TCGA project; and E-MTAB-1980 (n = 101) cohort from the ArrayExpress project (verification cohorts). RNA-seq transcriptome count matrix of TCGA cohorts was converted to transcripts per kilobase million (TPM) matrix. Microarrays of the E-MTAB-1980 dataset were retrieved from the ArrayExpress project, and subsequently background-corrected and normalized with a robust multiarray analysis method using the affy package (version 2004, Lyngby, Denmark) [22]. In total, TCGA somatic mutations (n = 336) and copy number variations (CNVs; n = 589) were acquired. DNA methylation data of RCC patients from HumanMethylation450 were also curated from the TCGA database via GDC data portal.
The mutation annotation format (MAF) of somatic mutational profiling was utilized for mutation analysis with the maftools package (version 3.17) [23]. Tumor mutational burden (TMB) refers to the amount of somatic, coding, base substitution as well as indel mutation/megabase in the genomic data utilizing non-synonymous and code transfer indels at the detection limit of 5% [24].
The analyses of DNA methylation regulators were conducted based on the STRING (https://string-db.org/) [25]. The PPI network data were processed with the Cytoscape tool (version 2023.3.10.0, University of California, Berkeley, CA, USA) [26].
Targeted therapy response prediction was carried out with the pRRophetic algorithm [27] according to the Genomics of Drug Sensitivity in Cancer (GDSC) (https://www.cancerrxgene.org/) [28]. The half maximal inhibitory concentration (IC50) was calculated with ridge regression analysis, with an assessment of prediction reliability via ten-fold cross-validation [29].
Immunological features were evaluated according to the infiltration level of tumor-infiltrating immune cells, the expression of immune checkpoints, and the expression of immunomodulators. Single sample gene set enrichment analysis (ssGSEA) was run to estimate the infiltration levels of immune cells. Estimation of STromal and Immune cells in MAlignant Tumours using Expression data (ESTIMATE) was adopted to quantify the overall infiltration of immune and stromal [30]. The expression of immune checkpoints PD-1 and PD-L1 was measured in each specimen. The information of immunomodulators containing MHC I and II molecules, receptors, chemokines, immune-stimulators, and immune-inhibitors was curated from Charoentong et al. [31].
Gene Set Enrichment Analysis (GSEA) was carried out to identify gene sets that
were significantly enriched in each specific group [32]. Only gene sets with
false discovery rate (FDR)
Unsupervised consensus clustering analysis of prognostic DNA methylation regulators that were determined with a univariate cox regression model was conducted utilizing the ConsensusClusterPlus package (version 4.3) [36]. Principal component analysis (PCA) was performed on expression profiling of prognostic DNA methylation regulators to uncover the remarkable distinction in diverse DNA methylation patterns. Utilizing the ggplot2 package (version 3.4.3), PCA results were presented using the first two principal components.
Tumor immune dysfunction and exclusion (TIDE), as well as subclass mapping (SubMap; https://cloud.genepattern.org/gp) algorithms, were employed to estimate the immunotherapeutic response. TIDE mainly assesses two distinct tumor immune escape mechanisms, namely abnormal tumor-infiltrating cytotoxic T lymphocytes (CTLs) and excluded CTLs via immunosuppressors [37]. SubMap algorithm was adopted for comparing similar expression profiling, which was utilized for predicting the possibility of therapeutic response to anti-CTLA-4 or anti-PD-1 inhibitors [38]. The annotation information of 47 patients with melanoma was curated from Roh et al. [39].
DEGs between three DNA methylation modification patterns were selected by using
the limma tool (version 3.0.1. 2016) [40]. The p-value derived from
multiple testing was corrected with the Benjamini–Hochberg method. The screening
criteria of DEGs were adjusted p
Feature selection of DEGs was carried out using the Boruta algorithm [41]. The
characteristic DEGs were further screened with univariate cox regression analysis
based on p
To improve the predictive accuracy of the DMS and offer a quantitative method for clinicians to predict overall survival (OS) along with disease-specific survival (DSS) outcomes, a nomogram model was conducted following the integration of independent prognostic indicators utilizing the rms package (version 6.7-0) [42]. The predictive efficacy was assessed through calibration. The calibration was determined utilizing calibration curves, which graphically depicted the agreement between the nomogram-estimated survival probabilities and the observed probabilities.
Drug sensitivity profiling of Cancer Cell Line Encyclopedia (https://portals.broadinstitute.org/ccle/) was retrieved from the Cancer Therapeutics Response Portal (CTRP; https://portals.broadinstitute.org/ctrp) and PRISM dataset (https://depmap.org/portal/prism/). Both datasets contain the area under the curve (AUC) value as an evaluation index of drug sensitivity. Candidate drugs were screened with the above approaches, which were further verified with the Connectivity map (CMap; https://clue.io/cmap) [43].
Continuous variables are displayed as median and quartiles, or mean
This study systematically reviewed published literature and gathered 20 DNA methylation regulators [44] (Fig. 1A). Most regulators except MECP2, TET1, UNG, and ZBTB4 presented remarkable increased expression in tumor compared with non-tumor specimens (Fig. 1B). For CNVs, ZBTB38, MBD4, and MECP2 displayed remarkably increased frequencies of amplifications, while TET2 and MBD3 had remarkably increased frequencies of deletions (Fig. 1C). The PPI network illustrates the widespread interactions among regulators (Fig. 1D).
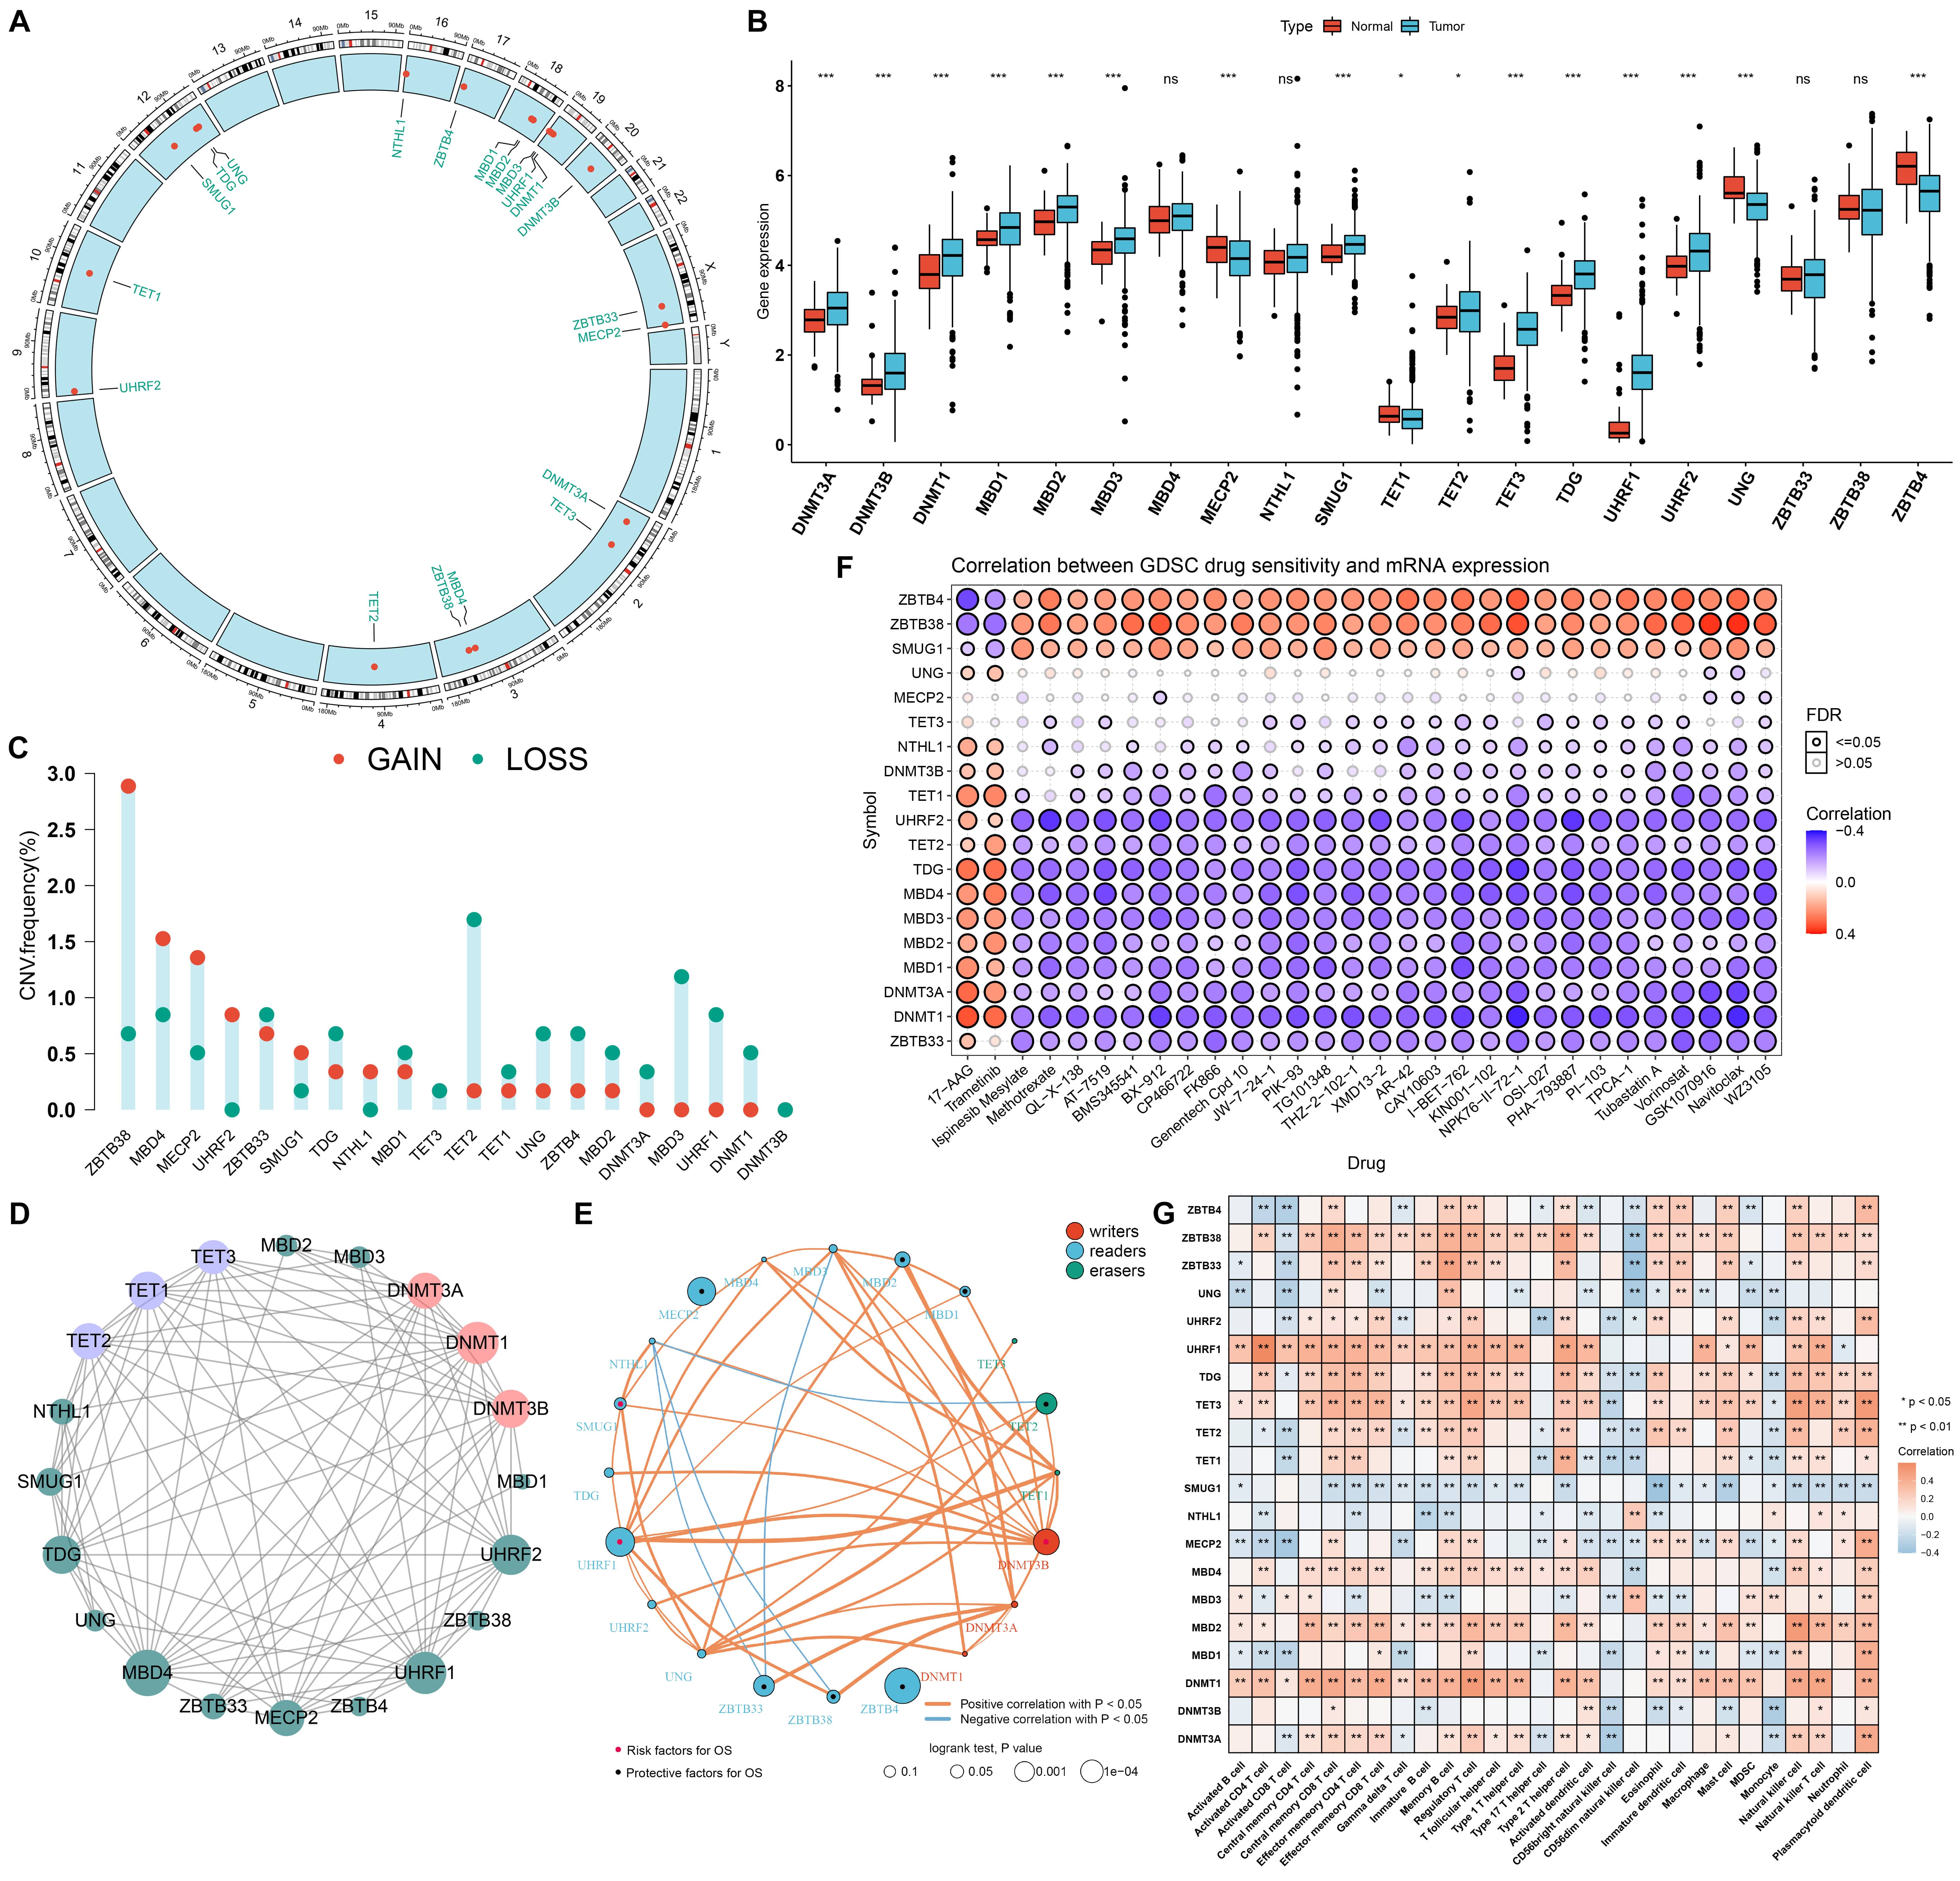 Fig. 1.
Multi-omics landscape, prognosis, and immune features of DNA
methylation modifiers in renal cell carcinoma (RCC). (A) The location of 20 DNA
methylation modifiers in the human chromosomes. (B) Boxplot displays the
expression of these DNA methylation regulators in tumors and non-tumor tissues in
the TCGA-KIRC cohort. Ns, no significance; *p-value
Subsequent analysis revealed the remarkable interactions and prognostic DNA methylation regulators, as depicted in Fig. 1E. TET2, MBD1, MBD2, MECP2, ZBTB33, ZBTB38, and ZBTB4 acted as protective factors while DNMT1, DNMT3A, DNMT3A, SMUG1, and UHRF1 acted as risk factors for RCC patients’ OS. Considering the roles of these regulators on RCC progression, the associations between drug sensitivity and their expression were estimated. In Fig. 1F, ZBTB4, ZBTB38, and SMUG1 were positively correlated to IC50 values in most small molecular compounds except 17-AAG and Trametinib while the opposite data were found for the other regulators, indicating that most regulators except ZBTB4, ZBTB38, and SMUG1 were positively linked to high sensitivity to most small molecular compounds. Additionally, we evaluated the roles of DNA modification regulators in immune cell infiltration. In Fig. 1G, most regulators presented positive correlations to most immune cells, indicating the prominent roles of DNA methylation in modulating immune cell infiltration. Considering the relatively higher expression of UHRF1 in tumors and its unfavorable prognostic significance, we evaluated the role of UHRF1 in RCC patients’ survival outcomes. In both TCGA-KIRC and the E-MTAB-6094 cohorts, KIRC patients with UHRF1 up-regulation displayed poorer OS outcomes than those with UHRF1 down-regulation (Supplementary Fig. 1A,B). Moreover, we noted that high UHRF1 expression was strongly linked to KIRC patients’ DFS (Supplementary Fig. 1C), DSS (Supplementary Fig. 1D), and PFS (Supplementary Fig. 1E) outcomes. In both TCGA-KICH (Supplementary Fig. 1F) and TCGA-KIRP (Supplementary Fig. 1G) cohorts, UHRF1 up-regulation indicated undesirable OS outcomes for KICH and KIRP patients. Consistent with KIRC patients, UHRF1 presented a remarkably enhanced expression in KICH and KIRP tumors compared with non-tumor tissues (Supplementary Fig. 1H). The roles of UHRF1 in tumor immunological features and immunotherapeutic efficacy were further evaluated. In Supplementary Fig. 1I, we observed that patients with UHRF1 up-regulation displayed higher PD-L1 and PD-1 expression compared with those with its down-regulation. GSEA results demonstrated that UHRF1 was remarkably linked to apoptosis, cell cycle, Th1/Th2/Th17 cell differentiation, B/T cell receptor, and chemokine pathways, demonstrating the role of UHRF1 in modulating tumor immunity (Supplementary Fig. 1J).
Through unsupervised consensus clustering analysis, we stratified KIRC cases
into three DNA methylation patterns under the expression of prognostic DNA
methylation modifiers (DNMT3B, MBD1, MBD2, MECP2, SMUG1, TET2, UHRF1, ZBTB33,
ZBTB38, and ZBTB4), namely C1 (n = 79), C2 (n = 245) and C3 (n = 206), as
depicted in Fig. 2A. PCA uncovered a prominent difference on the transcriptome
profiles of three DNA methylation modification patterns (Fig. 2B). Compared with
C1 and C2, C3 presented remarkable survival advantage (Fig. 2C; median OS (years)
for C1~3: 5.2 versus 6.4 versus not calculated). The accuracy of
such clusters was proven in the E-MTAB-6094 (Supplementary Fig. 2A–C).
We also investigated the clinical features across distinct patterns. In Fig. 2D,
no significant differences in age, sex, grade, and stage were found among the
three patterns. To uncover the biological behaviors underlying each DNA
methylation modification pattern, we estimated the activity of the known
hallmarks of gene sets with GSVA. In Fig. 2E, the C1 pattern displayed remarkable
activation of oncogenic pathways (like TNF
 Fig. 2.
DNA methylation modification patterns with distinct clinical features, molecular mechanisms, and molecular subtypes. (A) Unsupervised consensus clustering for determining DNA methylation modification patterns in TCGA-KIRC cohort, namely C1, C2, and C3. (B) Principal component analysis (PCA) depicts the prognostic DNA methylation regulator expression that distinguishes three DNA methylation subtypes in the TCGA-KIRC cohort. (C) Kaplan-Meier curves of OS for patients in C1, C2, and C3 patterns across TCGA-KIRC cases. (D) The distribution of clinical characteristics (age, gender, grade, and stage) among three DNA methylation modification patterns in the TCGA-KIRC cohort. (E) Heatmap displays the activity of the 50 hallmark gene sets in three patterns in the TCGA-KIRC cohort. (F) The interactions of DNA methylation modification patterns with known KIRC subtypes and immune subtypes across TCGA-KIRC cases. (G) Kaplan-Meier curves of OS for patients in S1–S6 immune subtypes in TCGA-KIRC cohort. (H) Kaplan-Meier curves of OS for patients stratified by immune subtypes and DNA methylation modification patterns in TCGA-KIRC cohort.
Further analysis showed that most DNA methylation modifiers except SMUG1, MBD3, NTHL1, DNMT3B, and UHRF1 presented increased expression in C2, followed by C3 (Fig. 3A). Additionally, these DNA methylation regulators contain widespread methylation and mutation across RCC specimens. In Fig. 3B, VHL, PBRM1, SETD2, BAP1, and mTOR ranked the first five mutational genes among RCC. The remarkable amplification and deletion were displayed in Fig. 3B. In particular, 5q35.1 amplification, 3p25.3 deletion, and 3p22.2 deletion widely occurred across RCC patients. Among three patterns, C2 displayed the lowest fraction of genome altered, lost, and gained (FGA, FGL, and FGG; Fig. 3C). We also noted that C3 had a relatively high TMB and single nucleotide variant (SNV) neoantigens; C2 had a relatively low cancer testis antigens (CTA) score; and C1 presented a relatively high intratumor heterogeneity (Fig. 3D).
 Fig. 3.
Transcriptomic, methylation, mutation and CNV characteristics,
immune landscape, and therapeutic response across DNA methylation subtypes. (A)
The heatmap depicts the mRNA expression, methylation levels, and mutation of DNA
methylation modifiers across three DNA methylation subtypes among TCGA-KIRC
cases. (B) The landscape of the somatic mutational genes across three patterns in
the TCGA-KIRC cohort. The upper panel shows the mutation frequencies of genes and
the lower panel displays the frequencies of CNV types. The distribution of tumor
mutational burden (TMB) is shown at the top of the panel. (C) Barplot shows FGA,
FGL, or FGG across three patterns in the TCGA-KIRC cohort. (D) The violin diagram
shows TMB, cancer testis antigens (CTA) score, single nucleotide variant (SNV)
neoantigens, and intratumor heterogeneity in three patterns. Ns, no significance;
*p-value
Following quantification of infiltration levels of immune cells, we observed that the C1 pattern presented low infiltration of immune cells and high tumor purity, while C2 and C3 had relatively high infiltration levels of immune cells but C2 presented increased stromal score (Fig. 3E). Additionally, low expression of immunomodulators was found in C1, while their high expression was observed in C2 and C3 (Fig. 3F). Hence, three patterns were consistent with the three classical immune phenotypes: immune-desert, immune-excluded, and immune-inflamed, respectively. Utilizing TIDE and submap algorithms, this work estimated the expression profiling of three DNA methylation modification patterns with an existing cohort including 47 melanoma individuals who experienced anti-PD-1 or anti-CTLA-4 immunotherapy. A significant association was found when comparing the expression profiling of the C3 pattern with PD-1-response patients following p-value correction with Bonferroni (Fig. 3G). This indicated that RCC patients in C3 might respond to anti-PD-1. Additionally, the difference in targeted drug sensitivity among the three patterns was estimated. In Fig. 3H, C2 presented the highest sensitivity to axitinib and pazopanib; C3 displayed the highest sensitivity to sorafenib; and C1 showed the highest sensitivity to sunitinib.
For an in-depth investigation of the biological behaviors involving each DNA
methylation modification pattern, we identified 1440 DNA methylation modification
pattern-relevant DEGs (Fig. 4A). Surprisingly, these genes presented enrichment
of biological processes prominently correlated to kidney development and renal
system development (Fig. 4B). Additionally, these genes were remarkably linked to
tumorigenic pathways like PI3K-Akt, proteoglycans in cancer, EGFR tyrosine kinase
inhibitor resistance, ECM-receptor interaction, Rap1, MAPK, cGMP-PKG, Notch, RCC,
and TGF-
 Fig. 4.
Construction of DNA methylation modification genomic clusters
and generation of DNA methylation score (DMS) signature. (A) Identification of
differentially expressed genes (DEGs) among three DNA methylation subtypes for
TCGA-KIRC cases. (B,C) Functional annotation of DEGs using (B) Gene Ontology (GO)
and (C) Kyoto Encyclopedia of Genes and Genomes (KEGG) enrichment analyses. (D)
Unsupervised consensus clustering analysis for determining three DNA methylation
modification genomic clusters in the TCGA-KIRC cohort. (E) Heatmap depicts the
expression patterns of DEGs in distinct DNA methylation modification patterns and
genomic clusters, along with diverse clinicopathological features in the
TCGA-KIRC cohort. (F) Kaplan-Meier curves of OS for cases in three DNA
methylation modification genomic clusters in TCGA-KIRC cohort. (G) The
distribution of DMS across three DNA methylation subtypes. ****p-value
With the PCA algorithm, we developed a DMS signature based on characteristic DNA methylation modification pattern-relevant DEGs. Particularly, there was a remarkable agreement in DMS between DNA methylation modification patterns (Fig. 4G) and genomic clusters (Fig. 4H). According to the median value of DMS, we classified patients in the TCGA-KIRC cohort into high and low DMS groups. Survival analysis demonstrated that the low DMS group displayed significantly undesirable OS outcomes in comparison to the high DMS group (Fig. 4I). ROC curves proved that DMS possessed a high accuracy in prediction of 3-, 5- and 10-year OS outcomes (Fig. 4J).
Survival analysis from the E-MTAB-1980 cohort demonstrated that high DMS was remarkably linked to better OS versus low DMS (Fig. 5A). We also observed that patients with high DMS presented a prominent advantage in DFS (Fig. 5B), DSS (Fig. 5C), and PFS (Fig. 5D) in TCGA-KIRC cohort. ROC curves at 3-, 5- and 10-year OS proved the well-predictive efficacy of DMS in the E-MTAB-1980 (Fig. 5E). Additionally, our data confirmed that DMS could be accurately predictive of RCC patients’ DFS (Fig. 5F), DSS (Fig. 5G), and PFS (Fig. 5H) outcomes in TCGA-KIRC cohort.
 Fig. 5.
Verification of the prognostic value of DMS for RCC. (A) Kaplan-Meier curves of OS for high and low DMS groups in the E-MTAB-1980 cohort. (B–D) Kaplan-Meier curves of (B) disease-free survival (DFS), (C) disease-specific survival (DSS), or (D) progression-free survival (PFS) for high and low DMS groups in the TCGA-KIRC cohort. (E) ROC curves at 3-, 5- and 10-year OS in the E-MTAB-1980 cohort. (F–H) ROC curves at 3-, 5- and 10-year (F) DFS, (G) DSS, or (H) PFS in TCGA-KIRC.
Following uni- and multivariate cox regression models, age, grade, and stage acted as independent risk factors of OS, while DMS served as an independent protective factor of OS in ccRCC (Fig. 6A). Through the combination of these independent prognostic factors, we established a nomogram for predicting ccRCC patients’ 1-, 3- and 5-year OS probabilities (Fig. 6B). The calibration curves proved that the nomogram could accurately predict ccRCC patients’ OS outcomes (Fig. 6C–E). Additionally, the desirable efficacy was externally proven in the E-MTAB-1980 (Supplementary Fig. 3A–E). We also noted that stage, grade, and DMS were independently linked to patients’ DSS (Fig. 6F). Based on them, a nomogram was developed for the prediction of DSS outcomes (Fig. 6G). The calibration curves under 1-, 3- and 5-year DSS confirmed the favorable prediction performance of the nomogram (Fig. 6H–J).
 Fig. 6.
DMS in combination with clinicopathological features in clear cell RCC (ccRCC) patients’ OS and DSS. (A) Uni- and multivariate analyses for the association of DMS and clinicopathological features with patients’ OS in TCGA-KIRC cohort. (B) The nomogram integrated independent prognostic factors in predicting patients’ OS in the TCGA-KIRC cohort. (C–E) The calibration diagram of this nomogram. The x-axis displays the model-estimated OS and the y-axis displays the observed OS. (F) Uni- and multivariate cox regression models for the association of DMS and clinicopathological features with patients’ DSS in TCGA-KIRC cohort. (G) Construction of the nomogram for prediction of patients’ DSS through combination with independent prognostic factors in TCGA-KIRC cohort. (H–J) The calibration diagram of this nomogram. The x-axis displays the model-estimated DSS and the y-axis displays the observed DSS.
In Fig. 7A, most C2 patients were found to present higher DMS. Additionally, we investigated the distribution of DMS across known KIRC subtypes and immune subtypes. As a result, KIRC subtype 1 displayed increased DMS while most patients in immune subtype S2 had higher DMS. We also noted that high DMS was linked to survival and early stage and grade. The difference in the activity of hallmark pathways was evaluated between high and low DMS patients. As depicted in Fig. 7B, high DMS was positively linked to immune activation processes (such as IL2-STAT5, complement, and IL6-JAK-mTOR pathways) and stromal activation processes (like angiogenesis), while low DMS presented negative correlations to tumorigenic pathways such as DNA repair, oxidative phosphorylation, MYC targets v2, p53 pathway, and mTORC1 signaling, indicative of the survival advantage of high DMS patients. We also observed the heterogeneity in immune cell infiltrations for high and low DMS populations. In Fig. 7C, most immune cells presented higher infiltration levels in high DMS patients.
 Fig. 7.
Association between DMS and clinicopathological characteristics,
known molecular subtypes, signaling pathways, immune cell infiltration, and
sensitivity to small molecular compounds. (A) The heatmap depicts the
interactions of DMS with known molecular subtypes and characteristic features in
TCGA-KIRC. (B) The activity of hallmark pathways corresponding to DMS across RCC
patients in the TCGA-KIRC cohort. (C) The heatmap displays the infiltration
levels of immune cells corresponding to DMS across RCC patients in the TCGA-KIRC
cohort. (D) Differential drug response analysis of seven Cancer Therapeutics
Response Portal (CTRP)-derived drugs and seven PRISM-derived drugs. A lower
estimated AUC value on the y-axis of boxplots implies higher sensitivity to a
specific drug. ***p-value
The CTRP and PRISM projects that contained the expression profiling and drug
sensitivity data of diverse cancer cell lines were employed for determining the
candidate drugs with higher sensitivity for low DMS patients. Differential drug
response analysis between high and low DMS groups was presented for identifying
drugs with reduced estimated AUC values in the low DMS group. Consequently, this
work selected seven CTRP-derived agents (BRD-K97651142, brivanib, CR-1-31B,
methotrexate, oligomycin A, ouabain, and SR-II-138A) and seven PRISM-derived
compounds (Vincristine, BIBU-1361, romidepsin, flumethasone,
halobetasol-propionate, VLX600, and ingenol-mebutate), as depicted in Fig. 7D.
Above drugs presented reduced estimated AUC values in low DMS group, indicating
that they might exert therapeutic effects on RCC patients with low DMS. Despite
this, the above analysis cannot support the conclusion that these drugs had
therapeutic effects on RCC. Hence, we conducted a multiple-perspective analysis
to investigate the treatment potential of these drugs in RCC. Firstly, we adopted
CMap analysis for identifying drugs with RNA expression profiling opposite to
RCC-specific expression profiling (e.g., RNA expression increased in RCC tissues
but reduced following treatment with specific drugs). Four drugs containing
brivanib (FGFR inhibitor), BIBU-1361 (EGFR inhibitor), ouabain (ATPase
inhibitor), and vincristine (Tubulin inhibitor) displayed CMap score
The work conducted a global analysis of 20 DNA methylation modifiers in RCC at multi-omics levels. As biotechnological advances, innovative omics approaches are constantly emerging, which help us access multi-layer information to characterize distinct molecular layers [45]. Most regulators except MECP2, TET1, UNG, and ZBTB4 were remarkably up-regulated in RCC. Additionally, these regulators occurred widespread CNVs in RCC. Nevertheless, the functions of DNA regulators in RCC lack adequate experimental evidence. There were widespread interactions among them and most were remarkably linked to RCC prognosis, drug sensitivity, and immune cell infiltration, indicative of the roles of DNA methylation regulators in RCC progression. Specifically, we proved that UHRF1 was highly expressed in RCC and contributed to undesirable survival outcomes. Previous evidence shows that UHRF1 triggers RCC progression by epigenetic modulation of TXNIP [21], via modulation of p53 ubiquitination and p53-dependent cell apoptosis in ccRCC [46]. Our discovery also showed that UHRF1 was positively linked to tumor immunity, which deepened the understanding of UHRF1 function in RCC.
DNA methylation has emerged as a diagnostic tool for classifying tumors [47]. DNA methylation modification patterns have been conducted only in lung adenocarcinoma [48] and gastric cancer [44]. Herein, we established three DNA methylation subtypes in RCC following the expression profiling of 20 DNA methylation modifiers with an unsupervised clustering approach. C3 displayed a remarkable survival advantage compared with C1 and C2. RCC has the features of mutations in target genes related to metabolic pathways and metabolic reprogramming including distinct processes like aerobic glycolysis, and fatty acids metabolism. We noted the remarkable activation of metabolic pathways in C1. The key mutated genes that modulate RCC initiation and progression contain genes related to cellular oxygen sensing (like VHL), epigenetic modification (PBRM1, SETD2, and BAP1), as well as growth factor signaling (mTOR) [49]. We found that the above key genes possess the most frequent mutations in RCC, confirming the tumorigenic roles of these mutated genes in RCC. Further analysis uncovered three patterns presented high consistency with immune phenotypes: immune-desert, immune-excluded, and immune-inflamed, respectively [3]. DNA methylation status may influence the cellular phenotype and remodel the tumor microenvironment, which allows tumor cells to overgrow and escape from immunosurveillance [50, 51]. Our submap analysis indicated that C3 patients more possibly responded to anti-PD-1. Hence, this classification might be applied to determining the immunotherapy options. Additionally, while C2 was sensitive to axitinib and pazopanib, C3 was sensitive to sorafenib and C1 was sensitive to sunitinib, showing the widespread difference in targeted drug response among three patterns.
In accordance with DNA methylation modification-relevant DEGs, we conducted a DMS signature with a PCA approach [52, 53, 54]. It could quantitively evaluate the DNA methylation status in RCC. Additionally, based on external verification, DMS could accurately predict RCC patients’ survival outcomes. For facilitating clinical application, we also conducted a prognostic nomogram model that integrated DMS and conventional clinicopathological characteristics for the prediction of patients’ OS and DSS outcomes. Due to the unfavorable prognosis of low DMS patients, brivanib and vincristine which possessed robust clinical and experimental evidence were determined to represent promising therapeutic drugs for low DMS patients.
Nevertheless, there are still limitations in our analysis. First, the number of cohorts was limited. Second, due to a lack of RCC immunotherapy cohorts, we failed to validate the immunotherapeutic response of diverse DNA methylation subtypes for RCC patients. Third, our conclusions were drawn from in silico analysis. Thus, experimental and clinical exploration will need to be conducted to promote the clinical usage of these conclusions.
Collectively, this study constructed novel DNA methylation modification patterns in RCC. Molecular and clinical features comparisons among three patterns offered a unique perspective on RCC initiation and progression. The specific DMS signature and relevant nomograms were effective and intuitive tools for assessing RCC individuals’ survival outcomes. Overall, our findings defined the molecular patterns of RCC according to the expression profiling of DNA methylation regulators, which might recognize patients’ heterogeneity and assist in guiding treatment options and clinical decisions for improving RCC outcomes.
RCC, renal cell carcinoma; ccRCC, clear cell RCC; pRCC, papillary RCC; chRCC, chromophobe RCC; TCGA, the Cancer Genome Atlas; GDC, Genomic Data Commons; KIRC, kidney renal clear cell carcinoma; KICH, kidney chromophobe renal cell carcinoma; KIRP, kidney renal papillary cell carcinoma; CNVs, copy number variations; TMB, Tumor mutational burden; PPI, Protein-protein interaction; GDSC, Genomics of Drug Sensitivity in Cancer; IC50, half maximal inhibitory concentration; ssGSEA, Single sample gene set enrichment analysis; ESTIMATE, Estimation of STromal and Immune cells in MAlignant Tumours using Expression data; GSEA, Gene Set Enrichment Analysis; MSigDB, Molecular Signatures Database; GO, Gene Ontology; KEGG, Kyoto Encyclopedia of Genes and Genomes; GSVA, Gene set variation analysis; PCA, Principal-component analysis; TIDE, Tumor immune dysfunction and exclusion; SubMap, subclass mapping; CTLs, cytotoxic T lymphocytes; DEGs, differentially expressed genes; DMS, DNA methylation score; PC, principal component; OS, overall survival; DSS, disease-specific survival; CCL, cancer cell line; CTRP, Cancer Therapeutics Response Portal; CMap, Connectivity map; DFS, disease-free survival; PFS, progression-free survival; ROCs, receiver operating characteristic curves.
Not applicable.
The data used to support the findings of this study are included within the supplementary information files. Data acquisition of the RCC patients were curated from the Cancer Genome Atlas (TCGA) project via Genomic Data Commons (GDC; https://portal.gdc.cancer.gov/) and the ArrayExpress project (https://www.ebi.ac.uk/arrayexpress/) with accession number GSE54932; GSE74734; GSE66879; GSE54932; GSE126964 and EGAS00001000509.
DB conceived and designed the study. YC, XL conducted most of the experiments and data analysis, and wrote the manuscript. GPN and HS helped in collecting data and validation to draft the manuscript and revision. All authors contributed to editorial changes in the manuscript. All authors read and approved the final manuscript. All authors have participated sufficiently in the work and agreed to be accountable for all aspects of the work.
Not applicable.
We appreciated TCGA database for providing the original study data. The Institute for Integrated Cell-Material Science (iCeMS), Kyoto University and The Interdisciplinary Cluster for Cutting Edge Research, Shinshu University are further acknowledged in providing space, computational facility and services.
This work is supported by the Science Technology and Innovation Commission of Shenzhen Municipality (JCYJ20190806153018791), Natural Science Foundation of Zhejiang Province (LGF19H200005), Natural Science Foundation of Shaanxi (81601553), The Innovation and Entrepreneurship Project for Undergraduate Students (XN2021119, S202110699680), and the Japan China Medical Association (2018920).
The authors declare no conflict of interest.
Publisher’s Note: IMR Press stays neutral with regard to jurisdictional claims in published maps and institutional affiliations.