1. Introduction
Dilated cardiomyopathy (DCM) is a myocardial disease characterized by
ventricular dilation and impaired cardiac contractility (systolic and diastolic
function), which is a leading contributor to heart failure (HF) with reduced
ejection fraction [1, 2]. Despite the considerable advances in the treatment of
DCM, some individuals remain at risk of sudden cardiac death and intractable
heart failure, which necessitates cardiac transplantation or mechanical
circulation support.
Pathological changes associated with inflammation and autoimmune reactions have
been demonstrated to be pivotal in the development and advancement of DCM, yet
the exact mechanism remains unknown [3]. Macrophages may be involved as immune
cells that oversee the progression of myocarditis to DCM [4]. Yang et al. [5] conducted
an evaluation on the expression level of 22 different types of immune cells in
patients with DCM. This research found that the expression of M1 macrophages was
significantly higher compared to normal heart tissue in the DCM group. CCR2
macrophages, with features that are similar to the traditionally identified M1
macrophages, secret inflammatory cytokines, which can result in myocardial damage
and an unfavorable remodeling process, which can accelerate the development of
heart failure [6]. Research has demonstrated that the presence of CCR2 macrophages is a predictor of unfavorable remodeling in individuals with
advanced HF [7].
Macrophage metabolic reprogramming has been demonstrated to be strongly
associated with cardiovascular diseases, potentially being the key factor in
initiating macrophage inflammatory response [8]. It has been observed that the
circulating monocytes of individuals affected by cardiovascular illness exhibit
elevated aerobic glycolysis and retain this pattern of metabolism even after they
transform into cardiac macrophages [9, 10]. Following an acute myocardial
infarction in mice, a significant up-regulation of glycolytic related genes such
as glyceraldehyde-3-phosphate dehydrogenase (GAPDH) in cardiac macrophages is
observed, which promotes glucose uptake and lactate production [11]. Under
hypoxic conditions, the activation of hypoxia-inducible factor 1
(HIF-1) in macrophages promotes glycolysis, interrupts the process of
tricarboxylic acid (TCA) and oxidative phosphorylation, and increases the
production of citric acid and succinic acid, which results in the accumulation of
lactic acid [8, 12]. This further triggers the release of inflammatory factors
such as reactive oxygen species (ROS) and activates the NF- B pathway,
leading to the up-regulation of IL-1 , IL-6, IL-18 and TNF- [8]. The secretion of inflammatory factors contributes to the stabilization of
HIF-1, thus setting up a negative feedback loop [12]. The metabolic
reprogramming of macrophages has an impact on the inflammatory response in
ischemic heart disease, which is a result of the balance between the M1 and M2
macrophages in the acute and recovery stages [8].
In this investigation, we aim to explore a connection between the metabolic
reprogramming of CCR2 monocytes/macrophages from the DCM patients and the
presence of chronic inflammation as well as the relationship of glucose
metabolism to the process. Such work can provide an uncharted peak checkpoint
that establishes a link between the overconsumption of glucose and the
functioning of inflammatory effectors. This can underscore the potential of
metabolic reprogramming of macrophages as a novel therapeutic target for
addressing the inflammatory response observed in cases of DCM.
2. Methods
2.1 Patients and Controls
In this investigation, 4 individuals afflicted with HF (with patients 2–4
specifically presenting with DCM) were subjected to a trans jugular
interventricular septum myocardial biopsy. The cardiac biopsy samples were
utilized for pathological evaluation, whereas biopsy samples of HF patients with
non-DCM were employed as a control group. Table 1 provides the demographic
characteristics of the 4 DCM patients. Incorporated into this investigation of
cell sorting in vitro were 23 individuals who had been clinically
diagnosed with DCM, as well as 14 healthy individuals who served as controls.
Table 2 provides an overview of the patients’ general information. The exclusion
criteria were as follows: myocarditis, pericardial disease, acute cerebrovascular
disease, moderate or severe liver dysfunction, severe infection, severe lung
disease, severe renal dysfunction (estimated glomerular filtration rate [eGFR]
15 mL/min/1.73 m, calculated by using the CKD-EPI formula), history of
malignant tumors, thyroid disorders, autoimmune diseases, hemopathy and recently
experienced trauma or surgery. The study was approved by the Ethics Committee of
Tianjin Chest Hospital and written informed consent was obtained from all
participants.
Table 1.Dilated cardiomyopathy (DCM, administered cardiac biopsies) patient information.
|
Patient 1 |
Patient 2 |
Patient 3 |
Patient 4 |
| Clinical features |
|
|
Gender |
Male |
Male |
Female |
Male |
|
Age, years |
47 |
25 |
52 |
47 |
| Symptoms |
|
|
Cardiopalmus |
No |
No |
No |
Yes |
|
Pectoralgia |
No |
No |
Yes |
No |
|
Expiratory dyspnea |
No |
Yes |
Yes |
Yes |
|
Experiencing HF symptoms |
No |
No |
Yes |
Yes |
|
NYHA classification |
2 |
2 |
3 |
3 |
| Laboratory examination |
|
|
hs-TnT, ng/mL |
0.014 |
0.009 |
0.009 |
0.212 |
|
BNP, pg/mL |
26.49 |
10 |
1388.56 |
356.68 |
|
hs-CRP, mg/L |
3.09 |
3.32 |
10.47 |
6.45 |
| CMR |
|
LA APD × LA TD, mm × mm |
42 × 61 |
48 × 58 |
43 × 68 |
83 × 57 |
|
LVTD, mm |
42 |
65 |
68 |
70 |
|
RA APD × RA TD, mm × mm |
60 × 48 |
52 × 38 |
45 × 34 |
43 × 67 |
|
RV TD, mm |
38 |
32 |
17 |
27 |
|
LV EF, % |
60 |
34 |
23 |
17 |
|
LV CO, L/min |
5.0 |
5.5 |
4.6 |
2.2 |
|
LV EDV, ml |
144.7 |
258.9 |
208.7 |
217.5 |
APD, anterior posterior diameter; BNP, brain natriuretic peptide; CMR, cardiac magnetic resonance; CO, cardiac output; EDV, end-diastolic volume; EF, ejection fraction; HF, heart failure;
hs-CRP, high sensitivity c reactive protein; hs-TNT, hypersensitive troponin T;
LA, left atrium; LV, left ventricular; NYHA, New York Heart Association; RV,
right ventricular; TD, transverse diameter.
Table 2.DCM patient information.
|
DCM (n = 23) |
Control (n = 14) |
t/Z |
p |
| Clinical features |
|
|
|
Gender, n |
Male: 17; Female: 6 |
Male: 3; Female: 11 |
|
0.003 |
|
Age, yrs |
64.70 11.95 |
63.07 3.79 |
0.592 |
0.558 |
|
Smoking, n |
7 |
4 |
- |
1.000 |
|
Drinking, n |
5 |
3 |
- |
1.000 |
|
NYHA classification, n |
IV: 3; III: 20 |
II: 6; I: 6; 0:2 |
- |
0.001 |
|
Diabetes, n |
6 |
6 |
- |
0.470 |
|
Hypertension, n |
13 |
9 |
- |
0.738 |
|
Ischemic etiology, n |
6 |
1 |
- |
0.217 |
|
COPD, n |
3 |
0 |
- |
0.275 |
|
Chronic kidney disease, n |
6 |
0 |
- |
0.065 |
|
AF, n |
11 |
1 |
- |
0.013 |
|
Stoke/TIA, n |
7 |
3 |
- |
0.710 |
| Laboratory examination and echocardiography |
|
|
|
LVEF |
0.34 0.11 |
0.63 0.03 |
–11.932 |
0.001 |
|
NTproBNP, pg/mL |
4561.50 (14443.00) |
67.24 (73.48) |
–4.998 |
0.001 |
|
hs-TnT, ng/mL |
0.039 (0.061) |
0.007 (0.004) |
–4.863 |
0.001 |
|
hs-CRP, mg/L |
5.700 (10.260) |
0.995 (2.360) |
–3.476 |
0.001 |
|
Fasting blood sugar, mmol/L |
5.46 (1.68) |
5.60 (1.41) |
–0.783 |
0.434 |
|
HbA1c, % |
7.00 1.13 |
6.94 0.83 |
0.111 |
0.913 |
|
Serum creatinine, µmol/L |
87.00 (31.00) |
66.50 (14.00) |
–4.060 |
0.001 |
|
Serum total bilirubin, µmol/L |
14.90 (22.30) |
9.15 (8.60) |
–2.928 |
0.003 |
|
Total cholesterol, mmol/L |
3.76 1.01 |
4.86 1.21 |
–2.953 |
0.006 |
|
Free fatty acids, mmol/L |
0.51 0.21 |
0.39 0.12 |
1.929 |
0.063 |
| Medical history |
|
|
|
|
|
ARNI/ACEI/ARB, n |
16 |
4 |
- |
0.021 |
|
Beta Blocker, n |
18 |
5 |
- |
0.015 |
|
Spironolactone, n |
13 |
0 |
- |
0.001 |
|
Statins, n |
13 |
11 |
- |
0.288 |
|
Nitrates, n |
9 |
3 |
- |
0.306 |
|
Diuretic agent, n |
20 |
0 |
- |
0.001 |
|
Digoxin, n |
8 |
0 |
- |
0.007 |
ACEI, angiotensin converting enzyme inhibitor; AF, Atrial fibrillation/ Atrial
flutter; ARNI, Angiotensin receptor-neprilysin inhibition; ARB, angiotensin
receptor antagonist; COPD, chronic obstructive pulmonary disease; HbA1c,
hemoglobin A1c; hs-CRP, high sensitivity c reactive protein; hs-TNT,
hypersensitive troponin T; LVEF, Left ventricular ejection fraction; NTproBNP,
N-terminal pro-brain natriuretic peptide; NYHA, New York Heart Association; TIA,
transient ischemic attacks.
2.2 Cell Culture
Human peripheral blood mononuclear cells (PBMCs) were isolated from healthy and
DCM donors using density centrifugation with Lymphoprep (STEMCELL Technologies,
Vancouver, Canada). From the PBMCs fraction, CCR2 monocytes were isolated
by magnetic-activated cell sorting (MACS) using a magnetic pole (EasySepTM
#18000, Miltenyi, Cologne, Germany), EasySep™ Release Human PE
Positive Selection Kit (#17654, STEMCELL Technologies, Vancouver, Canada) and
CD192 (CCR2) and Antibody #130-118-338 (Miltenyi, Cologne, Germany). In order to
generate CCR2 bone marrow-derived macrophages (BMDMs), 10/mL
CCR2 PBMCs were seeded into a six well plate and cultured for a period of 5
days in RPMI 1640 medium (#31870074, Life Technologies, Carlsbad, CA, USA)
supplemented with 20 ng/ml of M-CSF (#14-8789-80, eBioscience, San Diego, CA,
USA) and 10% of FBS (Lonza, Basel, Switzerland). On the third day, the medium
was replaced to ensure optimal growth conditions. CCR2 BMDMs attached to
plates were detached using StemPro Accutase Cell Dissociation Reagent (Lonza,
Basel, Switzerland). Cell activity was assessed using MTT assay (MTT kit,
#C0009S, Beyotime Biotech. Inc., Beijing, China).
2.3 Mitochondrial Respiration and Glycolysis
The Seahorse XF24 analyzer (Seahorse Bioscience, USA) was utilized to measure
oxygen consumption rate (OCR) and extracellular acidification rate (ECAR) in
accordance with our previously described method [13]. CCR2 BMDMs (5
10 cells/mL) were grown in 24-well plates with
1 µM oligomycin, 1 µM trifluoromethoxy
carbonyl cyanide phenylhydrazone, carbonyl cyanide 4-(trifluoromethoxy)
phenylhydrazone (FCCP), and 1 µM rotenone together with
1 µM antimycin A were added in sequence. The Seahorse
analyzer software was utilized to calculate OCR and ECAR.
2.4 Measurement of Glucose Uptake
CCR2 BMDMs (5 10 cells/mL) were placed in a glucose-free
RPMI medium with 5 µM of fluorescent D-glucose analogue
2-[N-(7-nitrobenz-2-oxa-1,3-diazol-4-yl) amino]-2-deoxy-D-glucose (Cayman
Chemical, Ann Arbor, MI, USA) and incubated for an hour at 37 °C. The
Lionheart FX automated imaging system (Bio Tek, Winooski, VT, USA) was employed
to analyze the fluorescent intensities.
2.5 Measurement of mtROS
Isolation of intact mitochondria from macrophages was conducted in accordance a
commercially available mitochondrial extraction kit (Solarbio, Beijing, China) as
per the manufacturer’s instructions. For the purpose of measuring
intramitochondrial ROS level, isolated mitochondria were transferred to a 96-well
flat-bottomed plate and a 2, 7-dichlorofluorescein diacetate (DCFH-DA)
fluorescent probe detection kit (#C2938, Thermo Fisher Scientific, Waltham, CA, USA)
together with a Lionheart FX automated imaging system (Bio Tek, USA) was used.
2.6 RT-PCR
Quantitative real-time polymerase chain reaction (RT-PCR) was conducted using
the mRNA reverse transcription kit (Roche, Basle, Switzerland) as per the
manufacturer’s instructions. SYBR Green PCR master mix (Roche, Basle,
Switzerland) was employed in RT-PCR, which was conducted using a CFX96TM PCR
detection system (BioRad, Redmond, WA, USA). The primer sequence is provided in
Table 3.
Table 3.Primer sequence.
| Target gene |
|
Primer sequence (5′ 3′) |
| PKM1 |
Forward: |
CGAGCCTCAAGTCACTCCAC |
| Reverse: |
GTGAGCAGACCTGCCAGACT |
| PKM2 |
Forward: |
ATTATTTGAGGAACTCCGCCGCCT |
| Reverse: |
ATTCCGGGTCACAGCAATGATGG |
| GLUT1 |
Forward: |
TATGTGGAGCAACTGTGTGGT |
| Reverse: |
TCCGGCCTTTAGTCTCAGGA |
| GLUT2 |
Forward: |
CGGCTGGTATCAGCAAACCT |
| Reverse: |
AGAAAGAGAGAACGTCGCCC |
| GLUT3 |
Forward: |
GTCATGATCCCAGCGAGACC |
| Reverse: |
CTGGGGTGACCTTCTGTGTC |
| GLUT4 |
Forward: |
TAGGCTCCGAAGATGGGGAA |
| Reverse: |
CCCAGCCACGTCTCATTGTA |
| PDK1 |
Forward: |
AGTGCCTCTGGCTGGTTTTG |
| Reverse: |
GCATCTGTCCCGTAACCCTC |
| PFKFB3 |
Forward: |
CTTGTCGCTGATCAAGGTGA |
| Reverse: |
TTCTGCTCCTCCACGAACTT |
| PFK1 |
Forward: |
CTGTACTCATCAGAGGGCAAG |
| Reverse: |
TGCCAGCATCTTCAGCATGAG |
| HK2 |
Forward: |
ACGGAGCTCAACCATGACCAA |
| Reverse: |
AAGATCCAGAGCCAGGAACTC |
| IL-6 |
Forward: |
AGTTCCTGCAGAAAAAGGCAAAG |
| Reverse: |
ATTTGCCGAAGAGCCCTCAG |
| IL-1 |
Forward: |
CAGGCTGCTCTGGGATTCTC |
| Reverse: |
GTCCTGGAAGGAGCACTTCAT |
| TNF- |
Forward: |
GCTGCACTTTGGAGTGATCG |
| Reverse: |
GCTTGAGGGTTTGCTACAACA |
2.7 Cell Transfection
CCR2 PBMCs and BMDMs were transfected with GLUT1 inhibitory sequence
(GLUT1) containing lentivirus (Genechem, Shanghai, China) or lentivirus
containing scrambled control sequences. Then, 5 10 cells/mL
CCR2 PBMCs and BMDMs were inoculated into a 6-well plate. The infection
reagent and lentivirus were added to CCR2 PBMCs and BMDMs according to the
manufacturer’s instructions. Following a 72-hour infection period, the
identification of GLUT1 mRNA expression in CCR2 PBMCs and BMDMs was
conducted through the utilization of RT-PCR.
2.8 Immunostaining
The heart tissues were fixed in 4% paraformaldehyde for 72 hours, following
which they were embedded in paraffin and cut into 4 µm thick sections. The
sections were then subjected to hematoxylin/eosin staining (H&E). The tyramide
signal amplification plus multiplex fluorescence staining kit (#G1236-100T,
Servicebio, Wuhan, Hubei, China) was used for staining CCR2 (#ab254375, Abcam,
Cambridge, UK), CX3CR1 (#ab167571, Abcam, Cambridge, UK) and -Actin
(#ab11003, Abcam, Cambridge, UK) according to the manufacturer’s protocol.
Following washing with PBS, the sections were counterstained with DAPI and
observed through a fluorescence microscope and digital camera (Axio Observer Al,
Carl Zeiss, Germany). Immunohistochemical staining of CD3 (total T cells), CD4
(helper T cells), CD8 (cytotoxic T cells), CD68 (macrophages), BCL-2 (proteins
marker of apoptosis), CD19 (B cells) and CD20 (B cells) was entrusted to the
Pathology Department of Tianjin Chest Hospital.
2.9 Western Blot
Western blot analysis was performed to determine the NLRP3 (#ab263899, Abcam,
Cambridge, UK) expression in CCR2 macrophages. The relative values were
adjusted to GAPDH expression levels and normalized relative to the baseline
controls.
2.10 Statistical Analysis
Data analysis was conducted using SPSS software version 24 (v24, IBM Corp., Chicago, IL, USA). The
Shapiro-Wilk test was performed to determine the normality of continuous
variables. Normally distributed continuous variables were presented as mean and
standard deviation ( s), and Intergroup comparisons were done using
independent two-tailed Student’s t-tests. For differences across
multiple groups with one variable, one-way analysis of variance (ANOVA) was
utilized, and for groups with multiple variables, a two-way ANOVA was applied.
Non-normally distributed continuous variables were presented as median and
interquartile interval (M(Q)), and the Wilcoxon Mann-Whitney test was used to
compare different groups. Categorical variables were expressed as frequencies and
compared using Fisher’s exact test. A p value 0.05 was considered
statistically significant. All experimental n numbers are provided in the figure
legends.
3. Results
3.1 Correlation Analysis between the Number of CCR2 Cells in
the Heart of DCM Patients and the Degree of their Heart Failure
From July to October 2021, the Cardiac intensive care unit of Tianjin Chest
Hospital administered cardiac biopsies on four patients that had been clinically
diagnosed with cardiomyopathy; these results showed that three of the cases
correlated with the clinical manifestations of heart failure resulting from
dilated cardiomyopathy, and they were consequently included in the study.
Patients 2–4 were clinically identified as having DCM, Patients 3 and 4 were
identified as having heart failure (DCM/HF), as demonstrated by the clinical
information. Relevant examinations and tests are provided in Table 2. Fig. 1A
provides typical cardiac magnetic resonance (CMR) images of these patients.
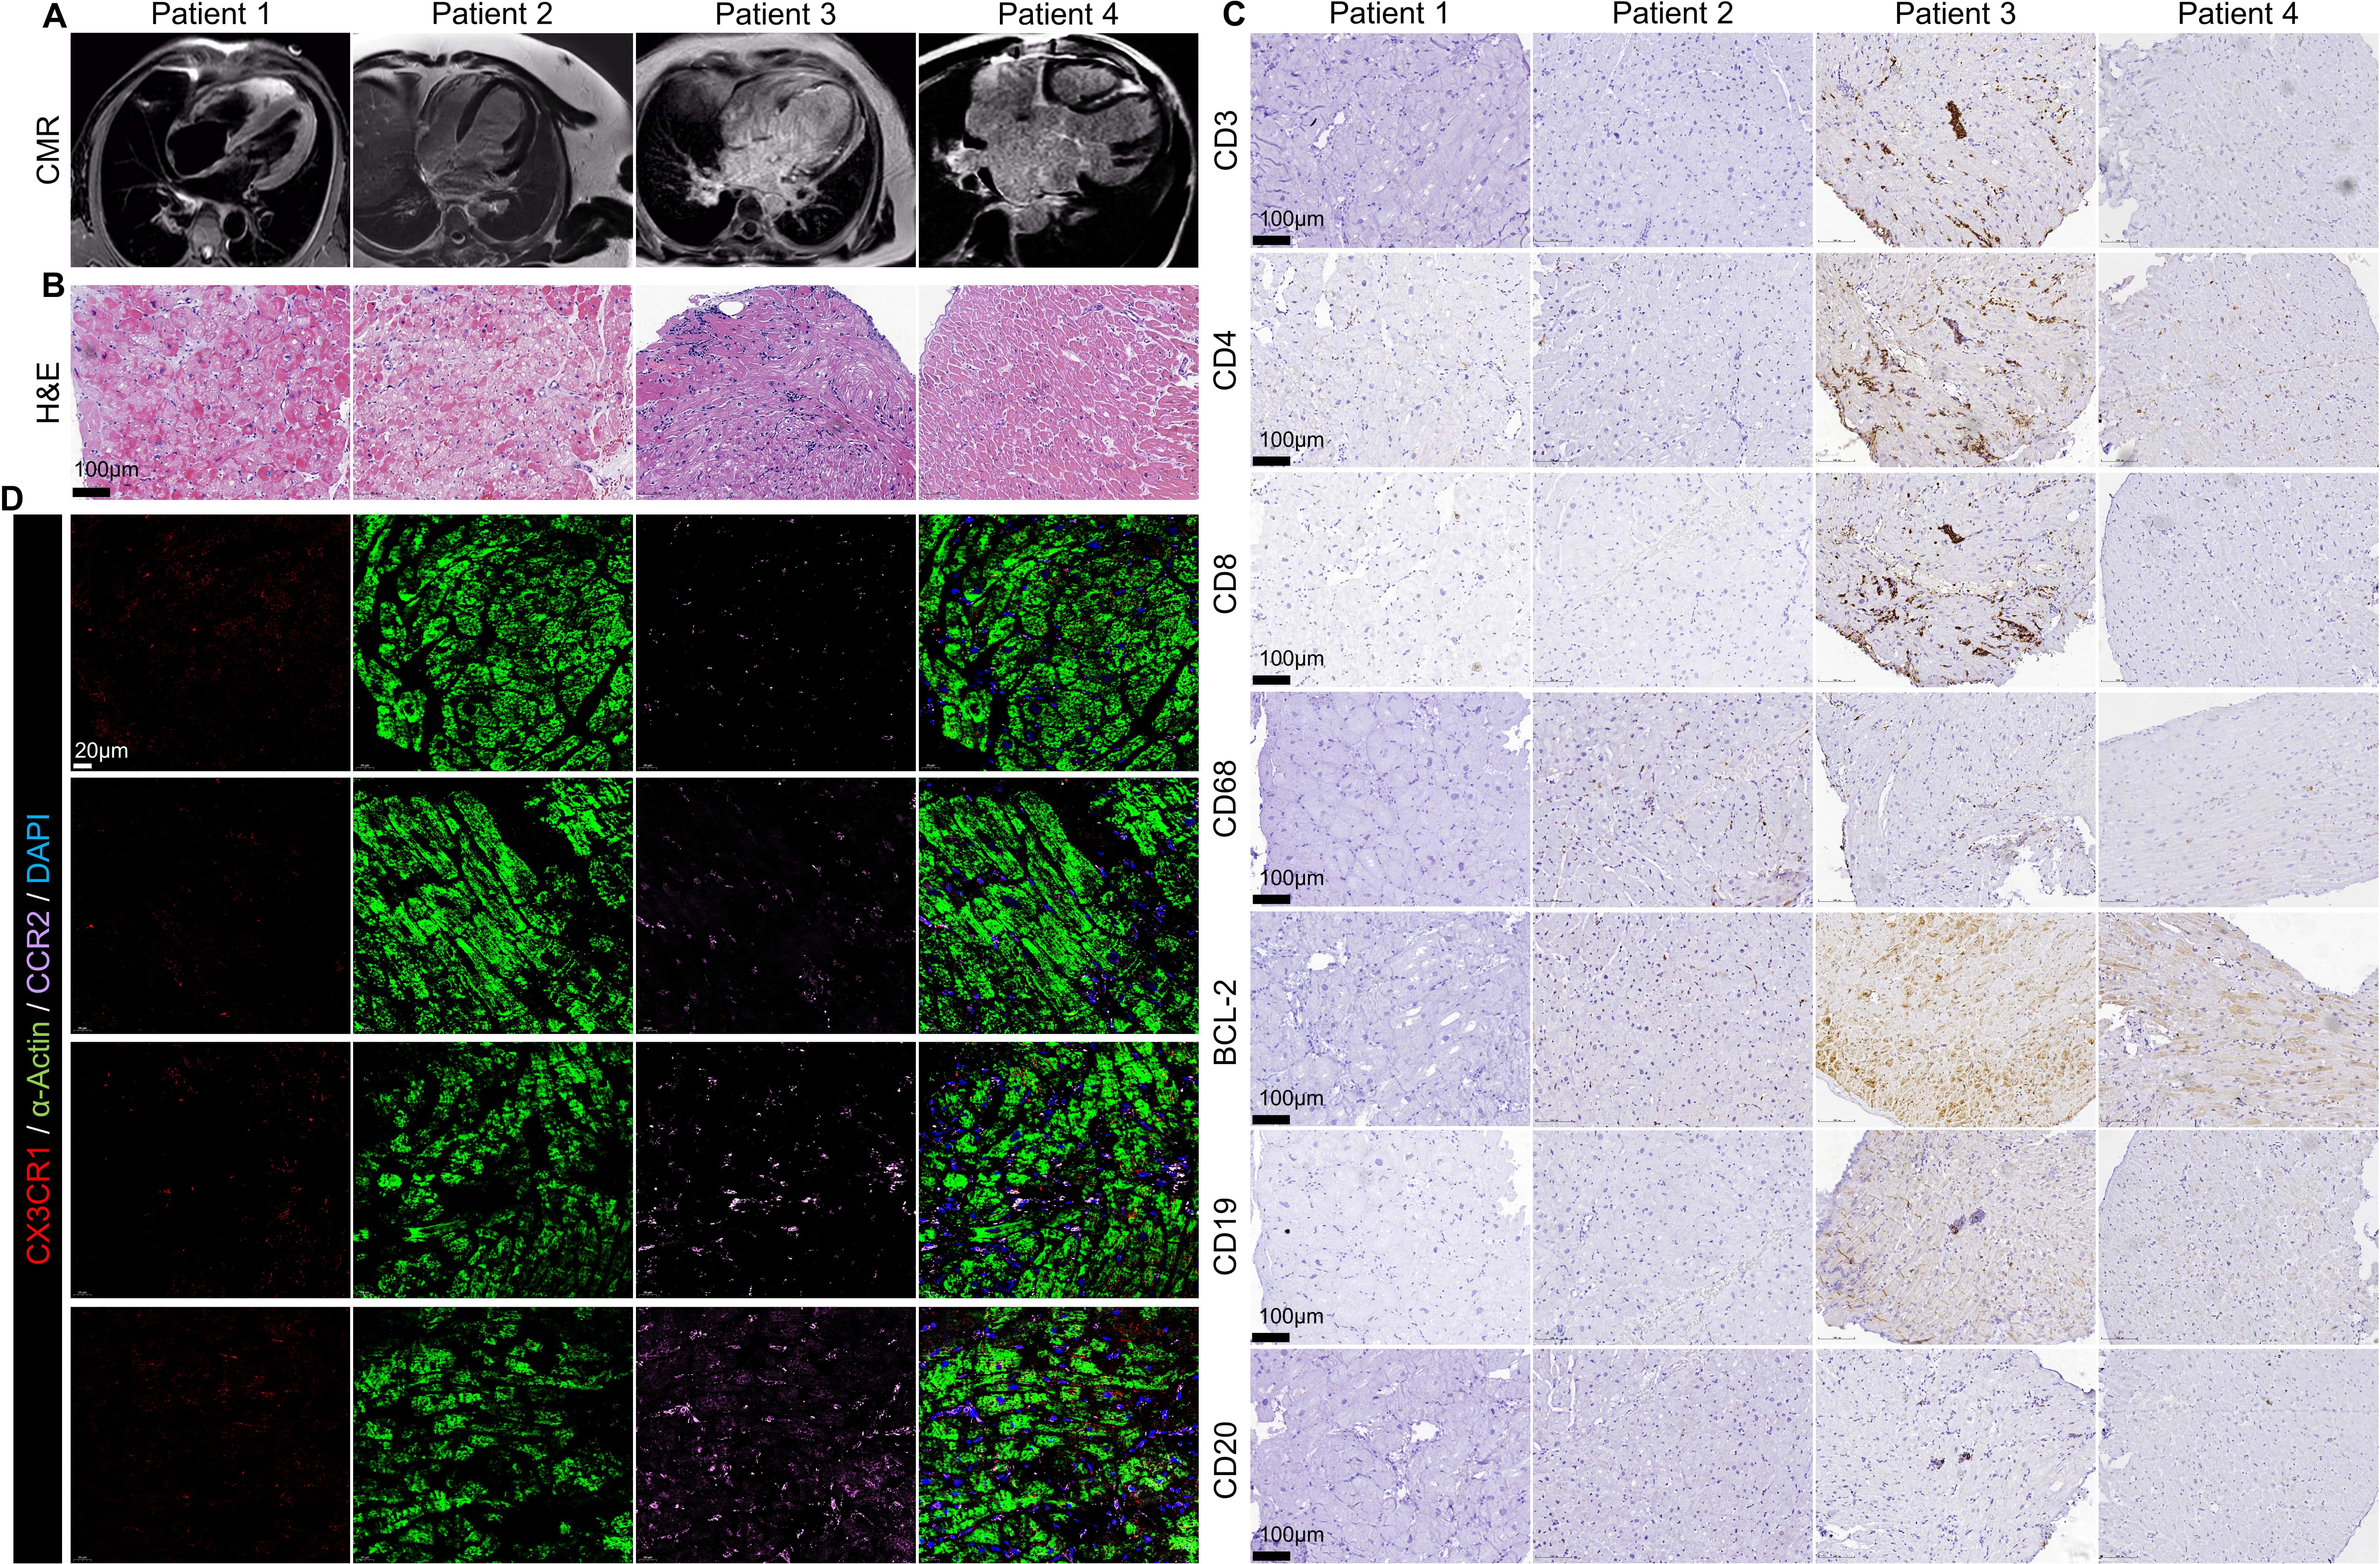 Fig. 1.
Patient 1-4 CMR histological examination. (A) Typical CMR
images of patient 1–4. (B) H&E staining of patient 1–4 (scale bar = 100
µm). (C) Immunohistochemical staining of CD3, CD4, CD8, CD68, BCL-2,
CD19 and CD20 (scale bar = 100 µm). (D) Patient 1-4 immunostaining
of CX3CR1 (Red), - Actin (green), CCR2 (Pink) (scale bar = 20
µm).
Histological examination (H&E staining) revealed that the myocardium of DCM
patients suffered from severe edema and vacuolar degeneration, with leukocyte
infiltration between the myocardium The degree of injury increased as the left
ventricular ejection fraction decreased (Fig. 1B). Immunohistochemical staining
revealed that CD19 and CD20 were not present in the myocardium of the patients,
whereas CD68, CD3, CD4, CD8 and BCL2 were expressed (Fig. 1C).
The connection between macrophages and myocardial injury was assessed through
co-localization immunofluorescence staining (Fig. 1D, CX3CR1: cardiac resident
macrophage marker, CCR2: myeloid proinflammatory macrophage marker, -
Actin: myocardial skeleton protein). Results indicated that CX3CR1 cells
(i.e., cardiac resident macrophages, Red) were exhausted in both DCM and DCM/HF
patients, and as DCM progressed to HF, the number of proinflammatory macrophages
(i.e., circulating infiltrating macrophages, CCR2 cells, purple)
significantly increased (Fig. 1D). The findings revealed that the increased
number of CCR2 macrophages was associated with the myocardial injury of
DCM. This was further substantiated by the CMR examination results (CMR, Fig. 1A), which confirmed the positive correlation between the degree of CCR2 macrophage cardiac injury and DCM heart.
3.2 The Level of Inflammation in CCR2 Monocytes and
Macrophages of Patients with DCM
To verify the link between CCR2 macrophages and DCM, a study was conducted
on CCR2 monocytes isolated from peripheral blood of 23 DCM patients and 14
control patients. The patient information is provided in Table 3. Briefly, the
DCM group and the control group exhibited considerable differences in assessing
the primary indicators of heart failure such as NYHA classification, LVEF%, and
the level of NT-proBNP and hs-TnT; No substantial divergence was observed between
the two groups in terms of the prevalence of hypertension and coronary artery
stenosis; The usage of anti-heart-failure-related drugs such as angiotensin
converting enzyme inhibitor (ACEI)/ angiotensin receptor antagonist (ARB)/
angiotensin receptor enkephalinase inhibition (ARNI), blockers,
spironolactone, diuretics, and digoxin in the DCM group was significantly higher
than that in the control group; and the proportion of patients in the two groups
who had ingested ivabradine, statins, nitrates and anticoagulants was not
significantly different.
Isolated CCR2 monocytes were induced into macrophages in vitro
and the mRNA expression analyzed for inflammation-related genes (IL-1,
IL-6 and TNF-) in CCR2 monocytes and CCR2 macrophages by
RT-PCR. The results revealed that the mRNA expression of inflammation-associated
genes IL-1, IL-6 and TNF- in CCR2 monocytes and
macrophages from the DCM group was significantly higher than that of the control
group (Fig. 2A–C). There was a positive correlation to the New York Heart
Association (NYHA) classification (Fig. 2D–F). It was observed that with the
deterioration of cardiac function, the expression of inflammatory related mRNA in
CCR2 monocytes and macrophages from peripheral blood of patients went
higher (Fig. 2D–F).
 Fig. 2.
The level of inflammation in CCR2 monocytes and
macrophages of patients with dilated cardiomyopathy. mRNA expression of
inflammation-associated genes IL-1 (A), IL-6 (B) and TNF- (C)
in CCR2 monocytes and macrophages. NYHA classification is associated with
IL-1 (D), IL-6 (E) and TNF- (F) mRNA expression. mRNA
expression of inflammation-associated genes TGF- (G), MMP2 (H) and MMP9
(I) in CCR2 macrophages. NYHA classification is associated with
TGF- (J), MMP2 (K) and MMP9 (L) mRNA expression. (M) Relationship
between statins used by DCM and IL-1, IL-6 and TNF-. (N)
Relationship between -receptor blockers, ARNI, and
Rivaroxaban/Dabigatran used by DCM and IL-1. (O) Relationship between
-receptor blockers, ARNI, and Rivaroxaban/Dabigatran used by DCM and
TGF-. All data are presented as the mean SD. Statistical
significance is indicated as: *p 0.05, **p 0.01
compared with the control group.
The mRNA expression of the related genes of extracellular matrix remodeling such
as transforming growth factor- (TGF-), matrix metalloproteinase
2 (MMP2) and matrix metalloproteinase 9 (MMP9) in CCR2 macrophages were
examined using RT-PCR. Compared to the control group, the mRNA expression of
TGF-, MMP2 and MMP9 of CCR2 macrophages in the DCM group were
significantly higher (Fig. 2G–I) . There was a positive correlation between the
mRNA expression and the worsening of NYHA cardiac function grading (Fig. 2J–L).
Utilizing the prior medication history of patients in the DCM group,
consideration was given to possible effects of statins, -receptor
blockers, ARNI, and direct oral anticoagulants (Rivaroxaban/Dabigatran) — all
of which are commonly prescribed for patients with heart failure. Statins had a
slight effect on decreasing the IL-1 and IL-6 mRNA expression of
CCR2 monocytes, though without any statistical significance (Fig. 2M–N).
On the other hand, neither receptor blockers, ARNI, nor
rivaroxaban/dabigatran had any effect on IL-1 mRNA expression (Fig. 2N).
Furthermore, statins, ARNI, and rivaroxaban/dabigatran had a slight effect on
reducing the TGF- of CCR2 macrophages mRNA expression, though
without any statistical significance, while receptor blockers had no
effect (Fig. 2O).
3.3 Metabolic Reprogramming of CCR2 Monocytes/Macropssshages
in DCM Patients
CCR2 monocyte and macrophage oxygen consumption rate (OCR) did not differ
statistically between the two groups (Fig. 3A,C), but extraceullular
acidification rate (ECAR) was significantly higher between the two groups (Fig. 3B,D).
 Fig. 3.
Metabolic reprogramming of CCR2 monocytes and macrophages
in DCM patients. oxygen consumption rate (OCR) (A,C) and extracellular acidification rate (ECAR) (B,D) in CCR2 monocytes and
macrophages measured using a Seahorse Bioscience XF24 analyzer (n = 4). Probes
were done with serial addition of A: oligomycin, B: FCCP, and C: antimycin
A/rotenone as indicated (E,F) are heat maps displaying the mRNA expression of
genes related to glycolysis in CCR2 monocytes and macrophages (n = 5). Also
shown are the mRNA expression of GLUT 1–4 in CCR2monocytes (G) and
macrophages (H), n = 5. (I) mRNA expression of PKM2 in CCR2 monocytes and
macrophages, n = 5. (J) Glucose uptake in CCR2 monocytes and macrophages
were measured using the fluorescence-labeled glucose analogue (2-NBDG) by mean
fluorescence intensity (MFI). (K) reactive oxygen species (ROS) levels in CCR2 monocytes and
macrophages using MitoSOX fluorescent probe. (L) ROS levels in CCR2
macrophages exposed to different concentrations of glucose. NYHA classification
is associated with 2-NBDG MFI (M) and mtROS MFI (N). (O) the activity of
CCR2 monocytes and macrophages, n = 5. IL-1 (P), TNF-
(Q) and IL-6 (R) mRNA expression level after administering 2-DG, n = 5. All data
are presented as the mean SD. Statistical significance is indicated as:
*p 0.05, **p 0.01 compared with the control group.
RT-PCR analysis revealed an upregulation of CCR2 monocyte and macrophage
glycolysis related genes, such as pyruvate kinase isoform M1 (PKM1), pyruvate
kinase isoform M2 (PKM2), GLUT1, GLUT2, GLUT3, GLUT4, phosphoinositol dependent
protein kinase 1 (PDK1), 6-phosphofructo-2-kinase/fructose-2,6-bisphosphatases 3
(PFKFB3), phosphofructokinase 1 (PFK1), and hexokinase 2 (HK2), in DCM patients
(Fig. 3E,F). Quantitative analysis further revealed that the expression of
GLUT1 in CCR2 monocytes and macrophages of DCM patients was significantly
higher than that of the control group, with statistical significance, while the
expression of GLUT2, GLUT3 and GLUT4 had no statistical difference between the
two groups (Fig. 3G,H).The enzyme PKM2, a pivotal component of glycolysis,
displayed a similar up-regulation trend as the other enzymes, with a
statistically significant variation between the two groups (Fig. 3I).
3.4 The Uptake of Glucose by CCR2 Monocytes/Macrophages and
Inflammation.
CCR2 monocytes and macrophages of DCM patients had high glucose uptake and
ROS levels in comparison to the control group (Fig. 3J,K). This increase
correlated with a worsening of cardiac function (NYHA classification, Fig. 3M,N). The mitochondrial ROS level of CCR2 monocytes and macrophages of DCM
patients was found to be positively correlated with glucose concentration (Fig. 3L).
CCR2 monocytes and macrophages from DCM patients were exposed to 2-DG, an
artificial glucose analogue that can simulate a lack of glucose for 6 hours. The
activity of CCR2 monocytes and macrophages remained unchanged (Fig. 3O),
but IL-6 and IL-1 mRNA expression level decreased significantly (Fig. 3P,R). There was no major fluctuation in the TNF- mRNA expression
(Fig. 3Q).
3.5 GLUT1 Regulation of the Metabolism Reprogramming of CCR2
Macrophages in DCM Patients to Promote Inflammatory Response
To further investigate the potential mechanism of CCR2 monocytes and
macrophages inflammation and glucose uptake, shRNA was employed to suppress the
mRNA expression of GLUT1 in CCR2 monocytes and macrophages from DCM
patients. Immunofluorescence staining revealed that CCR2 macrophages in DCM
patients expressed GLUT1 at a higher level than those in the control group (Fig. 4A). Furthermore, silencing CCR2 monocytes and macrophages in DCM patients
with shRNA resulted in a decrease in the mRNA expression of GLUT1 (GLUT1,
Fig. 4B). Following the silencing of GLUT1, the glucose uptake capacity of
CCR2 monocytes and macrophages in the DCM group was significantly decreased
(Fig. 4C), the level of mitochondrial ROS was significantly decreased (Fig. 4D),
and the expression of the inflammatory factor IL-1 was significantly
reduced (Fig. 4E). However, silencing GLUT1 had no significant effect on the mRNA
expression of IL-6 and TNF- (Fig. 4F,G). In addition, for NOD-like
receptor protein 3 (NLRP3) under GLUT1, the results revealed that the
NLRP3 expression in CCR2 macrophages from the peripheral blood of DCM group
were significantly higher than that of the control group. Also, the NLRP3
expression significantly decreased after GLUT1 was silenced (Fig. 4H,I).
Furthermore, NLRP3 immunofluorescence staining also confirmed this result (Fig. 4J).
 Fig. 4.
GLUT1 regulates the metabolism reprogramming of CCR2
macrophages in DCM patients to promote inflammatory response. (A) Immunostaining
of GLUT1 in CCR2 macrophages. (B) mRNA expression of GLUT1 in DCM
CCR2 monocytes and macrophages under GLUT1, n = 5. The level of
2NBDG MFI (C) and mtROS MFI (D) in DCM CCR2 monocytes and macrophages under
GLUT1, n = 5. IL-1 (E), IL-6 (F) and TGF- (G) mRNA
expression level in DCM CCR2 monocytes and macrophages under GLUT1,
n = 5. (H,I) Protein expression of NLRP3 in CCR2 macrophages under
GLUT1, n = 3. (J) Immunostaining of NLRP3 in DCM CCR2
macrophages. All data are presented as the mean SD. Statistical
significance is indicated as: *p 0.05, **p 0.01
compared with the control group.
4. Discussion
It has been established that inflammatory processes and autoimmune reactions
have a significant impact on the development of DCM [14]. However, the precise
mechanism of this is yet to be determined. In cardiac biopsy samples of patients
with DCM, it is often observed that there is a continuous infiltration of
inflammatory cells, such as CD4 and CD8 T lymphocytes and M1
macrophages, suggesting a correlation between inflammation and cardiac
dysfunction [5]. CCR2 monocytes demonstrate pro-inflammatory activity and
can differentiate into CCR2 macrophages with features that are similar to
the traditionally identified M1 macrophages. In this study, immunofluorescence
staining and CMRI of patients revealed that, as myocardial fibrosis worsened and
LVEF decreased, the number of CCR2 cells in myocardium increased,
signifying an infiltration of inflammatory macrophages. We observed that in the
vicinity of the CCR2 cells aggregation, the concentration of
-actin decreased, which is a major element of sarcomere filaments and
is responsible for the formation of the myocardial cells’ cytoskeleton and the
excitation-contraction coupling of myocardia. This evidence suggests that
CCR2 monocyte and macrophage may contribute to the myocardial damage
associated with DCM.
Clinical studies have verified that the IL-6 concentration in cardiac tissue of
individuals suffering from advanced heart failure is higher than that of those
with ischemic cardiomyopathy [15, 16, 17]. The direct injury effect of IL-6 on
cardiac cells, its ability to inhibit the excitation-contraction coupling of
cardiac cells, and its involvement in the onset of HF are all established [15, 16]. IL-1 has been shown to induce the production of chemokines,
facilitate the adherence and infiltration of inflammatory cells, and further
stimulate the proliferation of fibroblasts, which thus contribute to myocardial
fibrosis [18]. TNF- can increase the presence of proteins in the
interstitial tissue of the heart, thus stimulating myocardial fibrosis and
causing apoptosis of the cardiac cells, which leads to their death [19]. In the
current study, subgroup analysis of DCM revealed that the mRNA expression of
IL-1, IL-6 and TNF- corresponded with the decline in cardiac
function grading, which is in agreement with the findings of Parthenakis [20].
The new results further demonstrate the detrimental effects of IL-1,
IL-6 and TNF- on myocardial tissue. Additionally, in comparison to the
healthy control group, the mRNA expression of MMP2 and MMP9 in the DCM group was
significantly higher, indicating that DCM patients may experience augmented
extracellular matrix remodeling, which is associated with cardiac fibrosis.
Results from subgroup analysis indicated that TGF-, MMP2, and MMP9
increased as cardiac function grade increased. This suggests an augmentation of
extracellular matrix remodeling. Examining the prior medication history of DCM
patients further studied the impact of typical CHF drugs on the characteristics
of CCR2 monocytes and macrophages. The results indicated that statins could
possibly reduce inflammation and extracellular matrix remodeling due to CCR2monocytes and macrophages, while ARNI and direct oral anticoagulants
(Rivaroxaban /Dabigatran) may act to counteract the extracellular matrix
remodeling caused by CCR2 macrophages.
Previous research has verified that the mononuclear cells of CAD patients have a
high glycolysis rate, which causes a high production of ROS and intensifies their
pro-inflammatory activity [9]. The new results presented here indicates that
CCR2 monocytes and macrophages from peripheral blood of DCM patients
demonstrate high expression of inflammation-related factors, and the magnitude of
these inflammatory factors may be associated with ROS level and glycolysis.
Results also indicate that CCR2 monocyte and macrophage of DCM require more
energy to sustain their life activities than in a steady-state. However, this
increased energy is not obtained through aerobic respiration and oxidative
phosphorylation, but rather from the up-regulation of cell glycolysis, which
implies that metabolic reprogramming has occurred. It is generally accepted that
oxidative phosphorylation of cells is hindered during aerobic glycolysis. Yet in
this study, a reduction in OCR in DCM patients was not seen. This necessitatates
further investigation into the underlying reason and mechanism. Upon assessing
the subgroups of individuals with DCM, the glucose uptake and mitochondrial ROS
level of CCR2 monocytes and macrophages increased in proportion to the
cardiac function grading of NAHY. It was hypothesized that as DCM progressed, the
inflammatory response and glycolysis of CCR2 monocytes and macrophages
would also increase. Treatment of CCR2 monocytes and macrophages with 2-DG
instead of glucose resulted in significant decreases in the level of ROS and mRNA
expression of IL-6 and IL-1, following glucose deprivation. It was
evident that metabolic reprogramming of CCR2 monocytes and macrophages
strongly correlated with the secretion of inflammatory substances, thus leading
to a pro-inflammatory effect. Inhibiting its metabolic reprogramming can decrease
its inflammatory response.
The GLUTs protein family is responsible for the control of glucose uptake and
metabolism in adipose tissue, skeletal muscle, and liver. Generally, GLUTs are
responsible for the transport of glucose in and out of the cells which maintains
the balance of blood glucose [21, 22]. Data presented here has verified that
CCR2 monocytes and macrophages derived from peripheral blood of those with
DCM show a heightened expression of GLUT1. GLUT1 may be the crucial enzyme that
facilitates the entry of glucose into CCR2 monocytes and macrophages for
further glycolysis. Following the silencing of GLUT1 mRNA expression in
CCR2 monocytes and macrophages from DCM patients via shRNA, the glucose
uptake capacity of CCR2 monocytes and macrophages was significantly
reduced. In addition, the level of mitochondrial ROS was significantly decreased
and the expression of inflammatory factors was also diminished.
A constraint of the present investigation is the limited number of research
samples, which impedes our ability to accurately elucidate the impact of drugs on
macrophage metabolic reprogramming and its role in mediating inflammatory
response. Furthermore, owing to the limited number of CCR2 macrophages obtained
during the cultivation process in vitro, then current examination of
inflammatory factors and extracellular matrix-related proteins was restricted to
mRNA levels. This did not allow accurate discernment of variations in protein
expression of these factors and proteins. The findings of our study may have
aramifications for the management of DCM and its associated inflammatory
conditions. Results from our study showed that CCR2 monocytes and
macrophages from the peripheral blood of DCM patients had undergone metabolic
reprogramming leading to alterations in their inflammatory phenotype. Analysis of
CCR2 monocytes and macrophages of DCM patients revealed that the expression
of GLUT1 had an effect on the inflammatory phenotype of these cells when they
underwent metabolic reprogramming. By suppressing the expression of GLUT1, it is
possible to decrease the amount of mitochondrial ROS and the expression of
inflammatory factors in CCR2 monocytes and macrophages, which can lead to a
restriction in the progression of DCM. Our research can aid in the discovery of
fresh therapeutic objectives for dilated cardiomyopathy, and can lead to
innovative methodologies to decelerate the progression of cardiac remodeling in
individuals with this ailment.
5. Conclusions
CCR2 monocytes and macrophages from the peripheral blood of DCM patients
had experienced a metabolic transformation, resulting in changes to their
inflammatory characteristics. By inhibiting GLUT1, the production of
mitochondrial ROS and the expression of inflammatory factors in CCR2
monocytes and macrophages can be limited, thus slowing the advancement of DCM.
Availability of Data and Materials
The datasets used and/or analyzed during the current study are available from
the corresponding author on reasonable request.
Author Contributions
CF: Data curation, Investigation, Methodology, Writing — original draft; HJ:
Data curation, Investigation, Methodology; XY: Data curation, Investigation,
Methodology; HC: Conceptualization, Project administration; LL:
Conceptualization, Project administration, Writing — original draft; JF:
Conceptualization, Project administration, Funding acquisition, Validation. All
authors read and approved the final manuscript. All authors contributed to
editorial changes in the manuscript. All authors have participated sufficiently
in the work and agreed to be accountable for all aspects of the work.
Ethics Approval and Consent to Participate
The studies involving human participants were reviewed and approved by the
Ethics Committee of Tianjin chest hospital (IRB-SOP-016(F)-001-02). The
patients/participants provided their written informed consent to participate in
this study.
Acknowledgment
Not applicable.
Funding
This research was funded by National Natural Science Foundation of China
(82204885, LL); Tianjin Municipal Education Commission Scientific Research
Program (2021KJ131, LL); Tianjin Key Medical Discipline (Specialty) Construction
Project; Tianjin Science and Technology Plan Project (21JCZDJC00600, JF); Tianjin
Health Science and Technology Project (ZC20011, JF).
Conflict of Interest
The authors declare no conflict of interest.
