
- Academic Editor
†These authors contributed equally.
Background: Activation of the NOTCH signaling pathway is
associated with tumorigenesis. The aim of this study was to investigate
NOTCH pathway gene functions and regulatory mechanisms in ovarian cancer
(OC). Methods: We conducted a bioinformatics analysis of publicly
available datasets in order to identify potential NOTCH-related
mechanisms, associated genes, biological pathways, and their relation to immune
function. Results: Significant differential expression of the
NOTCH pathway genes DLL1, DLL3, DLL4,
HES1, HEY1, JAG1, NOTCH2, NOTCH3,
and NOTCH4 was observed between OC samples and normal controls. Low
expression of DLL4 and of NOTCH4 in OC patients was associated with
International Federation of Gynecology and Obstetrics (FIGO) stage (p
Ovarian cancer (OC) has the highest mortality of all gynecologic cancers [1]. The median age of patients diagnosed with OC is approximately 60 years, with most women diagnosed at advanced stages and with metastases [2]. OC is characterized by high levels of recurrence and metastasis, drug resistance, and mortality [3]. Despite advances in surgical techniques and the application of combination chemotherapy, the 5-year survival rate for patients with advanced OC is only 40–45% [4]. Although a great deal of research has been carried out on the pathogenesis of OC, little is known about its regulation and the underlying mechanisms. Molecular and genomic aberrations in OC data has accumulated thanks to the advent of large, multi-cohort genomic mapping libraries like The Cancer Genome Atlas (TCGA) [5, 6]. However, how the data relates to each other, OC disease state, body processes, and other factors has not been well chacterized. This characterization can provide clues as to mechanisms behind OC, which can lead to developing better treatments. Also, this work can lead to development of biomarkers for early detection of OC. The lack of good techniques for early detection contributes significantly to the low survival rate of OC.
The NOTCH signaling pathway is a highly conserved ligand-receptor signaling pathway involved in various aspects of cancer biology, including cancer stemness, angiogenesis, epithelial-mesenchymal transition (EMT), tumor immunity, and drug resistance [7, 8]. The most interesting members of the NOTCH pathway are the NOTCH receptors (NOTCH1, NOTCH2, NOTCH3, NOTCH4), the serrated typical NOTCH ligands Jagged 1 (JAG1) and Jagged 2 (JAG2), the Delta-like typical NOTCH ligands (DLL1, DLL3, DLL4), and the typical downstream genes known as hair and division enhancer 1 (HES1) and hair/division enhancer-associated YRPW patterned protein 1 (HEY1) [8, 9]. There is evidence that NOTCH signaling plays a pleiotropic role in cancer, with dysregulation leading to reduced proliferation and apoptosis of cancer cells [10, 11]. mRNA expression levels for the four types of NOTCH receptor (NOTCH1-4) have different prognostic significance in OC patients [12]. The NOTCH2/NOTCH3/DLL3/MAML1/ADAM17 signaling network has also been associated with OC [13]. Genes that are associated with NOTCH pathway genes can be identified by bioinformatic analysis. Overall, the mechanism and function of the NOTCH pathway in OC remains unclear, and its mechanism of action has still to be clarified.
Cancer results from the co-evolution of malignant cells and the tumor
microenvironment (TME) [14]. Bidirectional interactions between the TME and
cancer cells regulate its progression, development, metastasis, invasion, and
resistance to therapy [15]. Immune infiltration is a critical part of the TME and
plays a central role in OC progression [16, 17]. It is important to realize the
immune system plays a significant role in the development and progression of OC,
and that its dysregulation can result in immune escape and resistance to therapy
[18]. Studies of immune cells in the TME of OC have focused on T cells, DCs,
MDSCs, macrophages, NK cells,
In the present, study we conducted a comprehensive bioinformatics analysis of public datasets to investigate potential NOTCH-related mechanisms, genes, biological pathways, and their relation to immune function. This study looked toidentify valuable candidate biomarkers or targets for the treatment of OC.
Mutations in NOTCH pathway genes in OC were studied using the cBio Cancer Genomics Portal (http://cbioportal.org) [21, 22, 23]. We performed visualization and analysis queries based on references [23], with the studied proteins being DLL1 [ENSG00000198719], DLL3 [ENSG00000090932], DLL4 [ENSG00000128917], HES1 [ENSG00000114315], HEY1 [ENSG00000164683], JAG1 [ENSG00000101384], JAG2 [ENSG00000184916], NOTCH1 [ENSG00000148400], NOTCH2 [ENSG00000134250], NOTCH3 [ENSG00000074181], and NOTCH4 [ENSG00000204301].
R (version 3.6.3, statistical analysis and visualization, R Core Team, Vienna, Austria) and ggplot2 (version 3.3.3, for visualization, R Core Team, Vienna, Austria) were used [24]. Using the Toil process, UCSC XENA (https://xenabrowser.net/datapages/) RNAseq data was uniformly processed into TPM format for TCGA and GTEx [22, 24, 25, 26, 27, 28]. Data for OC was extracted from TCGA, while GTEx was used for the corresponding normal tissues [24]. RNAseq data were converted into TPM (transcripts per million reads) format by log2 transformation for the comparison of gene expression between samples [24].
Correlations between all pairs of genes in the NOTCH pathway were assessed using Pearson’s correlation coefficient [24]. R (version 3.6.3) and ggplot2 (version 3.3.3) were used for the analysis [24].
R (version 3.6.3) and Basic R package were used for this analysis [24]. The grouping condition was the median.
R (version 3.6.3), survminer package (version 0.4.9, for visualization, R Core Team, Vienna, Austria), and survival package (version 3.2-10, R Core Team, Vienna, Austria) were used for the statistical analysis of survival data [24]. The two subgroups studied were 0–50 and 50–100 [24]. Overall survival (OS) and progression-free interval (PFI) [24] were used for prognostic evaluation. Prognostic information for the controls was provided as supplemental data [20].
R (version 3.6.3) and survival package (version 3.2-10) were used for regression analysis [24]. Cox regression was used as the statistical method [29, 30]. PFI was used for the type of prognosis. Included variables were FIGO stage, primary therapy outcome, race, age, histologic grade, anatomic neoplasm subdivision, venous invasion, lymphatic invasion, tumor residual, tumor status, and 11 NOTCH pathway genes [23]. Prognostic information from the reference was provided as supplemental data [31].
R (version 3.6.3) and ggplot2 package (version 3.3.3) were used for Forest plots [24, 30].
R (version 3.6.3), pROC package (version 1.17.0.1, R Core Team, Vienna, Austria) and ggplot2 package [version 3.3.3] were used for analysis [24]. The clinical variables were tumor and normal [24].
R (version 3.6.3) and stat base package (version 3.6.3) were used for this analysis [24].
R (version 3.6.3), ggplot2 package (version 3.3.3) and clusterProfiler package (version 3.14.3, R Core Team, Vienna, Austria) were used [24].
R (version 3.6.3) and GSVA package (version 1.34.0, R Core Team, Vienna, Austria) were used for this analysis [24, 31]. The immune-infiltration algorithm used was ssGSEA (built-in algorithm in the GSVA package) [24]. The immune cell types studied here include aDC (activated DC), B cells, CD8 T cells, cytotoxic cells, DC, eosinophils, iDC (immature DC), macrophages, mast cells, neutrophils, NK CD56_bright cells, NK CD56_dim cells, NK cells, pDC (Plasmacytoid DC), T cells, T helper cells, Tcm (T central memory), Tem (T effector memory), Tfh (T follicular helper), Tgd (T gamma delta), Th1 cells, Th17 cells, Th2 cells, and Tregs [23, 32]. Markers for the 24 immune cell types were obtained from a previous reference [33].
The online tool cBioPortal was used to examine NOTCH pathway gene alterations in OC. As shown in Fig. 1, the frequency of genetic alterations in OC was: DLL1, 3%; DLL3, 10%; DLL4, 2.8%; HES1, 19%; HEY1, 5%; JAG1, 4%; JAG2, 5%; NOTCH1, 4%; NOTCH2, 8%, NOTCH3, 14%; and NOTCH4, 5%. As shown in Fig. 2, the frequency of genetic alterations in NOTCH pathway genes in OC patients from TCGA, Firehose Legacy were: mutation, 1.2%; amplification, 52.05%; deep deletion, 6.85%; and multiple alterations, 1.71%. For TCGA, Pan-Cancer Atlas: mutation, 3.25%; structural variant, 0.34%; amplification, 37.84%; deep deletion, 5.48%; and multiple alterations 2.91%. For TCGA, Nature 2011: mutation, 1.23%; amplification, 33.74%; deep deletion, 3.68%; and multiple alterations, 1.43%. In general, amplifications accounted for most of the genetic alterations detected in OC.
 Fig. 1.
Genetic alterations of NOTCH pathway genes in ovarian cancer (OC) as observed using cBioPortal (RNA Seq V2 RSEM).
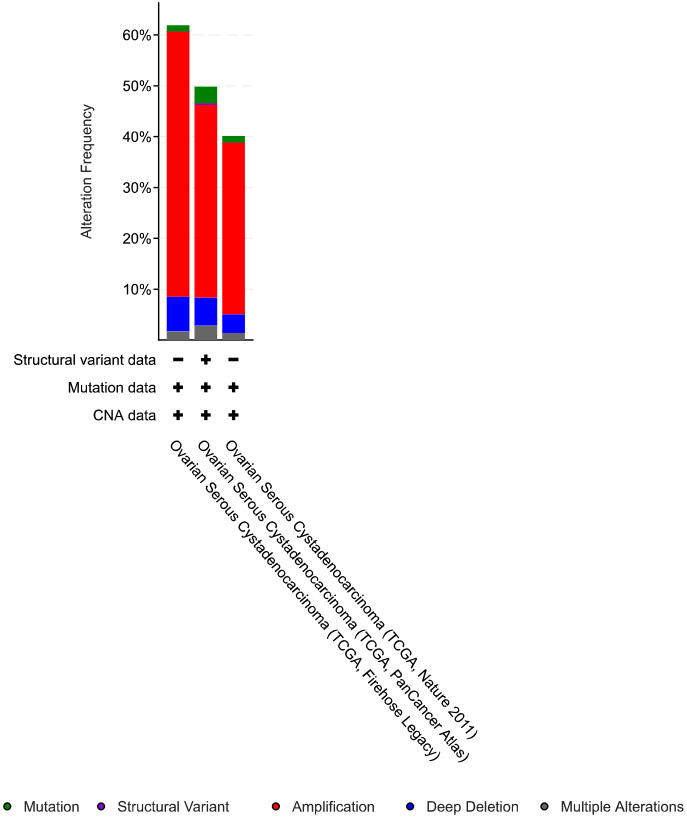 Fig. 2.
The distribution of genetic alterations in NOTCH pathway genes in OC cases based on the cancer type summary in cBioPortal.
A total of 427 OC tumors and 88 samples of normal ovarian tissue were used to
assess NOTCH pathway gene expression (Fig. 3). The expression levels of
DLL1, DLL4, HEY1, JAG1 and NOTCH4
were all significantly lower in OC samples than in normal ovarian tissues (1.064
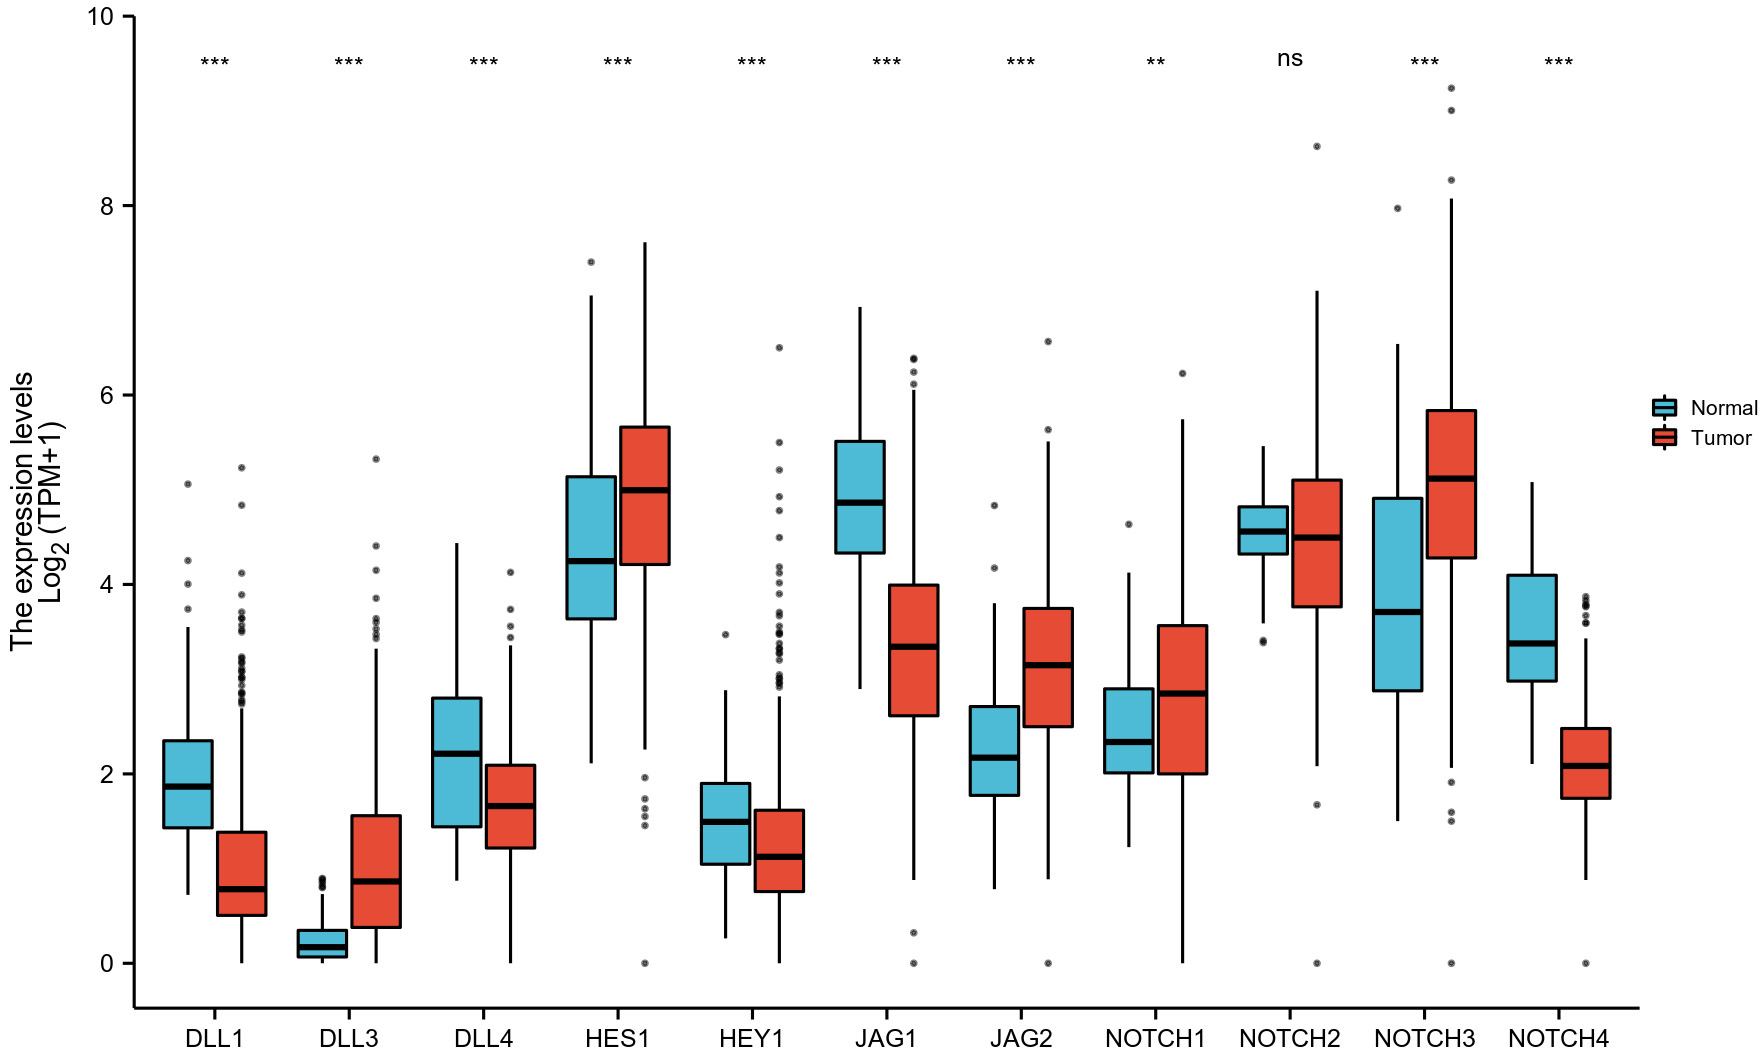 Fig. 3.
TCGA mRNA levels for the NOTCH pathway genes in OC
tissue and in unpaired normal ovarian tissue. ns, not significant (p
Pearson correlation analysis was used to test for relationships between genes involved in the NOTCH pathway. A significant negative correlation was found between the expression of DLL3 and NOTCH2, while the expression levels of most other NOTCH pathway genes showed a significant positive correlation with each other (Fig. 4).
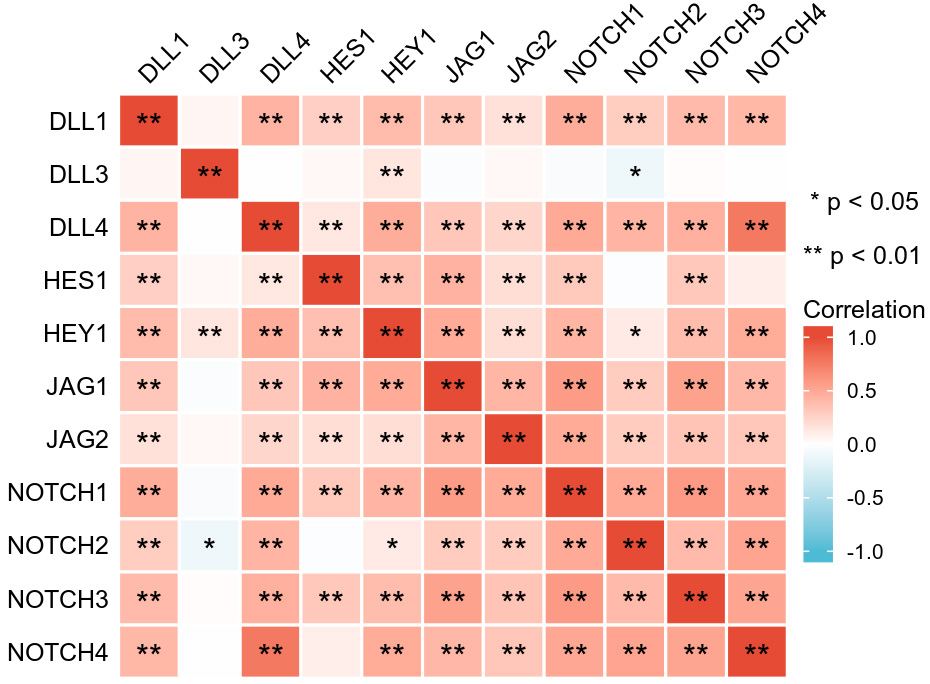 Fig. 4.
Correlations between the expression level of genes in the NOTCH pathway.
The clinical characteristics and gene expression data for 379 OC tumor samples
were downloaded from the TCGA database (Supplementary Table 1). DLL4 and
NOTCH4 expression were associated with FIGO stage (p
The expression level of 11 NOTCH pathway genes (DLL1, DLL3, DLL4, HES1, HEY1, JAG1, JAG2, NOTCH1, NOTCH2, NOTCH3, and NOTCH4) showed no significant correlation with the overall survival of OC patients (Fig. 5). The expression of JAG2 (p = 0.011) and NOTCH1 (p = 0.039) were found to be significantly associated with the PFI of OC patients, whereas the remaining 9 genes (DLL1, DLL3, DLL4, HES1, HEY1, JAG1, NOTCH2, NOTCH3 and NOTCH4) showed no significant correlation with the PFI (Fig. 6). Higher expression of JAG2 and NOTCH1 were correlated with significantly better PFI.
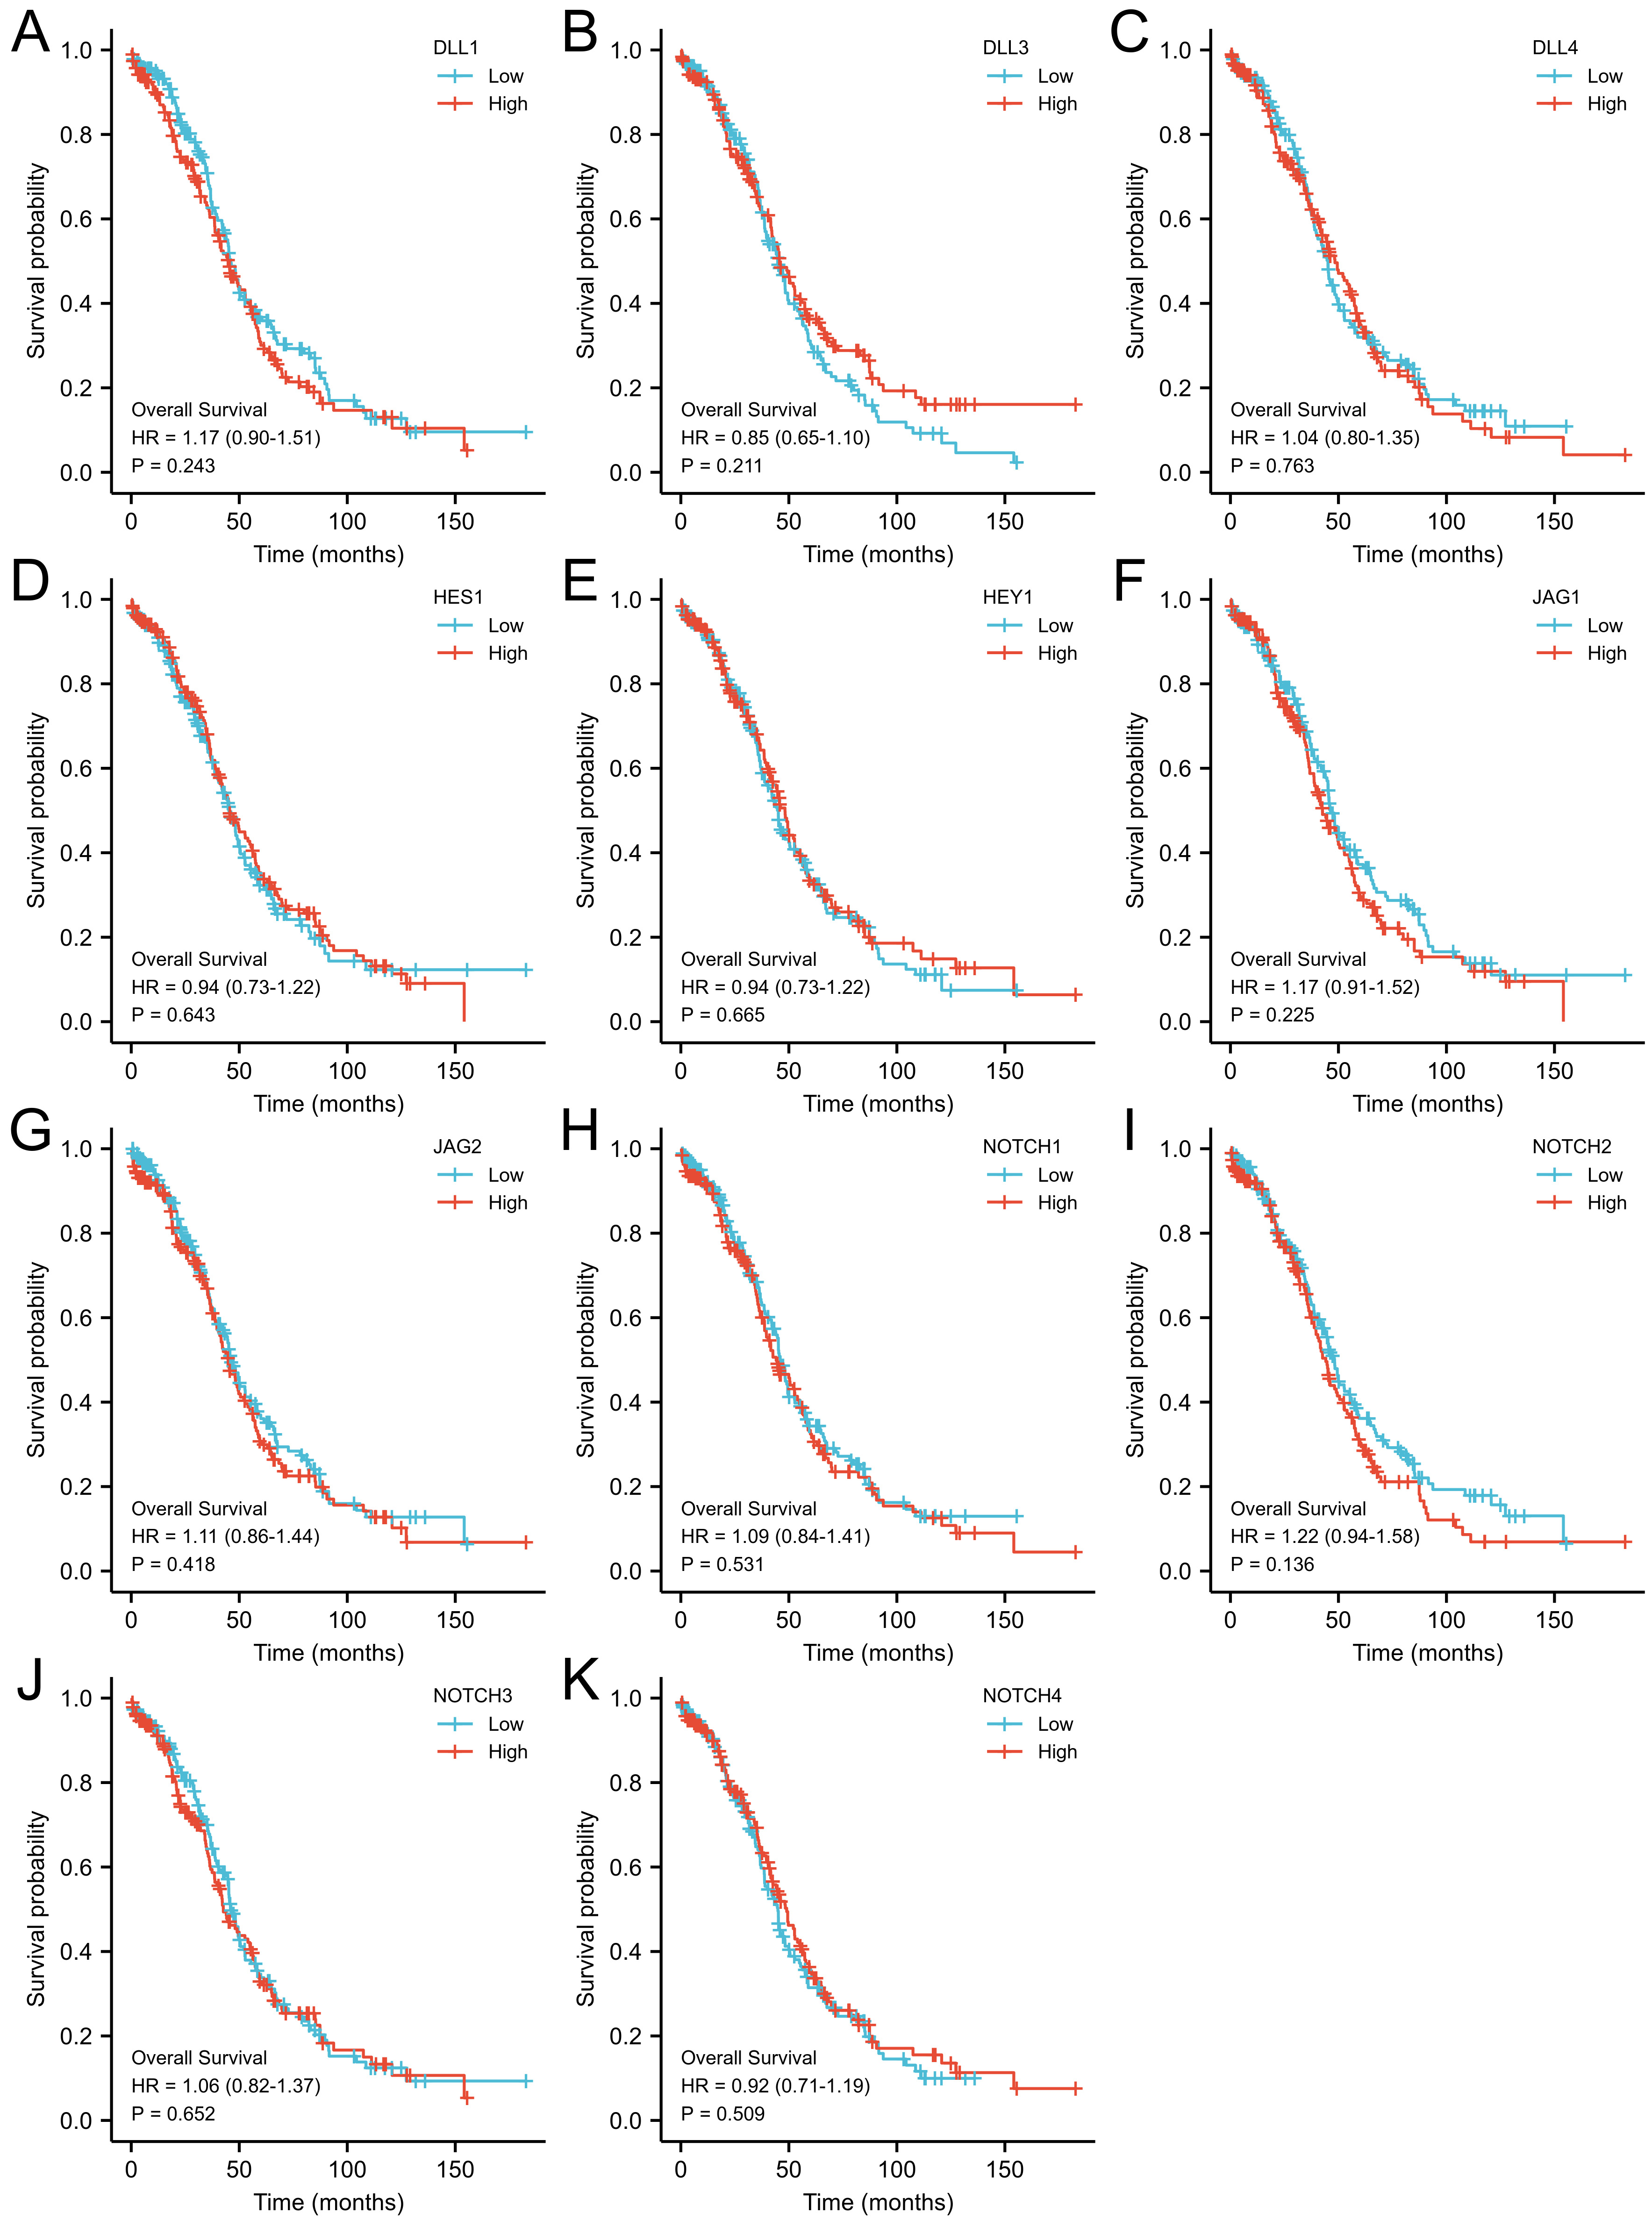 Fig. 5.
Overall survival (OS) analysis for NOTCH pathway gene expression in OC patients using Kaplan Meir plot web tool. (A) DLL1, (B) DLL3, (C) DLL4, (D) HES1, (E) HEY1, (F) JAG1, (G) JAG2, (H) NOTCH1, (I) NOTCH2, (J) NOTCH3, and (K) NOTCH4.
 Fig. 6.
Progression-free interval (PFI) analysis for NOTCH pathway gene expression in OC patients using Kaplan Meir plot web tool. (A) DLL1, (B) DLL3, (C) DLL4, (D) HES1, (E) HEY1, (F) JAG1, (G) JAG2, (H) NOTCH1, (I) NOTCH2, (J) NOTCH3, and (K) NOTCH4.
Univariate Cox regression analysis (Fig. 7A) revealed that primary therapy
outcome (HR: 0.401; 95% CI: 0.304–0.528, p
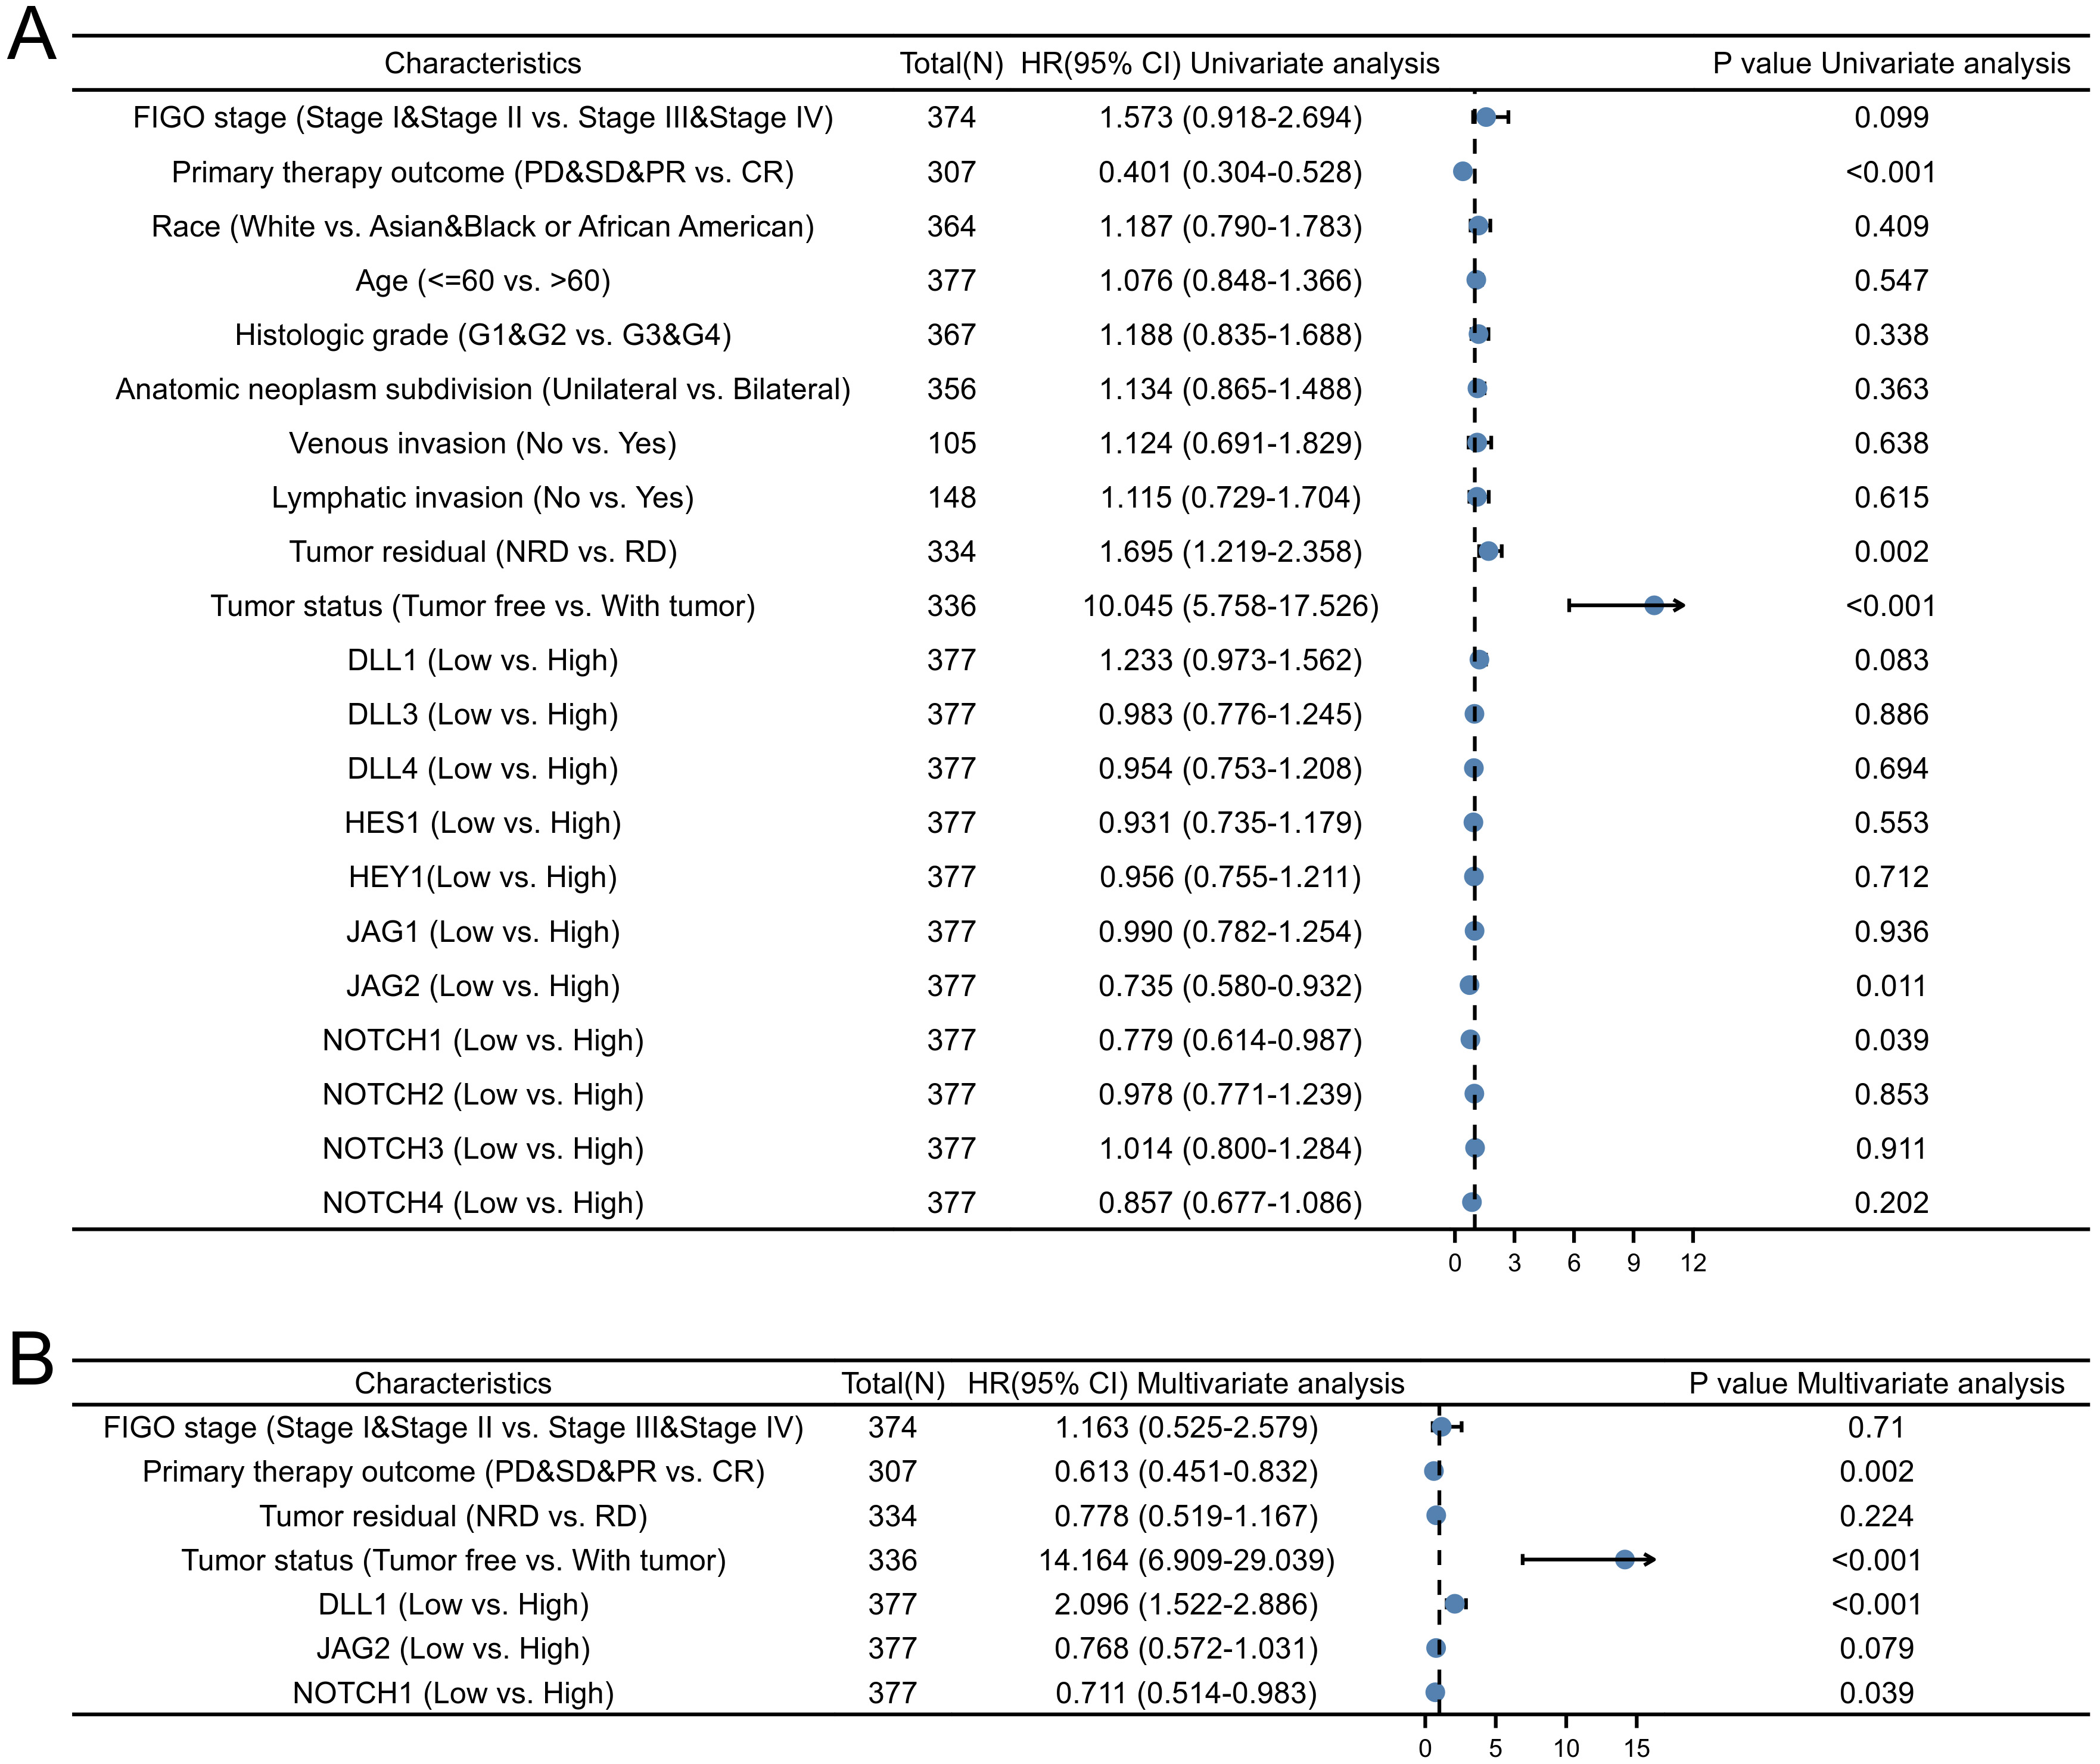 Fig. 7.
Forest plots showing the results of Cox regression analysis for NOTCH pathway genes and other clinical features as predictors of progression free interval (PFI) in OC patients. (A) Univariate regression analysis. (B) Multivariate regression analysis.
As shown in Fig. 8, the expression of several NOTCH pathway genes showed some tendency for differentiating normal and OC tumor tissues (DLL1: AUC = 0.823, CI = 0.785–0.861; DLL3: AUC = 0.839, CI = 0.801–0.876; JAG1: AUC = 0.883, CI = 0.849–0.916; JAG2: AUC = 0.769, CI = 0.718–0.820; NOTCH3: AUC = 0.739, CI = 0.679–0.799). Other genes showed low tendency (DLL4: AUC = 0.668, CI = 0.599–0.737; HES1: AUC = 0.642, CI = 0.576–0.709; HEY1: AUC = 0.621, CI = 0.560–0.683; NOTCH1: AUC = 0.603, CI = 0.549–0.657; NOTCH2: AUC = 0.532, CI = 0.482–0.583), while high accuracy was shown by NOTCH4 (AUC = 0.948, CI = 0.928–0.968).
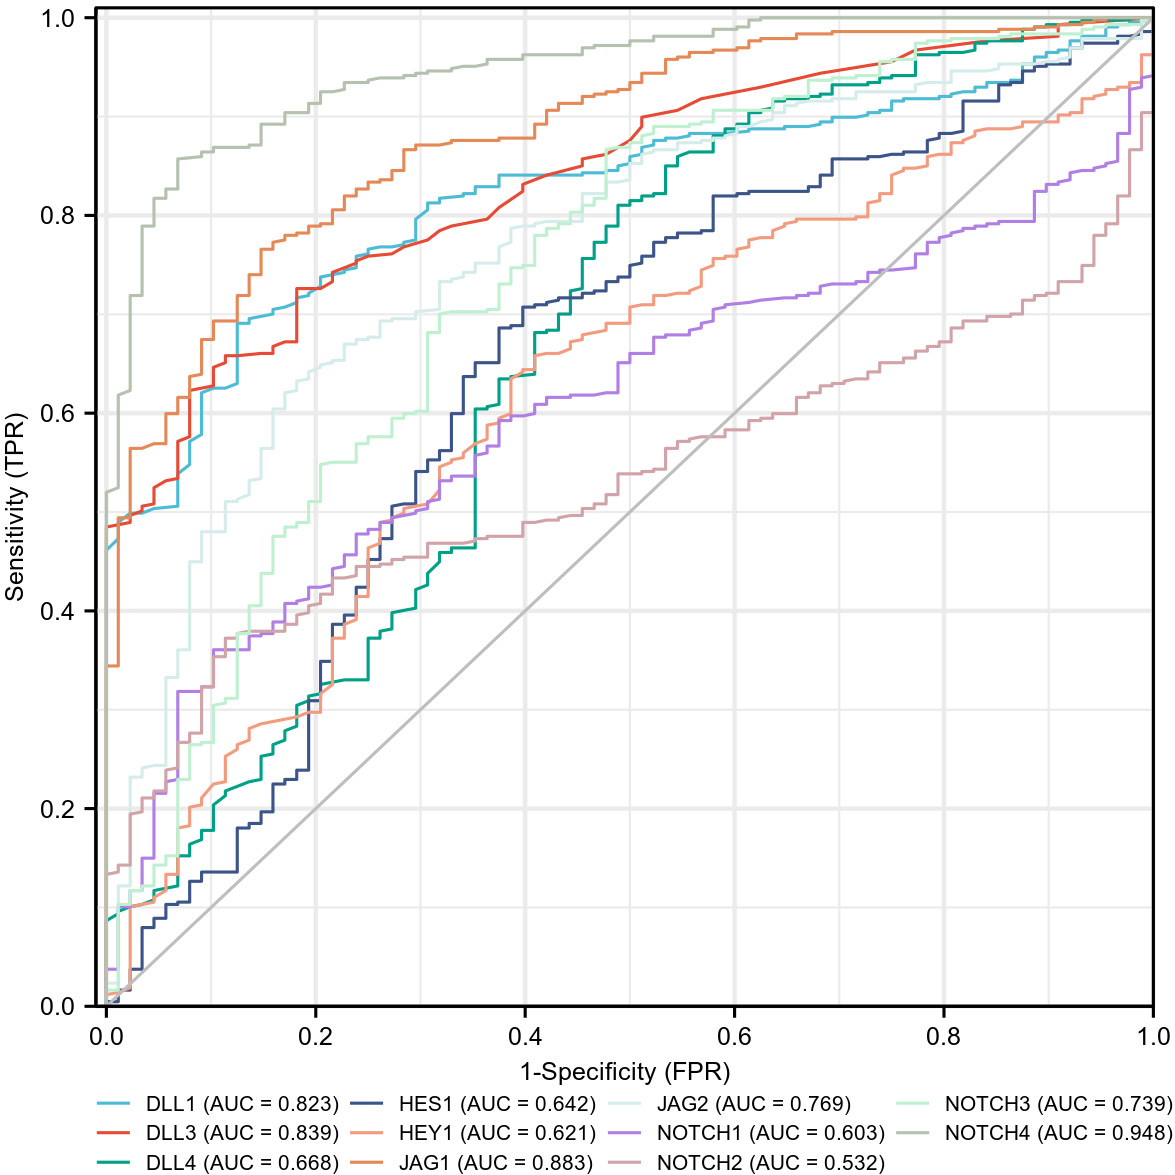 Fig. 8.
ROC curves for NOTCH pathway genes in OC and normal ovarian tissues. The area under the curve (AUC) ranged from 0.5 to 1. When the AUC is closer to 1, diagnosis is more accurate for the differentiation of OC. An AUC between 0.5 and 0.7 has low accuracy, an AUC between 0.7 and 0.9 has some accuracy, while an AUC above 0.9 has high accuracy.
The top five negatively associated genes with each NOTCH pathway gene are shown in Fig. 9, together with the top 5 positively associated genes. The genes most positively associated with DLL1 were ADAMTS7, DENND2A, ZNF697, RHOBTB3 and DCHS1, while those most negatively associated with this gene were RTP4, EVA1C, EIF4EBP3, PDZK1IP1, and PLAAT4. The genes most positively associated with DLL3 were SELENOV, TIMM50, ECH1, RYR1 and MRPS12, while those most negatively associated were VNN1, MVP, KCTD12, SERPINB1, and TMEM87A. The genes most positively associated with DLL4 were NOTCH4, CDH5, VWF, PCDH12 and ROBO4, while those most negatively associated were RPL39, HIGD2A, ATP5MD, RPL36A, and RPS27. The genes most positively associated with HES1 were SMOX, DACT2, JAG1, ITM2C, and PDE9A, while those most negatively associated were HPSE, LTC4S, NPR1, CYP4B1, and EVA1C. The genes most positively associated with HEY1 were PGF, PEAR1, TSPAN11, HSPA12B, and SIX2, while those most negatively associated were KLK7, PDZK1IP1, C19orf33, FOLR1, and MSLN. The genes most positively associated with JAG1 were NOTCH1, BTBD3, NOTCH3, ATRN, and CDS2, while those most negatively associated were COX5B, ATP5MC2, LAMTOR4, RPL32, NDUFA1. The genes most positively associated with JAG2 were CEP170B, BRF1, AKT1, PACS2, and PLCB3, while those most negatively associated were OST4, COPS9, BLOC1S1, COX7C, and PFDN5. The genes most positively associated with NOTCH1 were SEC16A, CAMSAP1, PLXNA1, RXRA and PRRC2B, while those most negatively associated were ATP5MF, UQCRQ, NDUFA1, FAU and COX5B. The genes most positively associated with NOTCH2 were CTDSP2, HIPK1, GIT2, ATXN1L and BAZ2A, while those most negatively associated were RNF181, ATP5MD, COX5B, ATP5F1E and RPS21. The genes most positively associated with NOTCH3 were BRD4, WIZ, MYO9B, TET3 and CEP250, while those most negatively associated were VAMP8, UQCR11, PLAAT4, COX7B, and NDUFA1. The genes most positively associated with NOTCH4 were CDH5, ROBO4, PCDH12, DIPK2B, and DLL4, while those most negatively associated were RPL12, RPL36A, RPL31, RPS21 and RPS27.
 Fig. 9.
Heatmap showing the top 10 genes that were correlated with NOTCH pathway genes. (A) DLL1, (B) DLL3, (C) DLL4, (D) HES1, (E) HEY1, (F) JAG1, (G) JAG2, (H) NOTCH1, (I) NOTCH2, (J) NOTCH3, and (K) NOTCH4.
GO and KEGG enrichment analyses were conducted on the NOTCH pathway and related genes (102 genes in total) (Supplementary Table 2). As shown in Fig. 10 and Supplementary Table 3, the top five biological processes identified were the regulation of NOTCH signaling pathway, NOTCH signaling pathway, negative regulation of NOTCH signaling pathway, NOTCH signaling involved in heart development, and positive regulation of NOTCH signaling pathway. The top five cytological components were the mitochondrial inner membrane, polysomal ribosome, cytosolic ribosome, mitochondrial proton-transporting ATP synthase complex, and cytosolic part. The top five molecular functions were NOTCH binding, structural constituent of ribosome, electron transfer activity, cytochrome-c oxidase activity, and heme-copper terminal oxidase activity. As shown in Fig. 11 and Supplementary Table 3, the top five pathways identified were the NOTCH signaling pathway, breast cancer, endocrine resistance, Th1 and Th2 cell differentiation, and oxidative phosphorylation.
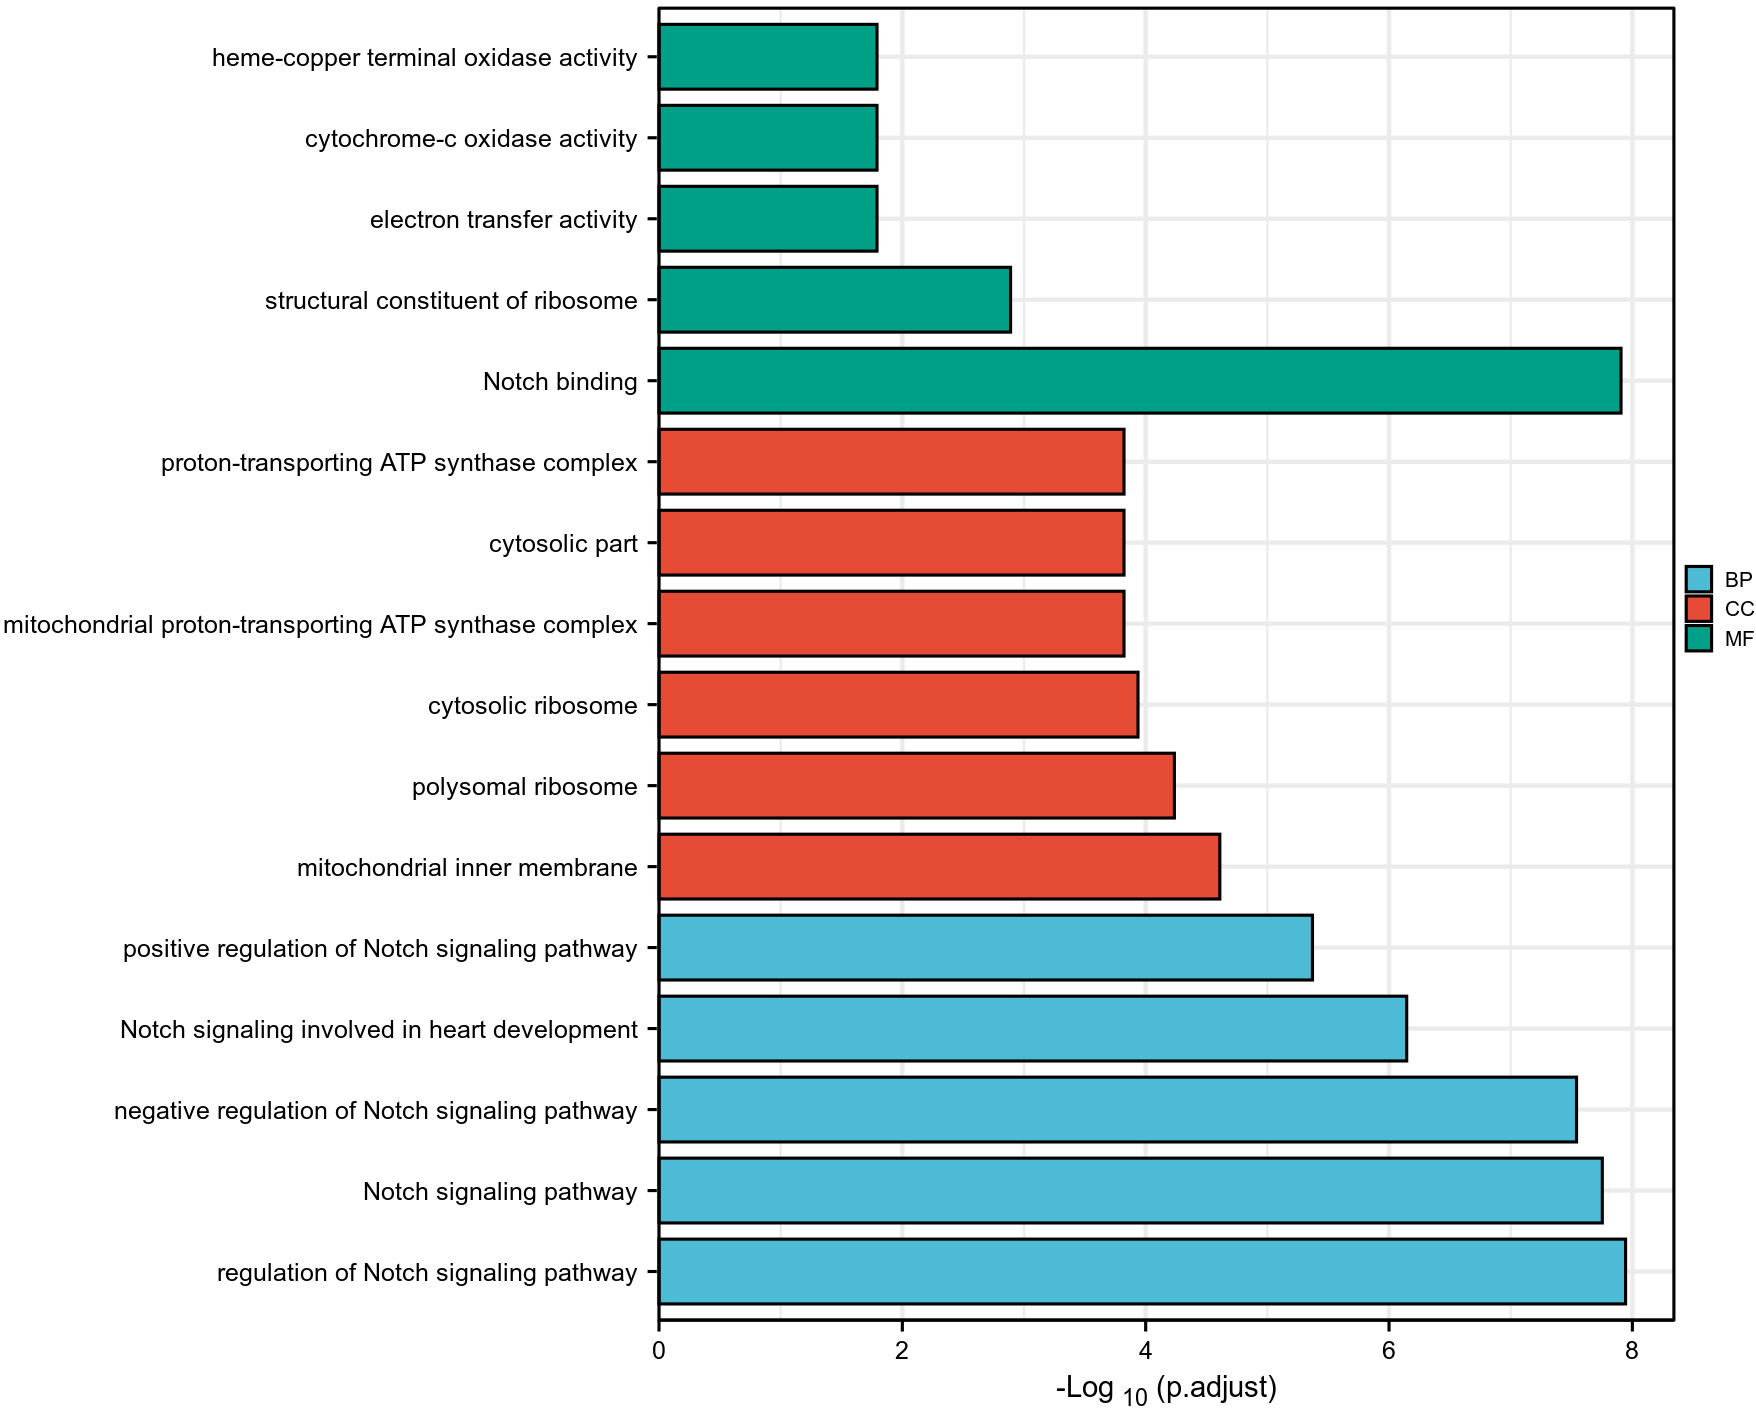 Fig. 10.
GO analysis of genes involved in the NOTCH pathway.
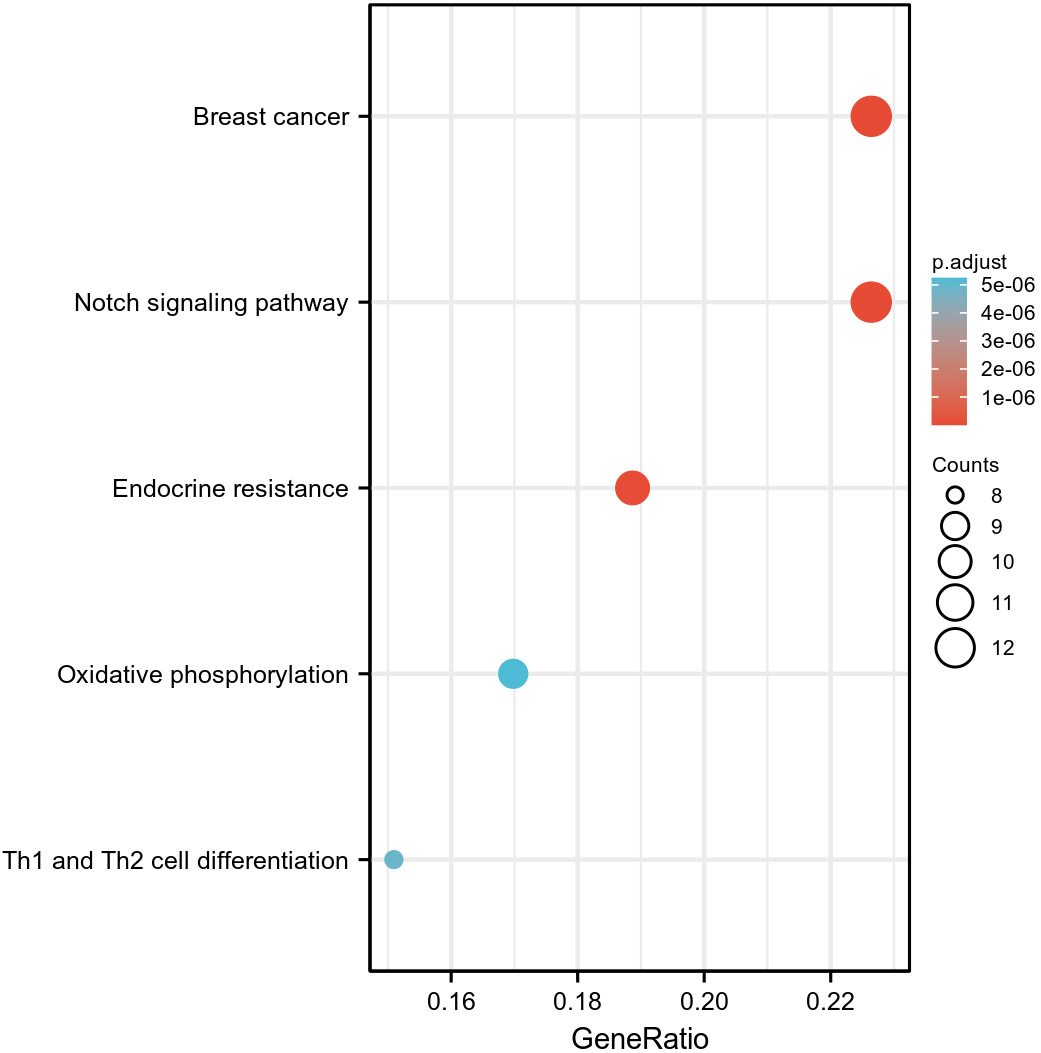 Fig. 11.
KEGG analysis of genes associated with NOTCH pathway genes.
As shown in Fig. 12, NOTCH pathway gene expression was correlated with tumor-infiltrating immune cells (TIIC) in OC. DLL1 gene expression correlated positively with eosinophils, iDC, macrophages, mast cells, NK cells, Tcm, Tem, TFH and Tgd, and negatively with aDC, cytotoxic cells, T cells, Th1 cells, and Th17 cells. DLL3 expression correlated positively with Th2 cells, and negatively with CD8 T cells, cytotoxic cells, DC, iDC, macrophages, neutrophils, NK CD56bright cells, NK CD56dim cells, pDC, T cells, Tcm, Tem, Th1 cells and Th17 cells. DLL4 expression correlated positively with eosinophils, iDC, macrophages, mast cells, neutrophils, NK cells, pDC, T helper cells, Tcm, Tem, TFH and Tgd, and negatively with cytotoxic cells. HES1 expression correlated positively with eosinophils, NK cells and Th2 cells, and negatively with aDC, B cells, cytotoxic cells, DC, neutrophils, T cells, Tem, Th1 cells, Th17 cells and Tregs. HEY1 expression correlated positively with eosinophils, iDC, macrophages, mast cells, neutrophils, NK cells, T helper cells, Tem, TFH, Tgd and Th2 cells, and negatively with cytotoxic cells, NK CD56bright cells and Th17 cells. JAG1 expression correlated positively with eosinophils, iDC, NK cells, T helper cells, Tcm, Tem, TFH and Th2 cells, and negatively with cytotoxic cells. JAG2 expression correlated positively with eosinophils, NK cells, T helper cells, Tcm and Tem. NOTCH1 expression correlated positively with DC, eosinophils, iDC, macrophages, mast cells, neutrophils, NK CD56dim cells, NK cells, T helper cells, Tcm, Tem, TFH and Th2 cells, and negatively with cytotoxic cells. NOTCH2 expression correlated positively with DC, eosinophils, iDC, macrophages, mast cells, neutrophils, NK cells, T helper cells, Tcm, Tem, TFH, Tgd and Th17 cells. NOTCH3 expression correlated positively with eosinophils, NK cells, Tcm and Tem, and negatively with aDC, CD8 T cells, cytotoxic cells, pDC, T cells, Th1 cells, Th17 cells, and T regs. NOTCH4 gene expression correlated positively with eosinophils, iDC, macrophages, mast cells, neutrophils, NK cells, pDC, T helper cells, Tcm, Tem, TFH and Tgd.
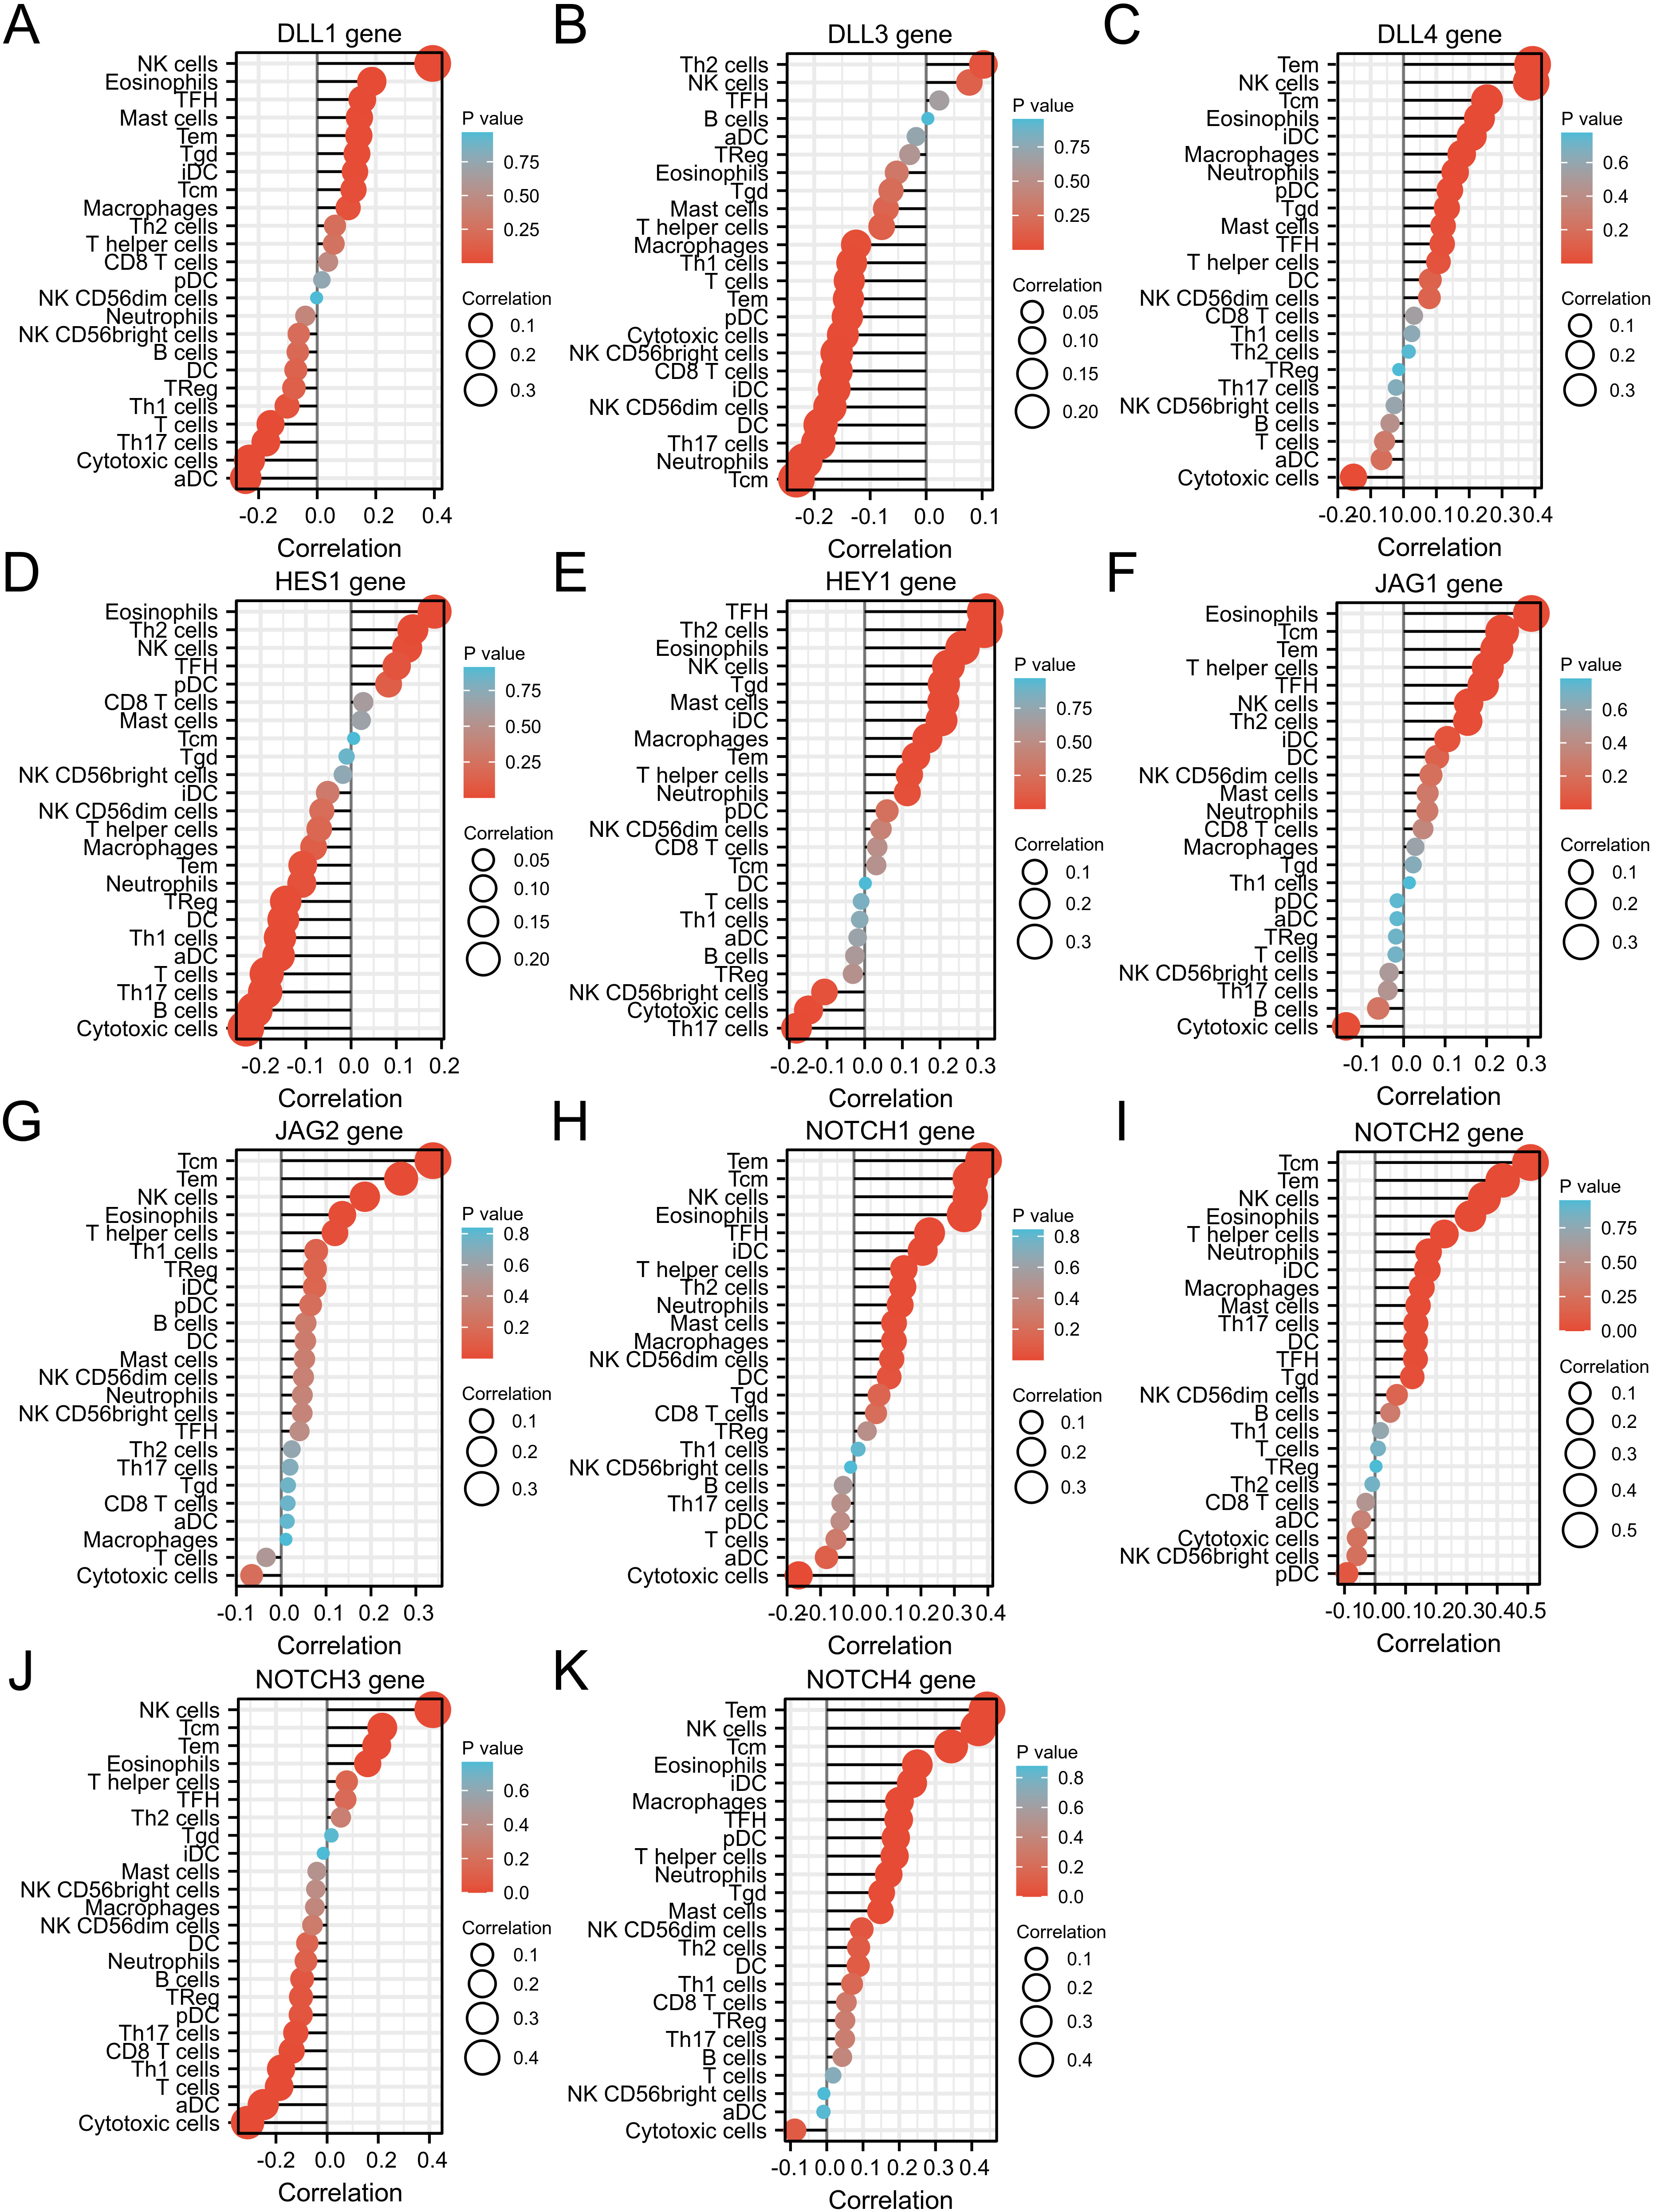 Fig. 12.
Analysis of the correlation between expression of each NOTCH family gene and 24 types of TIICs in OC. (A) DLL1, (B) DLL3, (C) DLL4, (D) HES1, (E) HEY1, (F) JAG1, (G) JAG2, (H) NOTCH1, (I) NOTCH2, (J) NOTCH3, and (K) NOTCH4. Results are shown in the form of lollipop plots. The darker the color, the smaller the p-value and hence greater statistical significance. Correlations are represented by bubble sizes, with larger bubbles indicating stronger correlation.
OC patients with NOTCH3 alterations, including upregulation, experience
poor survival, while the targeting of NOTCH3 inhibits cell growth and
induces apoptosis [34]. Associations have been reported between the expression of
OCT4, NOTCH1 and DLL4 with OC differentiation, lymph node metastasis,
clinical stage, and prognosis [35]. High expression of NOTCH2 and
NOTCH3 mRNA in OC patients has been significantly associated with PFS,
while high expression of NOTCH4 mRNA has been significantly associated
with OS [12]. Five genes (NOTCH2, NOTCH3, DLL1,
DLL3, and DLL4) have also been associated with poorer survival
in OC [35]. In the present study, significant differential expression between OC
samples and controls was observed for the NOTCH pathway genes
DLL1, DLL3, DLL4, HES1, HEY1,
JAG1, NOTCH2, NOTCH3, and NOTCH4. DLL4
expression was associated with FIGO stage (p
Estrogen promotes the differentiation of ovarian multi-ciliated cells (MCC) by
reducing DLL1 expression via the estrogen receptor
The tumor infiltration of immune cells and the immune evasion by cancer cells play key roles in tumor progression [9]. JAG2+ TANs are closely associated with the IL-8-driven immune evasion microenvironment, thus providing a potential therapeutic target for enhancing the immunity against OC [44]. Glycolytic targeting of microRNA and EZH2 in OC has been reported to lead to effector T cell dysfunction [45]. In the present study, expression of the DLL1, HES1 and NOTCH3 genes was negatively associated with T cell infiltration, whereas expression of the DLL4, HEY1, JAG1, JAG2, NOTCH1, NOTCH2 and NOTCH4 genes was positively associated with T cells. In contrast, DLL3 expression was positively correlated with Th2 cells and negatively correlated with other types of T cells. The use of adaptive T cells, such as chimeric antigen receptor T cell therapy, may therefore be a promising new paradigm for the treatment of OC. A better understanding of NOTCH signaling could improve therapeutic approaches.
In summary, we evaluated the expression levels, mutations, and immune correlations of the NOTCH pathway in OC in order to identify potential biomarkers and targets. In addition to improving clinical decision making, the results contribute to a deeper understanding of the complex involvement of the NOTCH pathway in OC. Future studies should investigate the role of NOTCH signaling in OC in vitro and in vivo, as none were performed in the present study.
Activation of NOTCH plays an important role in mediating the development and progression of OC through multiple pathways, including the regulation of immune cells, endocrine resistance, Th1 and Th2 cell differentiation, and oxidative phosphorylation. Downregulation of JAG2 and NOTCH1 expression were associated with significantly worse PFI in OC patients. JAG2 and NOTCH1 may be potentially useful biomarkers for the treatment of OC, or as therapeutic targets.
The datasets for this study can be found in TCGA-OC (https://portal.gdc.cancer.gov/). All data generated or analyzed during this study are included in this article.
BC, LJ, and XYL designed the research study. KJ, HW, and LM analyzed the data. XML and QC collected the data. All authors contributed to editorial changes in the manuscript. All authors read and approved the final manuscript. All authors have participated sufficiently in the work and agreed to be accountable for all aspects of the work.
Not applicable.
Not applicable.
This research received no external funding.
The authors declare no conflict of interest.
Publisher’s Note: IMR Press stays neutral with regard to jurisdictional claims in published maps and institutional affiliations.