


1 Teaching and Research Section of Clinical Nursing, Xiangya Hospital, Central South University, 410008 Changsha, Hunan, China
2 National Clinical Research Center for Geriatric Disorders, Xiangya Hospital, Central South University, 410008 Changsha, Hunan, China
3 Department of Neurology, Xiangya Hospital, Central South University, 410008 Changsha, Hunan, China
4 Department of Neurosurgery, Xiangya Hospital, Central South University, 410008 Changsha, Hunan, China
Abstract
Background: Malignant peripheral nerve sheath tumors (MPNSTs) are an aggressive form of sarcomas with a poor prognosis and limited treatment options. Therefore, new therapeutic targets are urgently needed to identify novel drugs. Methods: Based on the Gene Expression Omnibus database, an integrated analysis was performed to identify differentially expressed genes (DEGs) in MPNSTs compared to neurofibromas (NFs). Then functional enrichment analyses, protein-protein interaction (PPI) network construction, and hub gene selection were conducted. We explored DEG-guided repurposable drugs to treat MPNST based on the Library of Integrated Network-Based Cellular Signatures (LINCS) database. Furthermore, the binding affinity between predicted drug candidates and the MPNST-associated hub gene was calculated using molecular docking. Results: We identified 89 DEGs in common with all three MPNSTs datasets. In the PPI networks, twist family bHLH transcription factor 1 (Twist1) with higher node degrees was further evaluated as a therapeutic target. Cytochalasin-d, cabozantinib, everolimus, refametinib, and BGT-226 were extracted from the LINCS database, which showed lower normalized connectivity scores (–1.88, –1.81, –1.78, –1.76, and –1.72, respectively) and was considered as drug candidates. In addition, the results of molecular docking between the five drugs and Twist1 showed a binding affinity of –6.61, –7.03, –7.73, –3.94, and –7.07 kcal/mol, respectively. Conclusions: Overall, our results describe the importance of Twist1 in MPNST pathogenesis. Everolimus was also found to be a potential therapeutic drug for MPNSTs.
Keywords
- malignant peripheral nerve sheath tumors
- twist family bHLH transcription factor 1
- molecular docking
- everolimus
Malignant peripheral nerve sheath tumors (MPNSTs) are highly invasive cancers that account for approximately 10% of all soft tissue sarcoma; 50% of such tumors are associated with neurofibromatosis type 1 (NF1). These sarcomas generally have poor clinical outcomes, and are the leading cause of mortality and morbidity in adults with NF1. Complete surgical resection is still the main treatment method for MPNSTs due to the limited effectiveness of both chemotherapy and radiotherapy. However, a full resection may not be possible due to tumor size and location in many patients [1, 2].
Several amplified genes that are important for the pathogenesis of MPNST have
been identified. For example, the expression of epidermal growth factor receptor
(EGFR) and erbB2 is stronger in MPNSTs than in neurofibromas (NFs). Holtkamp
et al. [3] valuated the effects of erlotinib and trastuzumab drugs
targeting EGFR and erbB2 in MPNST cell lines, and EGFR and erbB2 have emerged as
potential targets for the treatment of patients with MPNSTs. The progressive
amplification of MET was found in the case of MPNST. NF1 ablated mice exhibit a
strong MPNST phenotype without additional mutations, which are consistently
sensitive to the highly selective MET inhibitor capmatinib [4]. Frequent
platelet-derived growth factor receptor alpha (PDGFR
In this study, we screened druggable targets via integrated bioinformatics analysis and predicted therapeutic drugs for MPNSTs using the Library of Integrated Network-Based Cellular Signatures (LINCS) database, which identifies the connection between gene expression profiles and FDA-approved drugs. Furthermore, molecular docking was used in the search for matching predicted potential drugs and screened targets. Our finding expands the current understanding of MPNST progression and identifies potential therapeutic drugs for NF1-related MPNSTs.
The gene expression profiles of the microarray datasets GSE41747, GSE66743, and
GSE141439 were obtained for analysis from the Gene Expression Ominbus (GEO)
database at the National Center for Biotechnology Information
(http://www.ncbi.nlm.nih.gov/geo/). Bioinformatics analyses of the data from
online databases were carried out by R 4.1.1 software (R Foundation for
Statistical Computing, Vienna, Austria). We performed differential expression
analysis using the limma package
(https://bioconductor.org/packages/release/bioc/html/limma.html) to determine
differentially expressed genes (DEGs) with the criteria of
Search Tool for the Retrieval of Interacting Genes (STRING, https://string-db.org/) is an online tool for evaluating the information on protein-protein interaction (PPI) [8]. We use the STRING to find possible relations among the DEGs. The Gene Ontology (GO) and Kyoto Encyclopedia of Genes and Genomes (KEGG) pathway enrichment analyses of the DEGs were conducted with the online database SangerBox website.
PPI network and module analyses were visualized using Cytoscape version 3.7.2
(Institute for Systems Biology, Seattle, WA, USA), and subsequent hub gene
identification of the modules was performed [9]. First, the Cytoscape Molecular
Complex Detection (MCODE) plug-in was used to identify the most important modules
in the PPI networks. The criteria for selection were set as follows: MCODE score
We used the Kaplan-Meier method and Cox proportional hazards (CoxPH) regression
model to explore the overall survival (OS) of patients with high and low Twist
family bHLH transcription factor 1 (Twist1) expression in 39 cancer
types. Hazard ratios (HRs) with 95% confidence intervals (CIs) and log-rank p
values were reported. p
The c-BioPortal for Cancer Genomics (http://cbioportal.org) is a publicly available database for exploring multidimensional cancer genomics datasets [12]. The genetic alteration of Twist1 in different cancers was analyzed by the c-BioPortal database [13].
We use The Connectivity Map, which is designed to identify biological pathways and expression modules by querying the gene lists of up- and down-regulated genes to rank small molecules, drugs and genes. A so-called connectivity score was used to evaluate the correlation between the drugs and input genes; a positive score indicates an inducement effect of the compound on the gene signatures, while a negative score reflects an inverse impact of a compound on the gene signatures. The L1000 database of the LINCS project includes 476,251 gene expression signatures gathered from 72 cell lines stimulated by 27,927 small molecule compounds. We identified the potential compounds based on the connectivity score (–2 to 2).
The 3D structure files of the compounds were downloaded from PubChem (https://pubchem.ncbi.nlm.nih.gov/). The crystal structures of target proteins were retrieved from the RCSB Protein Data Bank (PDB) (https://www.rcsb.org/). AutoDockTools 1.5.7 software (Molecular Graphics Laborary, The Scripps Research Institute, La Jolla, CA, USA) was used to prepare the required files, converting ligands and receptors structures from PDB file format to Pdbqt format. All water molecules were detached for predocking preparation, and then Kolmman charges and polar hydrogen atoms were added to the compounds using AutodockTools. Molecular docking calculations were performed by AutoDockTools. The docking results were expressed as binding affinity values of the obtained receptor/ligand complex (kcal/mol) according to hydrogen bonds, electrostatic, and hydrophobic interactions. PyMOL 2.6.0 software (PyMOL Molecular Graphics System, Schrödinger, LLC, Shanghai, China) was used to visualize the 3D structures of the protein and major receptor/ligand interaction in terms of hydrogen bonds binding to the key amino acid residues.
The primary statistical analyses were performed in R 4.1.1 software. The
normality test was performed with the Shapiro-Wilk test. The Kaplan-Meier curve
was drawn to compare time to event distribution, and Univariate Cox regression
analysis was used to evaluate the correlations between the DEGs and OS. All
hypothetical tests were two-sided, and p
Microarray datasets (GSE41747, GSE66743, and GSE141439) were retrieved from the GEO database to identify the DEGs between MPNST and NF samples (Fig. 1). There was a total of 80 samples, including 43 MPNST and 37 NF (GSE41747: 6MPNST/26NF; GSE66743:30MPNST/8NF; GSE141439: 7MPNST/3NF). Finally, 1037 DEGs with upregulation and 1694 DEGs with downregulation were identified in the GSE41747 dataset (Fig. 1A). 1080 DEGs with upregulation and 1371 DEGs with downregulation were identified in the GSE66743 dataset (Fig. 1B). Additionally, 1032 DEGs with upregulation and 1648 DEGs with downregulation were identified in the GSE141439 dataset (Fig. 1C). We identified 89 common DEGs among the three GEO datasets, including 34 upregulated genes and 55 downregulated genes (Fig. 1D–F).
 Fig. 1.
Identification of overlapping DEGs. (A–C) Differential expression of genes between MPNST tissues and neurofibroma tissues in the microarray datasets (GSE41747, GSE66743, and GSE141439). (D) Venn diagram showing DEGs across the three datasets, with an overlap of 34 upregulated gene. (E) Venn diagram showing DEGs across the three datasets, with an overlap of 55 downregulated genes. (F) The heat map of overlap upregulated and downregulated genes. The columns and rows in the heat map represent GEO datasets and genes. MPNST, malignant peripheral nerve sheath tumors; DEGs, differentially expressed genes; GEO, Gene Expression Ominbus.
The GO enrichment analysis showed that biological process (BP) terms were related to the cellular process, single-organism process, metabolic process, and biological regulation. GO_cellular component (GO_CC) analysis showed enrichment in macromolecular complexes, membranes, and membrane-enclosed lumen. GO_molecular function (GO_MF) analysis showed enrichment in catalytic activity, DNA binding transcription factor activity, and structural molecular activity (Fig. 2A). The KEGG pathways were significantly enriched in antifolate resistance, proteoglycans in cancer, viral carcinogenesis, and the hypoxia inducible factor 1 (HIF-1) signaling pathway, which involved in multipe mechanism of tumorgenesis and related to occurrence and development of MPNSTs (Fig. 2B,C).
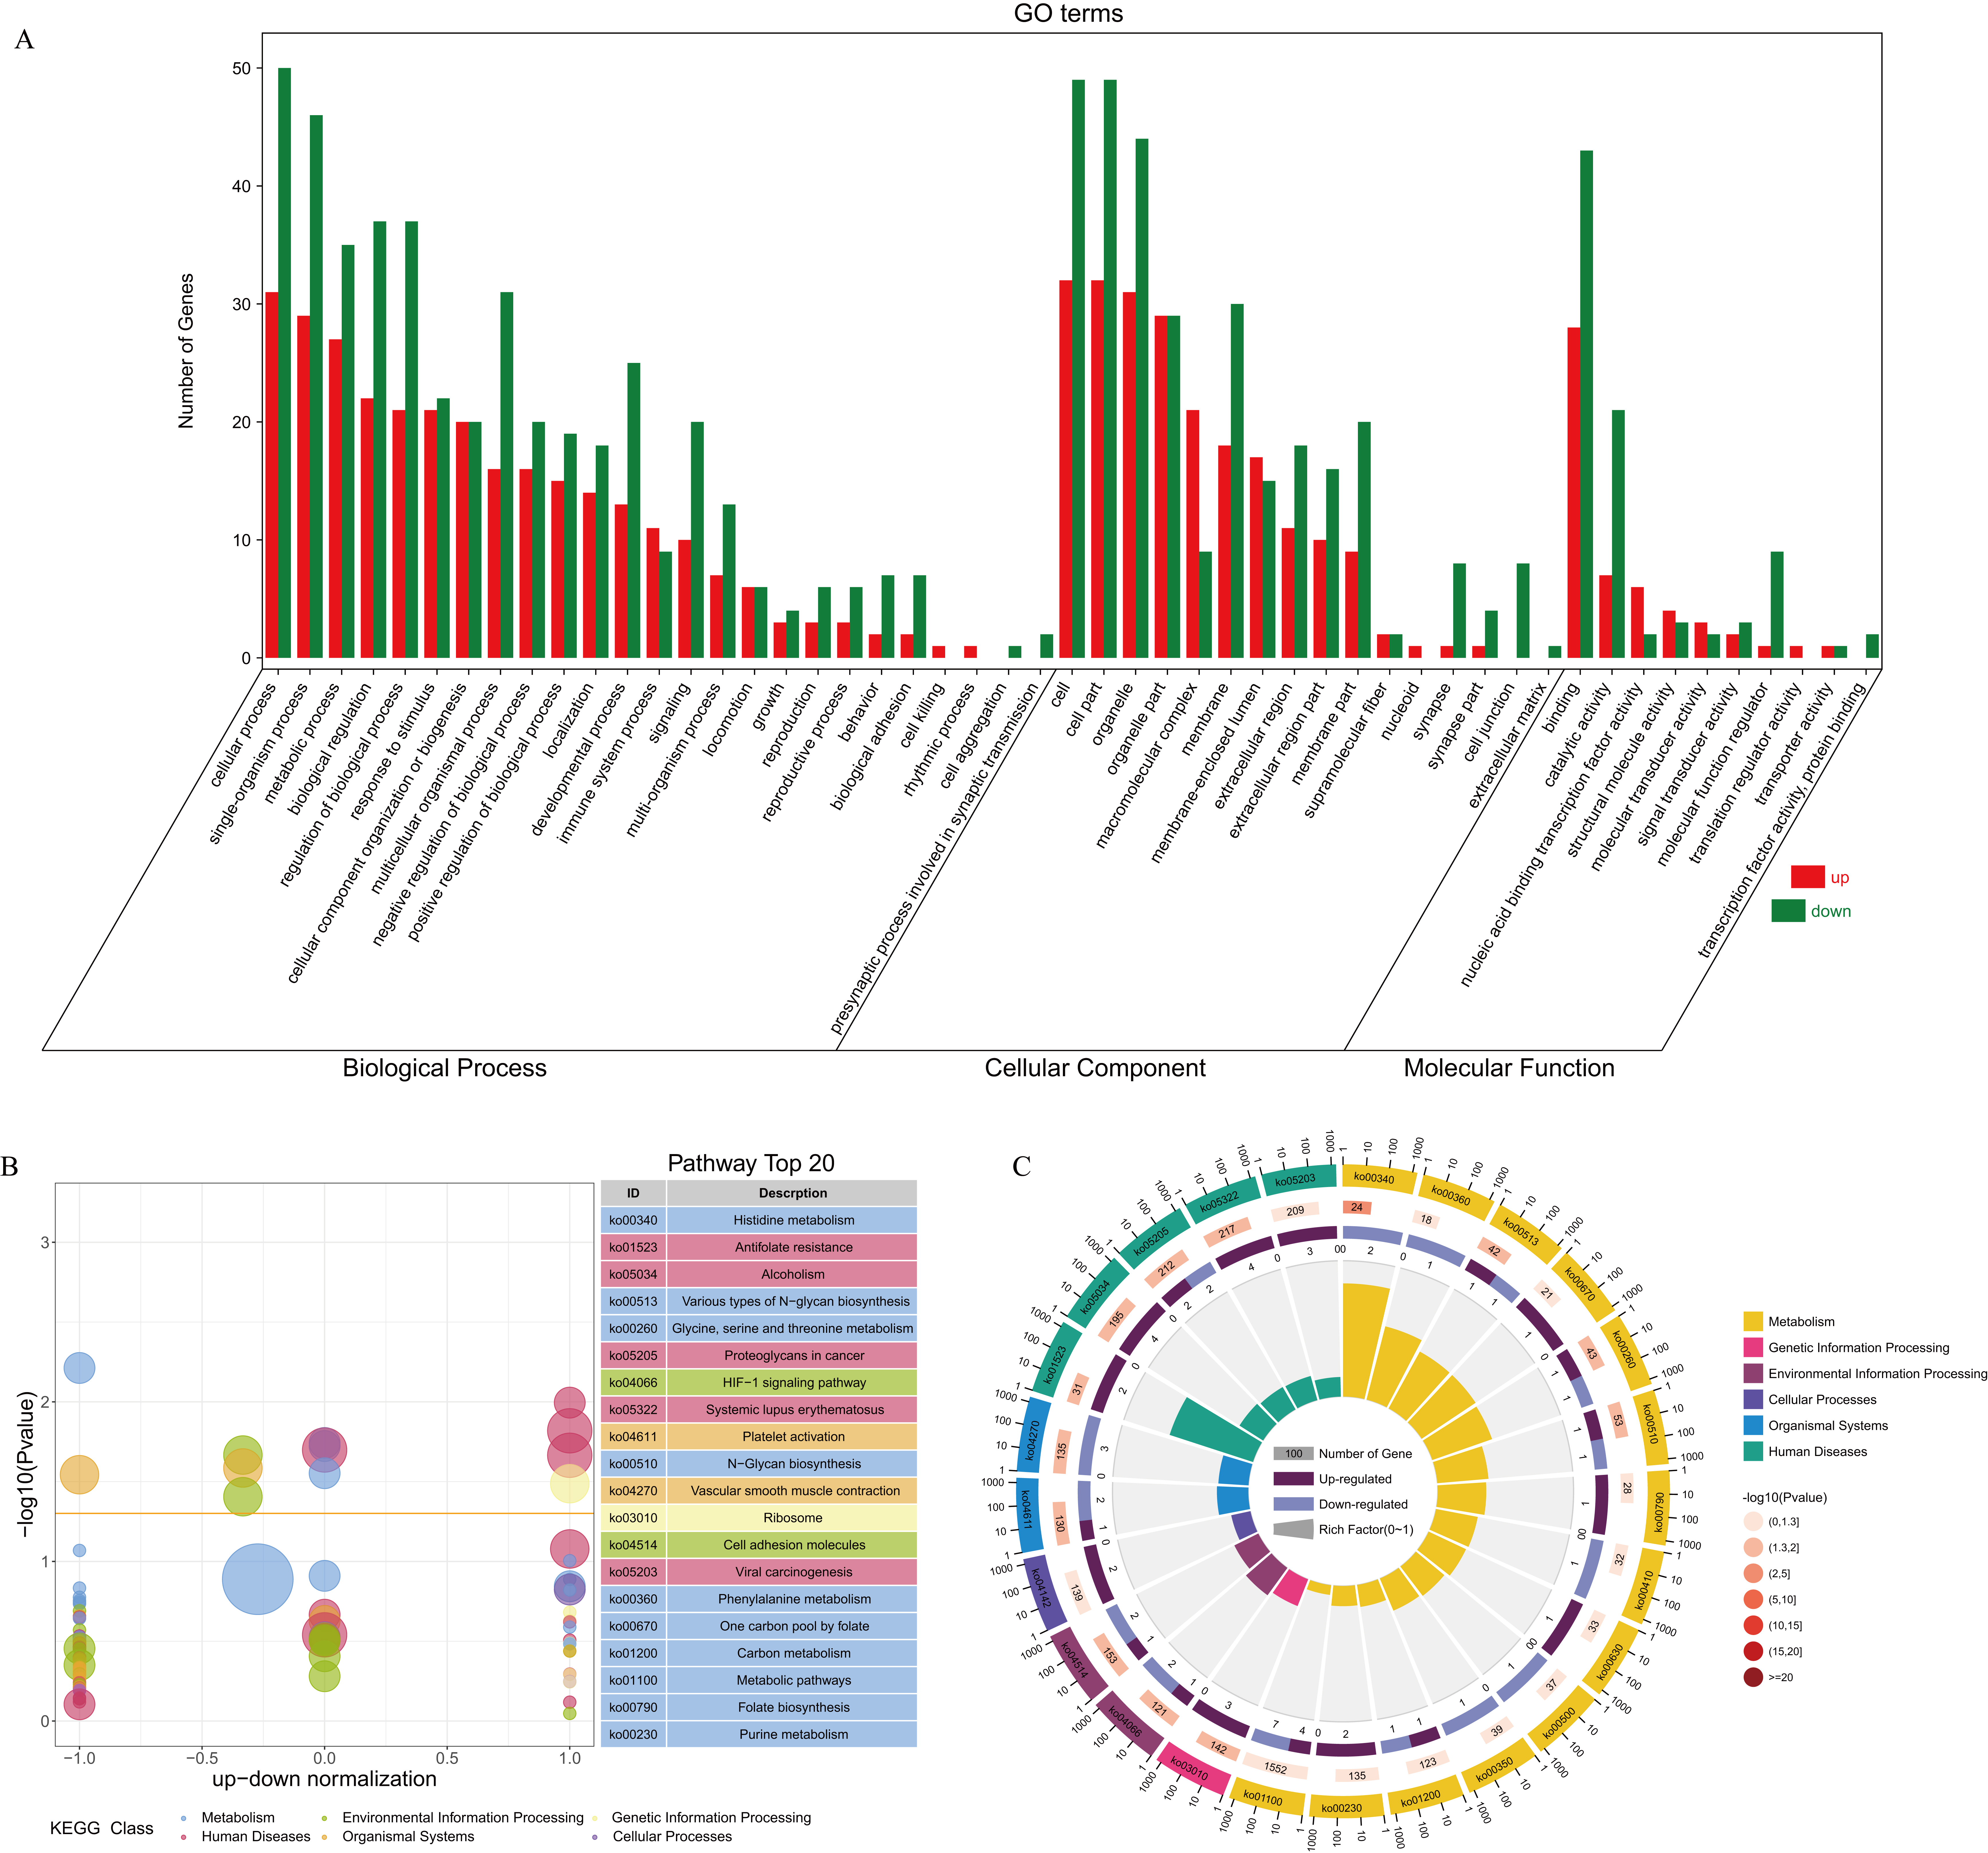 Fig. 2.
Functional enrichment analyses of DEGs. (A) GO_MF analysis showed enrichment in catalytic activity, DNA binding transcription factor activity, and structural molecular activity. (B–C) The KEGG pathways were significantly enriched in antifolate resistance, proteoglycans in cancer, viral carcinogenesis, and the HIF-1 signaling pathway, which involved in multipe mechanism of tumorgenesis and related to occurrence and development of MPNSTs. GO_MF, GO_molecular function; KEGG, Kyoto Encyclopedia of Genes and Genomes.
The PPI network was constructed on STRING, which contained 287 nodes and 848 edges. The most significant module was obtained in the PPI network of the upregulated and downregulated genes using Cytoscape MCODE plug-in. It was enriched in viral carcinogenesis, proteoglycans in cancer, and necroptosis (Fig. 3A).
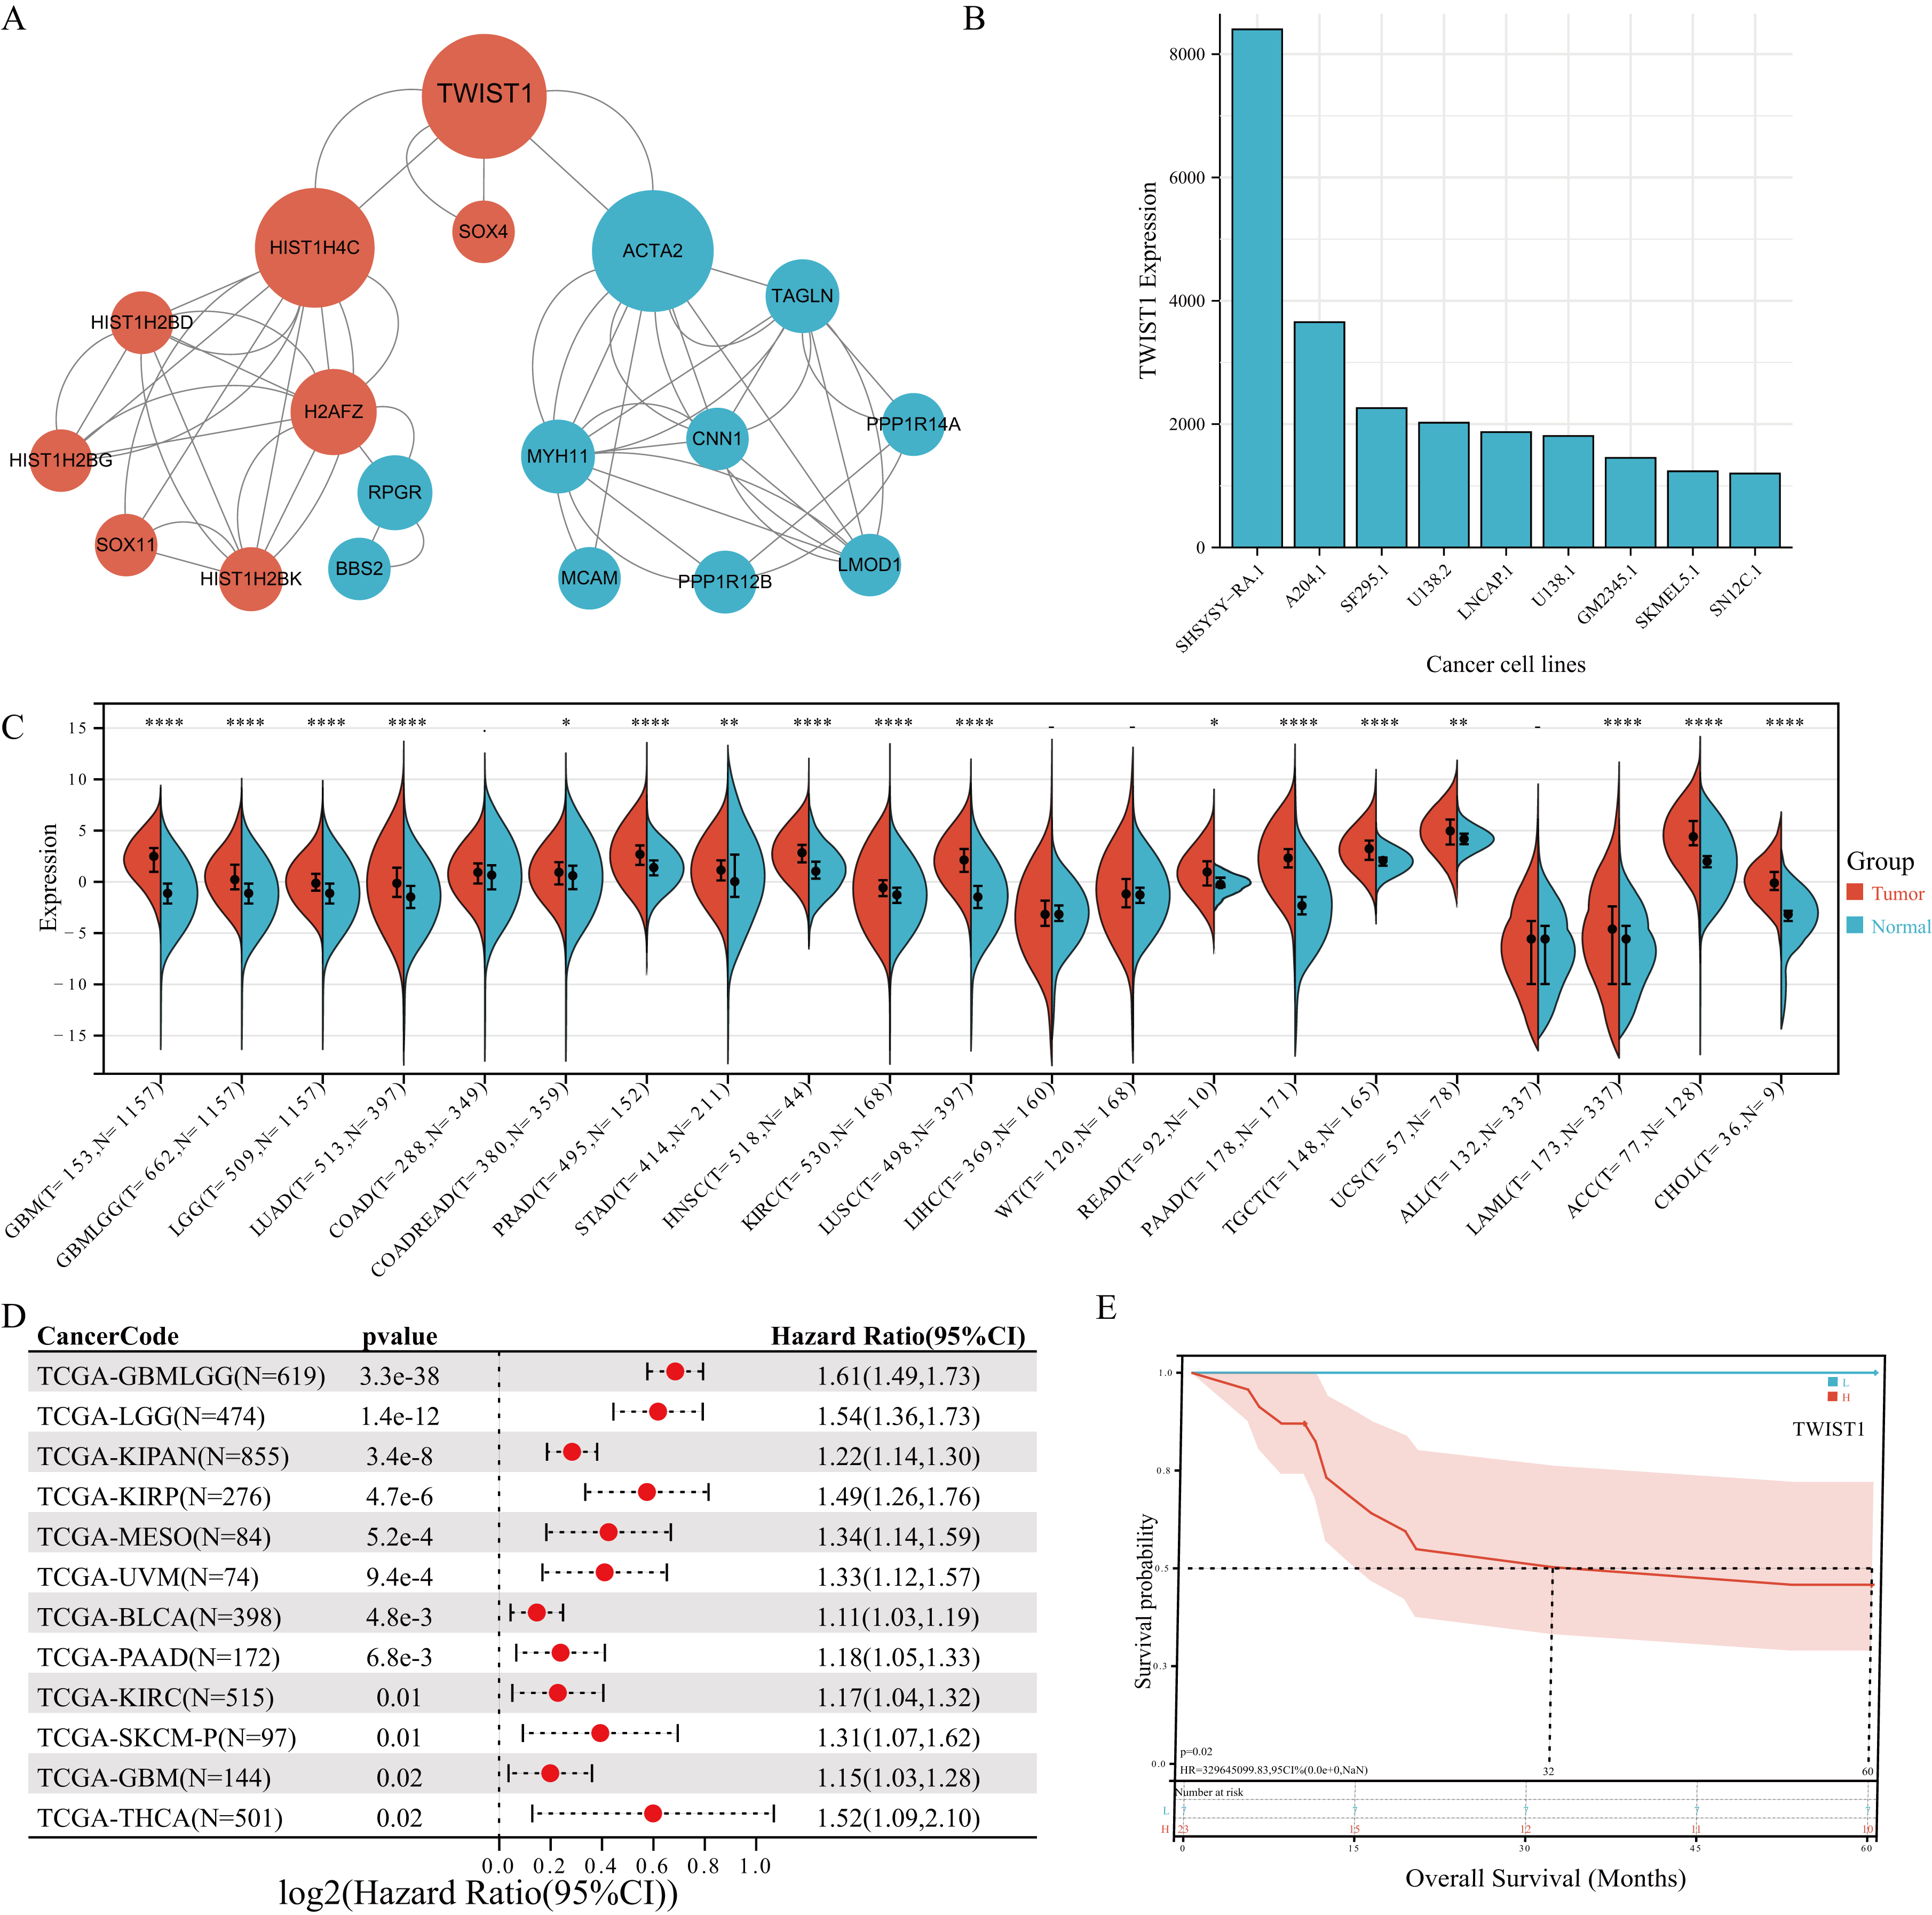 Fig. 3.
Prognostic value and differential expression of Twist1 across pan-cancer. (A) The protein-protein interaction network and hub genes. (B) Twist1 expression in different cancer cell lines extracted from the BioGPS database. (C) Twist1 expression in pan-cancers compared with normal tissues in the GEPIA database. (D) The correlation between the Twist1 expression and prognosis in pan-cancer. (E) High Twist1 expression was also associated with poor OS time in MPNST.
Then, using the CytoHubba plugin of the Cytoscape, the top 10 hub genes were identified in the whole PPI network ranked in terms of different algorithm, including Twist1, HIST1H4C, SOX11, ACTA2, SOX4, H2AFZ, HIST1H2BD, HIST1H2BG, HIST1H2BK, and RPGR by the EcCentricity method; ACTA2, Twist1, HIST1H4C, H2AFZ, RPGR, MYH11, TAGLN, BBS2, PPP1R12B, and SOX11 by the BottleNeck method; and ACTA2, HIST1H4C, Twist1, H2AFZ, MYH11, TAGLN, CNN1, LMOD1, HIST1H2BD, and HIST1H2BK by the Closeness method (Table 1). Based on the high score of Twist1 in various algorithms and combination with pan-cancer analysis, we selected it as the target gene.
| EcCentricity method | BottleNeck method | Closeness method | |||
| Name | Score | Name | Score | Name | Score |
| TWIST1 | 0.25 | ACTA2 | 18 | ACTA2 | 10.11667 |
| HIST1H4C | 0.25 | TWIST1 | 18 | HIST1H4C | 10 |
| SOX11 | 0.2 | HIST1H4C | 18 | TWIST1 | 9.25 |
| ACTA2 | 0.2 | H2AFZ | 3 | H2AFZ | 8.816667 |
| SOX4 | 0.2 | RPGR | 2 | MYH11 | 8.783333 |
| H2AFZ | 0.2 | MYH11 | 2 | TAGLN | 8.783333 |
| HIST1H2BD | 0.2 | TAGLN | 2 | CNN1 | 8.283333 |
| HIST1H2BG | 0.2 | BBS2 | 1 | LMOD1 | 8.283333 |
| HIST1H2BK | 0.2 | PPP1R12B | 1 | HIST1H2BD | 8.15 |
| RPGR | 0.166667 | SOX11 | 1 | HIST1H2BK | 8.15 |
We analyzed Twist1 expression in various cancer cell lines and normal tissues extracted from the BioGPS database. The results revealed that Twist1 expression increased not only in almost all cancer cells but also significantly varied among different cancer cell lines (Fig. 3B). Subsequently, we examined the expression levels of Twist1 in pan-cancer using the online database SangerBox. The expression of Twist1 was significantly increased in adrenocortical carcinoma (ACC), lower grade glioma (LGG), cholangiocarcinoma (CHOL), lung adenocarcinoma (LUAD), acute myeloid leukemia (LAML), stomach adenocarcinoma (STAD), head and neck squamous cell carcinoma (HNSC), testicular germ cell tumors (TGCT), kidney renal clear cell carcinoma (KIRC), lung squamous cell carcinoma (LUSC), rectum adenocarcinoma (READ), glioblastoma multiforme (GBM), pancreatic adenocarcinoma (PAAD), prostate adenocarcinoma (PRAD), and uterine carcinosarcoma (UCS) (Fig. 3C). These results suggested that Twist1 is overexpressed in tumor tissues.
The univariate Cox regression analysis was used to investigate the correlation
between Twist1 expression and prognosis, and a forest plot was drawn via
R package “survival” (Fig. 3D) and Kaplan-Meier survival curves for tumors with
significantly affected OS. High expression of Twist1 was associated with
poor OS time in LGG (n = 474, p = 3.3
The results demonstrated that Twist1 genomic alterations occurred in 1.5% of patients (Fig. 4A). The frequency of Twist1 gene alterations was higher in different cancer types, especially in the type of amplification (Fig. 4B).
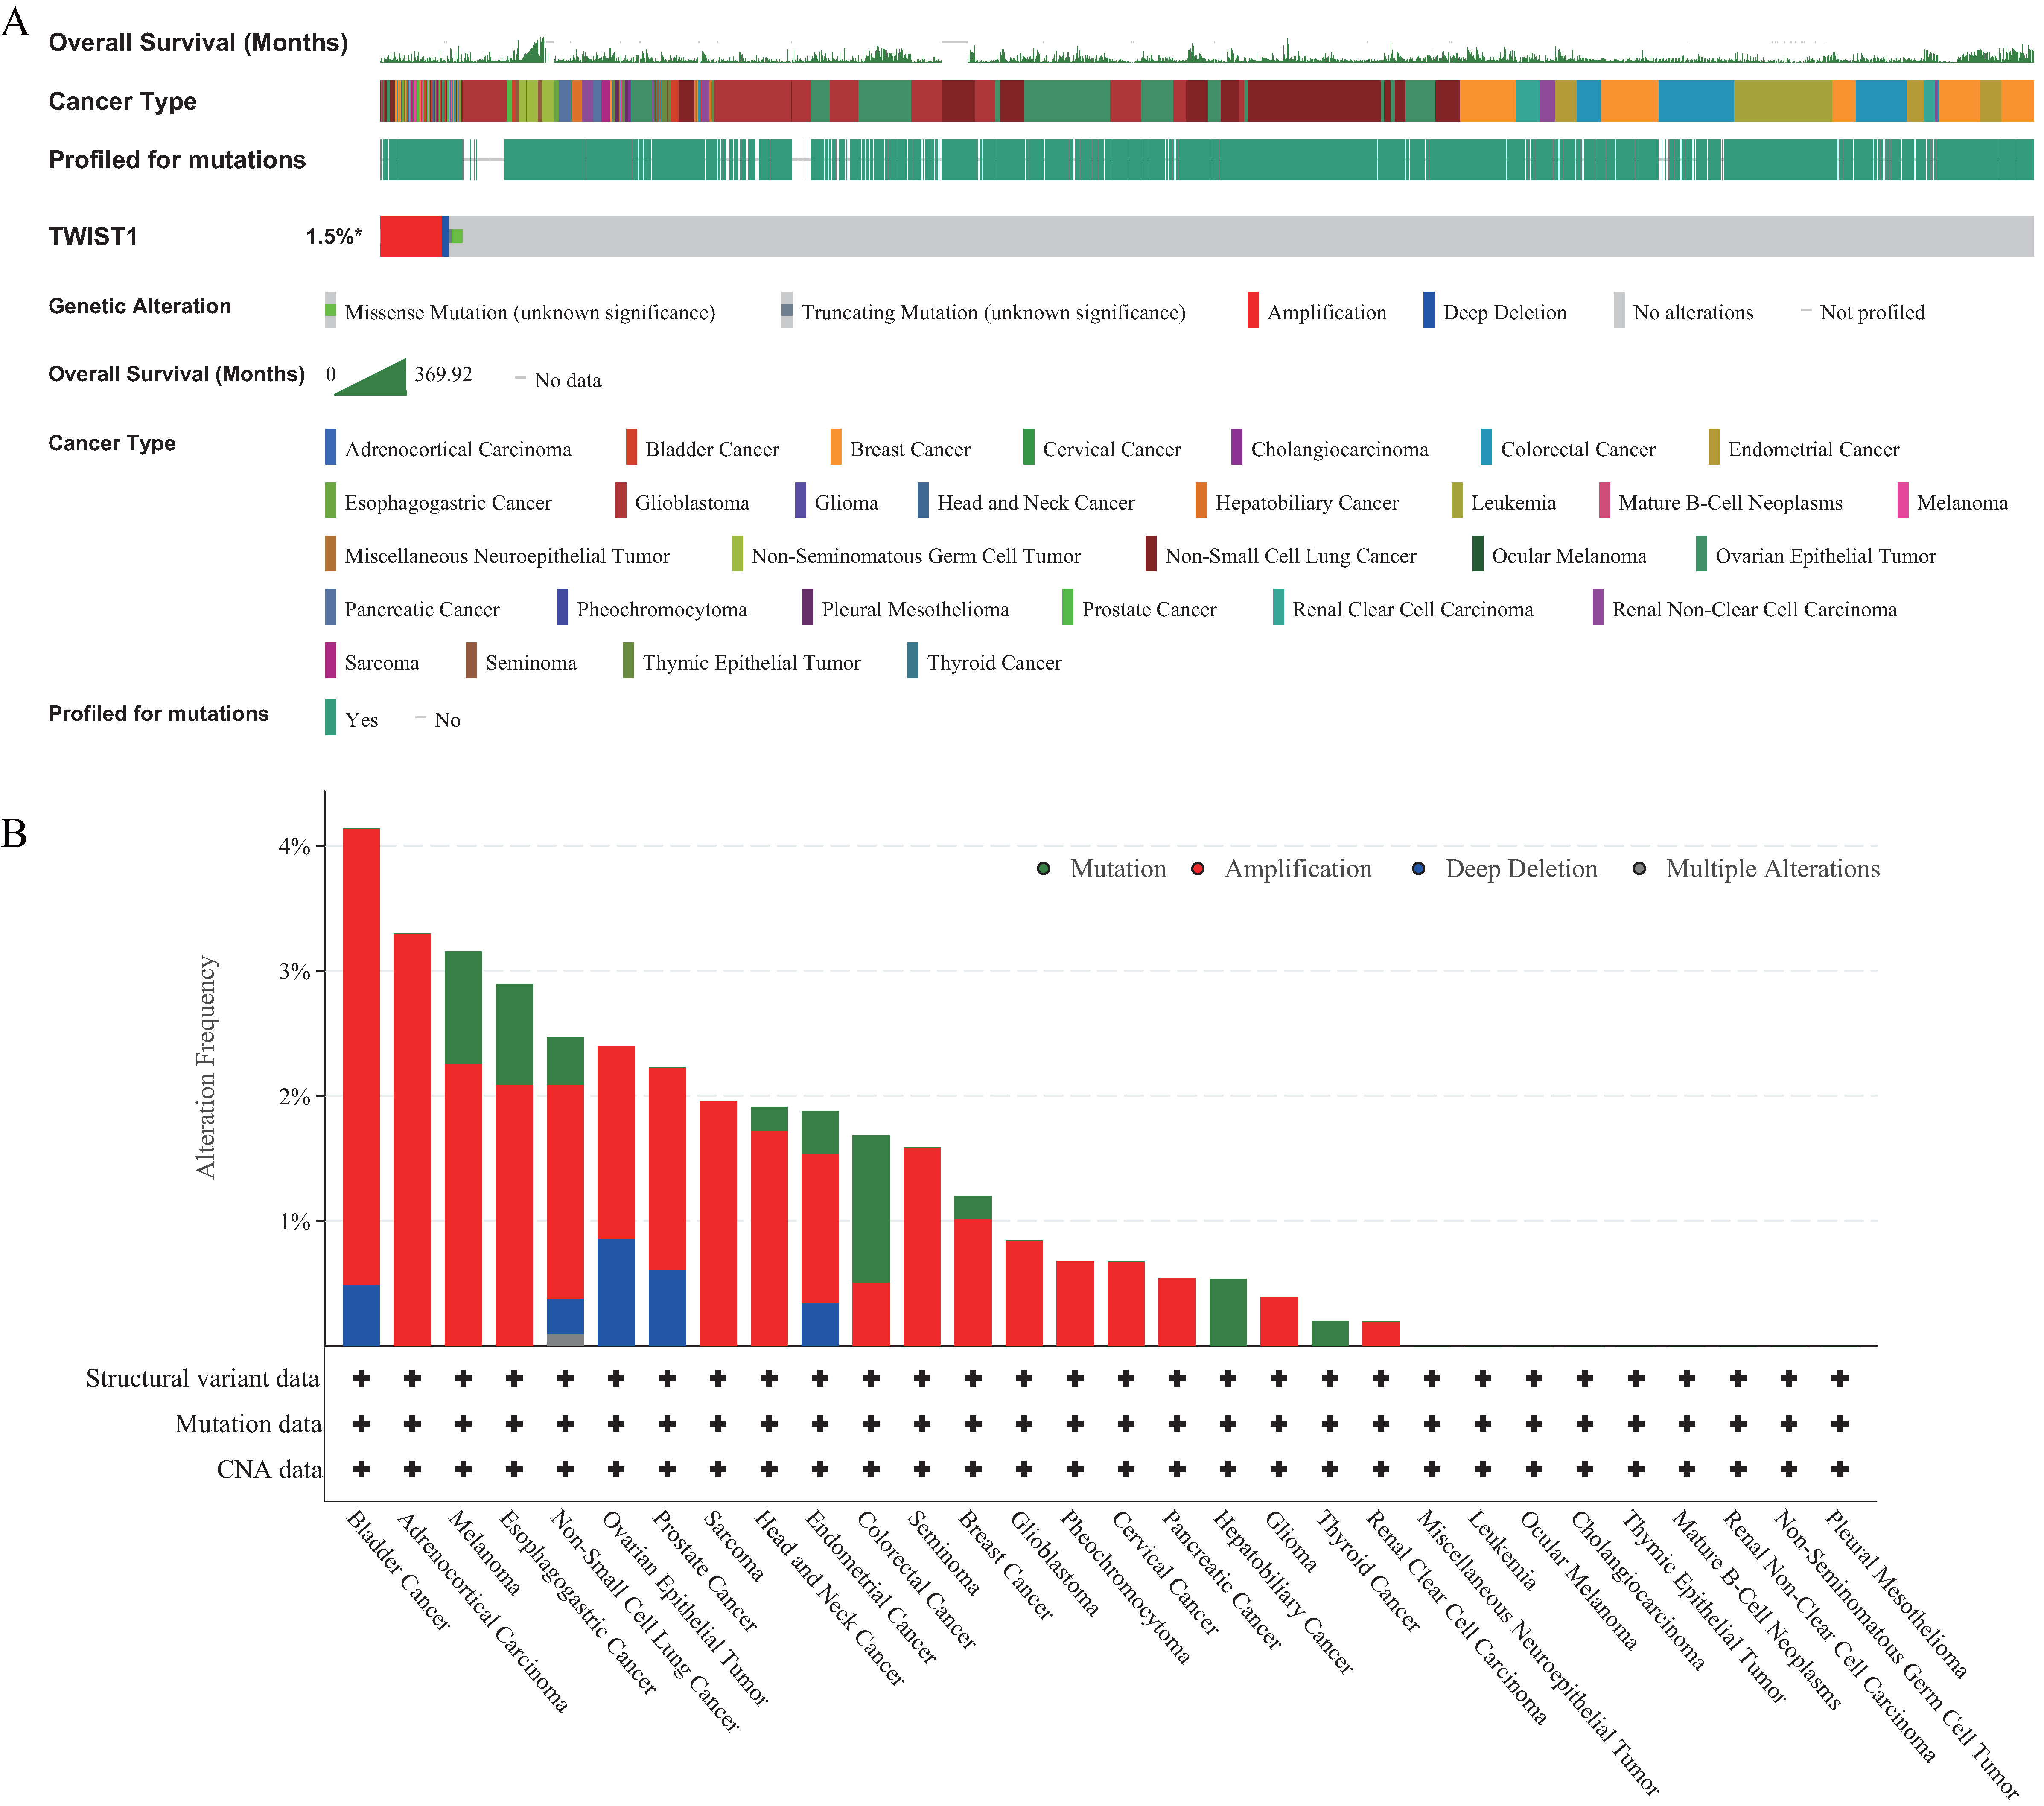 Fig. 4.
GZMA Genomic Alterations in different cancer groups analyzed by the cBioPortal database. (A) Twist1 genomic alterations occurred in 1.5% of patients. (B) The Twist1 gene alterations frequency was higher in different cancer types, especially in the type of Amplification.
Overlapping DEGs between MPNST and NF were used to search for drugs that could revert their expression signatures using the LINCS Query tool. Drug-gene combinations were ranked by search score. Drugs with low scores correspond to higher reversal potency and more significant potential for application. Finally, we selected five drugs (cytochalasin-d, cabozantinib, everolimus, refametinib, and BGT-226).
To know the interaction between predicted five drugs and Twist1, the molecular docking simulation study was performed by the AutoDockTools software. At the same time, we selected selumetinib, a classic mitogen-activated protein kinase (MAPK) inhibitor, as the reference drug for drug identification. The binding energy of cytochalasin-d, cabozantinib, everolimus, refametinib, BGT-226, and selumetinib with Twist1 was –6.61, –7.03, –7.73, –3.94, –7.07, and –6.22 kcal/mol, respectively (Table 2, Fig. 5). The molecular docking results revealed that everolimus interacted with Twist1 via two H-bonds in close proximity of 2.1 Å and 2.2 Å with ARG-423 and TYR-430 residues, respectively.
| Ligand | Receptor | PDB ID | Binding Affinity (Kcal/mol) | Amino Acid Residue | Bonding Length | Interaction |
| cytochalasin-d | Twist1 | 2MJV | –6.61 | ARG-423 | 2.0° | Hydrogen bond |
| GLN-416 | 2.0° | Hydrogen bond | ||||
| PHE-454 | 3.1° | Hydrogen bond | ||||
| cabozantinib | Twist1 | 2MJV | –7.03 | ALA-455 | 3.5° | Hydrogen bond |
| ASP-337 | 3.5° | Hydrogen bond | ||||
| ASP-459 | 3.2° | Hydrogen bond | ||||
| MET-457 | 2.9° | Hydrogen bond | ||||
| everolimus | Twist1 | 2MJV | –7.73 | ARG-423 | 2.1° | Hydrogen bond |
| TYR-430 | 2.2° | Hydrogen bond | ||||
| refametinib | Twist1 | 2MJV | –3.94 | GLU-460 | 2.1° | Hydrogen bond |
| HIS-341 | 2.0° | Hydrogen bond | ||||
| LYS-349 | 1.9° | Hydrogen bond | ||||
| BGT-226 | Twist1 | 2MJV | –7.07 | LYS-378 | 2.5° | Hydrogen bond |
| SER-401 | 2.2° | Hydrogen bond | ||||
| selumetinib | Twist1 | 2MJV | –6.22 | ASP-459 | 2.2° | Hydrogen bond |
| GLN-340 | 2.0° | Hydrogen bond | ||||
| GLN-416 | 2.8° | Hydrogen bond | ||||
| GLU-460 | 2.4° | Hydrogen bond | ||||
| HIS-341 | 2.0° | Hydrogen bond | ||||
| LYS-349 | 1.7° | Hydrogen bond |
PDB, Protein Data Bank.
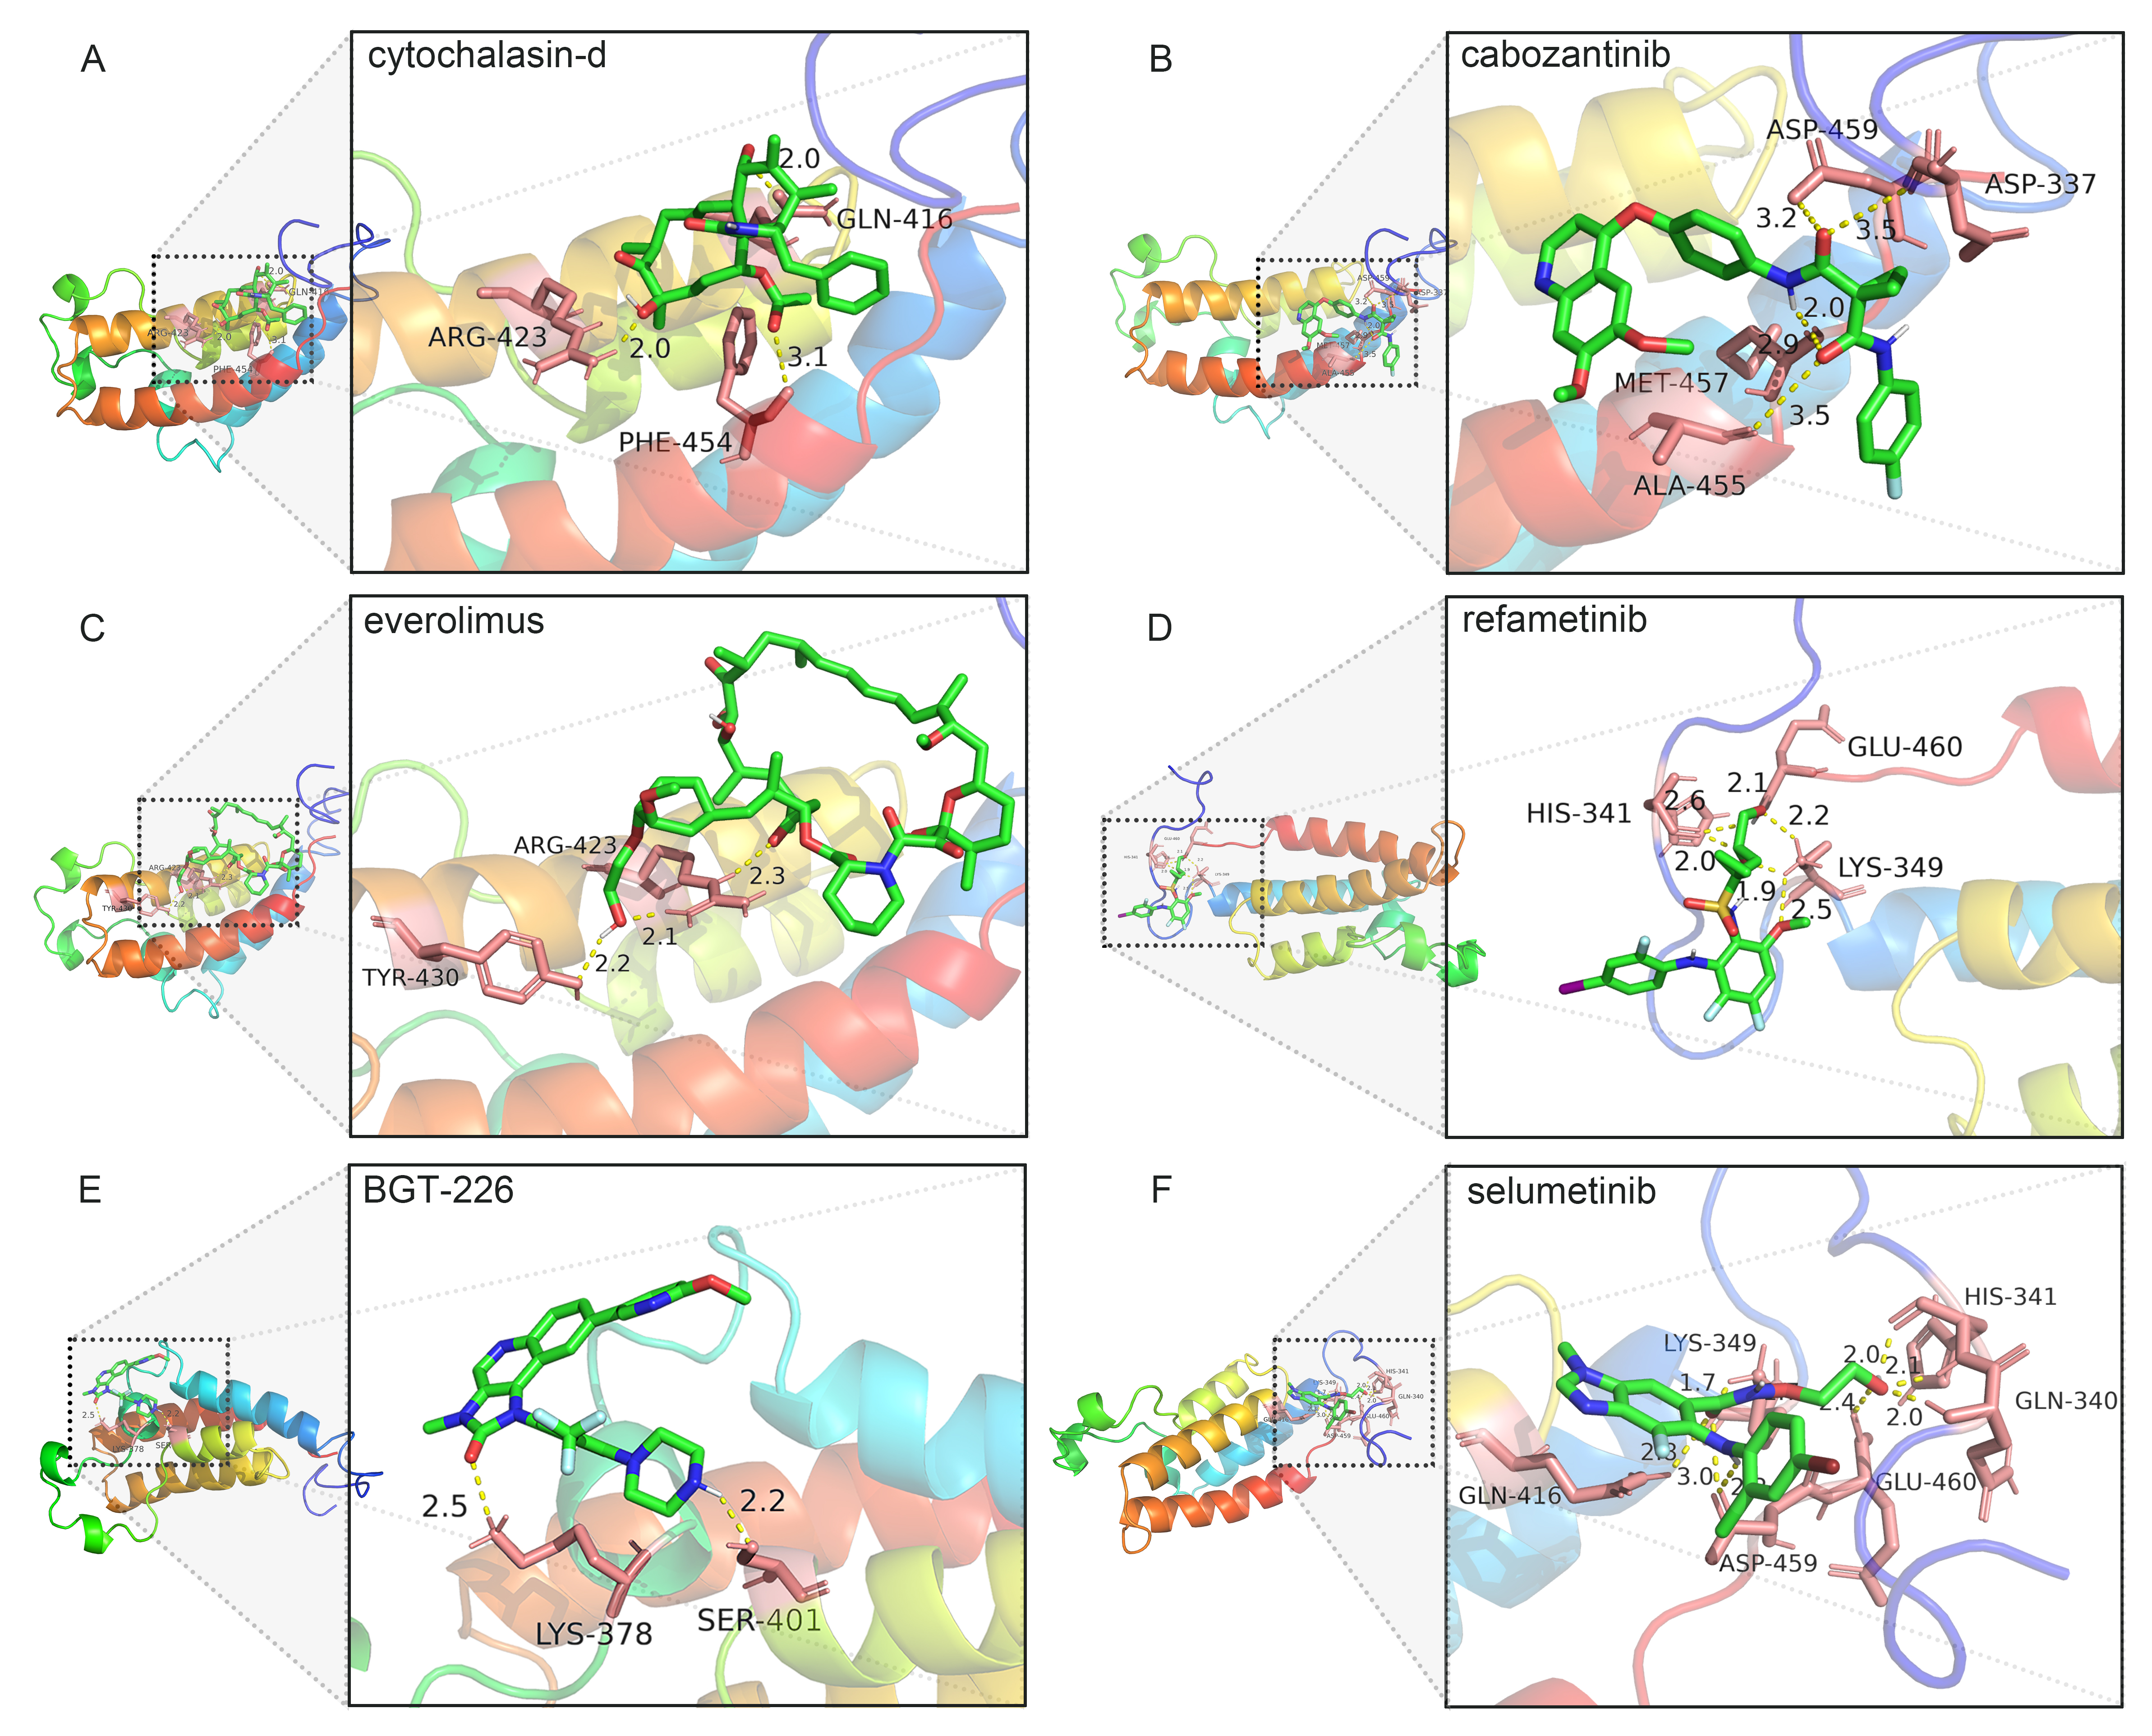 Fig. 5.
Molecular docking profile of drug candidate with Twist1. (A) cytochalasin-d. (B) cabozantinib. (C) everolimus. (D) refametinib. (E) BGT-226. (F) selumetinib.
Only 8–13% of NF1 patients develop MPNSTs. The genetic alteration from NFs to MPNST formation is unclear [14]. Cyclin-dependent kinase inhibitor 2A (CDKN2A)/p16 and polycomb repressive complex 2 (PRC2) gene mutations drive the transformation from NFs to MPNST [15, 16, 17, 18, 19, 20]. p16 is a tumor suppressor protein encoded by the CDKN2A gene, which inhibits cyclin D-dependent protein kinases from entering the S phase of the cell cycle, thereby maintaining retinoblastoma protein (Rb) in a low-phosphorylated state and preventing its isolation from E2F transcription factor. Loss of p16 expression and homozygous deletion of the CDKN2A gene in NFs may be related to their transformation to MPNSTs [15]. The core PRC2 complex comprises four components: EZH1/2, SUZ12, EED, and PbAp46/48 [21]. Lee et al. [17] identified loss-of-function somatic alterations of the /textitPRC2 components (EED or SUZ12) in MPNSTs. MPNSTs with PRC2 inactivation have been shown consistent and complete loss of trimethylation at lysine 27 of histone H3 (H3K27me3). The introduction of the missing PRC2 component in a PRC2-deficient MPNST cell line restored H3K27me3 levels and reduced cell proliferation.
Some individuals with NF1 will develop MPNSTs that arise due to the malignant transformation of plexiform neurofibroma (pNF) [22]. In the transition from NFs to MPNSTs, a recently identified tumor is called Atypical neurofibromatosis neoplasms of uncertain biological potential (ANNUBP), which is hypothesized to be precursor lesions of MPNSTs [23]. However, the molecular mechanism underlying the transformation from pNF to MPNSTs is still unknown. In this study, we first identified DEGs between MPNSTs and NFs using three independent GEO databases. In total, 34 upregulated DEGs and 55 downregulated DEGs were revealed. Bioinformatics analysis revealed that the upregulated genes are mainly involved in proteoglycans in cancer, and viral carcinogenesis, and the HIF-1 signaling pathway. To identify the hub genes involved in the progression from NFs to MPNSTs, we constructed a PPI network, and Twist1 was identified as a hub gene in the progression of MPNSTs. Further analysis revealed that higher expression of Twist1 correlated with shorter survival time in MPNSTs as in pan-cancer. Thus it may be a potential biomarker for the prognosis of MPNSTs.
Cutaneous NFs are the most prevalent tumour in NF1 patients. Plexiform NFs,
defined as NFs involving multiple peripheral nerve fascicles, are less frequent
but lead to serious consequences. Malignant transformation develops in 5–10% of
NF1 patients, typically in a plexiform NFs subtype [24]. The neural crest
transcription (SOX9) is found to be a biomarker of MPNSTs, which is possibly a
therapeutic target in NF1. Interestingly,
It appears that plexiform NFs have a higher ability to evolve into MPNSTs than cutaneous NFs. But so far, it is still unknown whether there is a molecular difference between cutaneous NFs and plexiform NFs. In the GSE41747 dataset we used to analyse, transcripts that passed the ANOVA failed to distinguish the two NF subtypes [25, 26]. The explanation is that cutaneous and plexiform NFs cells may be essentially the same but exposed to different tumor microenvironments. In addition, the other two datasets we used (GSE66743 and GSE141439) did not specify whether NFs were cutaneous NFs or plexiform NFs [27, 28], so our analysis did not distinguish the two types of NFs. Due to the different potential of developing MPNSTs of two types of NFs, it is necessary to conduct gene differential analysis between different types of NFs and MPNSTs in future studies.
Twist1, a transcription factor and member of the basic helix-loop-helix protein family, is known to stimulate epithelial-mesenchymal transition (EMT) and promote tumor invasion and metastasis. Dysregulation of Twist1 is associated with the loss of epithelial markers, such as E-cadherin, and alpha/gamma-catenins, and the activation of mesenchymal markers, such as N-cadherin, suggesting that Twist1 promotes the EMT [29]. Twist1-induced EMT is clinically associated with distant cancer metastasis and poor prognosis in multiple tumor types. Twist1 transcription factors mediate EMT target genes involved in cell migration and invasion [30], multidrug resistance [31, 32, 33], cancer stems cell self-renewal [34, 35], immune surveillance [36], and apoptosis [37].
Our study revealed that the expression of Twist1 was significantly higher in GBM, LGG, LUAD, PRAD, STAD, HNSC, KIRC, LUSC, READ, PAAD, TGCT, UCS, LAML, ACC, and CHOL, consistent previous reports [29, 38, 39, 40, 41, 42, 43, 44, 45, 46, 47, 48, 49, 50, 51, 52, 53, 54, 55, 56]. Twist1 might be a significant diagnostic and prognostic biomarker predicting poor prognosis, which has already been demonstrated in breast cancer [39], bladder cancer [57], esophageal squamous cell carcinoma [58], cervical cancer [59], head and neck cancer (HNC) [60], melanoma [61], colorectal cancer [62], hepatocellular cancer [63, 64], nasopharyngeal cancer [51], and ovarian cancer [65, 66]. The widespread involvement of Twist1 in human cancer suggests that inhibition of Twist1 is a promising therapeutic strategy for the prevention and treatment of cancer. We also showed that Twist1 expression was linked to clinical prognosis in multiple cancers. In addition, high expression levels of Twist1 had a significant association with poor OS in MPNSTs. Twist1 is highly expressed in MPNSTs and has low expression in normal adult tissues, making it an promising therapeutic target for drug development. Therefore, the application of Twist1 inhibitor has great clinical value for the treatment of MPNSTs, with few side effects.
We used LINCS datasets to identify novel MPNSTs drugs based on the overlapping DEGs. Finally, we selected five drugs (cytochalasin-d, cabozantinib, everolimus, refametinib, and BGT-226) with lower scores regarding their potential as drugs. To further predict the five drugs that might be direct Twist1 inhibitors, the molecular docking analysis was performed using the AutoDockTools and PyMOLsoftware. The results showed that everolimus interacting with Twist1 has lowest binding energy, making everolimus an optimal potential drug.
The mammalian target of rapamycin (mTOR), which involve in the growth and proliferation of tumor cells and play a role in the switch between cell catabolism and anabolism, is dysregulated in many types of tumors [67]. This explains the potential use of mTOR inhibitors in oncology. Everolimus is a new mTOR inhibitor, which inhibits the growth and angiogenesis of tumor cells by continuously inhibiting mTOR. Everolimus blocking the binding of the raptor to mTOR can restore control of the activated PI3K/AKT/mTOR signalling pathway. Everolimus has been approved for treating advanced breast cancer with positive hormone receptors and negative human epidermal growth factor receptor 2 [68], advanced renal cell carcinoma after targeted treatment of vascular endothelial growth factor [69], and advanced neuroendocrine tumors of pancreatic, gastrointestinal or pulmonary origin [70, 71]. In addition, it can be used to control the growth of subependymal giant cell astrocytoma, renal angiomyolipoma, and hamartoma in tuberous sclerosis complex (TSC) [72]. It can also be used for immunosuppression after heart or kidney transplantation [73].
Interestingly, Twist1 promotes energy metabolism reprogramming (EMR) of glucose metabolism in breast cancer cells by activating the PI3K/AKT/mTOR pathway. EMR is crucial for the survival of cancer cells, as it can increase cancer proliferation, migration, and invasion [74]. In addition, previous studies have confirmed that Twist1 promotes tumor invasion and metastasis by inducing EMT, and multiple signals that induce EMT often converge in the PI3K/AKT/mTOR signalling pathway. Xue et al. [75] found that complete EMT phenotype and morphological changes require PI3K/AKT mediated Twist1 phosphorylation in breast tumor cells. Twist1 may be a PI3K/AKT/mTOR signalling pathway member. Based on our research, everolimus could be a potential therapeutic drug for MPNSTs. The results of molecular docking show that everolimus has the lowest binding energy with Twist1, indicating that it may play an anti-tumor role by targeting Twist1 in addition to targeting mTOR. Another possible explanation is that it indirectly regulates Twist1 phosphorylation by targeting PI3K/AKT/mTOR pathway. However, our study results have not been experimentally validated and further experiments are needed.
This study is the first to systematically investigate the potential role of Twist1 in MPNSTs, which may be a key gene related to the occurrence and progression of MPNSTs. In addition, through molecular docking, everolimus, a potential target drug for MPNSTs, has a clear binding site and good binding ability with Twist1. It is expected to provide new ideas and insights for exploring the treatment strategies and therapeutic drugs of MPNSTs.
Overall, our results describe the importance of Twist1 in MPNST pathogenesis. everolimus was also found to be a potential therapeutic drug for MPNSTs. These findings require further experimental studies for confirmation.
This study had limitations. First, we have not performed further experiment methods to verify the functional roles of Twist1. Therefore, functional experiments including cell proliferation, migration, gain- and loss-of-function assays, should be conducted in the future. Second, although we have identified the clinical significance of Twist1 in MPNSTs in three independent datasets, verification in large clinical samples is still needed.
MPNSTs, Malignant peripheral nerve sheath tumors; DEGs, differentially expressed genes; Twist1, twist family bHLH transcription factor; NFs, neurofibromas; pNF, plexiform neurofibroma; EMT, epithelial-mesenchymal transition.
Publicly available datasets were analyzed in this study. The datasets include The Cancer Genome Atlas (TCGA) database (https://portal.gdc.cancer.gov/) and the Genotype-Tissue Expression (GTEx) dataset (http://www.gtexportal.org/home/).
HH and MW designed the research study. MW, JF and JX analyzed and interpreted the data. RP and XD performed the experiments. JF and JX contributed materials, analysis tools or data. HH and MW wrote the manuscript. All authors read and approved the final manuscript. All authors have participated sufficiently in the work and agreed to be accountable for all aspects of the work.
This study was ethically approved by the ethics committee of Xiangya Hospital, Central South University [No. 202204065].
Not applicable.
This research was funded by the Hunan Provincial Science and Technology Department [Grant No. 2021JJ31065].
The authors declare no conflict of interest.
References
Publisher’s Note: IMR Press stays neutral with regard to jurisdictional claims in published maps and institutional affiliations.