


 , Bi-Jun Huang 1,*
1 Department of Experimental Research, State Key Laboratory of Oncology in South China and Collaborative Innovation Center for Cancer Medicine, Sun Yat-sen University Cancer Center, 510060 Guangzhou, Guangdong, China
2 Department of Cardiothoracic Surgery, Zhongshan People's Hospital, 529403 Zhongshan, Guangdong, China
3 Department of Radiation Oncology, People's Hospital of Guangxi Zhuang Autonomous Region, 530021 Nanning, Guangxi, China
4 Department of Nuclear Medicine, The Second People’s Hospital of Shenzhen, 518035 Shenzhen, Guangdong, China
5 Department of Clinical Medical Research Institute, State Key Laboratory of Pathogenesis, Prevention and Treatment of High Incidence Diseases in Central Asian, The First Affiliated Hospital of Xinjiang Medical University, 830011 Urumqi, Xinjiang, China
6 Department of Oncology, The People's Hospital of Gaozhou, 6664126 Gaozhou, Guangdong, China
†These authors contributed equally.
Abstract
Background: Esophageal squamous cell carcinoma (ESCC) is a highly
lethal tumor type, but studies on the ESCC tumor microenvironment are limited. We
found that cystatin SN (CST1) plays an important role in the ESCC tumor
microenvironment. CST1 has been reported to act as an oncogene in
multiple human cancers, but its clinical significance and underlying mechanism in
ESCC remain elusive. Methods: We performed ESCC gene expression
profiling with data from RNA-sequencing and public databases and found
CST1 upregulation in ESCC. Then, we assessed CST1 expression in
ESCC by RT‒qPCR and Western blot analysis. In addition, immunohistochemistry
(IHC) and enzyme-linked immunosorbent assay (ELISA) were used to estimate the
expression of CST1 in ESCC tissue and serum. Moreover, further
functional experiments were conducted to verify that the gain and loss of
CST1 in ESCC cell lines significantly influenced the proliferation and
metastasis of ESCC. Mass spectrometry, coimmunoprecipitation, and gelatin
zymography experiments were used to validate the interaction between
CST1 and matrix metalloproteinase 2 (MMP2) and the mechanism of CST1 influence on metastasis
in ESCC. Results: Here, we found that CST1 expression was
significantly elevated in ESCC tissues and serum. Moreover, compared with
patients with low CST1 expression, patients with high CST1
expression had a worse prognosis. Overall survival (OS) and disease-free survival
(DFS) were significantly unfavorable in the high CST1 expression
subgroup. Likewise, the CST1 level was significantly increased in ESCC
serum compared with healthy control serum, indicating that CST1 may be a
potential serum biomarker for diagnosis, with an area under the curve (AUC) =
0.9702 and p
Keywords
- CST1
- esophageal squamous cell carcinoma (ESCC)
- metastasis
- prognostic biomarker
- tumor microenvironment (TME)
- matrix metalloproteinase (MMP)
Esophageal cancer (ESCA) is one of the deadliest malignant cancers worldwide [1]. ESCA ranks sixth in cancer-related deaths and is the eighth most common cancer worldwide [2]. There is a high incidence of ESCA in China, and the morbidity and mortality of ESCA in China account for more than 50% of all ESCA-related events worldwide. Moreover, more than 90% of ESCA cases in China are esophageal squamous cell carcinoma (ESCC) [3]. Due to the challenges in early diagnosis and the lack of effective targeted therapeutic drugs, the outcomes of ESCC patients are dismal, with an approximately 30% five-year overall survival rate [4]. Although some studies have explored the pathogenesis of ESCC, the molecular mechanisms are still unclear. Therefore, it is necessary to further explore the underline molecular mechanism of ESCC tumorigenesis and develop more corresponding therapeutic approaches.
Several studies have conclusively confirmed an essential role of the tumor microenvironment (TME) in ESCA progression and metastasis. It has been demonstrated that the ESCA TME, except for the extracellular matrix (ECM), is enriched in tumor-associated fibroblasts, immune cells, proinflammatory cytokines, chemokines, and growth factors, and their complex crosstalk with each other or their receptors influences the development and progression of ESCA [5, 6].
Comprehensive insight is needed into the complex interconnected components of the TME via these secretory factors in the TME, which can offer an opportunity to identify novel targets with diagnostic, prognostic, and therapeutic potential. Cystatin SN (CST1), a secretory protein encoded by the CST1 gene, is a member of the type 2 cystatin superfamily of cysteine proteinase inhibitors [7], which plays crucial roles in promoting tumor progression during tumor development [8], including cell proliferation, migration, invasion, metastasis and recurrence [8]. Type 2 cystatin are usually secretory peptide and presumed to function extracellularly as a member of the extracellular matrix, which could been detected in a variety of fluids and secretions, including the plasma, saliva and tears [9]. The CST1 gene contains three exons, and its coding DNA sequence (CDS) region has 426 nt bases, encoding only one protein and no other alternative splicing variants. CST1, a secreted protein, contains 141 amino acids and a molecular weight of approximately 17 kDa, while CST1 was detected in the cytoplasm, nucleus and extracellular matrix, so we speculate that CST1 may play different roles in different regions of the cell.
A study reported upregulated cysteine proteases, such as cathepsins, resulted in colorectal cell death [10]. Cysteine proteases functioned in protein degradation in lysosomes and secretory granules may act as tumor suppressors in tumor progression [11]. Specifically, cysteine peptidases are involved in remodeling ECM during development and are likely involved in tissue penetration by migrating cancer cells [12]. CST1 proteins also specifically inhibit the proteolytic activity of cysteine proteases [13]. Previous studies have indicated that CST1 is involved in the tumorigenesis of multiple cancers, such as lung cancer [14], colorectal cancer [15, 16, 17], liver cancer [18, 19], pancreatic cancer [20], gastric cancer [21] and breast cancer [22, 23].
The current research on CST1 in ESCA seems to be contradictory. In contrast to our study, one study reported that as an independent predictor of 5-year survival, overexpression of CST1 was associated with better survival of patients with ESCC based on immunohistochemistry (IHC) [24]; however, since this research was limited to the IHC method and clinical parameter analysis, the definitive role of CST1 in ESCC and its mechanisms remain ambiguous. Another study showed that high expression of CST1 in the ECM was associated with poor prognosis in ESCC. However, this study is only based on bioinformatics analysis, and further experimental verification is needed [25]. Therefore, the role of CST1 in ESCC remains unclear.
In addition, we mainly investigated the role of CST1 as a secreted
protein in the TME by interacting with the matrix metalloproteinase (MMP) family
member MMP2. The MMP family belongs to the family of Ca
The results of this study revealed a pivotal role for CST1 in ESCC metastasis and tumorigenesis, which demonstrated that CST1 may be a potential prognostic biomarker and therapeutic target in ESCC. In addition, since CST1 is a secreted protein, high concentrations of CST1 can be detected in the blood of ESCC patients rather than normal people, so it can also be used as a potentially noninvasive early diagnostic method for ESCC patients.
In total, 220 pathologically confirmed ESCC formalin-fixed, paraffin-embedded tissues and 19 matched tumor-adjacent samples were obtained from the Department of Pathology at the Sun Yat-Sen University Cancer Center (SYSUCC). Another 24 pairs of fresh primary ESCC tissues and corresponding normal tissues were collected from the Department of Thoracic Surgery at the First Affiliated Hospital of Sun Yat-Sen University (FAHSYSU). Fifteen normal blood samples and 87 ESCC blood samples were collected from Gaozhou People’s Hospital in Guangdong Province. All patients were untreated and had no history of other tumors. Written informed consent was obtained from all participants, and the research was approved by the Medical Ethical Committee of the SYSUCC.
The eight human ESCC cell lines (EC18, KYSE30/K30, Ec109, KYSE150/K150,
KYSE180/K180, KYSE410/K410, KYSE510/K510, KYSE520/K520) and one immortalized
normal esophageal cell line (NE1) used in the present study were kindly gifted by
Professor Guan (Department of Clinical Oncology, University of Hong Kong). All cell lines were authenticated using the short tandem repeat (STR) technique. Additionally, mycoplasma testing was conducted on the cell lines, and the result is negative. Cells
culture was by medium mixed with 10% fetal bovine serum and a 1%
penicillin‒streptomycin in DMEM (Gibco, Carlsbad, CA, USA) at 37
Immunohistochemical assays were carried out according to a protocol described by other researchers [30]. A CST1 antibody (diluted 1:200; Proteintech, #16025-1-AP, Chicago, USA) was used to stain for CST1. When staining was completed, two pathologists reviewed and scored the sections independently, and discrepancies in scoring were resolved by consensus. The mean score was used as a cutoff value to divide the samples into high and low CST1 expression groups. The expression level of CST1 in ESCC tissues was scored as the proportion of the area with positive staining (1 for 0–25%; 2 for 25–50%; 3 for 50–75%; 4 for 75–100%;) multiplied by the staining intensity (0 for negative; 1 for weak; 2 for moderate; 3 for intense).
Total RNA was extracted from cells by using TRIzol reagent (Invitrogen, Carlsbad, CA, USA) following the manufacturer’s instructions. The PrimeScript RT Master Mix Kit (Takara Bio, Kusatsu, Japan) was used for reverse transcription. RT‒qPCR was carried out using a SYBR Green Master Mix Kit (YEASEN, Shanghai, China) according to the manufacturer’s instructions, followed by a Roche 96/384-well Real-Time PCR system (Roche Applied Science, Indianapolis, IN, USA). GAPDH was used as an internal control. The primers used are listed in Table 1.
| Primer name | Sequence (5′-3′) |
| CST1 Forward: | TGTGCCTTCCATGAACAGCCAG |
| CST1 Reverse: | CTGGCACAGATCCCTAGGATTC |
| GAPDH Forward: | GTCTCCTCTGACTTCAACAGCG |
| GAPDH Reverse: | ACCACCCTGTTGCTGTAGCCAA |
| MMP-1 Forward: | ATGAAGCAGCCCAGATGTGGAG |
| MMP-1 Reverse: | TGGTCCACATCTGCTCTTGGCA |
| MMP-2 Forward: | AGCGAGTGGATGCCGCCTTTAA |
| MMP-2 Reverse: | CATTCCAGGCATCTGCGATGAG |
| MMP-3 Forward: | CACTCACAGACCTGACTCGGTT |
| MMP-3 Reverse: | AAGCAGGATCACAGTTGGCTGG |
| MMP-9 Forward: | GCCACTACTGTGCCTTTGAGTC |
| MMP-9 Reverse: | CCCTCAGAGAATCGCCAGTACT |
| MMP-10 Forward: | TCCAGGCTGTATGAAGGAGAGG |
| MMP-10 Reverse: | GGTAGGCATGAGCCAAACTGTG |
| MMP-13 Forward: | CCTTGATGCCATTACCAGTCTCC |
| MMP-13 Reverse: | AAACAGCTCCGCATCAACCTGC |
| HPRT Forward: | TTCCTTGGTCAGGCAGTATAATCC |
| HPRT Reverse: | AGTCTGGCTTATATCCAACACTTCG |
| ACTB Forward: | CAATGAGCTGCGTGTGGC |
| ACTB Reverse: | CGTACATGGCTGGGGTGTT |
Cells (1
For this assay, 3
Western blot experiments were performed according to a protocol described by other researchers [31]. The antibodies used were as follows: CST1 rabbit monoclonal antibody (diluted 1:500; Proteintech, #16025-1-AP, Chicago, USA); GAPDH antibody (diluted 1:1000; Proteintech, #10494-1-AP, USA); MMP1 (Cell Signaling Technology, #54376, Danvers, MA, USA), MMP2 (Cell Signaling Technology, #40994, USA), MMP3 (Cell Signaling Technology, #14351, USA) and MMP10 antibodies (diluted 1:1000; Abcam, #ab261733, Cambridge, MA, USA); and E-cadherin (Proteintech, # 20874-1-AP), Desmoplakin, N-cadherin (Proteintech, # 22018-1-AP), Vimentin (Proteintech, # 10366-1-AP), and Slug (diluted 1:1000; Proteintech, #12129-1-AP, USA), GAPDH was used as an internal reference. Enhanced chemiluminescence reagents were used to visualize the proteins.
An ELISA kit (Cloud-Clone Corporation, product No. SEJ330Hu 96 Tests) for CST1 and the serum sample dilution ratio used were performed according to the manufacturer’s instructions. Specifically, a sandwich enzyme immunoassay for in vitro quantitative measurement of the CST1 protein concentration in human serum, human plasma and cell culture supernatants was used. All the reactions were repeated three times. To make the calculation easier, we plotted the optical density (OD) value of the standard (X axis) against the known concentration of the standard (Y axis), to draw a standard curve. Then bring the detected OD value of the sample into the standard curve to obtain the specific concentration of the sample.
The MTS assay was used to assess cancer cell viability and growth. Cells (1000 in 200 µL of medium) were seeded into a 96-well plate (Jet Biofil; # TCP011096, Guangzhou, China) and cultured under normal conditions for 24 h. Thereafter, we diluted the Cell Titer 96 Aqueous One Solution Cell Proliferation Assay reagent (Promega; # G3581; Madison, WI, USA) at 1:100 with medium, added the diluted reagent to the cells and incubated the cells for 3 h. Cell growth curves were plotted using GraphPad software GraphPad Prism 7.0 (GraphPad Software Inc., San Diego, USA).
The cells were plated in 6-well plates (7.5
For the reporter assay, the cells were transiently transfected with the
CST1 luciferase reporter plasmid (0.1 µg/well; Genecopoeia;
HPRM18606-PG04, Rockville, MD, USA) and SPI1 expression plasmid (0.1 µg/well; Genecopoeia;
EX-Z4319-Lv105) or empty vector (EV) in 96-well plates. Secreted Alkaline
Phosphatase (SEAP) as an internal control (0.01 µg/well; Genecopoeia;
pEZX-PA01). Forty-eight hours later, the luciferase assay was performed using the
Secrete-Pair
Lentiviruses vector plasmids from the GeneCopoeia company (plasmids
EX-A3184-Lv105 and EX-NEG-Lv105) were used to create stably expressing
CST1 or the vector cell lines, as well as stably knock down shRNA
plasmids (HSH003349-21-LVRU6P, HSH003349-22-LVRU6P, HSH003349-23-LVRU6P,
HSH003349-24-LVRU6P and CSHCTR001-LVRU6P) were used to construct stable
expression cell lines. The targets of CST1 shRNA sequences we used were
HSH003349-22-LVRU6P (KD22) 5
After culturing cells with DMEM without serum for 24 h, the conditioned medium
(CM) was collected and concentrated tenfold using an ultrafiltration device (from
10 mL to 1 mL) and mixed with CST1 antibody (diluted 1:500; Proteintech,
USA) or isotype control (Southern Biotech; Cat: 0103-01) overnight at 4
To obtain cell supernatants cultured in conditioned media, a total of 1
For the metastasis assay, female BALB/c nude mice aged 5 weeks old were
purchased from Guangdong Laboratory Animal Center (Guangdong, China), and
spontaneous lymph node (LN) metastasis experiments were conducted as previously
reported [33]. Briefly, 2
For the tumorigenicity experiment, 2
The RNA-sequence data, microarray data and their corresponding clinical information were downloaded from TCGA and GEO databases (https://www.ncbi.nlm.nih.gov/gds), including 260 samples from the TCGA database (80 normal samples and 180 ESCA samples) and 238 samples from GEO datasets GSE53624 and GSE53625 (119 normal samples and 119 ESCA samples).
The ESCA samples were divided into CST1 high expression or CST1 low expression groups based on the cut off value with the median expression level. Kaplan‒Meier survival analysis with the log-rank test was conducted to evaluate the difference in overall survival time between the two groups. The univariate and multivariate Cox regression were used to predict prognostic ability of CST1 expression, age, and grade based on samples from the TCGA and GEO databases. Hazard ratios (HRs) and 95% confidence intervals (CIs) were calculated accordingly. We constructed a nomogram based on CST1 expression, survival status and clinical characteristics to predict ESCC patient prognosis by R software. The time-dependent receiver operating characteristic (ROC) curve and area under the curve (AUC) were constructed to exam the prognostic predictive value of CST1 by the R software (R Foundation for Statistical Computing, Vienna, Austria), and the specific procedures are similar to we previously published article [35].
Data were analyzed with SPSS (version 21.0) statistical software (IBM Inc., NY,
USA). GraphPad Prism 7.0 (GraphPad Software Inc., San Diego, CA, USA) was used to
visualize the data. For correlation analysis, the Pearson chi-square test was
used to analyze the correlations between CST1 and clinical parameters. A
two-tailed Mann‒Whitney U test was used to compare differences between two groups
of data. The Kaplan‒Meier method with the log-rank test and the Cox multivariate
proportional hazards regression model were applied for survival analysis, and
p
Our research focused on early-stage ESCC to identify new diagnostic or
prognostic biomarkers; therefore, we tested the RNA profiles of three pairs of
self-paired, early-diagnosis, untreated ESCC tissue and adjacent tumor tissue by
RNA sequencing. Further analysis showed differentially expressed genes in a
heatmap (Fig. 1A), where CST1 ranked first in overexpression among all
the gene profiles. Then, we explored the expression of CST1 in ESCC in
many databases. In the UALCAN database (http://ualcan.path.uab.edu/) [36], a
differential expression heatmap showed that CST1 was one of the top 25
overexpressed genes in ESCC (Supplementary Fig. 1A), and the violin
figure based on TCGA database indicated that CST1 expression was
significantly higher in the 180 samples in ESCA group than the 80 samples in the
normal group, p
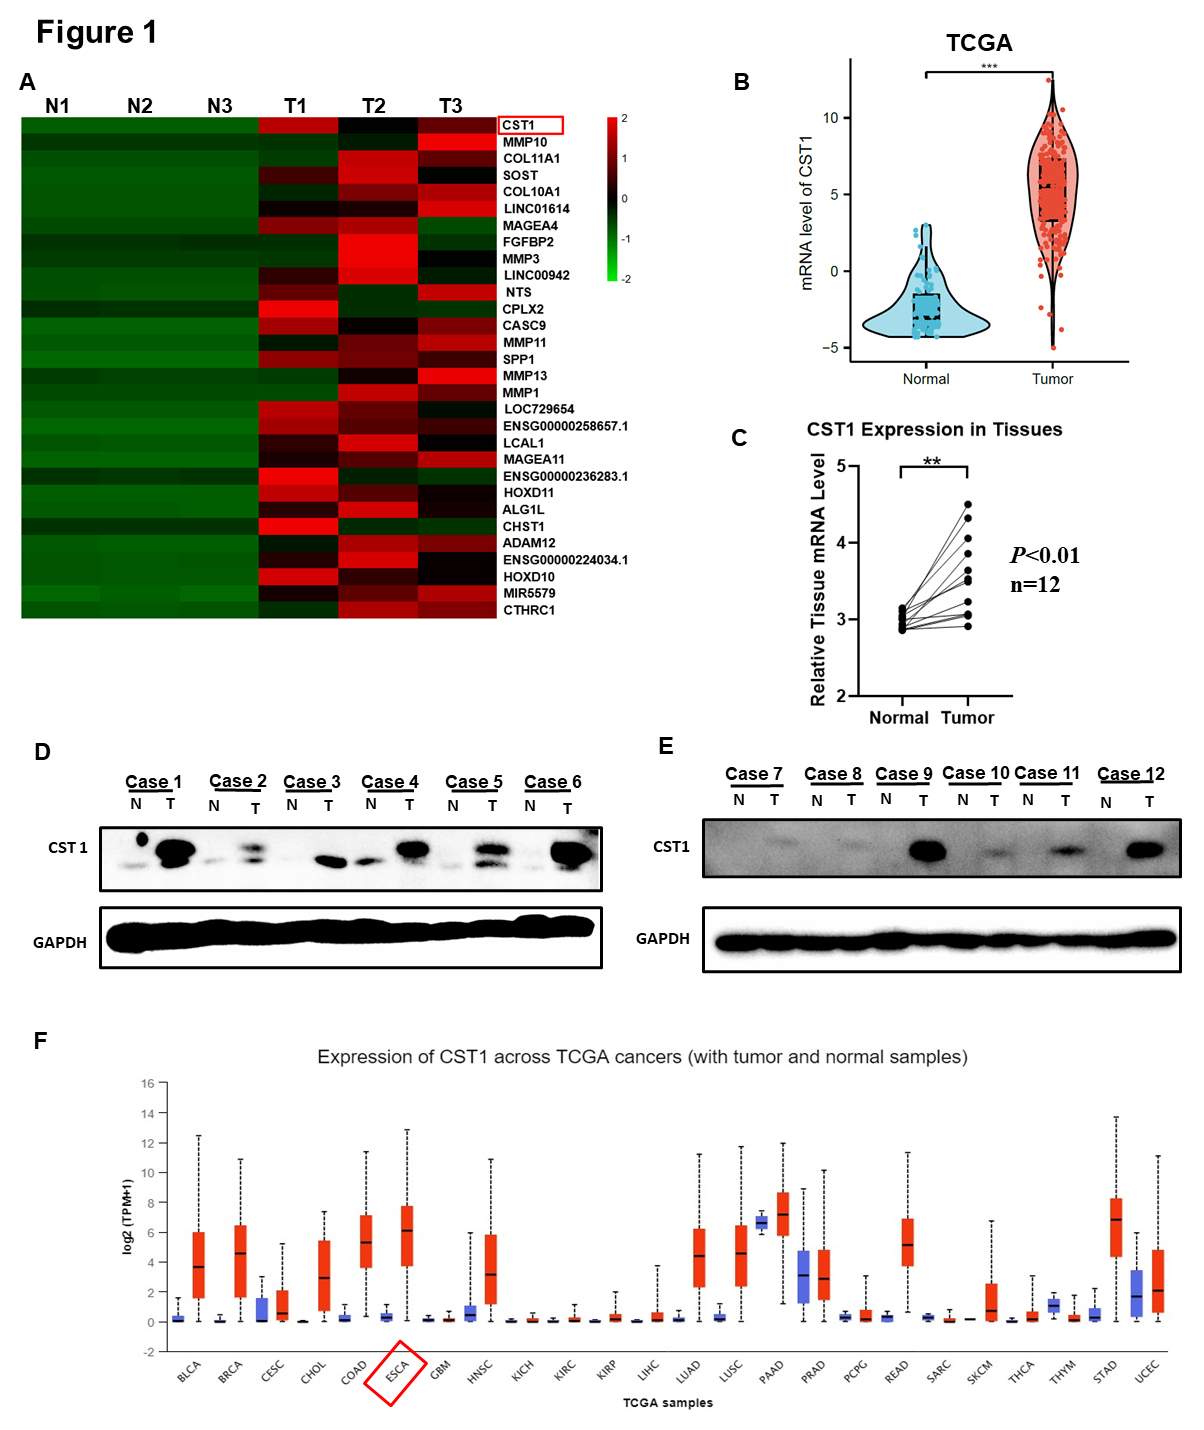 Fig. 1.
Cystatin SN (CST1) significantly up-regulated in esophageal squamous cell carcinoma (ESCC). (A) A
differential expression heatmap showed the top 25 overexpressed genes in three
self-paired ESCC and tumor-adjacent tissues based on the RNA-sequencing. (B) The
mRNA level of CST1 in 180 esophageal cancer (ESCA) and 80 normal tissues in The Cancer Genome Atlas (TCGA) database,
p
In the Oncomine database (https://www.oncomine.com/) boxplots, the expression of
CST1 in multiple cancers is shown in Supplementary Fig.
1D. Among those cancers, esophageal cancer showed the highest mean expression of
CST1. In the ONCOMINE database, data from different investigators also
showed that the expression level of CST1 in ESCC tissues was higher than
that in normal tissues, and the difference was statistically significant,
p
Thus, we conducted IHC to detect the expression levels of CST1 in 220 formalin-fixed, paraffin-embedded ESCC and 19 normal tissue samples. CST1 was mainly expressed in tumor tissues and was absent in normal tissues (Fig. 2A). The median value of the immunohistochemical score was used as the cutoff value, and samples were divided into high and low expression groups. The correlations between CST1 and clinical parameters are shown in Table 2. As shown in Table 2, a total of 118 of 220 (53.64%) ESCC tissue samples exhibited high CST1 expression, while only 2 of 19 (10.53%) normal tissue samples showed high CST1 expression. More importantly, Kaplan‒Meier survival analysis was performed to analyze the correlations between the expression of CST1 and clinical parameters, which showed that ESCC patients with higher CST1 expression had significantly shorter overall survival (OS) and disease-free survival (DFS) than ESCC patients with low expression (Fig. 2B,C). Moreover, the results indicated that the expression of CST1 may be correlated with lymph node stage and TNM stage. Survival curves for the entire ESCC patient cohort stratified by combinations of CST1 expression and clinical stage (Fig. 2D) showed that CST1 expression combined with TNM stage (TNM I/II as early-stage ESCC and TNM III/IV as advanced-stage ESCC) could also predict the prognosis of ESCC patients, with high CST1 expression predicting poor outcomes. Additionally, CST1 combined with tumor differentiation yielded similar results (Fig. 2E). Furthermore, high expression of CST1 was associated with dismal OS when combined with tumor size (Fig. 2F) or lymph node stage (Fig. 2G). In addition, advanced lymph node stage tissues had a higher CST1 expression level than normal and early-stage tissues (Fig. 2G). Moreover, univariate and multivariate Cox regression analyses indicated that CST1 expression and lymph node stage could be independent predictors of ESCC prognosis (Table 3). In addition, survival analysis using clinical parameters revealed that most of the parameters had an impact on the OS of ESCC patients, including TNM stage, lymph node stage, tumor size, age, vascular invasion, family history, and body mass index (BMI). To further investigate the prognostic value of CST1 in different clinical parameter subgroups, we analyzed high and low CST1 expression subgroups within different clinical parameters. In the subgroup analyses, high expression of CST1 was still associated with a poorer prognosis for ESCC (Table 3).
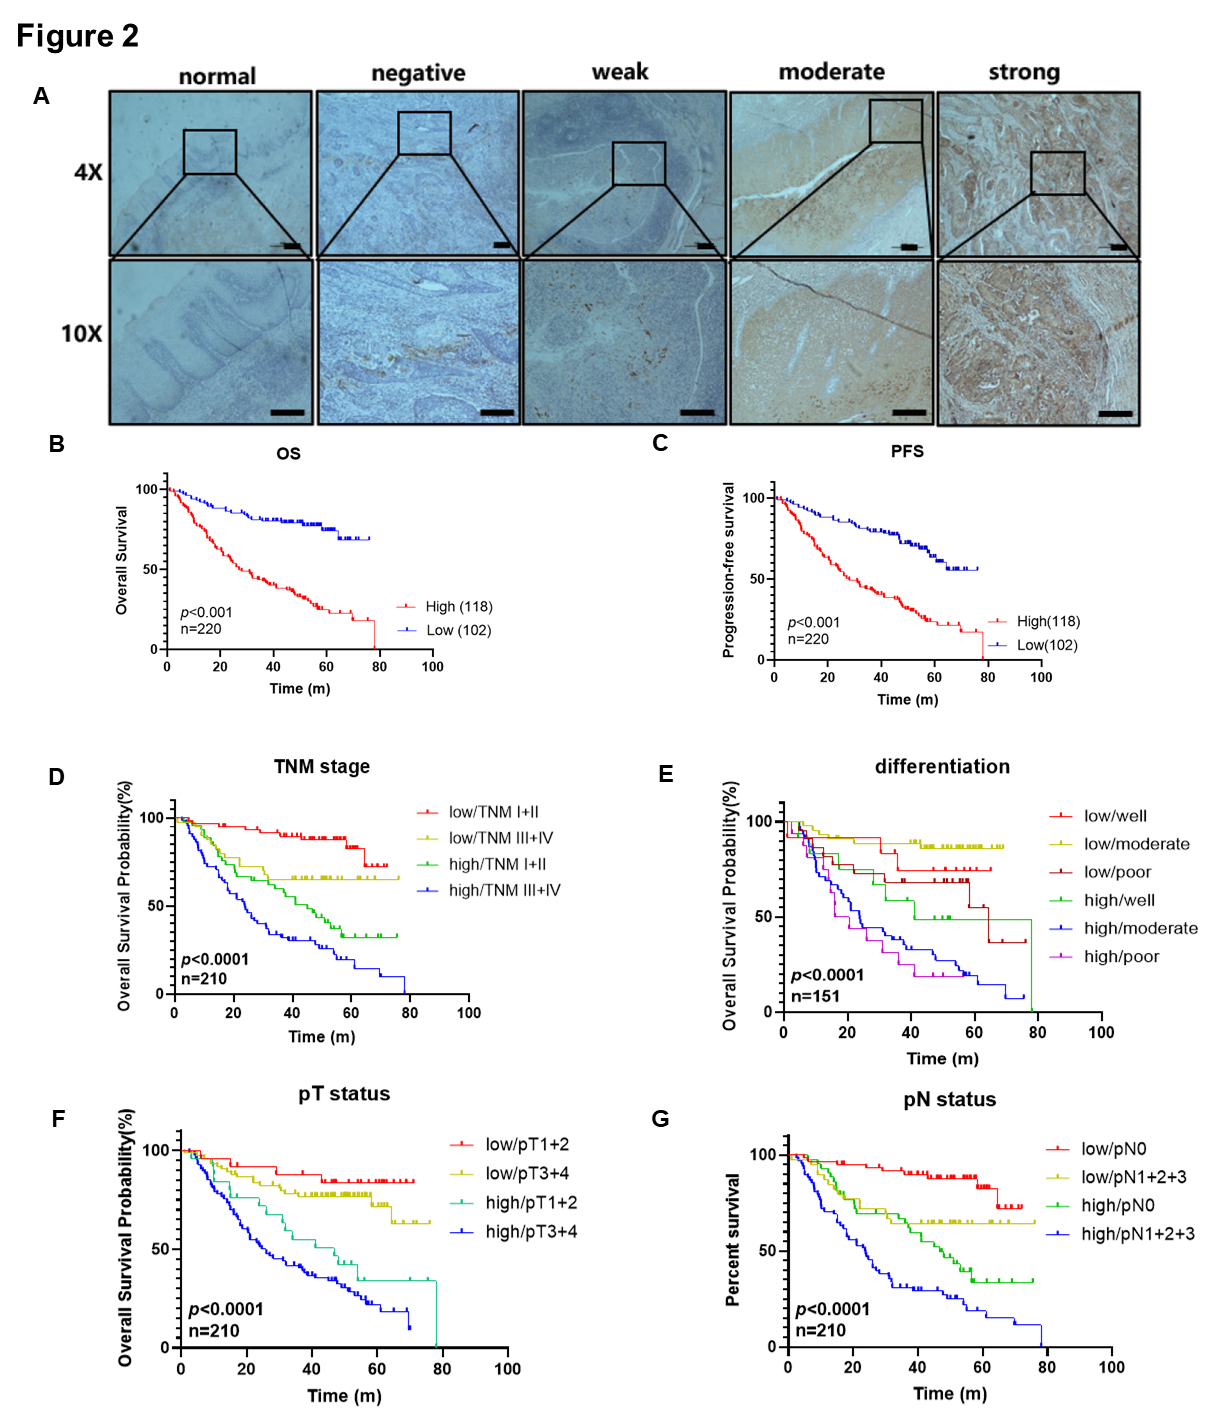 Fig. 2.
Up-regulated CST1 was associated with relatively poor
survival based on immunochemistry. (A) CST1 was mainly expressed in
tumor tissues and rarely absent in normal tissues by Immunohistochemical
staining. Negative CST1 staining in normal esophagus epithelium
(negative control), negative, weak, moderate and strong staining of CST1
in ESCC cytoplasm,
| Variables | CST1 expression | |||||
| Cases (%) | Low expression | High expression | p value | |||
| Age |
||||||
| 124 (56.4%) | 53 | 71 | 1.184 | 0.277 | ||
| 96 (43.6%) | 49 | 47 | ||||
| Gender | ||||||
| Male | 177 (80.5%) | 85 | 92 | 0.69 | 0.406 | |
| Female | 43 (19.5%) | 17 | 26 | |||
| BMI | ||||||
| BMI |
19 (12.6%) | 9 | 10 | 4.042 | 0.133 | |
| 18.5–24 | 101 (66.9%) | 48 | 53 | |||
| BMI |
31 (20.5%) | 21 | 10 | |||
| Smoking status | ||||||
| No | 50 (33.1%) | 22 | 28 | 1.754 | 0.185 | |
| Yes | 101 (66.9%) | 56 | 45 | |||
| Alcohol consumption | ||||||
| No | 81 (53.6%) | 40 | 41 | 0.361 | 0.548 | |
| Yes | 70 (46.4%) | 38 | 32 | |||
| Family history | ||||||
| No | 135 (89.4%) | 72 | 63 | 1.436 | 0.231 | |
| Yes | 16 (10.6%) | 6 | 10 | |||
| Tumour location | ||||||
| Upper | 16 (10.6%) | 11 | 5 | 4.14 | 0.126 | |
| Middle | 93 (61.6%) | 50 | 43 | |||
| Lower | 42 (27.8%) | 17 | 25 | |||
| Differentiation | ||||||
| Well | 24 (15.9%) | 12 | 12 | 0.794 | 0.672 | |
| Moderate | 89 (58.9%) | 44 | 45 | |||
| Poor | 38 (24.2%) | 22 | 16 | |||
| pT status | ||||||
| T1 | 12 (5.7%) | 7 | 5 | 0.745 | 0.863 | |
| T2 | 38 (18%) | 18 | 20 | |||
| T3 | 153 (72.5%) | 70 | 83 | |||
| T4 | 8 (3.8%) | 4 | 4 | |||
| pN status | ||||||
| N0 | 104 (49.3%) | 60 | 44 | 11.558 | 0.009 | |
| N1 | 75 (35.5%) | 29 | 46 | |||
| N2 | 24 (11.4%) | 6 | 18 | |||
| N3 | 8 (3.8%) | 4 | 4 | |||
| TNM stage | ||||||
| I | 23 (11.0%) | 13 | 10 | 7.911 | 0.048 | |
| II | 82 (39.0%) | 46 | 36 | |||
| III | 100 (47.6%) | 37 | 63 | |||
| IV | 5 (2.4%) | 3 | 2 | |||
| Vascular invasion | ||||||
| No | 121 (80.1%) | 65 | 56 | 1.038 | 0.308 | |
| Yes | 30 (19.9%) | 13 | 17 | |||
| Nerve tract invasion | ||||||
| No | 112 (74.2%) | 58 | 54 | 0.003 | 0.957 | |
| Yes | 39 (25.8%) | 20 | 19 | |||
Abbreviations: CI, confident interval; HR, hazard ratio; OR, odds ratio; BMI,
Body Mass Index; TNM, T is tumour site and size, N is lymph node involvement, M
is distant metastatic spread.
| Variables | Univariate analysis | Multivariate analysis | ||
| HR (95% CI) | p value | HR (95% CI) | p value | |
| CST1 expression | 4.373 (2.771, 6.900) | 4.94 (2.737, 8.916) | ||
| Age | 1.546 (1.040, 2.297) | 0.031 | 1.353 (0.811, 2.258) | 0.246 |
| Gender | 0.768 (0.468, 1.261) | 0.297 | - | - |
| Differentiation | 1.331 (0.926, 1.914) | 0.122 | - | - |
| pT status | 1.550 (1.081, 2.223) | 0.017 | 1.419 (0.249, 8.105) | 0.694 |
| pN status | 1.733 (1.412, 2.126) | 3.434 (1.061, 11.106) | 0.039 | |
| TNM stage | 1.826 (1.349, 2.473) | 0.484 (0.130, 1.796) | 0.278 | |
HR, Hazard ratio; CI, confidence interval.
Furthermore, we analyzed the relationship between the risk score and patient follow-up time, and data from the 180 samples in TCGA database suggested that high CST1 expression had an impact on increasing the survival time of ESCA patients (Fig. 3A). In addition, high expression of CST1 was closely associated with poor OS in ESCA patients (Fig. 3B, Supplementary Fig. 1G). The mRNA expression level of CST1 in advanced clinical stage III/IV disease was higher than that in early stage I/II disease (Supplementary Fig. 1H). Data from TCGA indicated that univariate and multivariate Cox regression analyses indicated that CST1 expression, age and clinical stage could be independent predictors of ESCA prognosis (Fig. 3C,D). Hereafter, a nomogram based on these independent prognostic factors was constructed to predict the 1-, 3-, and 5-year survival probability for ESCA patients (Fig. 3E).
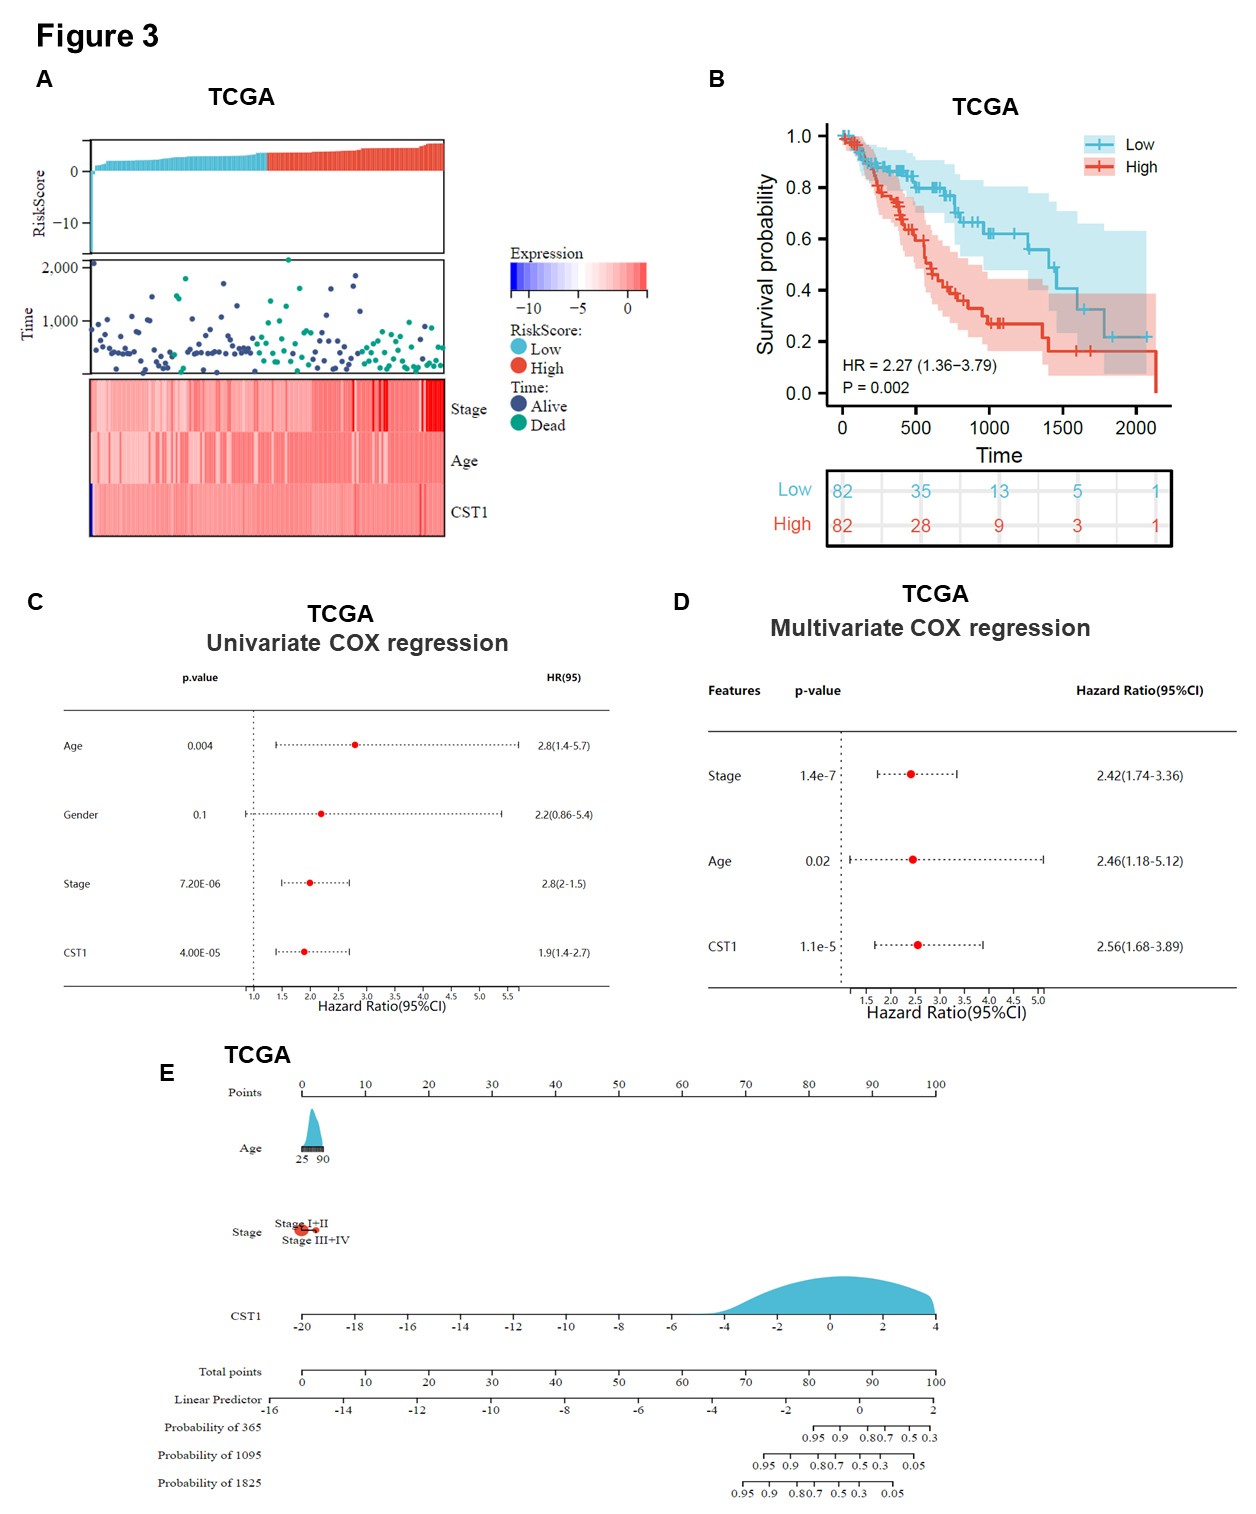 Fig. 3.
Up-regulated CST1 was associated with relatively poor survival based on bioinformatics analysis. (A) A model describing the relationship between different risk scores and follow-up time, events, and changes in gene expression in 180 ESCA samples based on TCGA database. (B) Survival curve showed high expression of CST1 was associated with relatively poor survival in ESCA based on TCGA database. (C,D) Data from TCGA indicated that univariate and multivariate Cox regression analyses indicated that CST1 expression, age and clinical stage could be independent predictors of ESCC prognosis. (E) A nomogram was constructed by integrating CST1 expression, age, clinical stage based on 180 ESCA samples in TCGA datasets.
We aimed to explore what causes the upregulation of CST1 in ESCC; thus,
we further investigated which transcription factors influence the transcriptional
activity of the CST1 gene. There are many online databases for
predicting gene transcription factors, including JASPAR
(https://jaspar.genereg.net/), hTFtarget [37], and GTRD [38]. We used the three
transcription factor databases described above to predict the specific TF that
can upregulate the transcription of the CST1 gene. The predicted TFs of
the three databases intersected; afterward, the results showed that two common
transcription factors were obtained, namely, AR (androgen receptor) and SPI1
(Spi-1 proto-oncogene) (Fig. 4A). Because our previous data revealed no
significant difference between CST1 and patient sex, we will investigate
the effect of another TF, SPI1, on CST1 transcriptional activity. Our
previous study demonstrated that AR protein levels were not significantly
upregulated in ESCC [39]. In addition, we analyzed the transcription
factor-binding sites (TFBS) of SPI1 in the CST1 promoter region in the
JASPAR database (Fig. 4B). Simultaneously, SPI1 can directly bind with the SPI1
binding element (SBE) in the CST1 promoter from the transcription start
site (TSS), 388 bp upstream of the TSS, and the sequence of SBE was
5
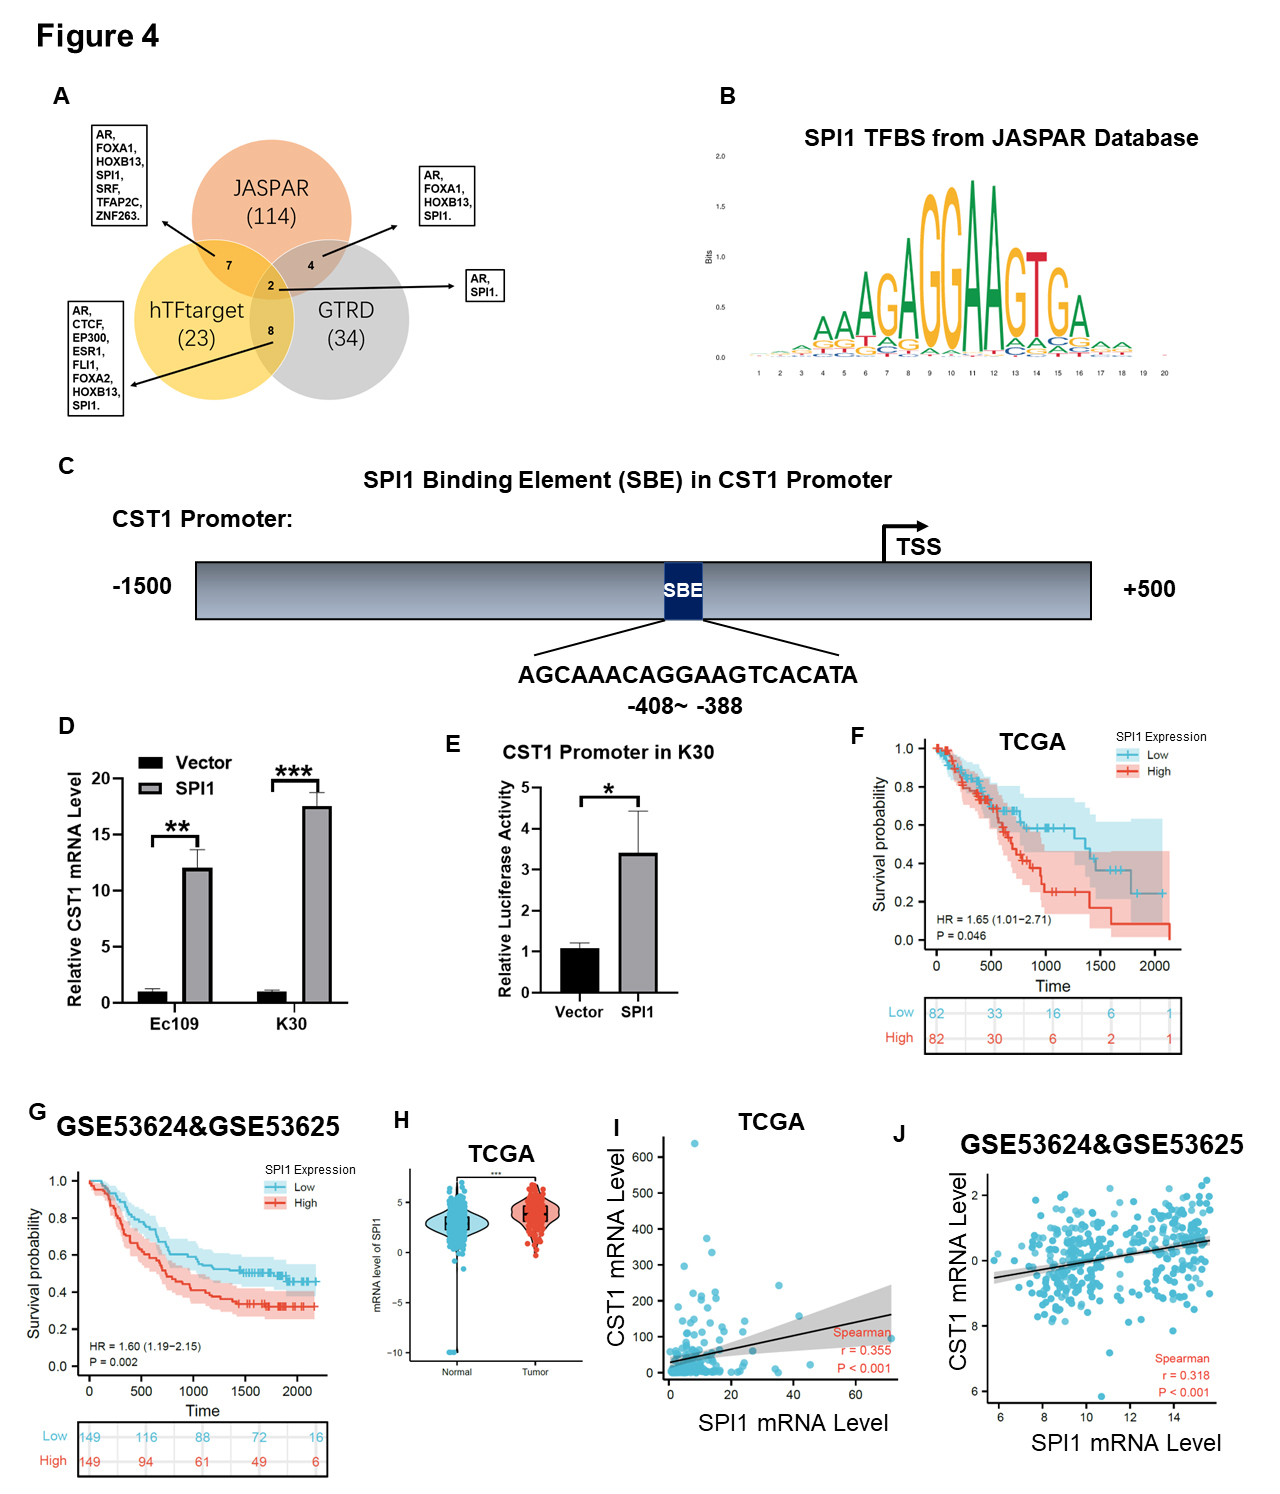 Fig. 4.
SPI1 can positively regulate the expression of CST1.
(A) Three online databases for predicting gene transcription factors (TF),
including JASPAR, hTFtarget and GTRD, were used to predict the TF which can
regulate CST1 expression in ESCC. (B) SPI1 was demonstrated as a TF to
regulate CST1 expression and its transcription factors binding site
(TFBS) in JASPAR database was showed. (C) SPI1 Binding Element (SBE) in
CST1 Promoter was 388 bases upstream away from the transcription start
site (TSS) in the picture. (D) The mRNA level of CST1 was significantly
upregulated in SPI1 overexpressed ESCC cells than in empty vector control. (E) In
a dual-luciferase reporter system experiment, CST1 promoter luciferase
activity was increased in SPI1 overexpressed ESCC cells than empty vector
control. (F,G) Survival curve showed high expression of SPI1 was associated with
relatively poor survival in ESCA based on TCGA and GEO database. (H) The mRNA
level of SPI1 in ESCA and normal tissue in TCGA database. (I,J) Further
bioinformatics analysis revealed that the mRNA level of CST1 and SPI1
was positively correlated based on 180 ESCA samples in TCGA database (r = 0.355,
p
In addition, we know that the expression of CST1 is significantly
elevated in ESCC, which may be transcriptionally regulated by SPI1. We further
explored SPI1 expression in ESCC and its prognostic value based on bioinformatics
analysis. Survival curves showed that a high expression of SPI1 was associated
with relatively poor survival in ESCA based on TCGA and GEO databases (Fig. 4F,G). The mRNA level of SPI1 in ESCA was significantly higher than that in
normal tissue in the TCGA database (Fig. 4H). Further bioinformatics analysis
revealed that the mRNA levels of CST1 and SPI1 were positively
correlated based on the 180 ESCA samples in TCGA database (r = 0.355, p
qPCR was used to detect the relative mRNA level and Western blotting was conducted to detect the protein levels of CST1 in 8 ESCC cell lines and one normal immortalized esophageal cell line, NE1 (Fig. 5A,B).
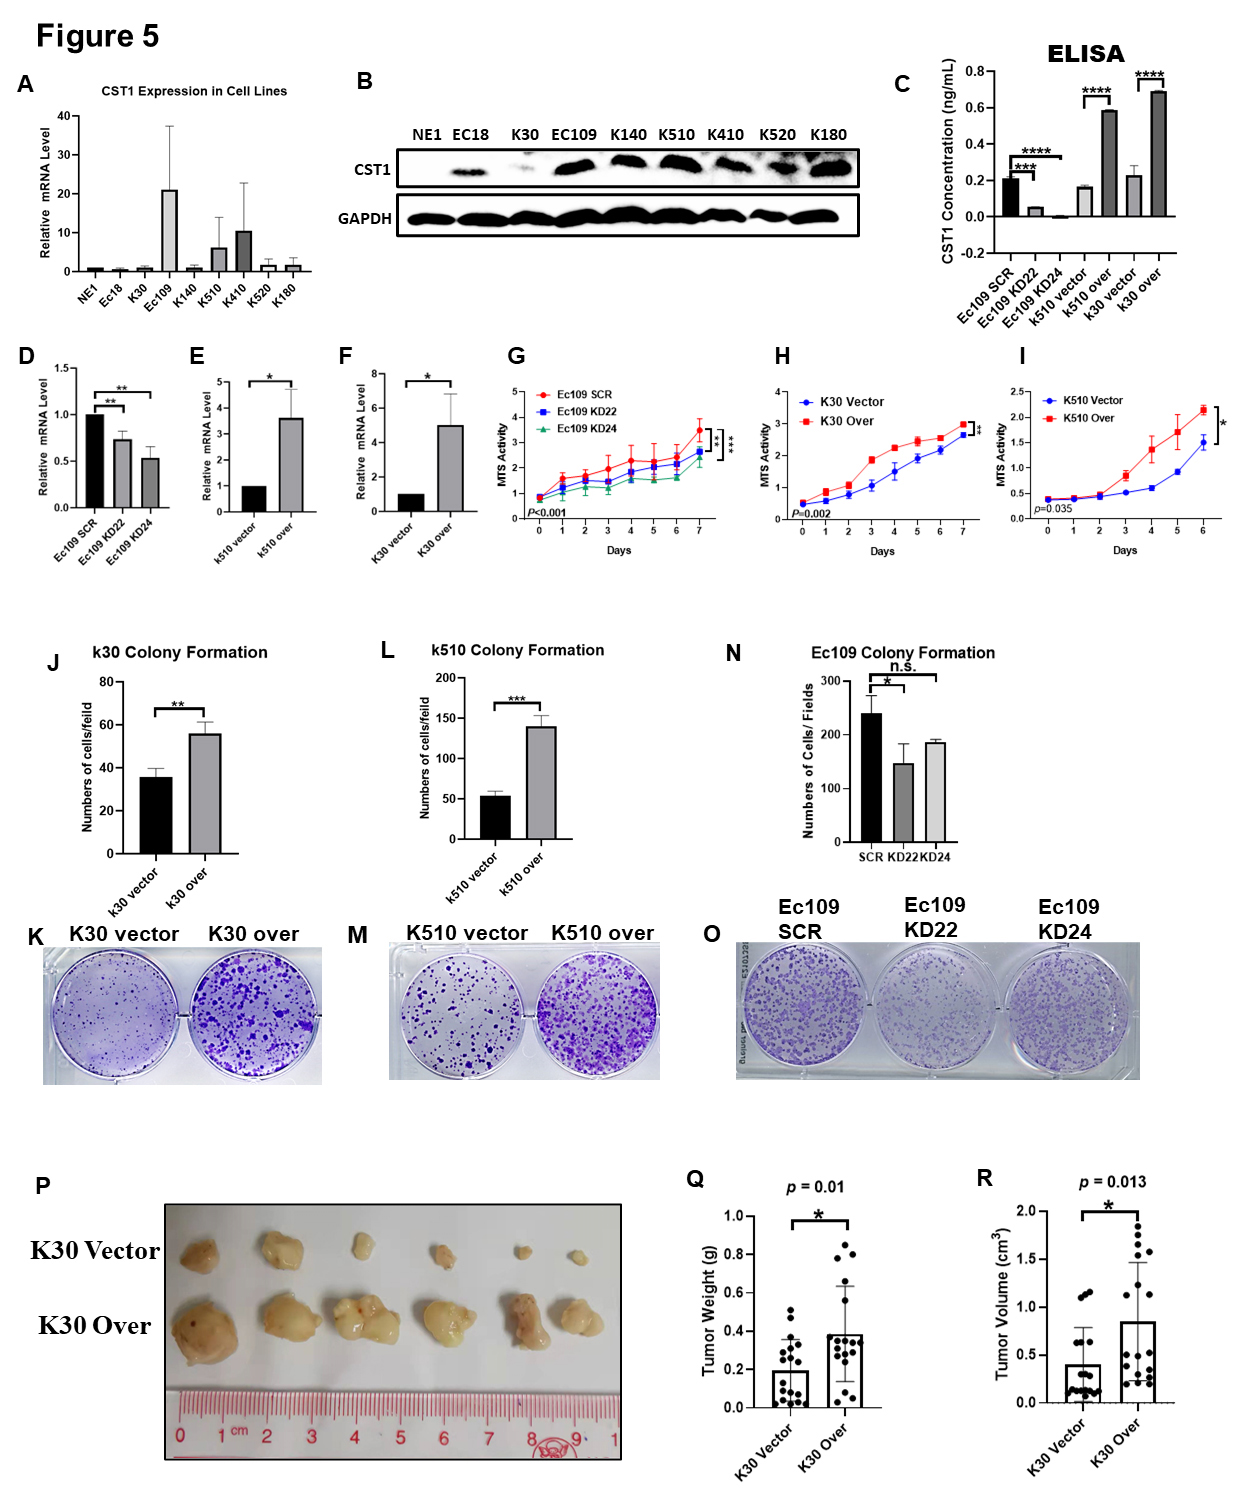 Fig. 5.
Over-expression of CST1 facilitated proliferation
in vitro and in vivo. (A,B) Relative mRNA and protein
level of CST1 in 8 ESCC cell lines and one normal immortalized esophagus
cell line NE1 were detected by qPCR and western blotting. (C–F) We constructed
stable CST1 knock-down cells in highly CST1 mRNA level Ec109
cell and stable over-expressed cells in low CST1 mRNA level K510 and K30
cells, by stable knocking down with CST1-targeted shRNA (knock down 22
and knock down 24; KD22 and KD24) and scrambled shRNA (SCR) as controls; and
stable over-expression by CST1 ORF plasmid and its empty vector as
control, respectively. These stable cell lines confirmed by real-time qPCR and
ELISA. (C) We detected the concentration of CST1 protein in
extracellular conditioned medium (CM) by Enzyme-Linked Immunosorbent Assay (ELISA) to conform the stable expression
cells construction system was working. (G–I) Knockdown of CST1
significantly suppressed the proliferation of Ec109 cells compared to the shSCR
control groups by MTS assays (G). By contrast, the overexpression of
CST1 promoted the proliferation of K510 and K30 cells (H,I). (J–O) Colony formation assays further verified that CST1
can accelerate the proliferation of ESCC cells. (P) In vivo experiment
showed CST1 can accelerate the proliferation of ESCC cells, and the
stable over-expression of CST1 in K30 cells and its control cells were
subcutaneously inoculated into BALB/C nude mice. (Q,R) The over-expression of
CST1 could significantly augmented the tumor growth in vivo
than its control group, and the tumor weight and volume of CST1
over-expression group were significantly higher than controls in K30 cells. Data
were presented as the mean
We constructed stable CST1 knockdown cells in Ec109 cells with high CST1 mRNA levels and stable overexpression cells in K510 and K30 cells with low CST1 mRNA levels by stably knocking down CST1-targeted shRNA (knock down 22 and knock down 24; KD22 and KD24) and scrambled shRNA (SCR) as controls and stable overexpression by the CST1 ORF plasmid and its empty vector as a control, respectively. Since CST1 protein is a secreted protein, we detected the concentration of CST1 protein in extracellular conditioned medium (CM) by ELISA to confirm that the stable expression cell construction system was working (Fig. 5C). These stable cell lines were confirmed by real-time qPCR (Fig. 5D–F). Then, MTS assays were performed to test the proliferation ability of tumour cells and we showed that knockdown of CST1 significantly suppressed the proliferation of Ec109 cells compared with the control groups (Fig. 5G). In contrast, the overexpression of CST1 promoted the proliferation of K510 and K30 cells in vitro (Fig. 5H,I). The results from colony formation assays further confirmed that CST1 can accelerate tumor proliferation in vitro (Fig. 5J–O).
To further investigate whether CST1 affects cell proliferation in vivo, the overexpression of CST1 in K30 cells and its control cells was subcutaneously inoculated into BALB/C nude mice (Fig. 5P). The overexpression of CST1 significantly augmented tumor growth in vivo compared with that in the control group, and the tumor weight and volume of the CST1 overexpression group were significantly higher than those of the controls in K30 cells (Fig. 5Q,R). In addition, we examined the cell cycle and early apoptosis in CST1 knockdown and overexpressing stable cell lines by flow cytometry (FCM), and we found no significant difference in early apoptosis. However, we found cell cycle arrest in G0/G1 phase in CST1 stable knockdown cells (Supplementary Fig. 2A,B,F,H) with its control. The CST1 stable overexpressing cells (Supplementary Fig. 2C,D,G,I) with its control no significant difference in early apoptosis and cell cycle arrest. The cell cycle arrest biomarkers p53 did not seem to be obviously changed and cyclin D1 seems to down-regulated slightly in CST1 knockdown cells by Western blotting (Supplementary Fig. 2E).
To validate the role of CST1 in ESCC motility, a scratch healing assay was used to assess the regulatory effect of CST1 on migration. The results showed that wound closure occurred gradually 72 h after scratching, whereas this effect on wound healing was significantly reduced after CST1 knockdown in Ec109 cells (Fig. 6A,B) and significantly increased after CST1 overexpression in K30 and K510 cells (Fig. 6F,G; Supplementary Fig. 2J,K). The stable knockdown of CST1 in Ec109 cells significantly reduced the migratory (Fig. 6C,D) and invasive (Fig. 6C,E) abilities. Conversely, stable overexpression of CST1 in K510 and K30 cells yielded great enhancement of migration and invasive (Fig. 6H–K; Supplementary Fig. 2L,M) abilities compared with the control cells. These results proved that CST1 was involved in promoting migration and invasion.
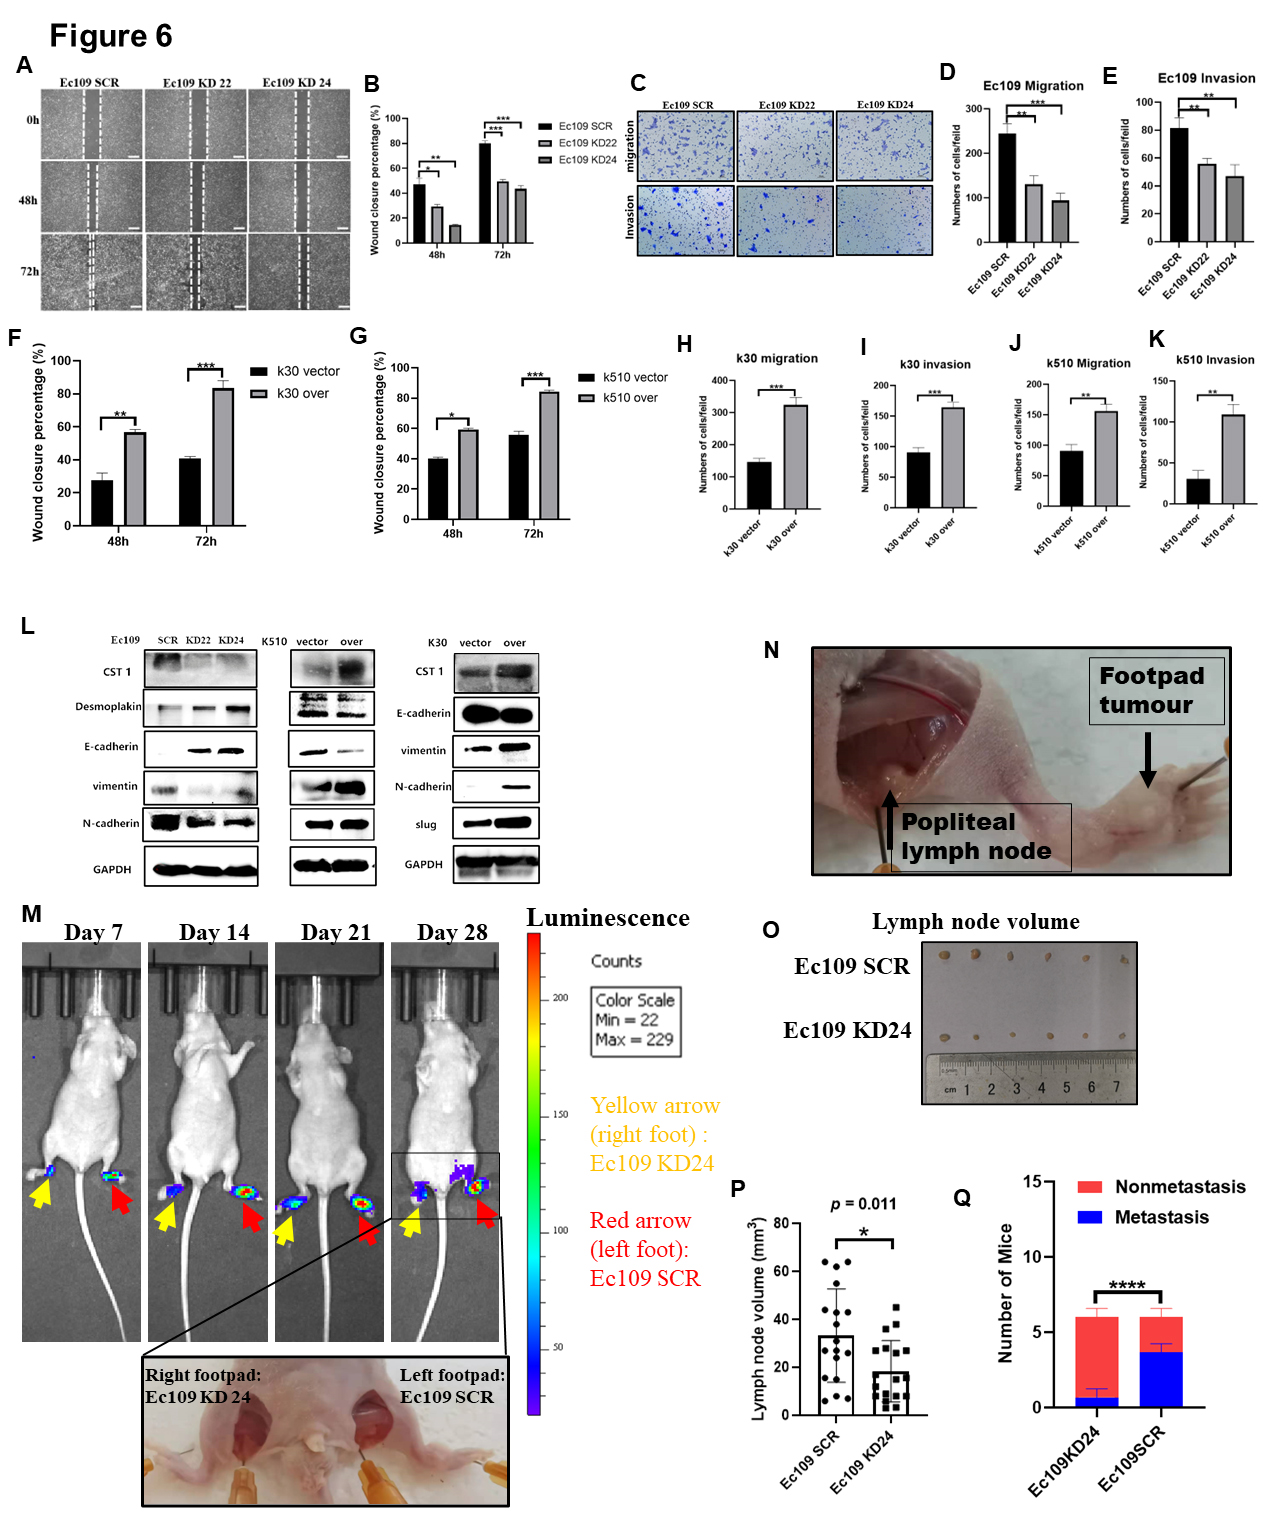 Fig. 6.
Overexpressed CST1 can promote invasion and migration
of ESCC cells in vitro and in vivo. (A,B) The scratch
healing assay was used to assess the regulation ability of CST1 in
migration. The results showed that wound closure occurred gradually 72 h after
scratching, whereas this effect of wound healing was significantly reduced after
CST1 knockdown in Ec109 cells. (C–E) The stable knocking down
CST1 cell Ec109 was significantly reduced the migratory (C,D) and
invasive (C,E) abilities. (F–G) The wound healing was significantly
increased after CST1 over-expression in K30 and K510 cells. (H–K)
Conversely, CST1 stable overexpression in K510 and K30 cells showed
great enhancement of migratory and invasive abilities compared with the control
cells. CST1 stimulated the EMT and accelerated motility of ESCC cells.
(L) CST1 knockdown downregulated the expression of mesenchymal markers
Vimentin, N-cadherin, and upregulated that of epithelial markers E-cadherin and
Desmoplakin in Ec109 cells by immunoblotting assays. In contrast, overexpressing
CST1 in K510 and K30 cells upregulated the expression of Vimentin and
N-cadherin and downregulated the expression of E-cadherin and Desmoplakin, as
well as that of EMT promoting transcription factors Slug. (N–M) Overexpressed
CST1 can promote metastasis of ESCC cells in vivo. (O,P) To
further explore whether CST1 modulates tumor metastasis in
vivo, the knockdown CST1 in Ec109 cells were transplanted into nude
mice via footpad injection, and we measured the fluorescence intensity of tumors
in the mouse feet once a week. After 4 weeks, the results showed a drastically
lower rate of popliteal lymph node metastasis in mice injected with the
CST1 knockdown cell lines Ec109-KD24 than in those injected with
Ec109-SCR cells. (Q) Examination of popliteal lymph node metastasis by measuring
lymph node volume and lymph node RNA extraction then running qPCR with using
specific primers for human HPRT, which do not cross-react with the corresponding
mouse gene. (Q) The result showed that popliteal lymph node metastasis was
markedly suppressed after the downregulation of CST1 in Ec109 cells.
Data were presented as the mean
Epithelial mesenchymal transition (EMT) plays crucial roles in tumor metastasis, and decreasing epithelial biomarkers and/or increasing mesenchymal biomarkers can enhance the motility of tumor cells [40]. We found that CST1 knockdown downregulated the expression of the mesenchymal markers Vimentin and N-cadherin and upregulated that of the epithelial markers E-cadherin and desmoplakin in Ec109 cells by immunoblotting assays. In contrast, overexpressing CST1 in K510 and K30 cells upregulated the expression of Vimentin and N-cadherin and downregulated the expression of E-cadherin and desmoplakin, as well as that of the EMT-promoting transcription factor Slug. Taken together, these results indicate that CST1 may stimulate EMT to accelerate the motility of ESCC cells (Fig. 6L).
To further explore whether CST1 modulates tumor metastasis in vivo, Ec109 cells with CST1 knockdown were transplanted into nude mice via footpad injection, and the fluorescence intensity of tumors in the mouse feet was measured once a week. After 4 weeks, the results showed a drastically lower rate of popliteal lymph node metastasis in mice injected with the CST1 knockdown cell line Ec109-KD24 than in those injected with Ec109-SCR cells (Fig. 6N,M). Examination of popliteal lymph node metastasis was performed by measuring lymph node volume (Fig. 6O,P) and lymph node RNA extraction and then running qPCR with specific primers for human HPRT, which do not cross-react with the corresponding mouse gene [34]. The results showed that popliteal lymph node metastasis was markedly suppressed after the downregulation of CST1 in Ec109 cells (Fig. 6Q).
CST1 was found to be highly expressed in ESCC cells and tissues. Thus,
we aimed to determine whether serum CST1 levels are consistent with
those in cells and tissues. As a secreted protein, to further study the role of
CST1 in the ECM, we conducted ELISA analysis of serum samples from 15
volunteers who underwent a physical examination (control) and total 87 ESCC
patients. Compared with that of the healthy population, the serum CST1
level of the ESCC patients was distinctly increased (Fig. 7A). Given that the
number of serum samples was limited, we observed only that the expression level
of CST1 in the serum was significantly associated with age and tumor
pathological differentiation (
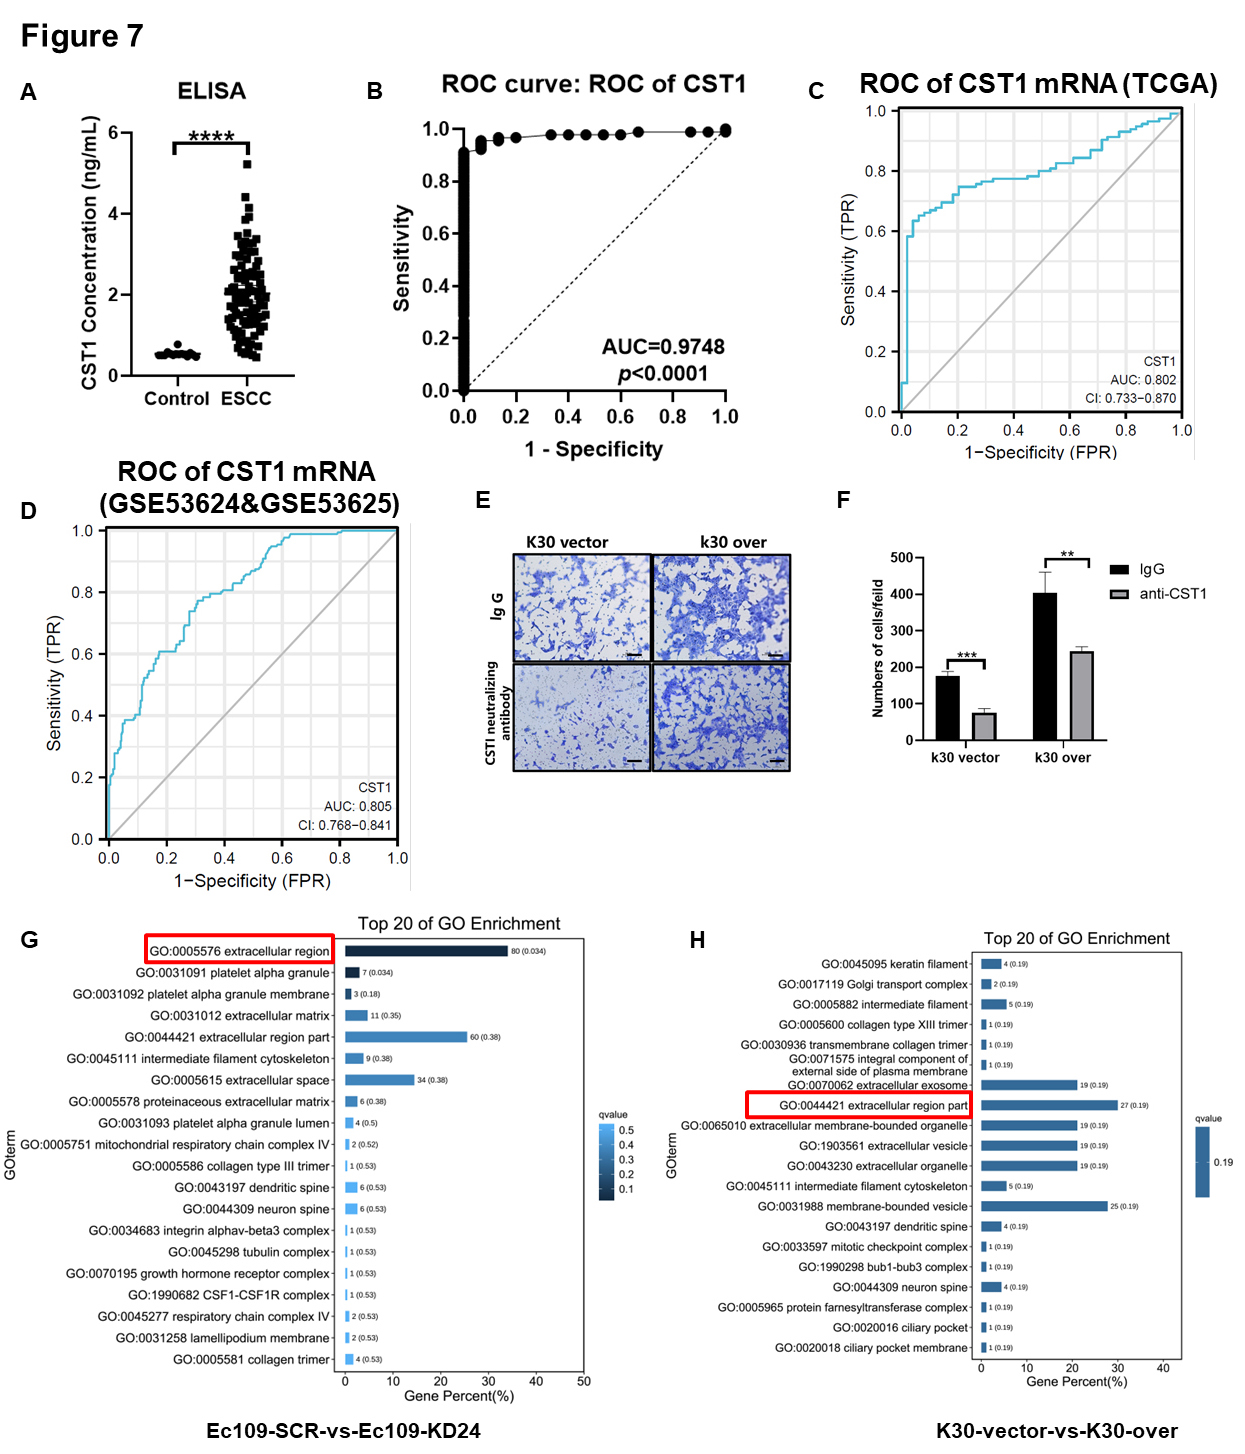 Fig. 7.
The serum secreted CST1 can be a potentially non-invasive early
diagnostic method for ESCC patients and the new neutralizing antibody drugs
target for ESCC treatment. (A) ELISA analysis of CST1 level in serum
samples from 15 volunteers who underwent a physical examination (control) and 87
ESCC patients. (B) The area under the curve (AUC) was 0.9748 (p
| Variables | CST1 expression | OR 95% CI | |||||
| Cases (%) | Low expression | High expression | p value | ||||
| Age | |||||||
| 20 (52.6%) | 7 | 13 | 9.079 | 0.004 | 9.286 (1.985, 43.444) | ||
| 18 (47.4%) | 15 | 3 | |||||
| Gender | |||||||
| Male | 22 (57.9%) | 13 | 9 | 0.031 | 1 | 1.123 (0.305, 4.135) | |
| Female | 16 (42.1%) | 9 | 7 | ||||
| Differentiation | |||||||
| Well | 1 (2.6%) | 1 | 0 | 6.566 | 0.038 | ||
| Moderate | 28 (73.7%) | 19 | 9 | 0.947 (0.029, 30.942) | |||
| Poor | 9 (23.7%) | 2 | 7 | 7.000 (0.166, 294.934) | |||
| pT status | |||||||
| T0 | 3 (7.5%) | 2 | 0 | 1.751 | 0.626 | ||
| T1 | 5 (12.5%) | 4 | 0 | 0.500 (0.007, 35.820) | |||
| T2 | 8 (20.0%) | 4 | 4 | 4.000 (0.134, 119.230) | |||
| T3 | 24 (60%) | 12 | 12 | 4.000 (0.163, 98.190) | |||
| pN status | |||||||
| N0 | 18 (47.4%) | 10 | 8 | 0.428 | 0.807 | ||
| N1 | 14 (36.8%) | 9 | 5 | 0.694 (0.165, 2.917) | |||
| N2 | 6 (15.8%) | 3 | 3 | 1.250 (0.196, 7.956) | |||
| TNM stage | |||||||
| 0 | 23 (11.0%) | 2 | 0 | 1.71 | 0.635 | ||
| I | 82 (39.0%) | 3 | 0 | 0.667 (0.009, 49.575) | |||
| II | 100 (47.6%) | 6 | 8 | 5.333 (0.202, 140.997) | |||
| III | 5 (2.4%) | 11 | 8 | 2.909 (0.115, 73.543) | |||
We found that CST1 in the ECM may play an important role in the invasive ability of ESCC cells; thus, we conducted an invasion assay by blocking CST1-neutralizing antibody in K30 CST1-overexpressing cells and empty vector control cells. The invasive ability of ESCC cells was significantly inhibited by antibody neutralization of CST1 secreted into the extracellular medium (Fig. 7E,F).
Moreover, two paired stable knockdown or overexpression CST1 cell lines (Ec109 KD24 and its SCR control; K30 overexpression and its empty vector control) were subjected to RNA sequencing. The RNA datasets obtained by RNA sequencing were used for differential analysis to obtain the intersection of genes with significant differences, and further cluster analysis and KEGG and GO analyses were performed. The top 20 GO terms showed that the function of CST1 may be related to the extracellular region (Fig. 7G,H).
Through in-depth analysis of RNA-sequencing data, we found that CST1 may interact with some members of the MMP family in the reactome, and the top 20 reactome enrichment terms are shown (Fig. 8A). Similarly, gene set enrichment analysis (GSEA) also showed differential gene enrichment in the collagen catabolic process pathway, which was closely related to the function of the MMP family (Fig. 8B).
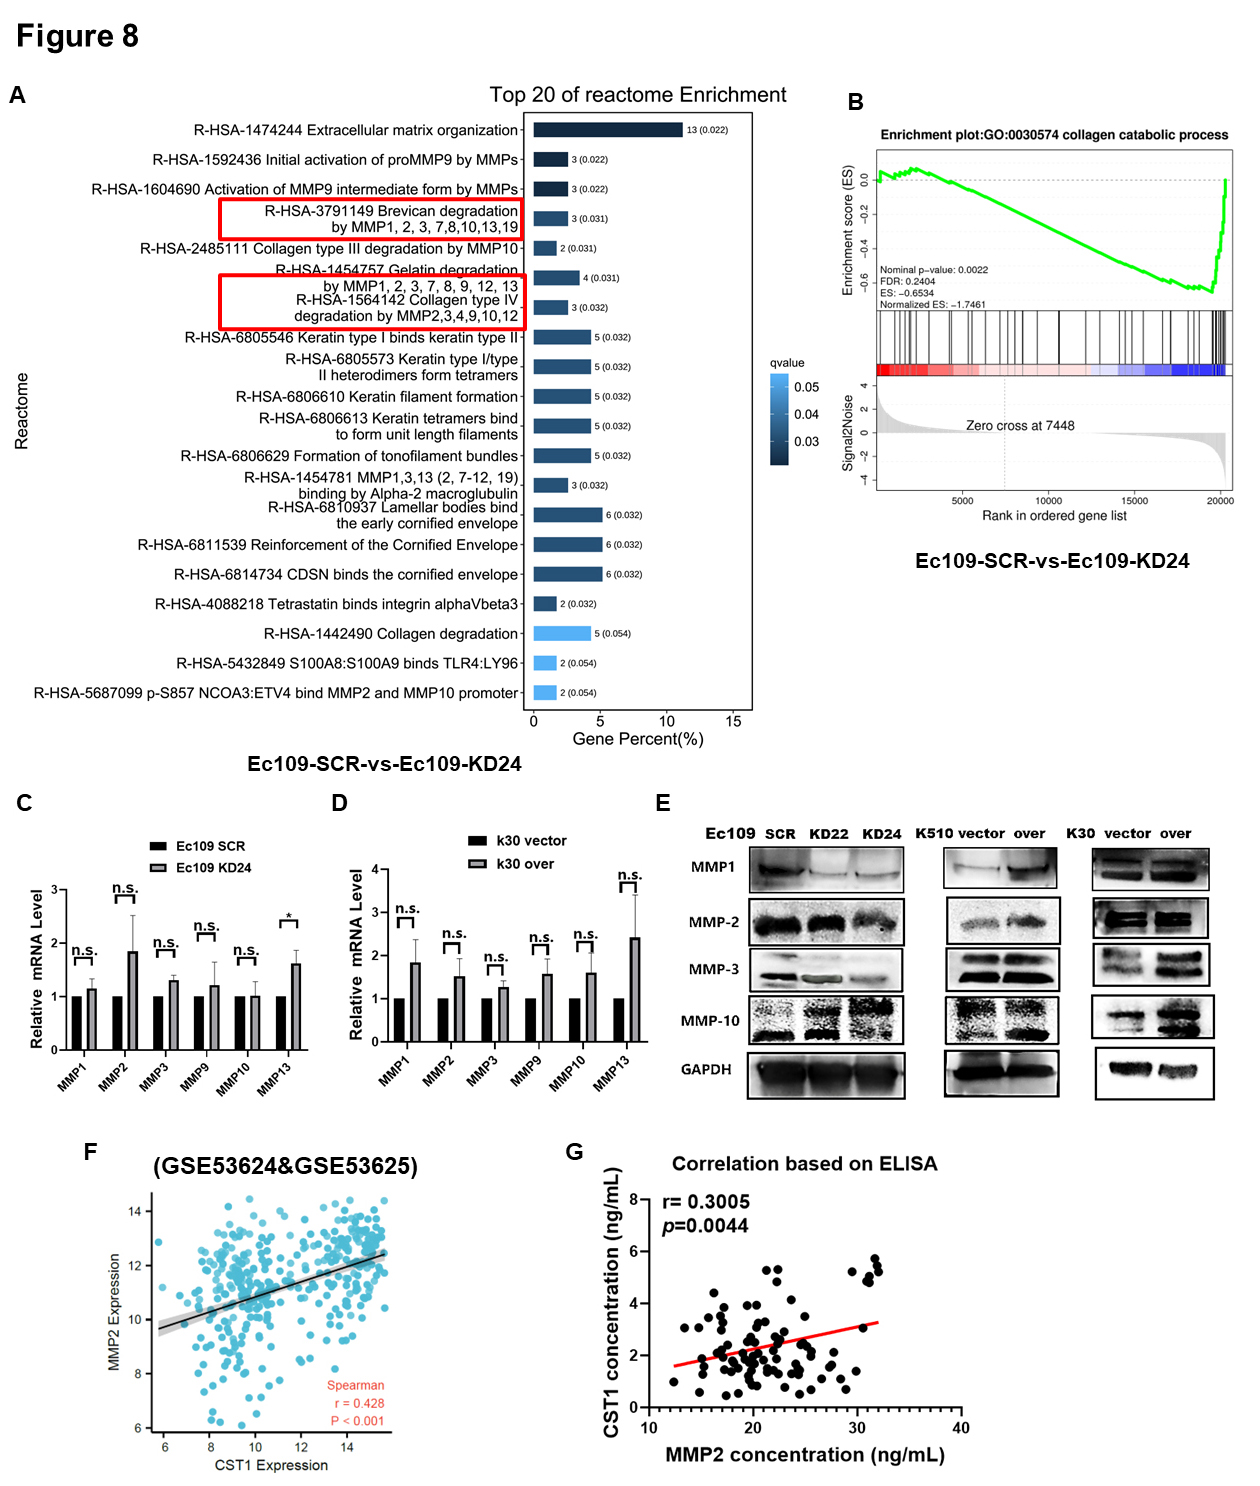 Fig. 8.
CST1 accelerated motility of ESCC cells by interacting
with matrix metalloproteinase (MMP) family proteins. (A) The top 20 reactome
enrichment terms were showed CST1 may interact with some members of the
MMP family in reactome based on RNA-sequencing. (B) Gene Set Enrichment Analysis
(GSEA) analysis also showed differential gene enrichment in collagen catabolic
process pathway, which was closely related to the function of the MMP family. (C,D) We want to explore how CST1 interact with these MMP family
members gene, then we detected the MMP1, MMP2, MMP3, MMP9, MMP10 and MMP13 mRNA
level by qPCR in Ec109 KD24 & Ec109 SCR cells and K30 over & K30 vector cells.
However, the results showed that CST1 had no apparent effect on
regulation the mRNA level of these members of the MMP family. (E) The protein
levels of the MMP family (MMP1, 2, 3, 10) were positively associated with
CST1 protein level, they decreased in the CST1 knock-down cells
and increased in the CST1 over-expressed cells. (F) Further
bioinformatics analysis revealed that the mRNA level of CST1 and MMP2
was positively correlated (r = 0.428, p
Therefore, we wanted to explore how CST1 interacts with these MMP family members, so we assessed the MMP1, MMP2, MMP3, MMP9, MMP10 and MMP13 mRNA levels by qPCR in Ec109 KD24 and Ec109 SCR cells and K30 overexpression and K30 vector cells. However, the results showed that CST1 had no apparent effect on the regulation of the mRNA level of these members of the MMP family (Fig. 8C,D). In contrast, the protein levels of the MMP family (MMP1, 2, 3, 10) were positively associated with CST1 protein levels, which decreased in the CST1 knockdown cells and increased in the CST1-overexpressing cells (Fig. 8E). Western blot results indicated that CST1 knockdown decreased the protein levels of MMP2 (pro-form, 72 kDa) and cleaved the MMP10 pro-form and turn it into the active form.
Further bioinformatics analysis revealed that the mRNA levels of CST1
and MMP2 were positively correlated (r = 0.428, p
We aimed to further investigate whether the CST1 proteins immunoprecipitated MMP2 in the ECM. We conducted immunoprecipitation (IP) experiments with a CST1 antibody and IgG control, and the IP samples were then subjected to SDS gel electrophoresis (Fig. 9A). We found that CST1 immunoprecipitated the band between molecular weights 65 and 75 kDa, which we suspect may be MMP2, as CST1 cleaves the MMP2 pro-form (72 kDa) to generate the MMP2 active form (62 kDa). Therefore, we sent the two IP samples (CST1 and IgG samples) for mass spectrometry to identify which proteins could be specifically immunoprecipitated by CST1. The mass spectrometry results are shown in the table, in which MMP2 can be immunoprecipitated specifically by CST1 (Fig. 9B,C). The coimmunoprecipitation (Co-IP) method was further used to verify that both CST1 and MMP2 physically bind to each other in Ec109 cells (Fig. 9D). We were curious about what role CST1 could play when physically combined with MMP2. Could CST1, a cysteine protease inhibitor, regulate the activity of MMP2 gelatinase? We therefore chose to perform gelatin zymography experiments to further validate the effect of CST1 on the activity of MMP2 gelatinase (Fig. 9E) [32]. Through the zymography assay, we found that CST1 can positively regulate the activity of MMP2 gelatinase. Knockdown of CST1 decreased MMP2 activities, while overexpression of CST1 increased MMP2 activity but had no obvious effect on the activity of MMP9 (Fig. 9E). The diagram shows that the transcription factor SPI1 upregulates the expression of the CST1 protein at the transcriptional level by binding to the CST1 gene promoter such that the expression level of the CST1 protein is increased, and the level of secreted CST1 protein is increased in the ECM. The CST1 protein can bind MMP2 and convert precursor MMP2 (pro-MMP2) into active MMP2 protein, leading to the decomposition of gelatin and remodeling of the ECM and further promoting the metastatic ability of ESCC cells (Fig. 9F).
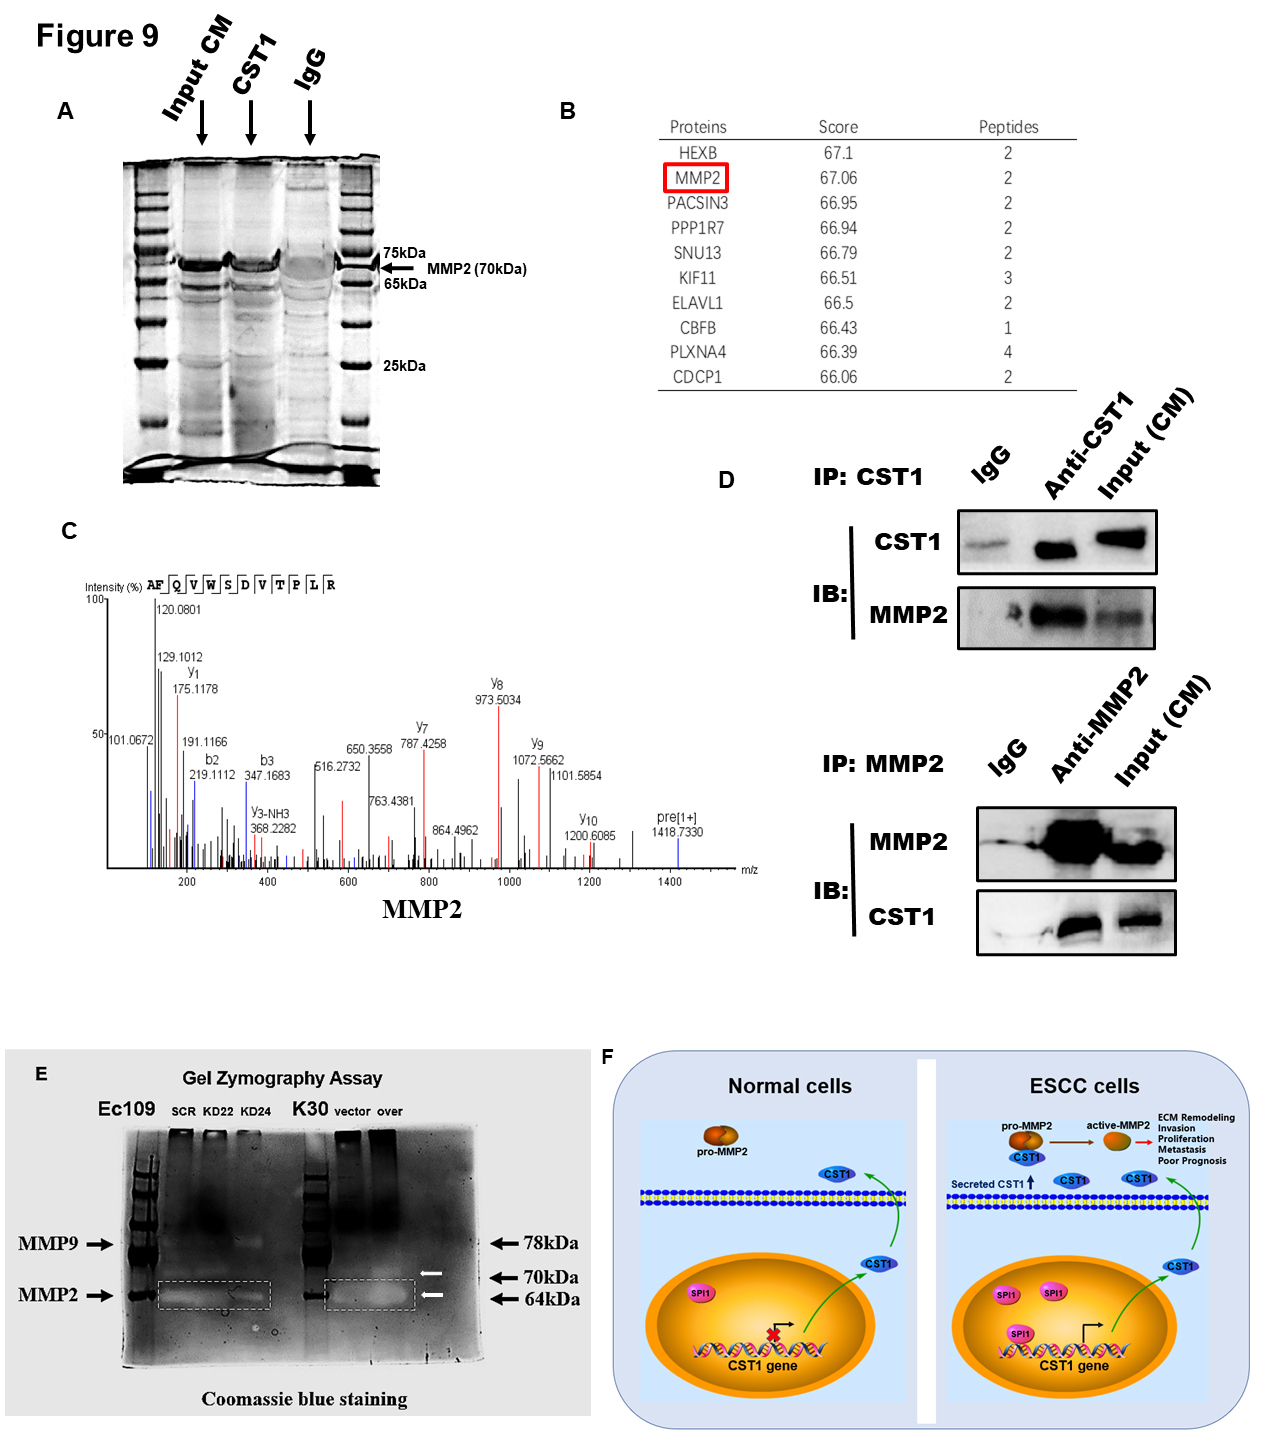 Fig. 9.
CST1 accelerated motility of ESCC cells by up-regulating the quantity and enzymatic activity of MMP2. (A) To further investigate whether the proteins of CST1 and MMP2 directly bind in the ECM. Then We conducted the immunoprecipitation (IP) experiments by CST1 antibody and IgG control, and then the IP samples were subjected to run the SDS gel electrophoresis (Coomassie blue staining). (B,C) We sent the two IP samples (CST1 and IgG samples) for mass spectrometry identification to see which proteins could be specifically immunoprecipitated by CST1. The result of mass spectrometry showed in the table, in which MMP2 can be immunoprecipitated specifically by CST1. (D) The co-immunoprecipitation (CO-IP) method was further used to verify that both CST1 and MMP2 bind to each other in Ec109 cells. (E) The gelatin zymography experiments were used to further validate the effect of CST1 on the activity of MMP2 gelatinase, and found CST1 acts as an activator of MMP2. (F) Diagram showed that the transcription factor SPI1 up-regulates the expression of CST1 protein at the transcriptional level by binding to the CST1 gene promoter, so that the expression level of CST1 protein is increased, and the level of secreted CST1 protein in the is increased in the extracellular matrix (ECM). The CST1 protein can bind MMP2 and convert precursor MMP2 (pro-MMP2) into active MMP2 protein, leading to decompose gelatin and remodel the extracellular matrix, and further promote the metastatic ability of ESCC cells.
In this study, we observed that CST1 was highly expressed in 87 ESCC patient serum samples compared with 15 healthy control serum samples based on ELISA. The ROC curve was generated to evaluate the diagnostic significance of the high expression of CST1 in the serum of ESCC patients; interestingly, CST1 can be used as a good diagnostic marker. Consistent with our study, some recent studies reported that CST1 could serve as a serological biomarker for the early diagnosis of ESCC [41], colorectal cancer [15], pancreatic cancer [20], and stomach cancer [42].
The current research on CST1 in ESCA seems to be contradictory. However, we found that upregulated CST1 can be an independent prognostic factor in ESCC, and the high expression of CST1 was associated with an unfavorable prognosis in ESCC, which was consistent with the results for CST1 in many other cancers [14, 15, 16, 22, 23]. Our findings were based on solid basic research and consistent with the results of open database research. Therefore, it is reasonable to conclude that CST1 acts as an oncogene in ESCC. Moreover, our findings highlighted that the expression of CST1 may be correlated with lymph node stage and TNM stage, which indicated involvement in tumor metastasis and malignant progression. One study reported that CST1 was also identified as a novel mediator of bone metastasis by global secretome analysis. Apart from the lymph nodes, the bone is one of the most common sites of distant metastasis by solid tumors [43]. However, there was no evidence that ESCC bone metastasis could be promoted by the high expression of CST1.
It is unclear what causes the upregulation of CST1 in ESCC. Therefore, we used three online databases to further predict some transcription factors that may regulate the transcriptional activity of CST1, and we found that the transcriptional activity of CST1 may be regulated by the transcription factor AR or SPI1. Because our previous data revealed no significant difference between CST1 and patient sex and that AR protein levels were not significantly upregulated in ESCC [39], we investigated the effect of another transcription factor, SPI1, on CST1 transcriptional activity. SPI1 is transcription factor located in nuclear, and its ETS-domain C binds to a purine-rich sequence known as the PU-box found near the promoters of target genes and regulates their expression in coordination with other transcription factors and cofactors (NCBI website). Previous studies indicate that upregulated SPI1 is associated with poor prognosis in breast carcinoma [44], while SPI1 inhibits invasion of hepatocellular carcinoma cells by suppressing insulin-like growth factor 2 expression [45]. Early studies showed that SPI1 was highly expressed in ESCA and was associated with poor prognosis [46, 47]. However, SPI1 can also be secreted by immune cells in the ECM and transferred to tumor cells in the form of exosomes to regulate tumor cell gene transcription. Upregulation of SPI1 was found to be associated with poor prognosis in patients suffering from colon cancer [48].
In the current study, our data demonstrated that transcription factor-elevated SPI1 can positively upregulate the transcriptional activity of the CST1gene. We suspected that SPI1 may bind to an element (388 bases upstream of the transcription start site) of the CST1 promoter region, but more experiments are needed to validate this hypothesis.
Using a variety of detection methods, we verified that CST1 is highly expressed in ESCC rather than normal tissue and acts as not only a potential biomarker for the early diagnosis of ESCC patients but also an independent predictor of poor prognosis in ESCC patients. CST1 is of practical importance in imparting an aggressive phenotype in ESCC cells, promoting cell proliferation and metastasis in vitro and in vivo, by contributing to epithelial-mesenchymal transition (EMT) and ECM remodeling. EMT plays crucial roles in tumor metastasis, and decreasing epithelial biomarkers and/or increasing mesenchymal biomarkers can enhance the motility of tumor cells [40].
The transition from the epithelial to mesenchymal phenotype results in reduced expression of epithelial markers, such as E-cadherin and desmoplakin, and increased expression of mesenchymal markers, such as vimentin, N-cadherin, and slug, contributing to cancer cell invasion and metastasis [49].
The TME plays a key role in the development and progression of ESCA and is composed of diverse cellular components, including not only cancer cells but also fibroblasts, immune cells and endothelial cells. Furthermore, one of the most important components of the TME is the ECM, including cytokines, glycoproteins, and glycosaminoglycans that surround tumor cells [50, 51].
Type I collagen has been shown to be upregulated in tumors, where it functions to fill the gaps between cancer cells and increase their stiffness, tensile strength and resistance to deformation [52, 53]. The tumor cells need biochemical and mechanical support from the collagen and gelatin network in ECM and also need degrade and remodel ECM for tumor progression and invasion. The MMP family is characterized by multidomain zinc-dependent endopeptidases and represents one of the major enzyme classes involved in ECM remodeling, whereas tumor cell-secreted MMPs are a very important feature that promote cancer invasion and dissemination [50, 54]. We found CST1-activated MMP2 mediates ECM degradation, a critical step for ESCC cell invasion and metastasis that is associated with a poor clinical outcome in ESCC patients. Another interrelated study showed upregulation of MMP14, which in turn activated MMP2, leading to the degradation of the ECM and increased invasion of ESCA cells [55].
In this study, we found that CST1 is associated with multiple members
of the MMP family. Up- or downregulated CST1 could increase or decrease
the protein levels of MMP1, MMP2, MMP3, and MMP10 in ESCC cells but did not
significantly change the corresponding gene levels. We also identified that
CST1 and MMP2 can physically bind to each other by means of mass
spectrometry and coimmunoprecipitation in the ECM. At the same time, we further
found that upregulated CST1 significantly promoted the enzymatic
activity of MMP2 and increased the motility ability of ESCC, which means that
CST1 could be an activator of MMP2. Taken together, our study further
confirmed that CST1 participates in ECM remodeling and promotes ESCC
metastasis in the TME by regulating the activity of MMP2. However, our study was
limited to CST1 secreted by tumor cells, and other studies suggested
that CST1 secreted by other cellular components in the tumor
microenvironment, such as fibroblasts, also had important prognostic significance
[56]. In agreement with our data, a single-cell sequencing-based study reported
that a specific population of CST1
The upregulated CST1, mediated by SPI1 in the promoter, can be a potentially prognostic biomarker and act as an oncogene in ESCC, which causes ECM remodeling and accelerates ESCC cell invasion and metastasis in vitro and in vivo by interacting with MMP2.
Not applicable.
Raw data of this study have been deposited to the Research Data Deposit database (https://www.researchdata.org.cn/) under accession number: RDDB2023563045.
FFL, JW and ZFZ performed most of in vitro assays. BJH designed the research study. CFY participated in the design of the project and collected paired samples of esophageal cancer and tumor-adjacent normal control. CFY also draft and revise the paper. BQL and MLF performed the statistics analysis. STL and TJH provided help in collecting patient samples and advice on the ELISA experiments and IHC. LXP and STZ preformed the in vivo assay and bioinformatics analysis. All authors contributed to editorial changes in the manuscript. All authors read and approved the final manuscript. All authors have participated sufficiently in the work and agreed to be accountable for all aspects of the work.
We obtained the human tissue research ethics approval document approved by the Ethics Committee of Sun Yat-sen University Cancer Center, and obtained the consent of the patients to participate. The ethics approval number is: SZR2021-068.
Not applicable.
This work was supported by the National Natural Science Foundation of China [No. 81972785, No. 81773162 and No. 81572901 to B.H.], the Provincial Natural Science Foundation of Guangdong, China [No. 2017A030313866 and No. 2022A1515012298 to B.H]. Open Funds of State Key Laboratory of Oncology in South China [No. HN2021-09].
The authors declare no conflict of interest.
References
Publisher’s Note: IMR Press stays neutral with regard to jurisdictional claims in published maps and institutional affiliations.