
- Academic Editor
Background: Serine hydroxymethyltransferase (SHMT) is a serine-glycine-one-carbon metabolic enzyme in which SHMT1 and SHMT2 encode the cytoplasmic and mitochondrial isoenzymes, respectively. SHMT1 and SHMT2 are key players in cancer metabolic reprogramming, and thus are attractive targets for cancer therapy. However, the role of SHMT in patients with renal cell carcinoma (RCC) has not been fully elucidated. We aimed to systematically analyze the expression, gene regulatory network, prognostic value, and target prediction of SHMT1 and SHMT2 in patients with kidney chromophobe (KICH), kidney renal clear cell carcinoma (KIRC), and kidney renal papillary cell carcinoma (KIRP); elucidate the association between SHMT expression and RCC; and identify potential new targets for clinical RCC treatment. Methods: Several online databases were used for the analysis, including cBioPortal, TRRUST, GeneMANIA, GEPIA, Metascape, UALCAN, LinkedOmics, and TIMER. Results: SHMT1 and SHMT2 transcript levels were significantly down- and upregulated, respectively, in patients with KICH, KIRC, and KIRP, based on sample type, individual cancer stage, sex, and patient age. Compared to men, women with KIRC and KIRP showed significantly up- and downregulated SHMT1 transcript levels, respectively. However, SHMT2 transcript levels were significantly upregulated in the patients mentioned above. KIRC and KIRP patients with high SHMT1 expression had longer survival periods than those with low SHMT1 expression. In patients with KIRC, the findings were similar to those mentioned above. However, in KICH patients, the findings were the opposite regarding SHMT2 expression. SHMT1 versus SHMT2 were altered by 9% versus 3% (n = 66 KICH patients), 4% versus 4% (n = 446 KIRC patients), and 6% versus 7% (n = 280 KIRP patients). SHMT1 versus SHMT2 promoter methylation levels were significantly up- and downregulated in patients with KIRP versus KIRC and KIRP, respectively. SHMT1, SHMT2, and their neighboring genes (NG) formed a complex network of interactions. The molecular functions of SHMT1 and its NG in patients with KICH, KIRC, and KIRP, included clathrin adaptor, metalloendopeptidase, and GTPase regulator activities; lipid binding, active transmembrane transporter activity, and lipid transporter activity; and type I interferon receptor binding, integrin binding, and protein heterodimerization, respectively. Their respective Kyoto Encyclopedia of Genes and Genomes (KEGG) pathways were involved in lysosome activity, human immunodeficiency virus 1 infection, and endocytosis; coronavirus disease 2019 and neurodegeneration pathways (multiple diseases); and RIG-I-like receptor signaling pathway, cell cycle, and actin cytoskeleton regulation. The molecular functions of SHMT2 and its NG in patients with KICH, KIRC, and KIRP included cell adhesion molecule binding and phospholipid binding; protein domain-specific binding, enzyme inhibitor activity, and endopeptidase activity; and hormone activity, integrin binding, and protein kinase regulator activity, respectively. For patients with KIRC versus KIRP, the KEGG pathways were involved in cAMP and calcium signaling pathways versus microRNAs (MiRNAs) in cancer cells and neuroactive ligand-receptor interactions, respectively. We identified the key transcription factors of SHMT1 and its NG. Conclusions: SHMT1 and SHMT2 expression levels were different in patients with RCC. SHMT1 and SHMT2 may be potential therapeutic and prognostic biomarkers in these patients. Transcription factor (MYC, STAT1, PPARG, AR, SREBF2, and SP3) and miRNA (miR-17-5P, miR-422, miR-492, miR-137, miR-30A-3P, and miR-493) regulations may be important strategies for RCC treatment.
Renal cell carcinoma (RCC) is the most common kidney malignancy, accounting for approximately 90% of all renal malignancies [1]. An estimated 431,288 new RCC cases and 179,368 cancer-related deaths were recorded globally in 2020 [2]. The three main pathological types of RCC are kidney renal clear cell carcinoma (KIRC), kidney renal papillary cell carcinoma (KIRP), and kidney chromophobe (KICH). KIRC is the most common type of RCC, accounting for 75–80% of RCC cases, followed by KIRP, accounting for 10–15% of cases [3]. In RCC, KICH accounts for approximately 4–5% of the cases [4]. RCC is the second most lethal urological malignancy [5]. In advanced RCC, the 5-year survival rate is only 11.7% [6]. Although alternative treatments exist, surgery is the gold standard for RCC treatment [7, 8]. However, 20–40% of patients with RCC experience relapse [9]. In addition, 90% of RCC recur within five years after surgery [10]. Cancer subtypes have different origins, histology, genetics, and epigenetic changes, and thus should be classified and treated as distinct cancers [11]. Hence, the systematic analysis of the targeted predictive and prognostic markers of patients with different RCC subtypes helps achieve precise treatment and improve the survival rates of these patients.
Serine hydroxymethyltransferase (SHMT) is a serine-glycine-one-carbon-metabolizing enzyme. SHMT catalyzes the conversion of serine to glycine, which transfers a one-carbon unit to tetrahydrofolate to produce 5,10-methylenetetrahydrofolate. This enzyme has cytoplasmic (SHMT1) and mitochondrial (SHMT2) isoforms [12], which are highly upregulated in cancer cells. Metabolic reprogramming mediated by SHMT isoenzymes is a hallmark of cancer that supports tumor growth, survival, and chemotherapy resistance [13]. Although normal cells rely on extracellular serine and glycine supplies, a substantial proportion of cancer patients are dependent to intracellular serine/glycine synthesis, thereby providing an attractive action target. Furthermore, one-carbon metabolism mediated by the folate co-factor promotes cancer growth and proliferation by supporting purine and pyrimidine biosynthesis, amino acid homeostasis, epigenetic maintenance, and redox defense [14, 15, 16, 17, 18]. Hence, modulating the expression of SHMT may be an effective cancer treatment strategy; this modulation is expected to be a target for blocking tumor progression and improving survival.
The role of SHMT in RCC pathogenesis is not well understood. Therefore, this study systematically analyzed the expression, gene regulatory network, prognostic value, and target prediction of SHMT1 and SHMT2 in patients with KICH, KIRC, and KIRP; elucidated the association between SHMT and RCC; and identified new potential targets for RCC therapy.
UALCAN (http://ualcan.path.uab.edu/analysis.html) is an online professional
database for analyzing tumor gene expression and methylation levels. We used the
UALCAN database to analyze the expression and methylation levels of
SHMT1 and SHMT2 in healthy individuals and patients with KICH,
KIRC, and KIRP. Furthermore, we used the Student’s t-test for
comparative analysis, and the difference was considered significant at a
p-value
Gene Expression Profiling (GEPIA) (http://gepia.cancer-pku.cn/index.html) is a free online platform for analyzing the correlation between gene expression levels and the pathological tumor stage and prognostic value. We used the GEPIA database to analyze the correlation between pathological tumor stage and the prognostic value of SHMT1 and SHMT2 expression levels in patients with KICH, KIRC, and KIRP. Comparative analysis was performed using Student’s t-tests, with a p-value less than 0.05 considered significant [19, 20].
cBioPortal (http://cbioportal.org) is an online professional database used to
analyze genetic alterations in tumors. We used the cBioPortal database to analyze
genetic alterations in SHMT1, SHMT2, and their
neighboring genes (NG). A total of 66, 446, and 280 KICH, KIRC, and KIRP samples
were analyzed, respectively, and mRNA expression z-scores were obtained relative
to all samples (log RNA Seq V2 RSEM) using a z-score threshold of
STRING (https://string-db.org/cgi/input.pl) is an online professional database for analyzing protein-protein interactions (PPI). We used the STRING database to build a low-confidence level (0.150) PPI network and screening criteria for species defined as humans. Finally, K-means cluster analysis was performed on SHMT1, SHMT2, and their NG [19, 20].
GeneMANIA (http://www.genemania.org) is a free professional tool for analyzing gene interactions. We used the GeneMANIA database to explore the interactions between SHMT1, SHMT2, and their altered NG [19, 20].
Metascape (https://metascape.org) is a professional-free tool for analyzing gene ontology (GO) functions and the Kyoto Encyclopedia of Genes and Genomes (KEGG) pathway enrichment. We used the Metascape database to analyze the GO function and KEGG pathway enrichment of SHMT1, SHMT2, and their altered NG in patients with KICH, KIRC, and KIRP [19, 20].
TRRUST (https://www.grnpedia.org/trrust/) is an online professional database that analyzes transcriptional gene regulators. We used the TRRUST database to analyze the transcriptional regulators of SHMT1, SHMT2, and their altered NG in patients with RCC.
LinkedOmics (http://www.linkedomics.org/) is a free online platform for analyzing microRNA (miRNA) target enrichment and differentially expressed genes associated with tumor genes. We used the LinkedOmics database to analyze the miRNA target enrichment and differentially expressed genes associated with SHMT1 and SHMT2 [19, 20].
TIMER (https://cistrome.shinyapps.io/timer/) is a specialized database for systematically analyzing tumor genes associated with infiltrating immune cells. We used the TIMER database to analyze the correlation between SHMT1 and SHMT2 expression and immune cell infiltration levels [19, 20].
We compared the SHMT1 and SHMT2 expression levels based on
sample type, individual cancer stage, sex, and patient age among patients with
RCC. Results showed that SHMT1 transcript levels were significantly
downregulated in patients with KICH, KIRC, and KIRP, based on sample type,
individual cancer stage, sex, and patient age (p
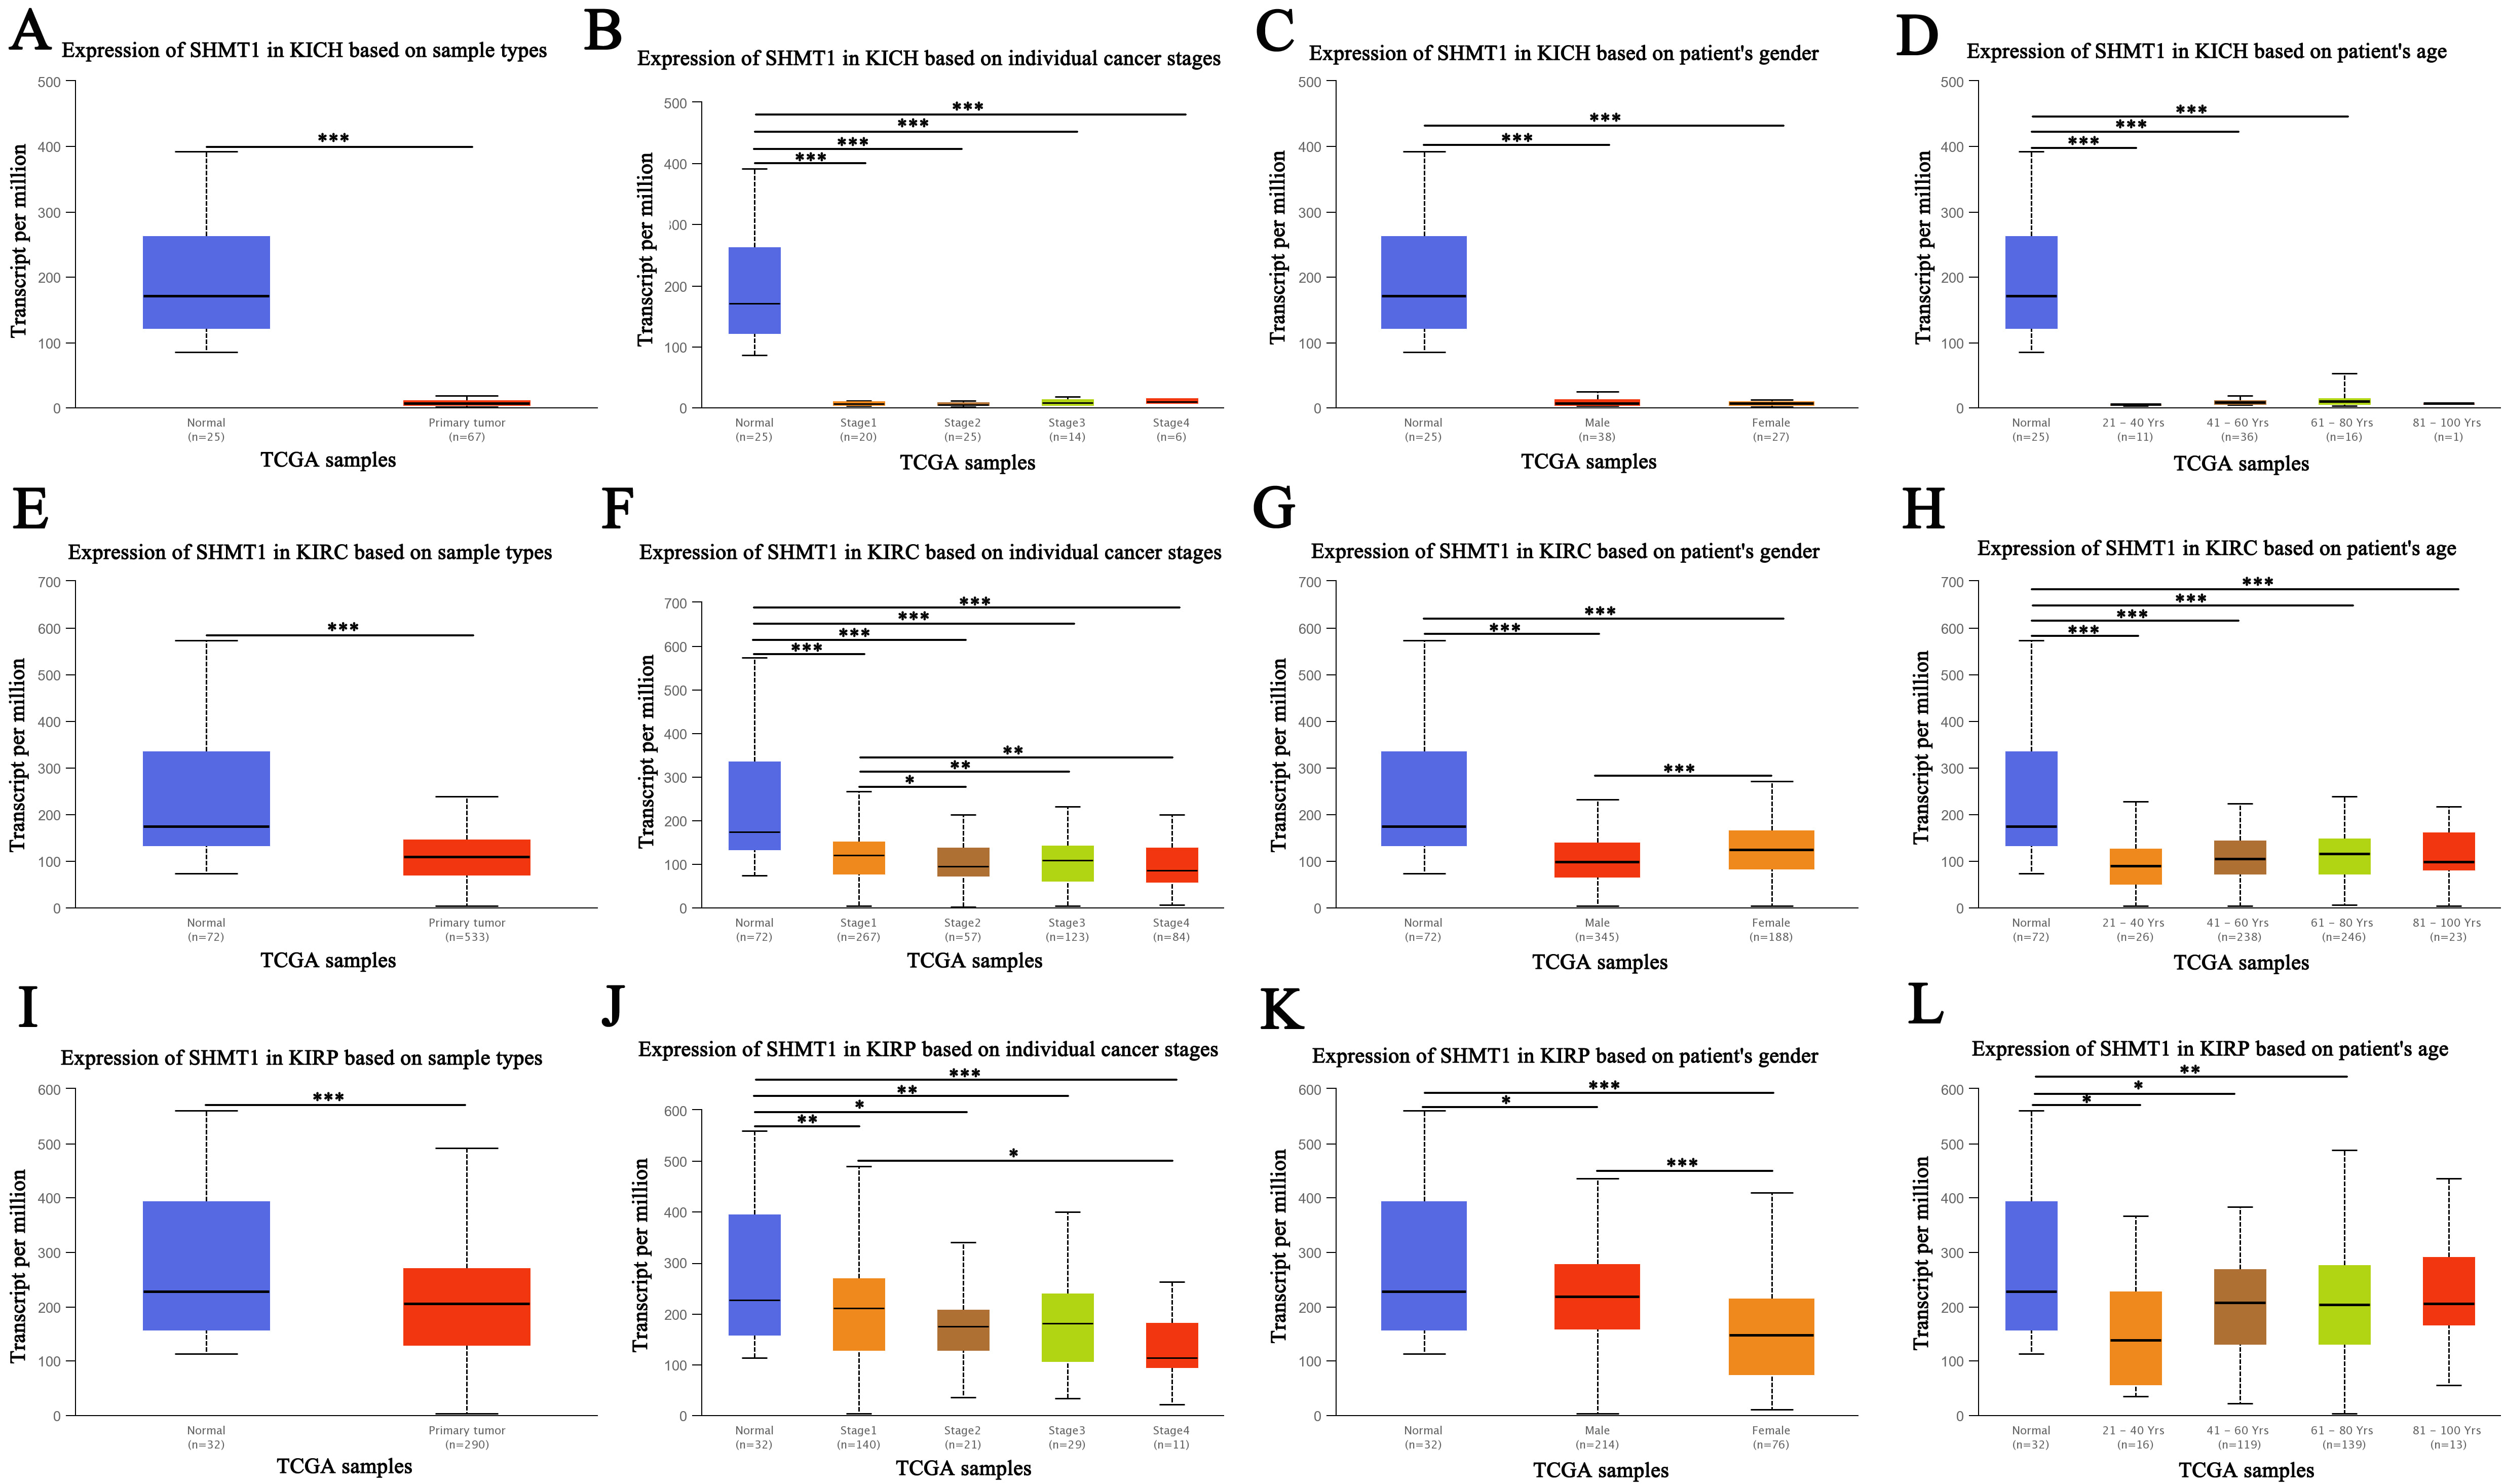 Fig. 1.
Expression of SHMT1 in RCC (UALCAN). (A) The
expression of SHMT1 in KICH based on sample types. (B) The expression of
SHMT1 in KICH based on individual cancer stage. (C) The
expression of SHMT1 in KICH based on patient’s gender. (D)
The expression of SHMT1 in KICH based on patient’s age.
(E) The expression of SHMT1 in KIRC based on sample types. (F) The
expression of SHMT1 in KIRC based on individual cancer stage.
(G) The expression of SHMT1 in KIRC based on patient’s
gender. (H) The expression of SHMT1 in KIRC based on
patient’s age. (I) The expression of SHMT1 in KIRP based on sample
types. (J) The expression of SHMT1 in KIRP based on individual
cancer stage. (K) The expression of SHMT1 in KIRP based on
patient’s gender. (L) The expression of SHMT1 in KIRP based on patient’s age; Data are expressed as mean
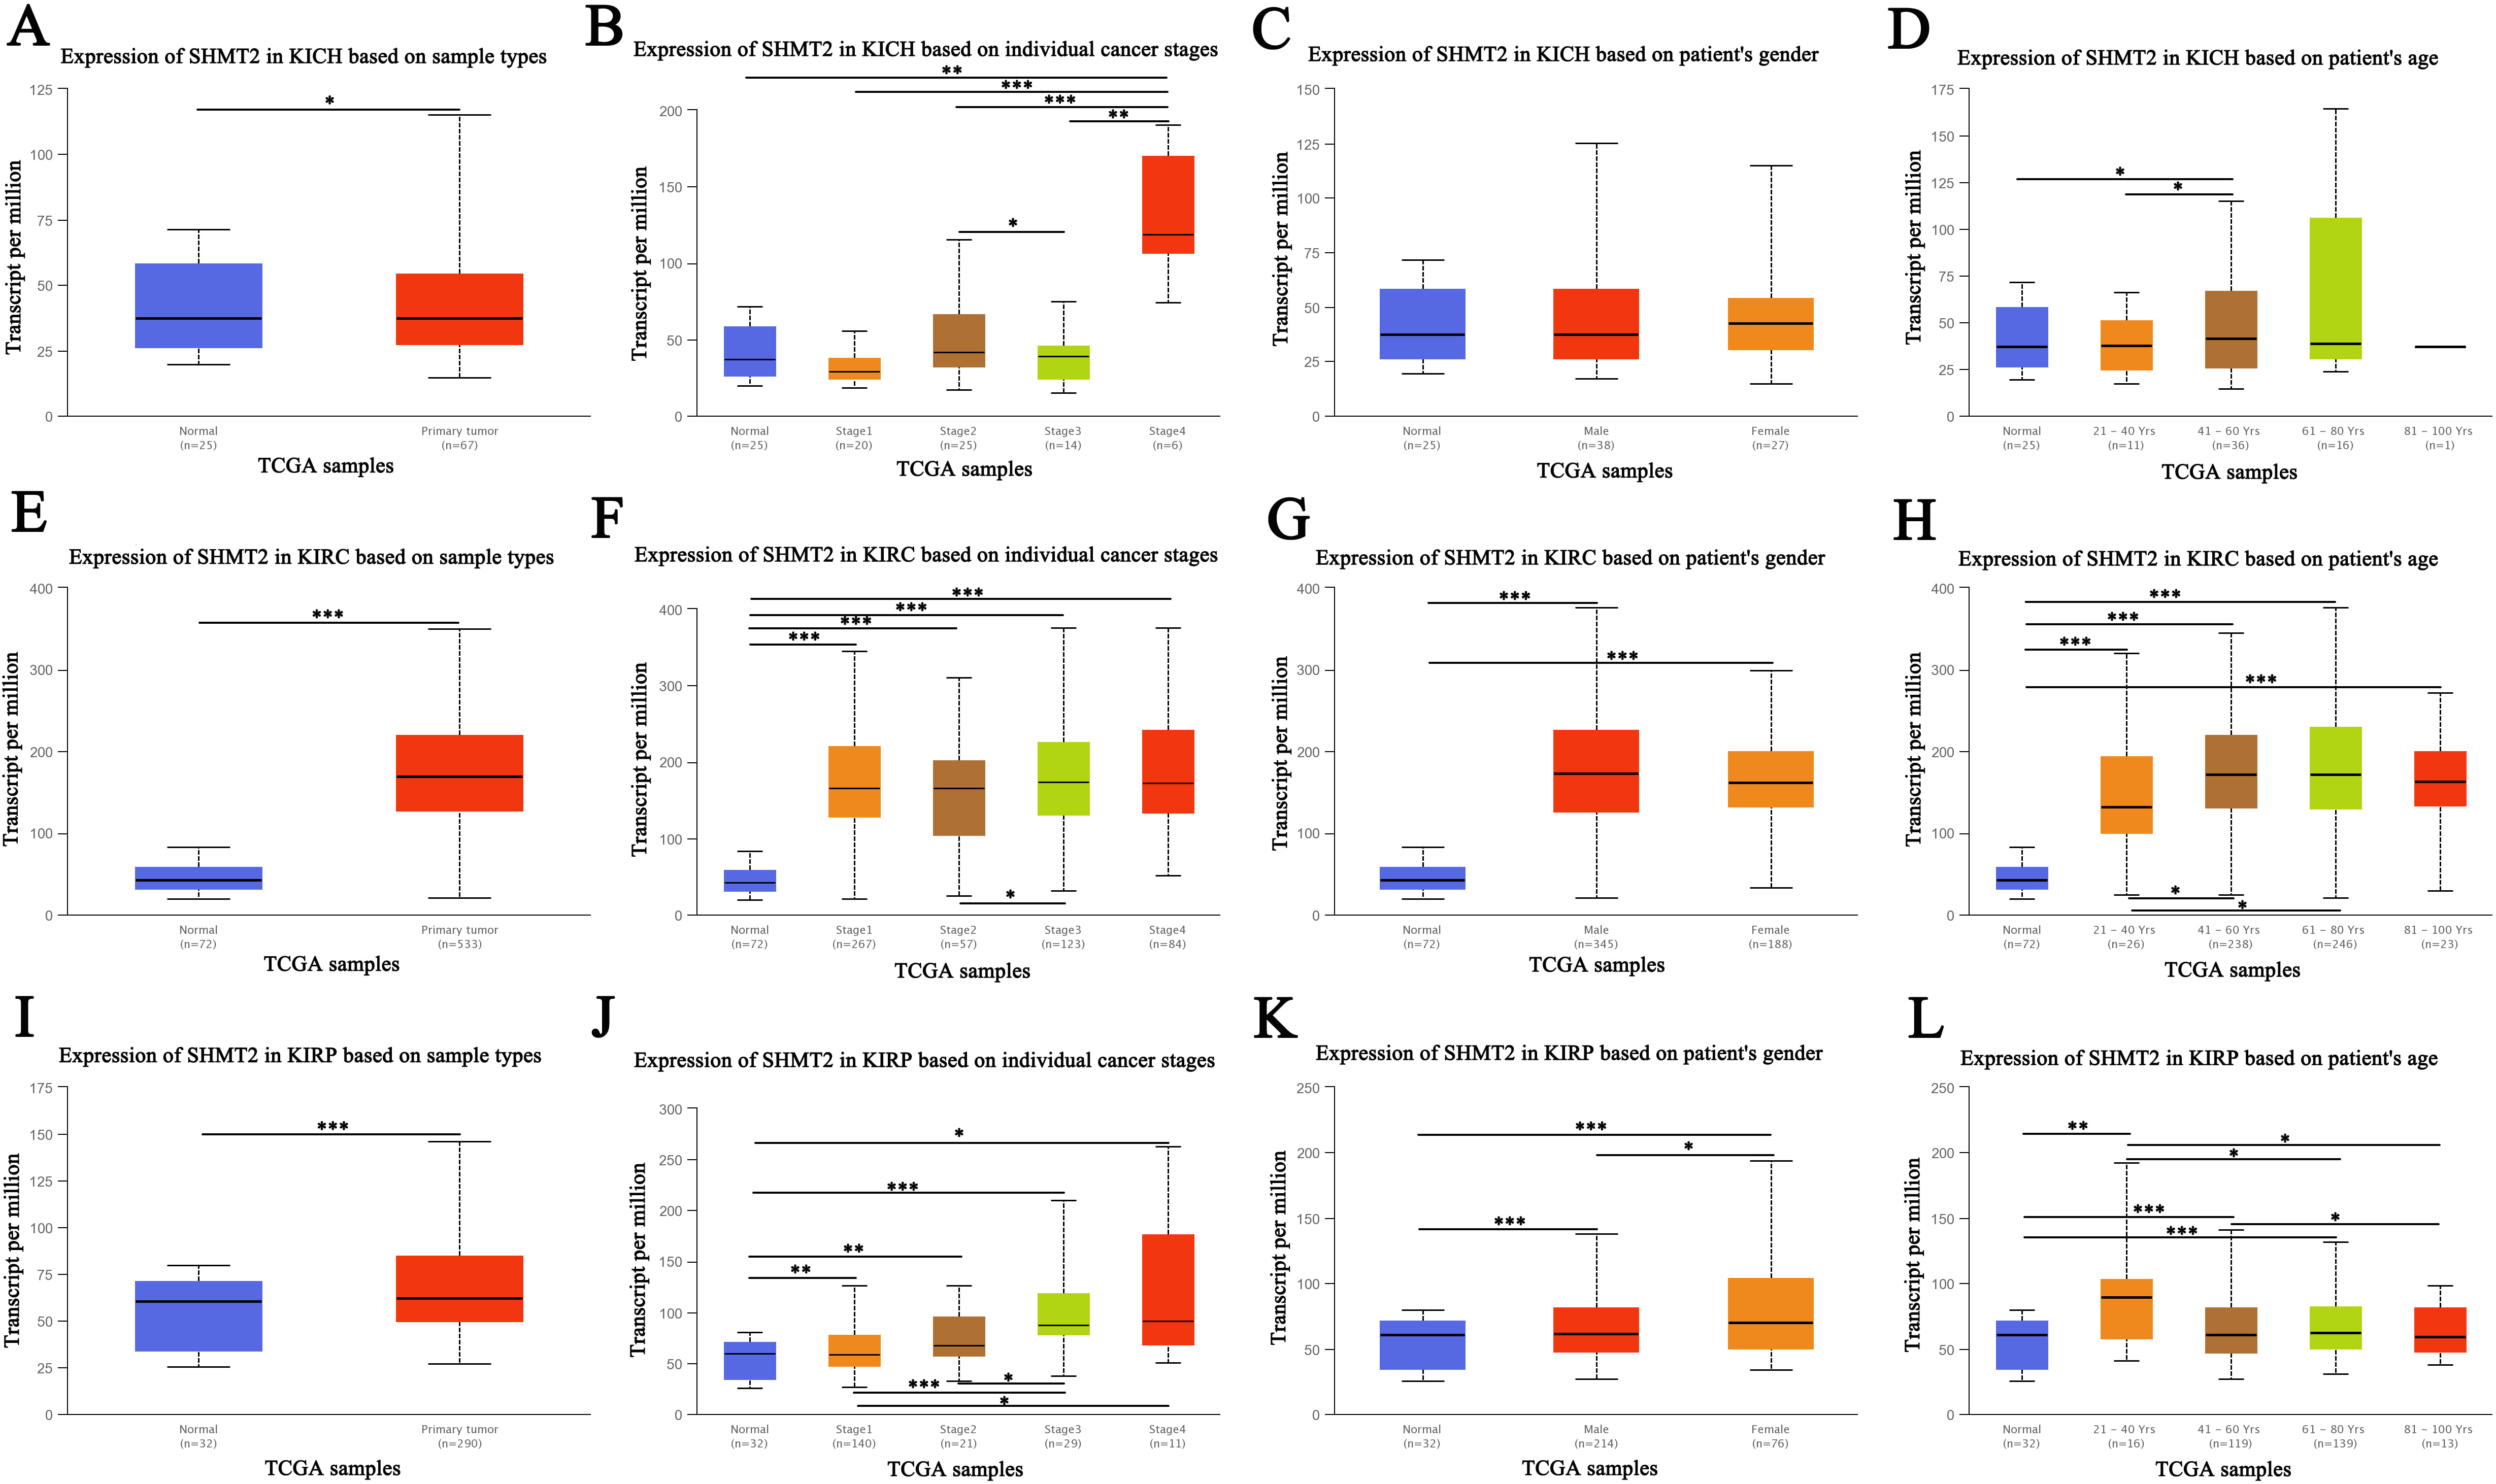 Fig. 2.
Expression of SHMT2 in renal cell carcinoma
(RCC) (UALCAN). (A) The
expression of SHMT2 in KICH based on sample types. (B) The expression of
SHMT2 in KICH based on individual cancer stage. (C) The
expression of SHMT2 in KICH based on patient’s gender. (D)
The expression of SHMT2 in KICH based on patient’s age.
(E) The expression of SHMT2 in KIRC based on sample types. (F) The
expression of SHMT2 in KIRC based on individual cancer stage.
(G) The expression of SHMT2 in KIRC based on patient’s
gender. (H) The expression of SHMT2 in KIRC based on
patient’s age. (I) The expression of SHMT2 in KIRP based on sample
types. (J) The expression of SHMT2 in KIRP based on individual
cancer stage. (K) The expression of SHMT2 in KIRP based on
patient’s gender. (L) The expression of SHMT2 in KIRP based on patient’s age; Data are expressed as mean
Moreover, we evaluated the correlation between the differential expression
levels of SHMT1 and SHMT2 and the pathological stage of RCC. A
significant correlation was found between the expression of SHMT1 (p = 0.0142; Fig. 3B) and pathological stage of KIRC. The expression of
SHMT1 (p = 0.00326; Fig. 3C), SHMT2 (p = 7.32
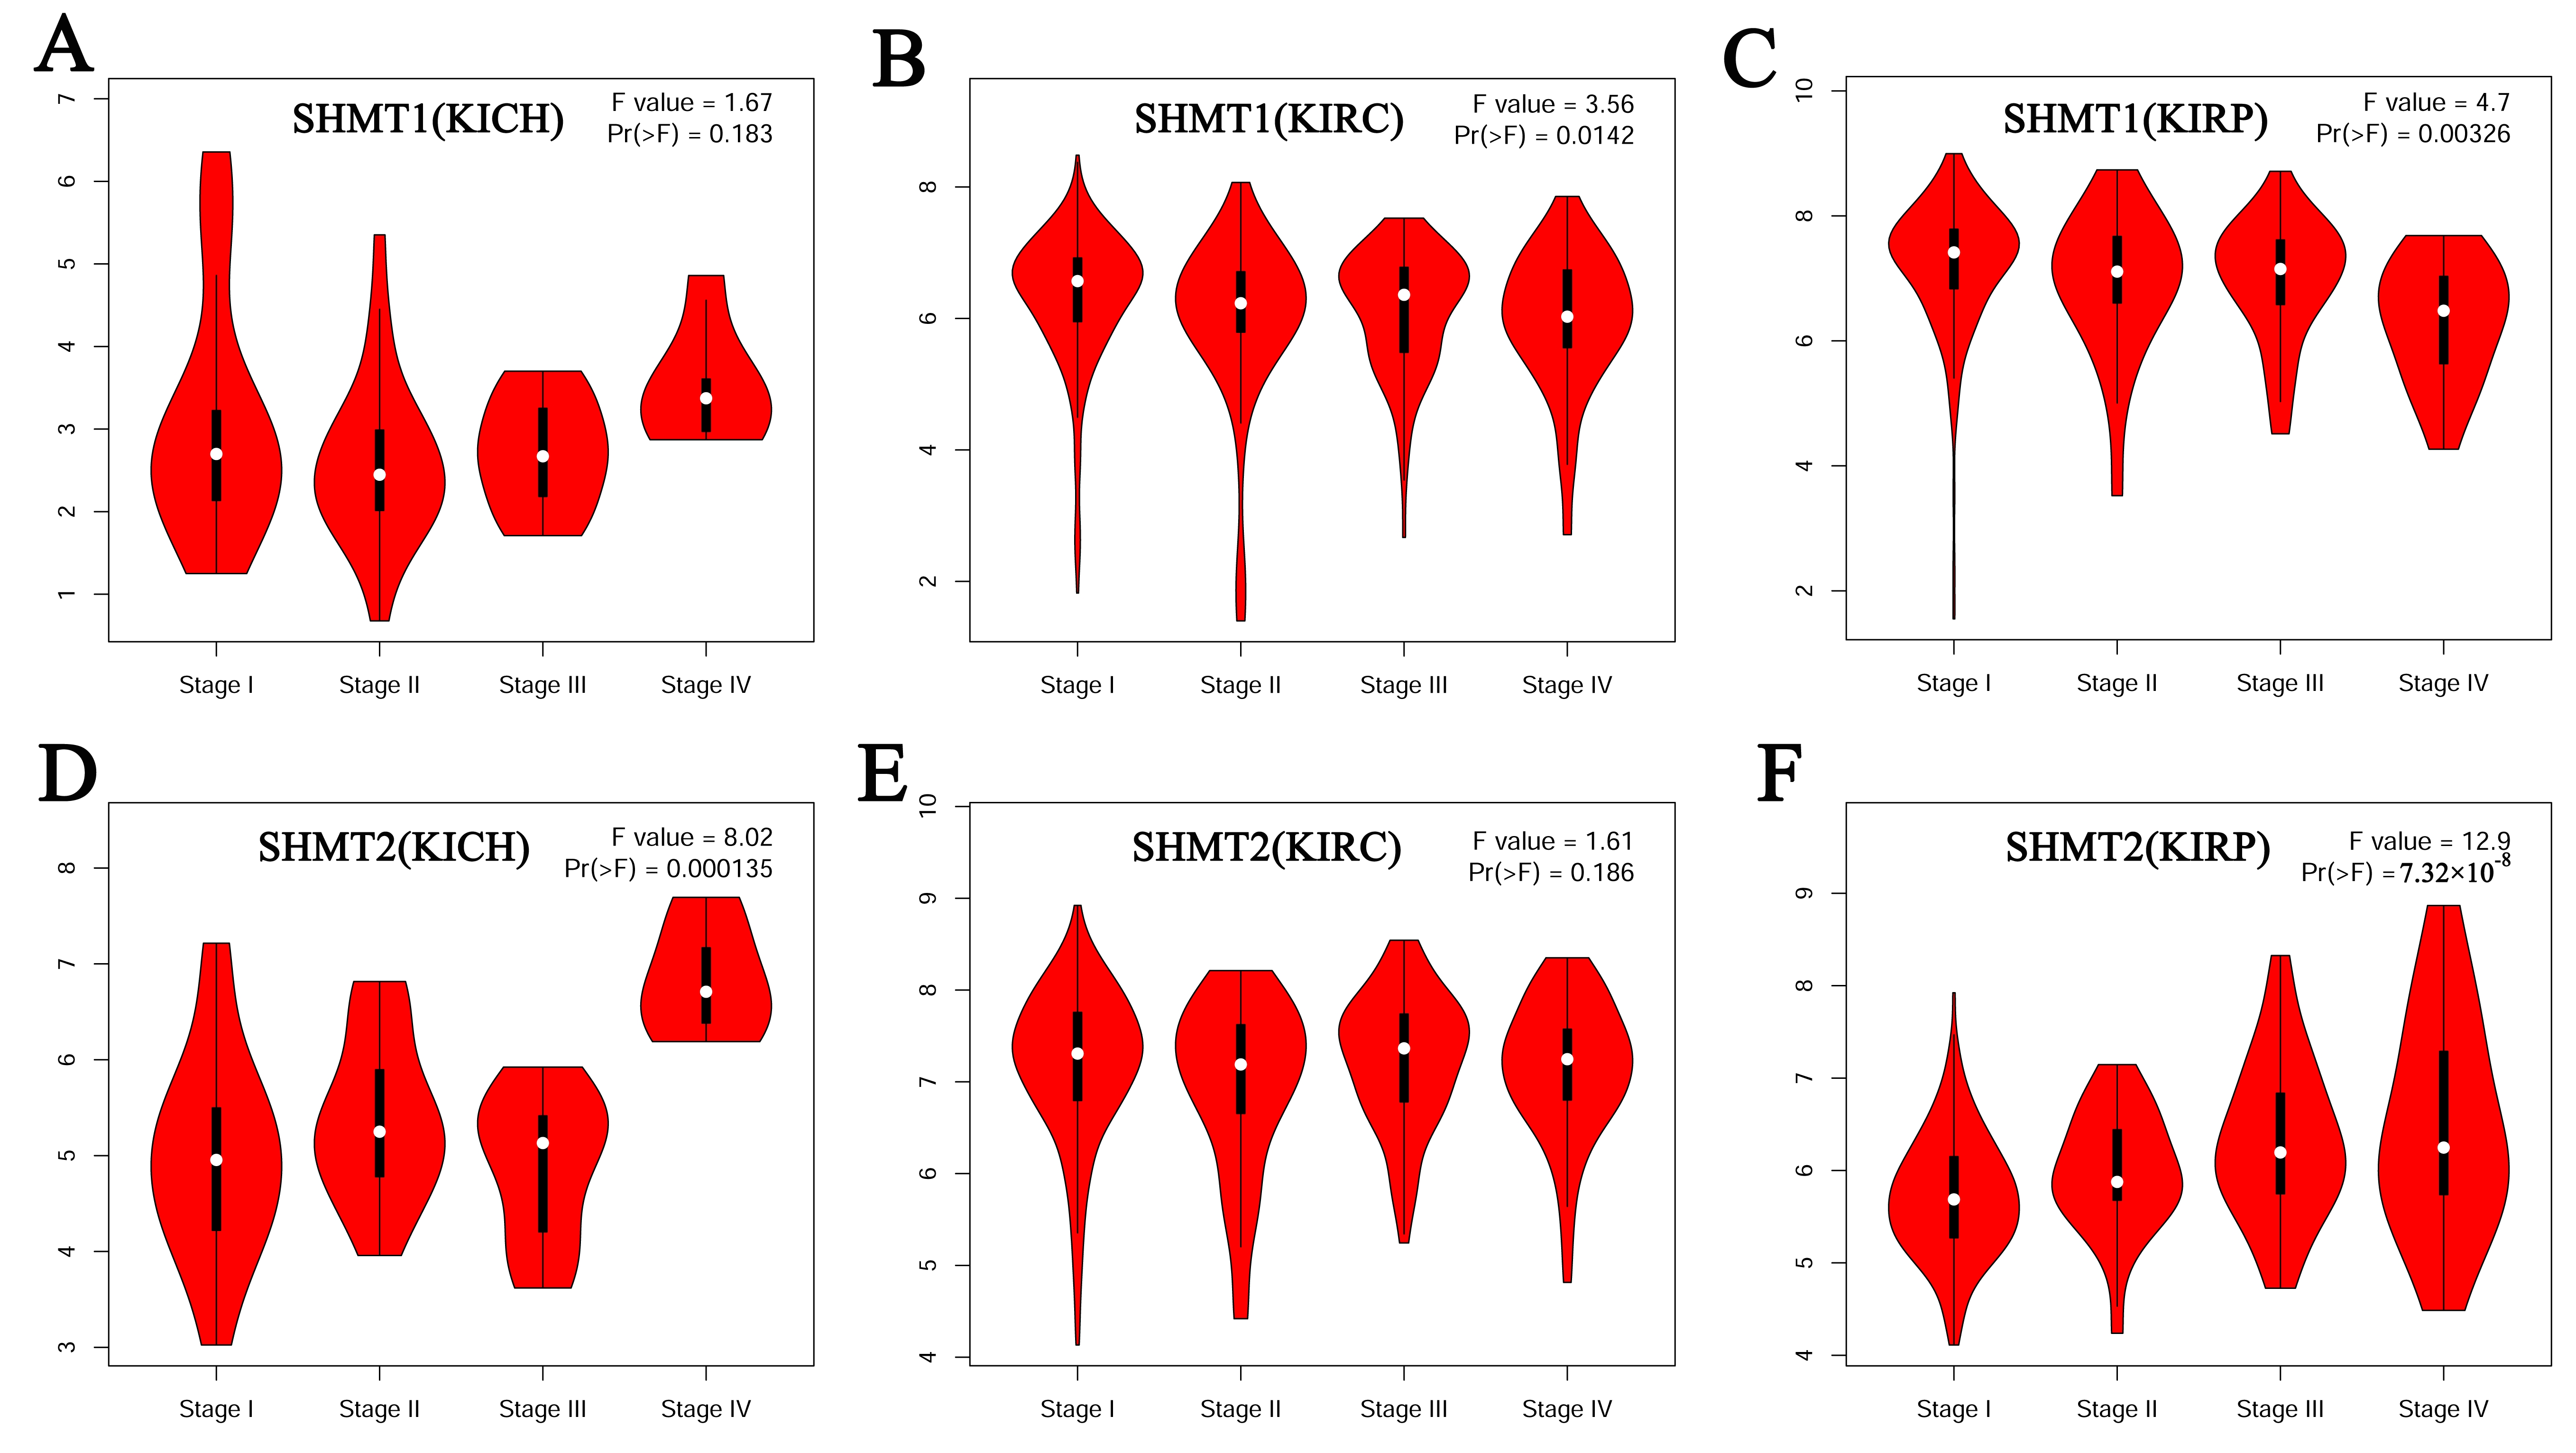 Fig. 3.
Correlation between the expression of SHMT and the pathological stage of RCC (GEPIA). (A) SHMT1 in patients with KICH. (B) SHMT1 in patients with KIRC. (C) SHMT1 in patients with KIRP. (D) SHMT2 in patients with KICH. (E) SHMT2 in patients with KIRC. (F) SHMT2 in patients with KIRP.
Finally, the GEPIA database was used to assess the prognostic value of
SHMT1 and SHMT2 expression in patients with RCC. Results
indicated that patients with KIRC, and those with KIRP, with high SHMT1
expression had a longer overall and disease-free survival rate than those with
low SHMT1 expression (p
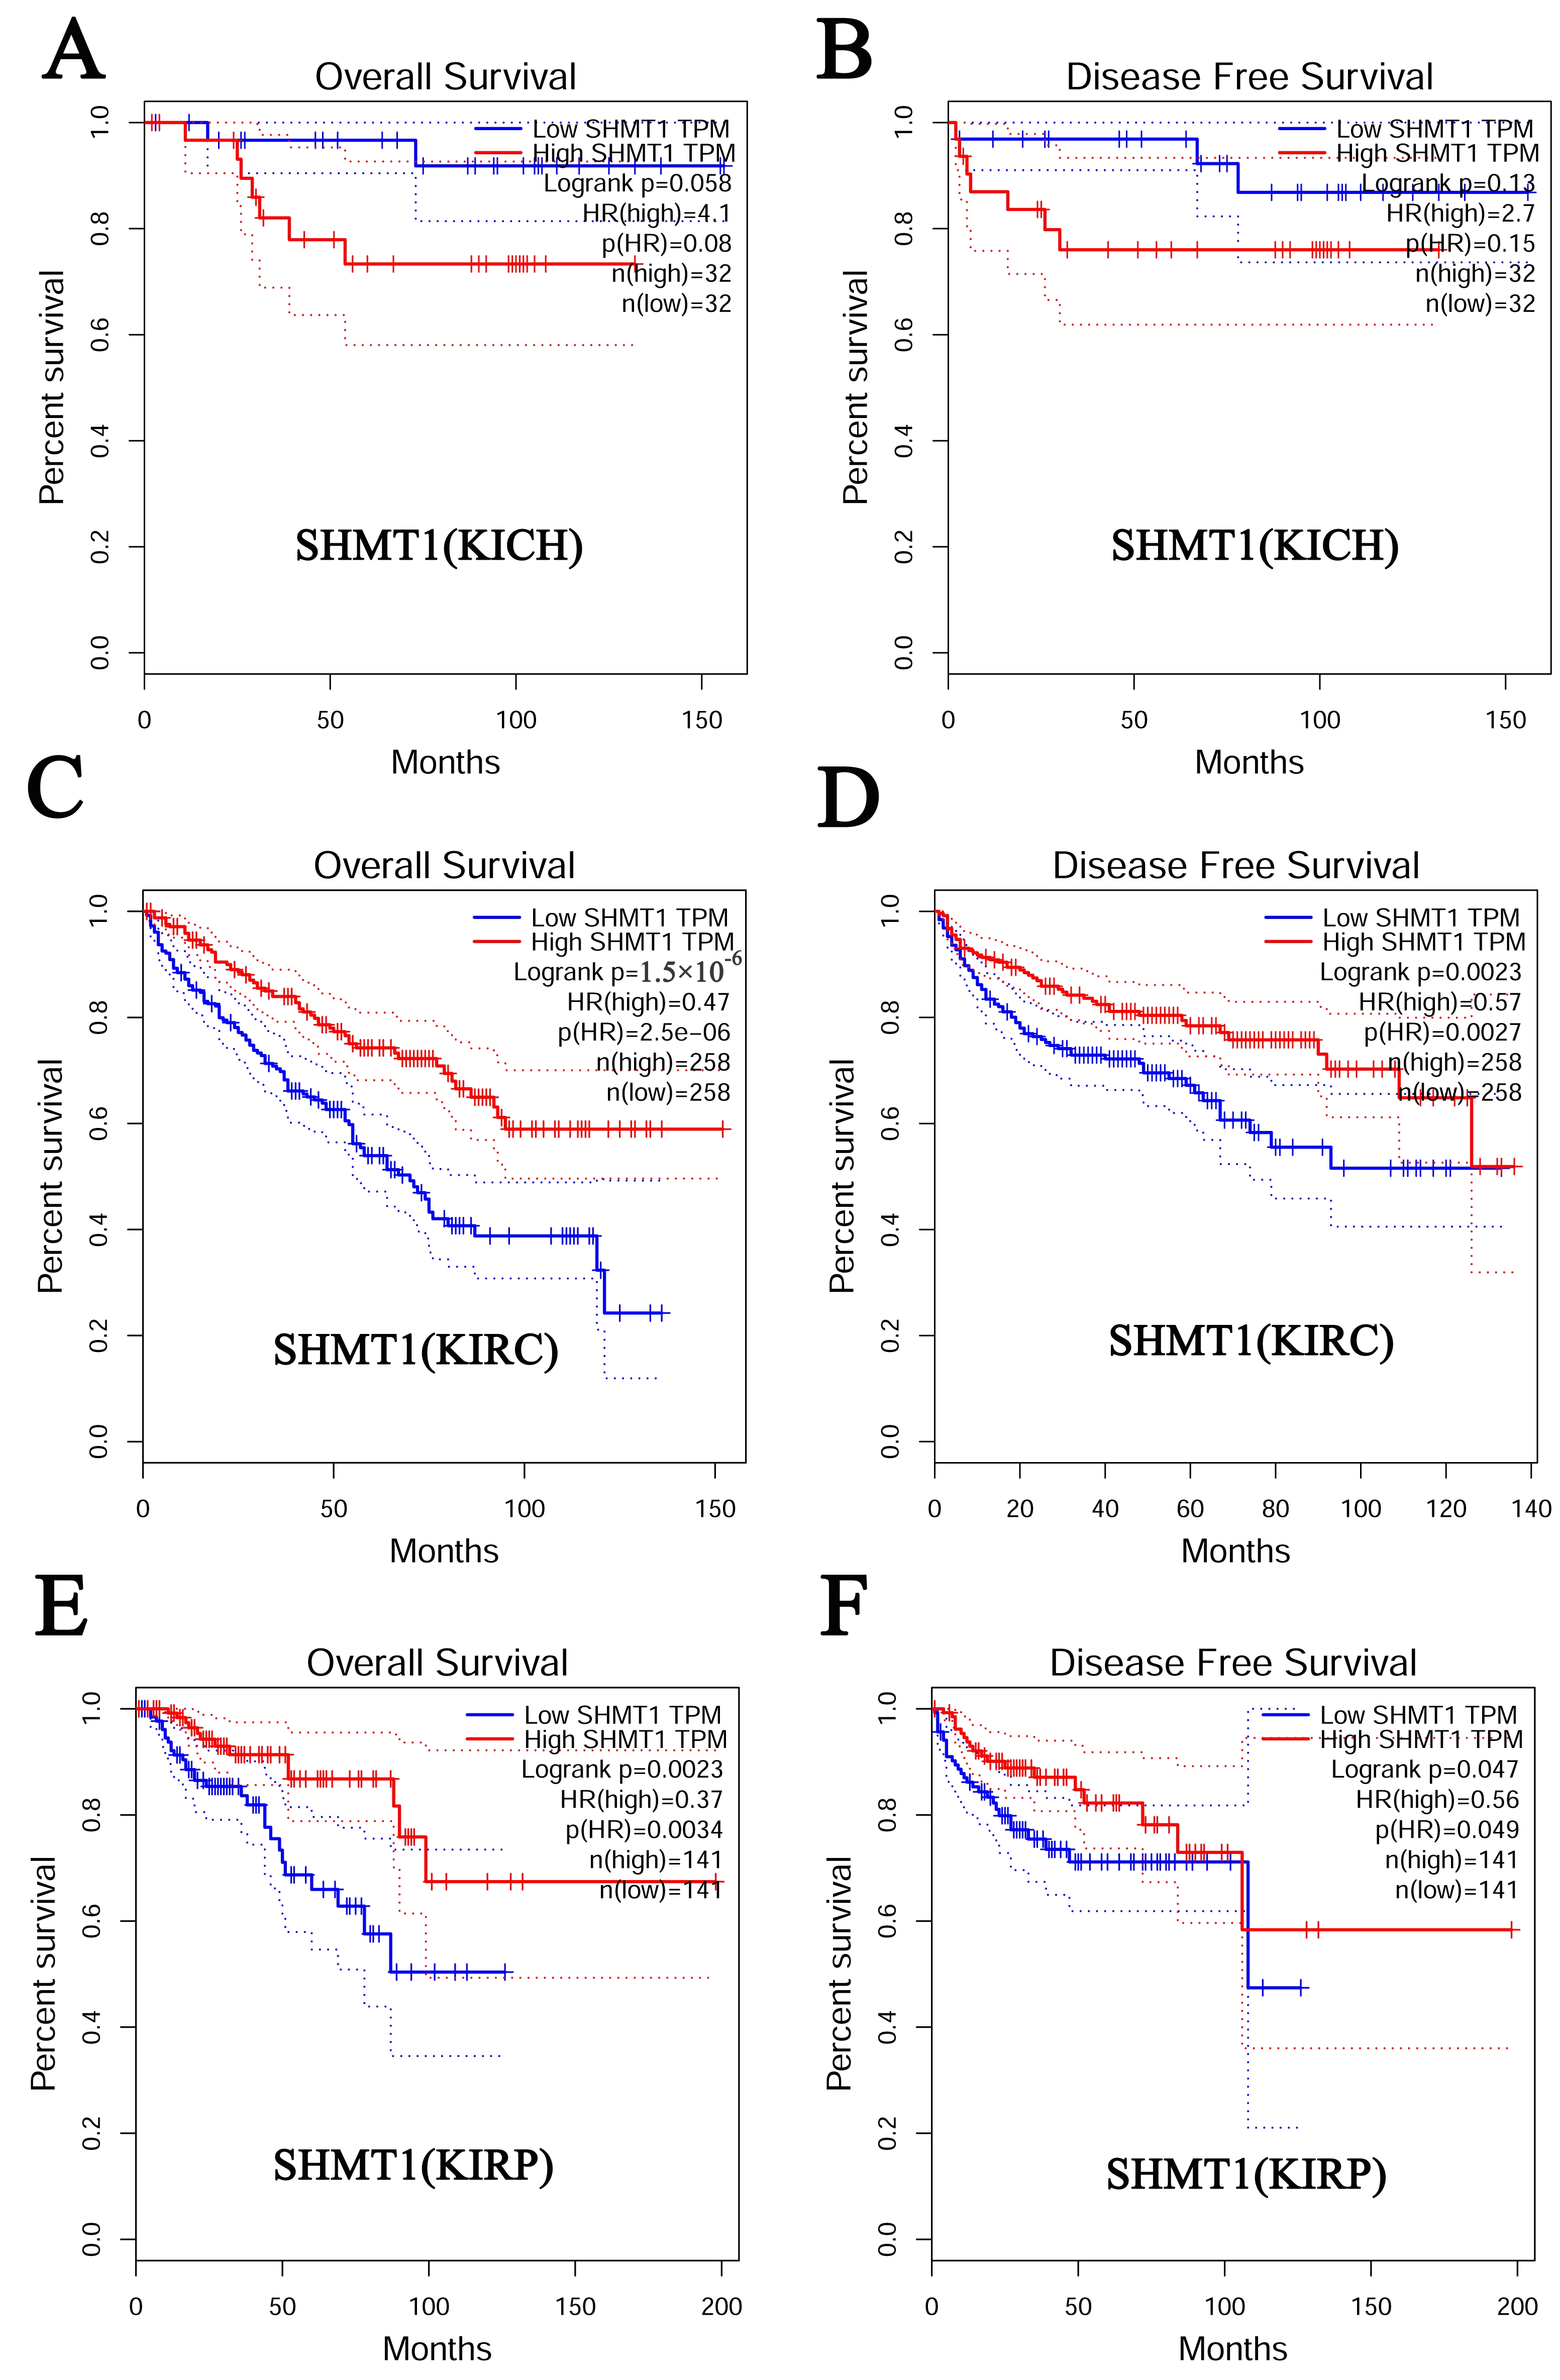 Fig. 4.
Prognostic value of SHMT1 in RCC (GEPIA). (A) The overall survival curve for patients with KICH based on SHMT1 expression levels. (B) The disease-free survival cure for patients with KICH based on SHMT1 expression levels. (C) The overall survival curve for patients with KIRC based on SHMT1 expression levels. (D) The disease-free survival cure for patients with KIRC based on SHMT1 expression levels. (E) The overall survival curve for patients with KIRP based on SHMT1 expression levels. (F) The disease-free survival cure for patients with KIRP based on SHMT1 expression levels.
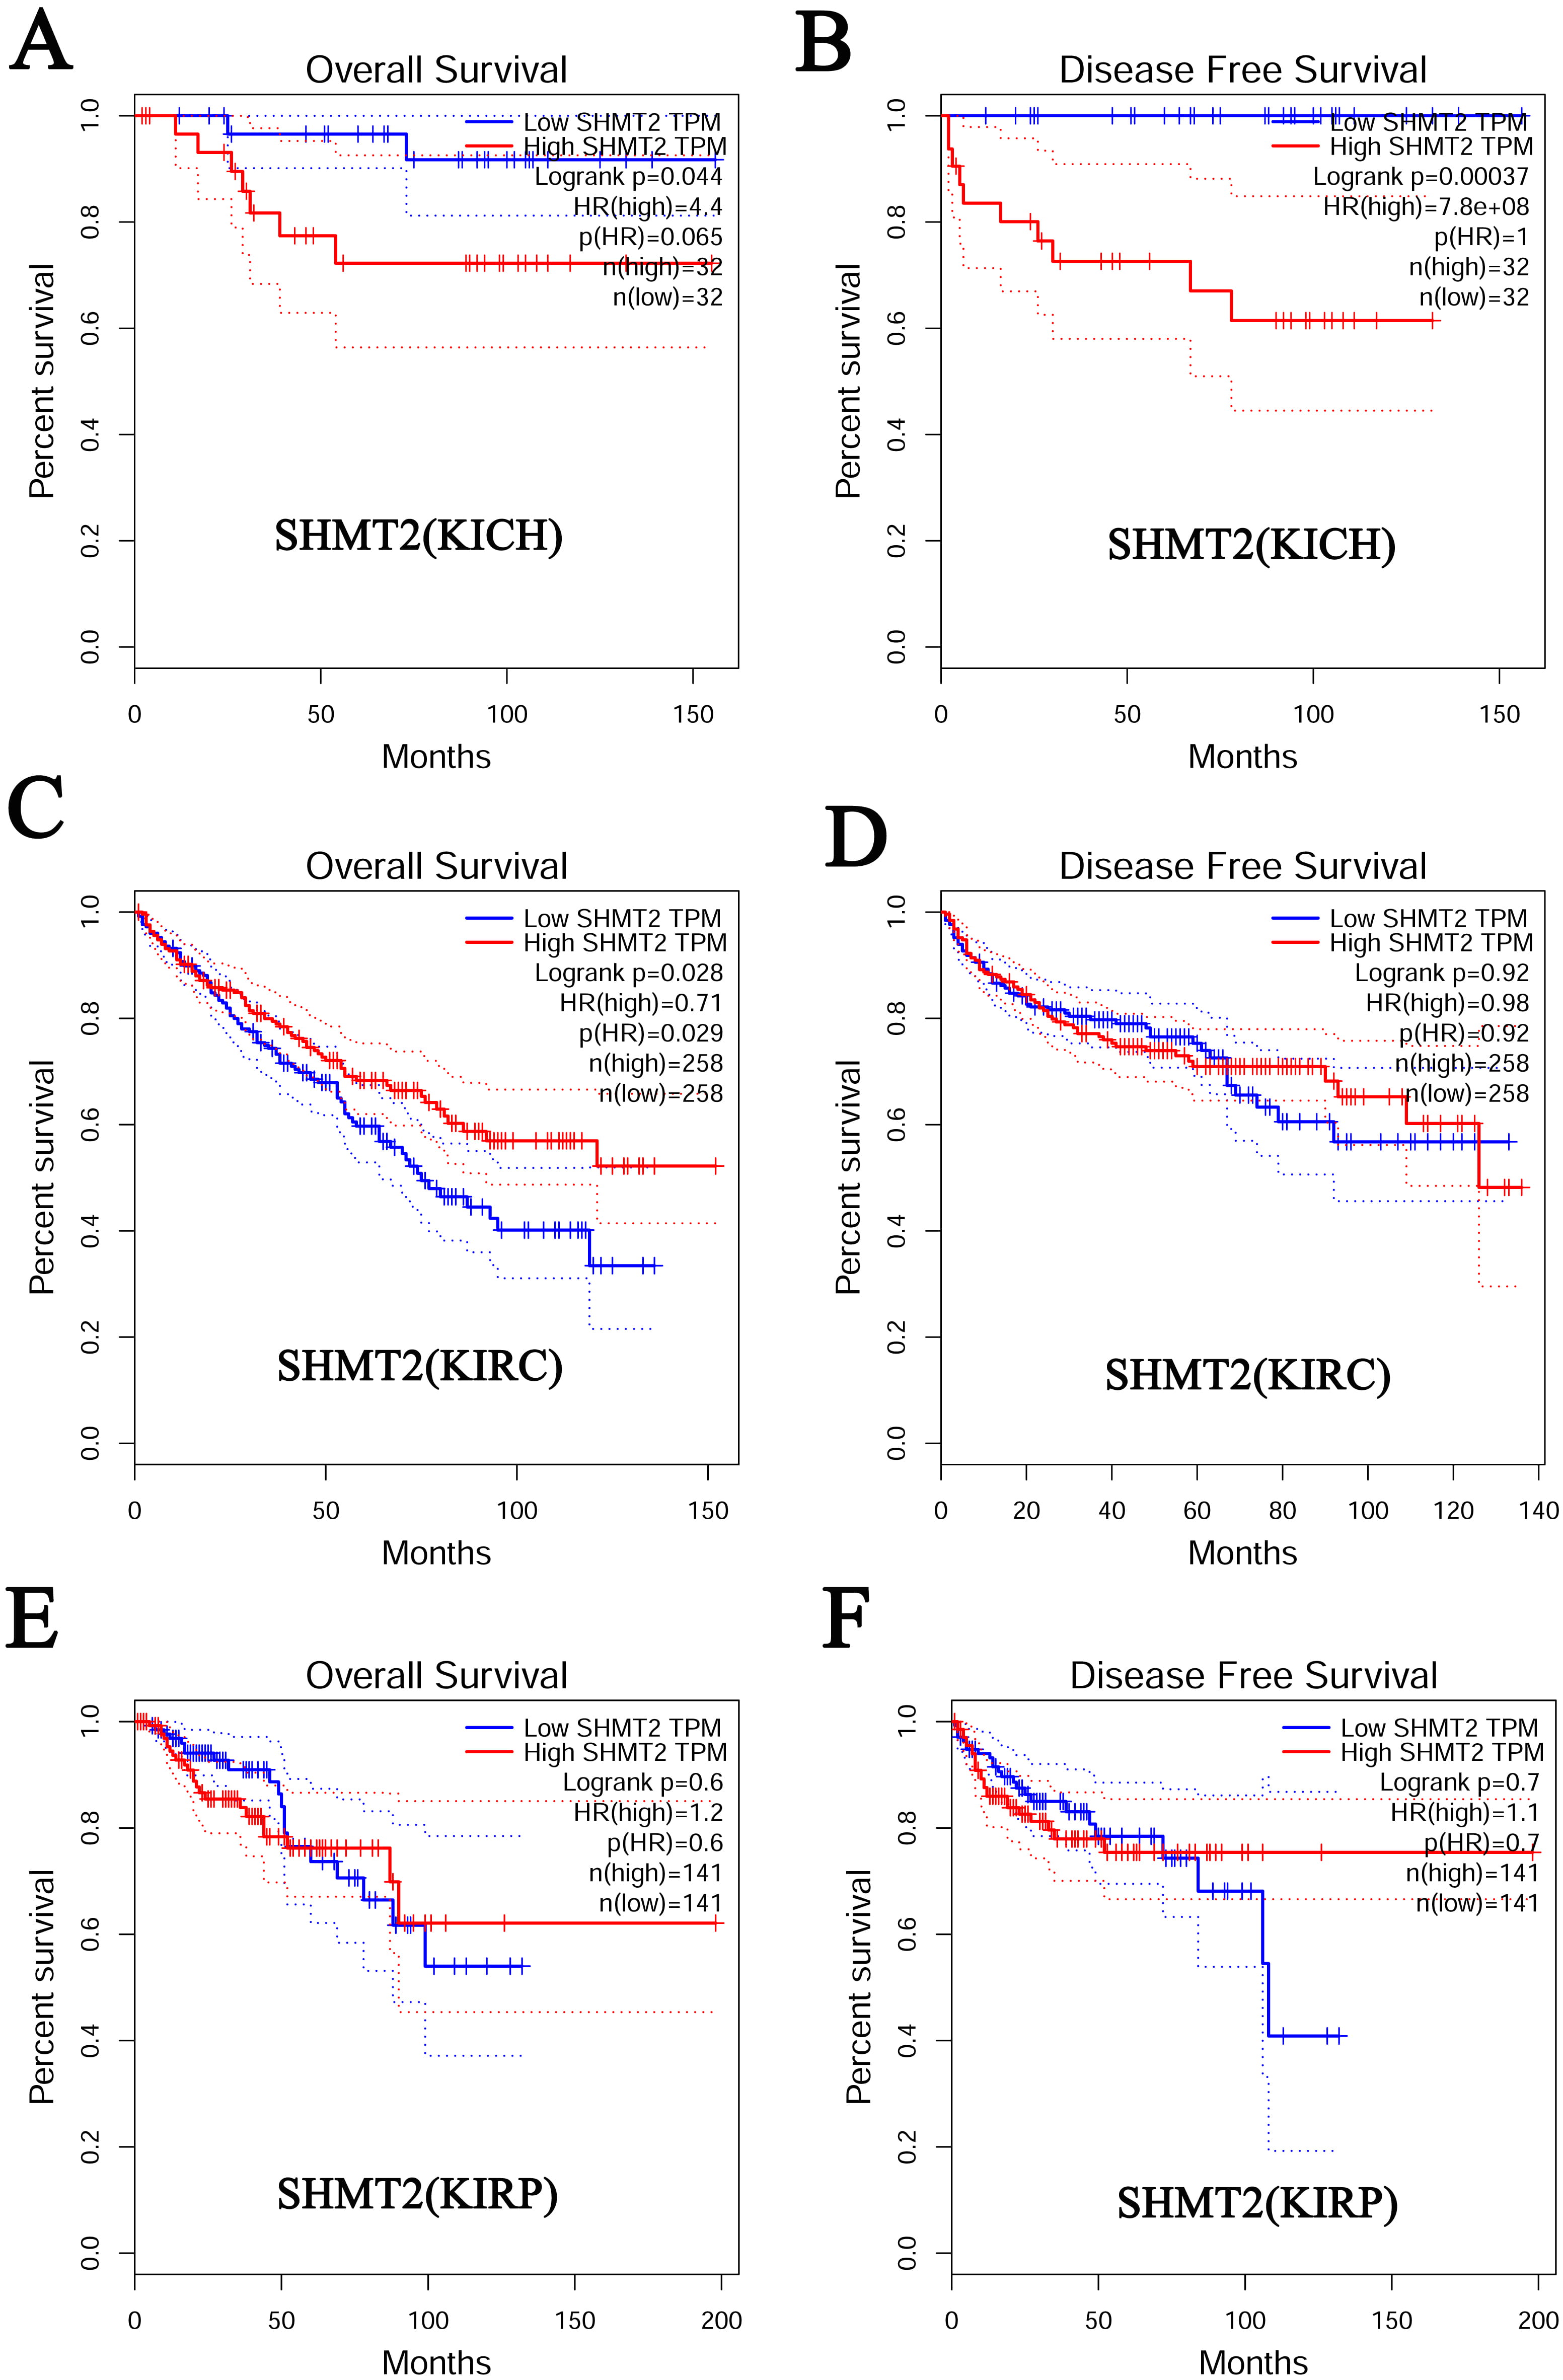 Fig. 5.
Prognostic value of SHMT2 in RCC (GEPIA). (A) The overall survival curve for patients with KICH based on SHMT2 expression levels. (B) The disease-free survival cure for patients with KICH based on SHMT2 expression levels. (C) The overall survival curve for patients with KIRC based on SHMT2 expression levels. (D) The disease-free survival cure for patients with KIRC based on SHMT2 expression levels. (E) The overall survival curve for patients with KIRP based on SHMT2 expression levels. (F) The disease-free survival cure for patients with KIRP based on SHMT2 expression levels.
The genetic alterations in SHMT1 and SHMT2 were assessed in 66, 446, and 280 patients with KICH, KIRC, and KIRP, respectively, using the TCGA database. Results indicated that SHMT1 expression was altered by 9% in patients with KICH, and the types of genetic alterations mainly included high- and low RNA levels (Fig. 6A). In addition, SHMT1 and SHMT2 expression levels were altered by 4% in patients with KIRC. The types of genetic alterations mainly included missense and truncating mutations as well as high- and low RNA levels (Fig. 6E and Fig. 7E). Meanwhile, among patients with KIRP the SHMT1 expression was altered by 6%, and the types of genetic alterations mainly included missense mutations, deep deletions, and low RNA levels (Fig. 6J). SHMT2 expression was altered by 3% in patients with KICH, and the type of genetic alteration mainly included high RNA levels (Fig. 7A). Meanwhile, the expression of SHMT2 was altered by 7% among patients with KIRP, and the types of genetic alterations mainly included missense mutations, amplification, and high and low RNA levels (Fig. 7J).
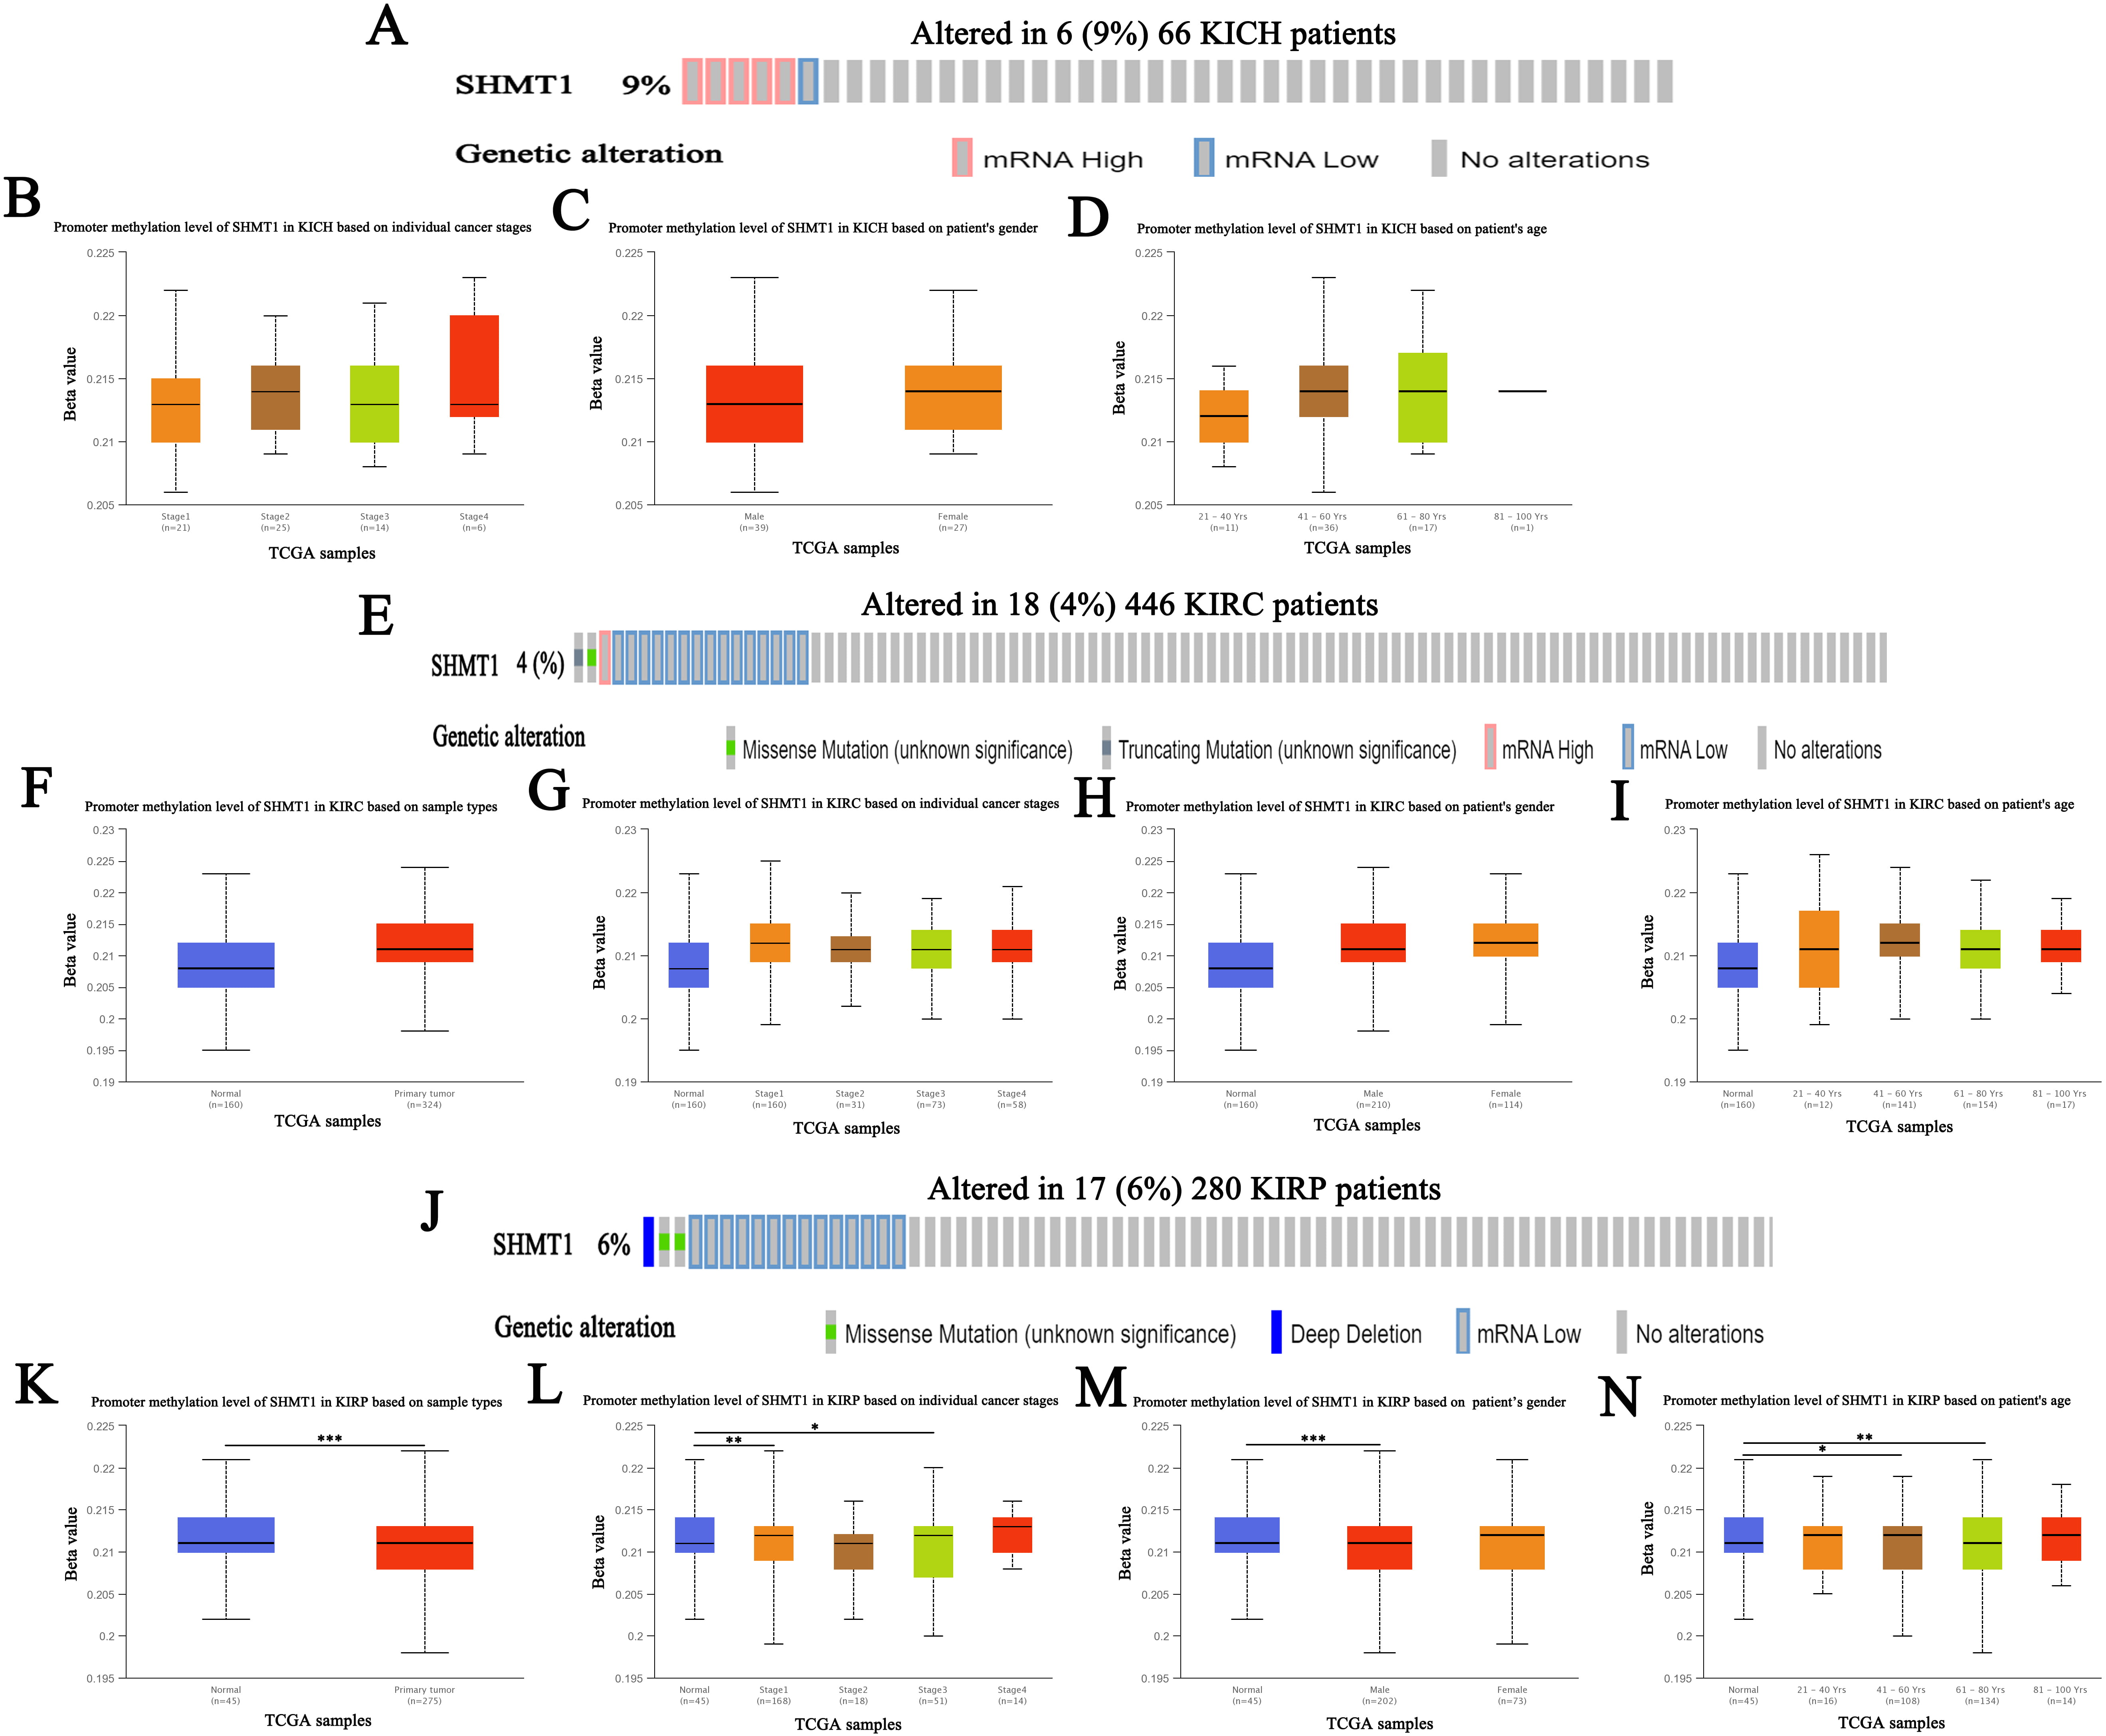 Fig. 6.
Genetic alteration and promoter methylation of SHMT1 in
RCC (UALCAN). (A) Genetic alteration of SHMT1 in patients with KICH.
(B) Promoter methylation of SHMT1 in KICH based on individual
cancer stage. (C) Promoter methylation of SHMT1 in KICH based
on patient’s gender. (D) Promoter methylation of SHMT1 in
KICH based on patient’s age. (E) Genetic alteration of
SHMT1 in patients with KIRC. (F) Promoter methylation of SHMT1
in KIRC based on sample types. (G) Promoter methylation of SHMT1 in
KIRC based on individual cancer stage. (H) Promoter methylation of
SHMT1 in KIRC based on patient’s gender. (I) Promoter
methylation of SHMT1 in KIRC based on patient’s age. (J)
Genetic alteration of SHMT1 in patients with KIRP. (K) Promoter
methylation of SHMT1 in KIRP based on sample types. (L) Promoter
methylation of SHMT1 in KIRP based on individual cancer stage.
(M) Promoter methylation of SHMT1 in KIRP based on
patient’s gender. (N) Promoter methylation of SHMT1 in KIRP based on patient’s age; Data are expressed as mean
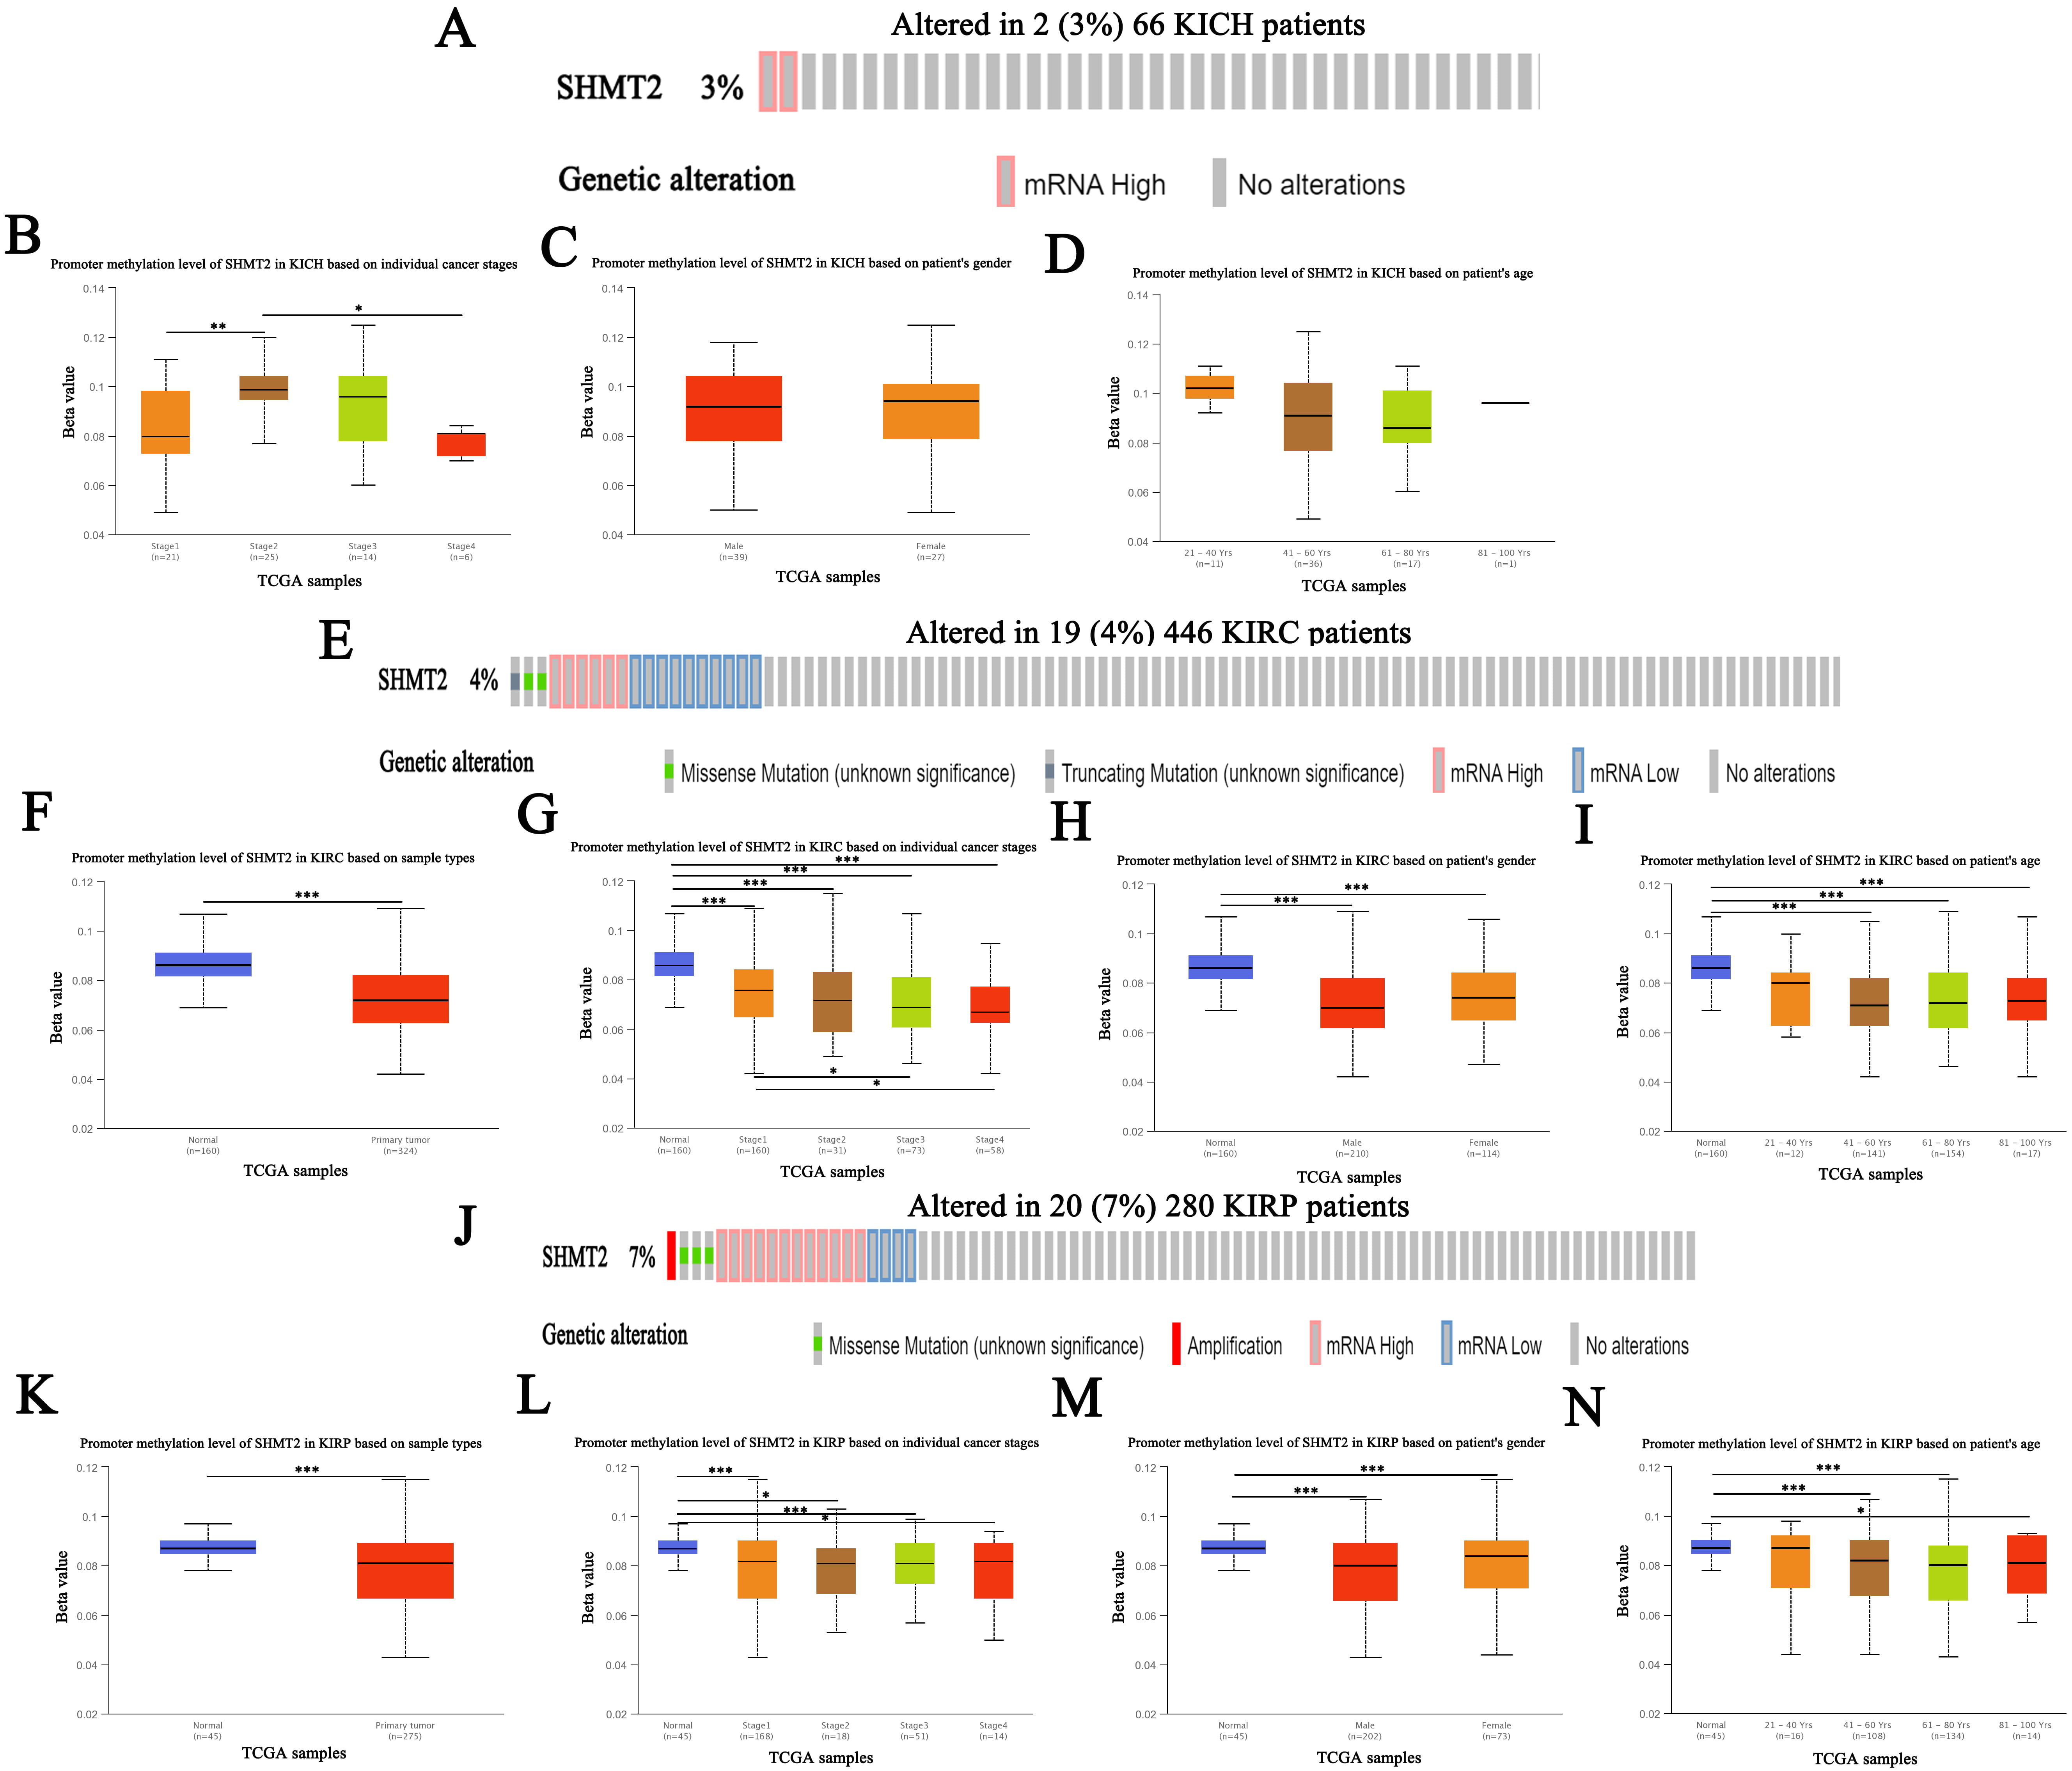 Fig. 7.
Genetic alteration and promoter methylation of SHMT2 in
RCC (UALCAN). (A) Genetic alteration of SHMT2 in patients with KICH.
(B) Promoter methylation of SHMT2 in KICH based on individual
cancer stage. (C) Promoter methylation of SHMT2 in KICH based
on patient’s gender. (D) Promoter methylation of SHMT2 in
KICH based on patient’s age. (E) Genetic alteration of
SHMT2 in patients with KIRC. (F) Promoter methylation of SHMT2
in KIRC based on sample types. (G) Promoter methylation of SHMT2 in
KIRC based on individual cancer stage. (H) Promoter methylation of
SHMT2 in KIRC based on patient’s gender. (I) Promoter
methylation of SHMT2 in KIRC based on patient’s age. (J)
Genetic alteration of SHMT2 in patients with KIRP. (K) Promoter
methylation of SHMT2 in KIRP based on sample types. (L) Promoter
methylation of SHMT2 in KIRP based on individual cancer stage.
(M) Promoter methylation of SHMT2 in KIRP based on
patient’s gender. (N) Promoter methylation of SHMT2 in KIRP based on patient’s age; Data are expressed as mean
Subsequently, we assessed the promoter methylation levels of SHMT1 and
SHMT2 in patients with RCC using the UALCAN database. Results indicate
that SHMT1 promoter methylation levels were significantly upregulated in
patients with KIRP, based on sample type, individual cancer stage (stages 1 and
3), and patient age (41–60 years and 61–80 years) (p
We evaluated alterations in the NG of
SHMT1 and SHMT2 in RCC using the cBioPortal database.
Results showed gene alteration frequencies
| Gene | Altered group | Unaltered group |
| AP5Z1 | 2 (33.33%) | 0 (0.00%) |
| BIRC3 | 2 (33.33%) | 0 (0.00%) |
| DNAJC13 | 2 (33.33%) | 0 (0.00%) |
| ENPP6 | 2 (33.33%) | 0 (0.00%) |
| FAM47C | 2 (33.33%) | 0 (0.00%) |
| MTOR | 2 (33.33%) | 0 (0.00%) |
| MYO18B | 2 (33.33%) | 0 (0.00%) |
| OTOA | 2 (33.33%) | 0 (0.00%) |
| PACS1 | 2 (33.33%) | 0 (0.00%) |
| PRODH | 2 (33.33%) | 0 (0.00%) |
| CNTN5 | 2 (33.33%) | 1 (1.67%) |
| DMXL1 | 2 (33.33%) | 1 (1.67%) |
| NLGN4X | 2 (33.33%) | 1 (1.67%) |
| SECISBP2L | 2 (33.33%) | 1 (1.67%) |
| ATRX | 2 (33.33%) | 2 (3.33%) |
| DNAH1 | 2 (33.33%) | 2 (3.33%) |
| ZNF799 | 2 (33.33%) | 2 (3.33%) |
| ABCC10 | 1 (16.67%) | 0 (0.00%) |
| ABHD17A | 1 (16.67%) | 0 (0.00%) |
| ABTB2 | 1 (16.67%) | 0 (0.00%) |
| ACP1 | 1 (16.67%) | 0 (0.00%) |
| ACTBL2 | 1 (16.67%) | 0 (0.00%) |
| ADAM17 | 1 (16.67%) | 0 (0.00%) |
| ADAM19 | 1 (16.67%) | 0 (0.00%) |
| ADAMTS16 | 1 (16.67%) | 0 (0.00%) |
| ADGRB2 | 1 (16.67%) | 0 (0.00%) |
| ADGRL1 | 1 (16.67%) | 0 (0.00%) |
| ADH1C | 1 (16.67%) | 0 (0.00%) |
| ADI1 | 1 (16.67%) | 0 (0.00%) |
| ADORA2A | 1 (16.67%) | 0 (0.00%) |
| AGAP6 | 1 (16.67%) | 0 (0.00%) |
| AGO3 | 1 (16.67%) | 0 (0.00%) |
| AKAP9 | 1 (16.67%) | 0 (0.00%) |
| ALKAL2 | 1 (16.67%) | 0 (0.00%) |
| ALPK3 | 1 (16.67%) | 0 (0.00%) |
| ALPL | 1 (16.67%) | 0 (0.00%) |
| ANKRD52 | 1 (16.67%) | 0 (0.00%) |
| ANKRD66 | 1 (16.67%) | 0 (0.00%) |
| AP1M1 | 1 (16.67%) | 0 (0.00%) |
| AP1M2 | 1 (16.67%) | 0 (0.00%) |
| AP2A1 | 1 (16.67%) | 0 (0.00%) |
| AP3M2 | 1 (16.67%) | 0 (0.00%) |
| APOBEC3G | 1 (16.67%) | 0 (0.00%) |
| ARHGEF39 | 1 (16.67%) | 0 (0.00%) |
| ARHGEF40 | 1 (16.67%) | 0 (0.00%) |
| ARRB1 | 1 (16.67%) | 0 (0.00%) |
| ASAP2 | 1 (16.67%) | 0 (0.00%) |
| ASIC4 | 1 (16.67%) | 0 (0.00%) |
| ASPHD1 | 1 (16.67%) | 0 (0.00%) |
| ATP11A | 1 (16.67%) | 0 (0.00%) |
| Gene | Altered group | Unaltered group |
| MUC16 | 9 (50.00%) | 50 (11.68%) |
| OVGP1 | 7 (38.89%) | 14 (3.27%) |
| OR4N5 | 6 (33.33%) | 7 (1.64%) |
| TLR3 | 6 (33.33%) | 8 (1.87%) |
| BPIFC | 6 (33.33%) | 9 (2.10%) |
| BTRC | 6 (33.33%) | 9 (2.10%) |
| SLPI | 6 (33.33%) | 11 (2.57%) |
| TAS2R3 | 6 (33.33%) | 11 (2.57%) |
| HEBP1 | 6 (33.33%) | 15 (3.50%) |
| TSKS | 6 (33.33%) | 15 (3.50%) |
| CD4 | 6 (33.33%) | 16 (3.74%) |
| MAP1B | 6 (33.33%) | 16 (3.74%) |
| PHACTR1 | 6 (33.33%) | 16 (3.74%) |
| PDZD2 | 6 (33.33%) | 17 (3.97%) |
| SSX3 | 6 (33.33%) | 17 (3.97%) |
| ABCA6 | 6 (33.33%) | 18 (4.21%) |
| TSHZ3 | 6 (33.33%) | 20 (4.67%) |
| FAP | 5 (27.78%) | 3 (0.70%) |
| IL32 | 5 (27.78%) | 3 (0.70%) |
| CCS | 5 (27.78%) | 7 (1.64%) |
| OSBPL3 | 5 (27.78%) | 7 (1.64%) |
| NUMA1 | 5 (27.78%) | 8 (1.87%) |
| OSBPL2 | 5 (27.78%) | 9 (2.10%) |
| ZNF462 | 5 (27.78%) | 9 (2.10%) |
| FYB1 | 5 (27.78%) | 10 (2.34%) |
| LRP4 | 5 (27.78%) | 10 (2.34%) |
| SLC8B1 | 5 (27.78%) | 10 (2.34%) |
| C6 | 5 (27.78%) | 11 (2.57%) |
| FAM104A | 5 (27.78%) | 11 (2.57%) |
| STAT2 | 5 (27.78%) | 12 (2.80%) |
| NOMO1 | 5 (27.78%) | 13 (3.04%) |
| NRSN2 | 5 (27.78%) | 13 (3.04%) |
| CFAP53 | 4 (22.22%) | 3 (0.70%) |
| EPG5 | 4 (22.22%) | 3 (0.70%) |
| CWH43 | 4 (22.22%) | 4 (0.93%) |
| FRYL | 4 (22.22%) | 4 (0.93%) |
| JAG1 | 4 (22.22%) | 4 (0.93%) |
| ARFGEF2 | 4 (22.22%) | 5 (1.17%) |
| KIF5A | 4 (22.22%) | 5 (1.17%) |
| PABIR3 | 4 (22.22%) | 5 (1.17%) |
| SDHAF2 | 4 (22.22%) | 5 (1.17%) |
| CCDC18 | 4 (22.22%) | 6 (1.40%) |
| LGI2 | 4 (22.22%) | 6 (1.40%) |
| NKD1 | 4 (22.22%) | 6 (1.40%) |
| SLC12A9 | 4 (22.22%) | 6 (1.40%) |
| MT-ND6 | 3 (16.67%) | 0 (0.00%) |
| SLC4A11 | 3 (16.67%) | 0 (0.00%) |
| STIM2 | 3 (16.67%) | 0 (0.00%) |
| DIDO1 | 3 (16.67%) | 1 (0.23%) |
| PDYN | 3 (16.67%) | 1 (0.23%) |
| Gene | Altered group | Unaltered group |
| STAG2 | 4 (23.53%) | 4 (1.52%) |
| FH | 3 (17.65%) | 1 (0.38%) |
| FGFR3 | 3 (17.65%) | 2 (0.76%) |
| CRISP3 | 2 (11.76%) | 0 (0.00%) |
| LLGL1 | 2 (11.76%) | 0 (0.00%) |
| MINK1 | 2 (11.76%) | 0 (0.00%) |
| SAYSD1 | 2 (11.76%) | 0 (0.00%) |
| SNRPE | 2 (11.76%) | 0 (0.00%) |
| TRPV2 | 2 (11.76%) | 0 (0.00%) |
| TP53 | 3 (17.65%) | 5 (1.90%) |
| CACNG2 | 2 (11.76%) | 1 (0.38%) |
| CCNL2 | 2 (11.76%) | 1 (0.38%) |
| DNAJA2 | 2 (11.76%) | 1 (0.38%) |
| ITGAE | 2 (11.76%) | 1 (0.38%) |
| ITGAL | 2 (11.76%) | 1 (0.38%) |
| KIAA0753 | 2 (11.76%) | 1 (0.38%) |
| NDC80 | 2 (11.76%) | 1 (0.38%) |
| NUP88 | 2 (11.76%) | 1 (0.38%) |
| PABPN1 | 2 (11.76%) | 1 (0.38%) |
| SLC29A1 | 2 (11.76%) | 1 (0.38%) |
| SLC2A4 | 2 (11.76%) | 1 (0.38%) |
| TMEM212 | 2 (11.76%) | 1 (0.38%) |
| TXNIP | 2 (11.76%) | 1 (0.38%) |
| WDR59 | 2 (11.76%) | 1 (0.38%) |
| ZNF689 | 2 (11.76%) | 1 (0.38%) |
| ATP1B1 | 3 (17.65%) | 6 (2.28%) |
| ALYREF | 2 (11.76%) | 2 (0.76%) |
| ANAPC11 | 2 (11.76%) | 2 (0.76%) |
| ARHGDIA | 2 (11.76%) | 2 (0.76%) |
| ARL16 | 2 (11.76%) | 2 (0.76%) |
| CCDC137 | 2 (11.76%) | 2 (0.76%) |
| DEFB110 | 2 (11.76%) | 2 (0.76%) |
| GCGR | 2 (11.76%) | 2 (0.76%) |
| HSDL2 | 2 (11.76%) | 2 (0.76%) |
| IFNA10 | 2 (11.76%) | 2 (0.76%) |
| IFNA14 | 2 (11.76%) | 2 (0.76%) |
| IFNA16 | 2 (11.76%) | 2 (0.76%) |
| IFNA17 | 2 (11.76%) | 2 (0.76%) |
| IFNA21 | 2 (11.76%) | 2 (0.76%) |
| IFNA4 | 2 (11.76%) | 2 (0.76%) |
| IFNA7 | 2 (11.76%) | 2 (0.76%) |
| IFNW1 | 2 (11.76%) | 2 (0.76%) |
| KIF19 | 2 (11.76%) | 2 (0.76%) |
| MAFG | 2 (11.76%) | 2 (0.76%) |
| MCRIP1 | 2 (11.76%) | 2 (0.76%) |
| MEP1A | 2 (11.76%) | 2 (0.76%) |
| MRPL12 | 2 (11.76%) | 2 (0.76%) |
| MYADML2 | 2 (11.76%) | 2 (0.76%) |
| NPB | 2 (11.76%) | 2 (0.76%) |
| P4HB | 2 (11.76%) | 2 (0.76%) |
| Gene | Altered group | Unaltered group |
| AARD | 2 (100.00%) | 0 (0.00%) |
| ASAP1 | 2 (100.00%) | 0 (0.00%) |
| ATAD2 | 2 (100.00%) | 0 (0.00%) |
| C8ORF76 | 2 (100.00%) | 0 (0.00%) |
| CASC8 | 2 (100.00%) | 0 (0.00%) |
| CCAT1 | 2 (100.00%) | 0 (0.00%) |
| CCDC26 | 2 (100.00%) | 0 (0.00%) |
| CCN3 | 2 (100.00%) | 0 (0.00%) |
| CCN4 | 2 (100.00%) | 0 (0.00%) |
| COLEC10 | 2 (100.00%) | 0 (0.00%) |
| CYRIB | 2 (100.00%) | 0 (0.00%) |
| DEPTOR | 2 (100.00%) | 0 (0.00%) |
| DERL1 | 2 (100.00%) | 0 (0.00%) |
| DSCC1 | 2 (100.00%) | 0 (0.00%) |
| EFR3A | 2 (100.00%) | 0 (0.00%) |
| EIF3H | 2 (100.00%) | 0 (0.00%) |
| EXT1 | 2 (100.00%) | 0 (0.00%) |
| FAM83A | 2 (100.00%) | 0 (0.00%) |
| FAM91A1 | 2 (100.00%) | 0 (0.00%) |
| FBXO32 | 2 (100.00%) | 0 (0.00%) |
| FER1L6 | 2 (100.00%) | 0 (0.00%) |
| GSDMC | 2 (100.00%) | 0 (0.00%) |
| HHLA1 | 2 (100.00%) | 0 (0.00%) |
| HPYR1 | 2 (100.00%) | 0 (0.00%) |
| KCNQ3 | 2 (100.00%) | 0 (0.00%) |
| KHDRBS3 | 2 (100.00%) | 0 (0.00%) |
| KLHL38 | 2 (100.00%) | 0 (0.00%) |
| LINC00861 | 2 (100.00%) | 0 (0.00%) |
| LINC00964 | 2 (100.00%) | 0 (0.00%) |
| LINC00977 | 2 (100.00%) | 0 (0.00%) |
| LINC02912 | 2 (100.00%) | 0 (0.00%) |
| LRATD2 | 2 (100.00%) | 0 (0.00%) |
| MED30 | 2 (100.00%) | 0 (0.00%) |
| MRPL13 | 2 (100.00%) | 0 (0.00%) |
| MTSS1 | 2 (100.00%) | 0 (0.00%) |
| NDRG1 | 2 (100.00%) | 0 (0.00%) |
| NDUFB9 | 2 (100.00%) | 0 (0.00%) |
| NSMCE2 | 2 (100.00%) | 0 (0.00%) |
| NTAQ1 | 2 (100.00%) | 0 (0.00%) |
| OC90 | 2 (100.00%) | 0 (0.00%) |
| PCAT1 | 2 (100.00%) | 0 (0.00%) |
| PCAT2 | 2 (100.00%) | 0 (0.00%) |
| PLEC | 2 (100.00%) | 0 (0.00%) |
| POU5F1B | 2 (100.00%) | 0 (0.00%) |
| PVT1 | 2 (100.00%) | 0 (0.00%) |
| RAD21 | 2 (100.00%) | 0 (0.00%) |
| RN7SKP153 | 2 (100.00%) | 0 (0.00%) |
| RN7SKP155 | 2 (100.00%) | 0 (0.00%) |
| RN7SKP206 | 2 (100.00%) | 0 (0.00%) |
| RN7SKP226 | 2 (100.00%) | 0 (0.00%) |
| Gene | Altered group | Unaltered group |
| PAPPA2 | 6 (31.58%) | 17 (3.98%) |
| C3 | 6 (31.58%) | 15 (3.51%) |
| PREP | 5 (26.32%) | 6 (1.41%) |
| EFNB3 | 5 (26.32%) | 7 (1.64%) |
| CST4 | 5 (26.32%) | 8 (1.87%) |
| ALOX12 | 5 (26.32%) | 11 (2.58%) |
| GLI1 | 5 (26.32%) | 12 (2.81%) |
| KLK1 | 5 (26.32%) | 12 (2.81%) |
| MRPL24 | 5 (26.32%) | 13 (3.04%) |
| KIAA0408 | 5 (26.32%) | 14 (3.28%) |
| ATP2B4 | 5 (26.32%) | 15 (3.51%) |
| CACNA1S | 5 (26.32%) | 16 (3.75%) |
| DDB1 | 5 (26.32%) | 16 (3.75%) |
| HEBP1 | 5 (26.32%) | 16 (3.75%) |
| LRP1 | 5 (26.32%) | 16 (3.75%) |
| ABCA1 | 5 (26.32%) | 17 (3.98%) |
| ARFGEF1 | 5 (26.32%) | 17 (3.98%) |
| CD4 | 5 (26.32%) | 17 (3.98%) |
| MAP1B | 5 (26.32%) | 17 (3.98%) |
| MUC17 | 5 (26.32%) | 17 (3.98%) |
| CNTROB | 4 (21.05%) | 2 (0.47%) |
| NETO2 | 4 (21.05%) | 3 (0.70%) |
| OR10G2 | 4 (21.05%) | 3 (0.70%) |
| SENP6 | 4 (21.05%) | 4 (0.94%) |
| ARHGEF40 | 4 (21.05%) | 5 (1.17%) |
| ATN1 | 4 (21.05%) | 5 (1.17%) |
| PPP1R10 | 4 (21.05%) | 5 (1.17%) |
| TMCC3 | 4 (21.05%) | 5 (1.17%) |
| OR52B6 | 4 (21.05%) | 7 (1.64%) |
| DGKA | 4 (21.05%) | 8 (1.87%) |
| PKD2 | 4 (21.05%) | 8 (1.87%) |
| ACSM2A | 4 (21.05%) | 9 (2.11%) |
| ADAMTS8 | 4 (21.05%) | 9 (2.11%) |
| ASH1L | 4 (21.05%) | 9 (2.11%) |
| DUOX1 | 4 (21.05%) | 9 (2.11%) |
| HMGCLL1 | 3 (15.79%) | 0 (0.00%) |
| ATRN | 3 (15.79%) | 1 (0.23%) |
| C9ORF152 | 3 (15.79%) | 1 (0.23%) |
| TMEM30A | 3 (15.79%) | 1 (0.23%) |
| WDR27 | 3 (15.79%) | 1 (0.23%) |
| CCN2 | 3 (15.79%) | 2 (0.47%) |
| CD109 | 3 (15.79%) | 2 (0.47%) |
| FILIP1 | 3 (15.79%) | 2 (0.47%) |
| MFSD4B | 3 (15.79%) | 2 (0.47%) |
| PATJ | 3 (15.79%) | 2 (0.47%) |
| PTGER3 | 3 (15.79%) | 2 (0.47%) |
| SLITRK2 | 3 (15.79%) | 2 (0.47%) |
| ERN2 | 3 (15.79%) | 3 (0.70%) |
| SIRPA | 3 (15.79%) | 3 (0.70%) |
| TROAP | 3 (15.79%) | 3 (0.70%) |
| Gene | Altered group | Unaltered group |
| CDKN2A | 5 (25.00%) | 10 (3.85%) |
| SIRPA | 3 (15.00%) | 0 (0.00%) |
| ARHGAP21 | 3 (15.00%) | 1 (0.38%) |
| PAK5 | 3 (15.00%) | 1 (0.38%) |
| CPXM1 | 3 (15.00%) | 2 (0.77%) |
| GRAMD1A | 3 (15.00%) | 2 (0.77%) |
| SRD5A1 | 3 (15.00%) | 2 (0.77%) |
| ADAM33 | 2 (10.00%) | 0 (0.00%) |
| ADRA1D | 2 (10.00%) | 0 (0.00%) |
| ANGPT4 | 2 (10.00%) | 0 (0.00%) |
| AP5S1 | 2 (10.00%) | 0 (0.00%) |
| ATRN | 2 (10.00%) | 0 (0.00%) |
| ATXN3L | 2 (10.00%) | 0 (0.00%) |
| AVP | 2 (10.00%) | 0 (0.00%) |
| BMI1 | 2 (10.00%) | 0 (0.00%) |
| BMP2 | 2 (10.00%) | 0 (0.00%) |
| C20ORF141 | 2 (10.00%) | 0 (0.00%) |
| C20ORF202 | 2 (10.00%) | 0 (0.00%) |
| C20ORF27 | 2 (10.00%) | 0 (0.00%) |
| C20ORF96 | 2 (10.00%) | 0 (0.00%) |
| CDC25B | 2 (10.00%) | 0 (0.00%) |
| CDS2 | 2 (10.00%) | 0 (0.00%) |
| CHGB | 2 (10.00%) | 0 (0.00%) |
| COL20A1 | 2 (10.00%) | 0 (0.00%) |
| CRLS1 | 2 (10.00%) | 0 (0.00%) |
| DDRGK1 | 2 (10.00%) | 0 (0.00%) |
| DEFB125 | 2 (10.00%) | 0 (0.00%) |
| DEFB126 | 2 (10.00%) | 0 (0.00%) |
| DEFB127 | 2 (10.00%) | 0 (0.00%) |
| DEFB128 | 2 (10.00%) | 0 (0.00%) |
| DEFB129 | 2 (10.00%) | 0 (0.00%) |
| DEFB132 | 2 (10.00%) | 0 (0.00%) |
| EBF4 | 2 (10.00%) | 0 (0.00%) |
| ENKUR | 2 (10.00%) | 0 (0.00%) |
| FAM110A | 2 (10.00%) | 0 (0.00%) |
| FAM47B | 2 (10.00%) | 0 (0.00%) |
| FASTKD5 | 2 (10.00%) | 0 (0.00%) |
| FERMT1 | 2 (10.00%) | 0 (0.00%) |
| FKBP1A | 2 (10.00%) | 0 (0.00%) |
| FRMD5 | 2 (10.00%) | 0 (0.00%) |
| GFRA4 | 2 (10.00%) | 0 (0.00%) |
| GNRH2 | 2 (10.00%) | 0 (0.00%) |
| GPR174 | 2 (10.00%) | 0 (0.00%) |
| GRIPAP1 | 2 (10.00%) | 0 (0.00%) |
| HACD1 | 2 (10.00%) | 0 (0.00%) |
| HAUS6 | 2 (10.00%) | 0 (0.00%) |
| HSPA12B | 2 (10.00%) | 0 (0.00%) |
| ITGA8 | 2 (10.00%) | 0 (0.00%) |
| ITPA | 2 (10.00%) | 0 (0.00%) |
| LAMP5 | 2 (10.00%) | 0 (0.00%) |
We further evaluated the potential interactions between SHMT1, SHMT2, and their NG. Results indicated that 42 nodes, 146 edges, and 3 clusters were obtained in the constructed PPI network of SHMT1 and its NG among patients with KICH (Fig. 8A). SHMT1 and its NG were linked to a complex interaction network (71 genes and 267 edges) through physical interactions, co-expression, pathways, shared protein domains, and predictions (Fig. 8B). Furthermore, we found that 40 nodes, 106 edges, and 3 clusters were obtained in the constructed PPI network of SHMT1 and its NG among patients with KIRC (Fig. 8C). SHMT1 and its NG were linked to a complex interaction network (70 genes and 389 edges) through co-expression, pathway, genetic interactions, co-localization, and shared protein domains (Fig. 8D). Furthermore, 44 nodes, 198 edges, and 3 clusters were obtained in the constructed PPI network of SHMT1 and its NG among patients with KIRP (Fig. 8E). SHMT1 and its NG were linked to a complex interaction network (71 genes and 361 edges) through co-expression, physical interactions, shared protein domains, co-localization, and prediction (Fig. 8F). Conversely, 34 nodes, 206 edges, and 3 clusters were obtained in the constructed PPI network of SHMT2 and its NG in KICH (Fig. 9A). SHMT2 and its NG were linked to a complex interaction network (56 genes and 154 edges) through co-expression, physical interactions, and shared protein domains (Fig. 9B). In addition, 38 nodes, 146 edges, and 3 clusters were obtained in the constructed PPI network of SHMT2 and its NG in KIRC (Fig. 9C). SHMT2 and its NG were linked to a complex interaction network (71 genes and 151 edges) through co-expression, co-localization, physical interactions, shared protein domains, and prediction (Fig. 9D). A total of 43 nodes, 148 edges, and 3 clusters were obtained in the constructed PPI network of SHMT2 and its NG among patients with KIRP (Fig. 9E). SHMT2 and its NG were linked to a complex interaction network (71 genes and 219 edges) through co-expression, physical interactions, co-localization, shared protein domains, and prediction (Fig. 9F).
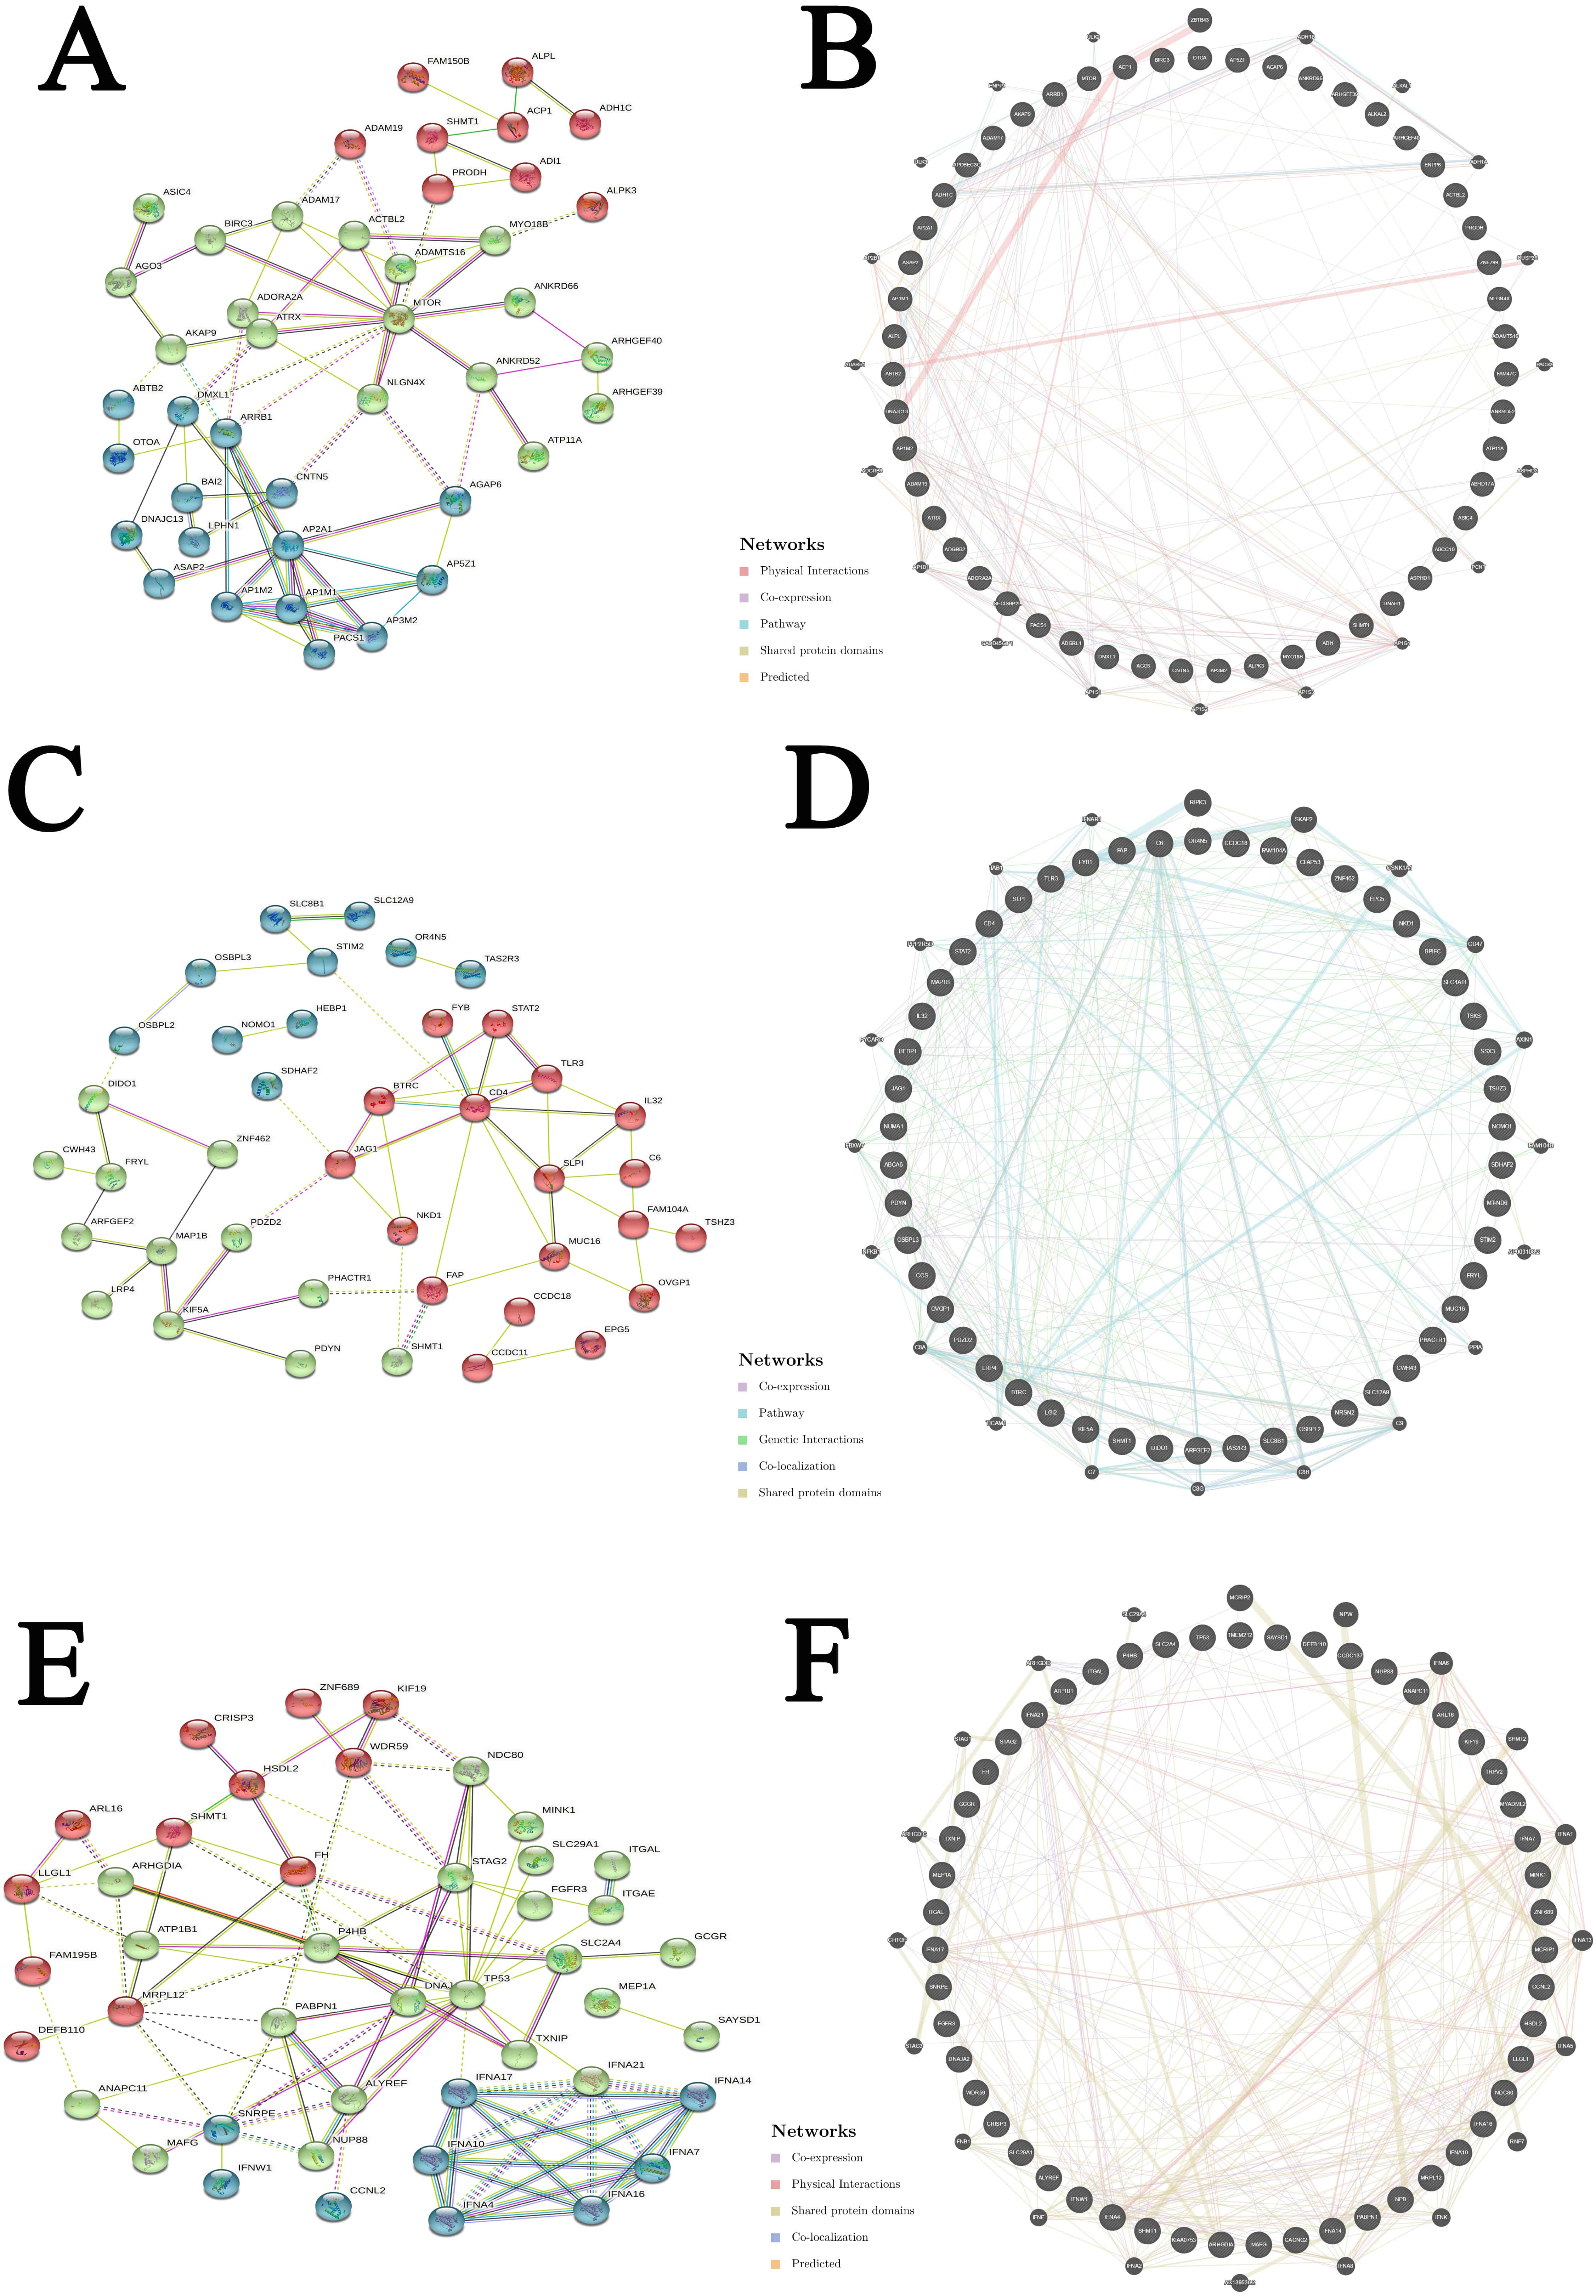 Fig. 8.
Interaction analyses of SHMT1 and their NG in RCC (STRING and GeneMANIA). (A) PPI network of SHMT1 and its NG in KICH. (B) Network analyses of SHMT1 and its NG in KICH. (C) PPI network of SHMT1 and its NG in KIRC. (D) Network analyses of SHMT1 and its NG in KIRC. (E) PPI network of SHMT1 and its NG in KIRP. (F) Network analyses of SHMT1 and its NG in KIRP.
 Fig. 9.
Interaction analyses of SHMT2 and their NG in RCC (STRING and GeneMANIA). (A) PPI network of SHMT2 and its NG in KICH. (B) Network analyses of SHMT2 and its NG in KICH. (C) PPI network of SHMT2 and its NG in KIRC. (D) Network analyses of SHMT2 and its NG in KIRC. (E) PPI network of SHMT2 and its NG in KIRP. (F) Network analyses of SHMT2 and its NG in KIRP.
We further performed GO and KEGG pathway enrichment analyses of SHMT1, SHMT2, and their top 50 altered NG in patients with RCC using the Metascape database. Results indicated that biological processes related to SHMT1 and its NG among patients with KICH mainly included cardiac muscle cell development, pyrimidine-containing compound metabolic processes, and multicellular organismal signaling (Fig. 10A). Their cellular components included the AP-type membrane coat adaptor complex, anchored membrane component, and synaptic membrane (Fig. 10B). Clathrin adaptor-, metalloendopeptidase-, and GTPase regulator activities were involved to their molecular functions (Fig. 10C). KEGG pathway analysis revealed that lysosome activity, human immunodeficiency virus 1 infection, and endocytosis were enriched (Fig. 10D). However, our results showed that synapse assembly, canonical Wnt signaling pathway regulation, and myeloid cell differentiation regulation were the biological processes related to SHMT1 and its NG among patients with KIRC (Fig. 10E). Neuronal cell bodies, sites of polarized growth, and extrinsic membrane components were related to their cellular components (Fig. 10F). Lipid binding and active transmembrane transporter- and lipid transporter activity were related to their main molecular functions (Fig. 10G). KEGG pathway analysis revealed that SHMT1 and its NG were associated with the coronavirus disease 2019 and pathways of neurodegeneration (Fig. 10H). Furthermore, biological processes related to SHMT1 and its NG among patients with KIRP mainly included a positive regulation of peptidyl-serine phosphorylation of the STAT protein, nucleocytoplasmic transport, and cellular response to hypoxia (Fig. 10I). The cellular components were the external side of the plasma membrane, axon, and chromosomal region (Fig. 10J). Type I interferon receptor binding, integrin binding, and protein heterodimerization were associated with their main molecular functions (Fig. 10K). RIG-I-like receptor signaling pathway, cell cycle, and actin cytoskeleton regulation were enriched according to the KEGG pathway analysis (Fig. 10L).
 Fig. 10.
GO function and KEGG pathways enrichment analyses of SHMT1 and their NG in RCC (Metascape). (A) Biological processes of SHMT1 and its NG in KICH. (B) Cellular components of SHMT1 and its NG in KICH. (C) Molecular functions of SHMT1 and its NG in KICH. (D) KEGG pathway analysis of SHMT1 and its NG in KICH. (E) Biological processes of SHMT1 and its NG in KIRC. (F) Cellular components of SHMT1 and its NG in KIRC. (G) Molecular functions of SHMT1 and its NG in KIRC. (H) KEGG pathway analysis of SHMT1 and its NG in KIRC. (I) Biological processes of SHMT1 and its NG in KIRP. (J) Cellular components of SHMT1 and its NG in KIRP. (K) Molecular functions of SHMT1 and its NG in KIRP. (L) KEGG pathway analysis of SHMT1 and its NG in KIRP.
The biological processes related to SHMT2 and its NG among patients with KICH mainly included plasma membrane organization, cell-cell junction organization, and positive regulation of organelle organization (Fig. 11A). Their cellular components included the ubiquitin ligase complex, chromosomal region, and mitochondrial membrane (Fig. 11B). Cell adhesion molecule and phospholipid bindings were involved to their molecular functions (Fig. 11C). However, we found that calcium ion transmembrane import into the cytosol, positive regulation of lipid localization, and regulation of acute inflammatory response were biological processes associated to SHMT2 and its NG among patients with KIRC (Fig. 11D). The apical plasma membrane, perinuclear region of the cytoplasm, and sarcolemma were related to their cellular components (Fig. 11E). Protein domain-specific binding, enzyme inhibitor activity, and endopeptidase activity were associated to their main molecular functions (Fig. 11F). KEGG pathway analysis revealed that SHMT2 and its NG were associated with cAMP and calcium signaling pathways (Fig. 11G). Furthermore, biological processes related to SHMT2 and its NG among patients with KIRP mainly included the regulation of the transforming growth factor-beta receptor signaling pathway, defense response to Gram-negative bacteria, and positive binding regulation (Fig. 11H). Their cellular components included the leading-edge membrane, extrinsic membrane component, and spindle (Fig. 11I). Hormone activity, integrin, and protein kinase regulatory activity was related to their main molecular functions (Fig. 11J). MiRNAs involved in cancer and neuroactive ligand-receptor interactions were enriched according to KEGG pathway analysis (Fig. 11K).
 Fig. 11.
GO function and KEGG pathways enrichment analyses of SHMT2 and their NG in RCC (Metascape). (A) Biological processes of SHMT2 and its NG in KICH. (B) Cellular components of SHMT2 and its NG in KICH. (C) Molecular functions of SHMT2 and its NG in KICH. (D) Biological processes of SHMT2 and its NG in KIRC. (E) Cellular components of SHMT2 and its NG in KIRC. (F) Molecular functions of SHMT2 and its NG in KIRC. (G) KEGG pathway analysis of SHMT2 and its NG in KIRC. (H) Biological processes of SHMT2 and its NG in KIRP. (I) Cellular components of SHMT2 and its NG in KIRP. (J) Molecular functions of SHMT2 and its NG in KIRP. (K) KEGG pathway analysis of SHMT2 and its NG in KIRP.
We used the TRRUST database to analyze the
key regulatory factors of SHMT1 and SHMT2 in patients with RCC.
We found that MYC was the critical transcription factor of SHMT1 and its
NG among patients with KICH (p
| Type | Key TF | Description | Regulated gene | p-value |
| KICH | MYC | v-myc myelocytomatosis viral oncogene homolog (avian) | PRODH, SHMT1 | 0.03 |
| KIRC | STAT1 | signal transducer and activator of transcription 1 | STAT2, TLR3 | 0.0193 |
| KIRP | PPARG | peroxisome proliferator-activated receptor gamma | SLC2A4, TP53, TXNIP | 0.000755 |
| NR3C1 | nuclear receptor subfamily 3, group C, member 1 | ATP1B1, TP53 | 0.00473 | |
| HDAC1 | histone deacetylase 1 | TP53, TXNIP | 0.0158 | |
| STAT1 | signal transducer and activator of transcription 1 | FGFR3, TP53 | 0.0217 | |
| MYC | v-myc myelocytomatosis viral oncogene homolog (avian) | SHMT1, TP53 | 0.03 |
| Type | Key TF | Description | Regulated gene | p-value |
| KICH | AR | androgen receptor | ATAD2, NDRG1 | 0.00895 |
| KIRC | SREBF2 | sterol regulatory element binding transcription factor 2 | ABCA1, LRP1 | 0.00122 |
| MYCN | v-myc myelocytomatosis viral related oncogene, neuroblastoma derived (avian) | DDB1, EFNB3 | 0.00609 | |
| SP3 | Sp3 transcription factor | ABCA1, ALOX12 | 0.0348 | |
| KIRP | FOXM1 | forkhead box M1 | CDC25B, CDKN2A | 0.000806 |
| DNMT1 | DNA (cytosine-5-)-methyltransferase 1 | BMP2, CDKN2A | 0.0027 | |
| REST | RE1-silencing transcription factor | AVP, CHGB | 0.00287 | |
| E2F1 | E2F transcription factor 1 | BMI1, CDKN2A | 0.044 |
miRNA targets of SHMT1 and SHMT2 were analyzed using the
LinkedOmics database. We found that (GCACTTT) miR-17-5P, miR-20A, miR-106A,
miR-106B, miR-20B, and miR-519D; (TTTGCAC) miR-19A and miR-19B; and (AAGCCAT)
miR-135A and miR-135B were the top three miRNA targets of SHMT1 among patients with KICH (p
| Type | Enriched category | Gene set | Leading edge number | p-value |
| KICH | miRNA Target | GCACTTT, miR-17-5P, miR-20A, miR-106A, miR-106B, miR-20B, miR-519D | 111 | 0.001 |
| TTTGCAC, miR-19A, miR-19B | 96 | 0.001 | ||
| AAGCCAT, miR-135A, miR-135B | 58 | 0.001 | ||
| KIRC | miRNA Target | AAGTCCA, miR-422B, miR-422A | 23 | 0.001 |
| GCTTGAA, miR-498 | 26 | 0.001 | ||
| GGGGCCC, miR-296 | 11 | 0.001 | ||
| KIRP | miRNA Target | CAGGTCC, miR-492 | 22 | 0.001 |
| ACTGAAA, miR-30A-3P, miR-30E-3P | 68 | 0.001 | ||
| CTTTGTA, miR-524 | 137 | 0.001 |
| Type | Enriched category | Gene set | Leading edge number | p-value |
| KICH | miRNA Target | AAGCAAT, miR-137 | 48 | 0.001 |
| GGGCATT, miR-365 | 22 | 0.001 | ||
| AACATTC, miR-409-3P | 31 | 0.001 | ||
| KIRC | miRNA Target | ACTGAAA, miR-30A-3P, miR-30E-3P | 72 | 0.001 |
| CATGTAA, miR-496 | 62 | 0.001 | ||
| AGCATTA, miR-155 | 48 | 0.001 | ||
| KIRP | miRNA Target | ATGTACA, miR-493 | 101 | 0.001 |
| GGGCATT, miR-365 | 46 | 0.001 | ||
| CTTTGCA, miR-527 | 66 | 0.001 |
The mRNA sequencing data from patients with KICH (n = 66), KIRC (n = 533), and
KIRP (n = 290), using the LinkedOmics database, were analyzed. Results indicated
that the expression of 19,216 genes was correlated with SHMT1 expression
in KICH. The 10,757 and 8459 genes were positively and negatively correlated with
SHMT1 expression, respectively (Fig. 12A). We screened 50 genes whose
expression levels were significantly correlated with SHMT1 expression in
KICH (p
 Fig. 12.
Genes differentially expressed in correlation with SHMT1 expression in RCC (LinkedOmics). (A) A Pearson test was used to analyze correlations between SHMT1 expression and genes differentially expressed in patients with KICH. (B,C) Heatmaps showing positively and negatively expressed genes correlated with SHMT1 expression in patients with KICH. (D) A Pearson test was used to analyze correlations between SHMT1 expression and genes differentially expressed in patients with KIRC. (E,F) Heatmaps showing genes whose expression positively and negatively correlated with SHMT1 expression in patients with KIRC. (G) A Pearson test was used to analyze correlations between SHMT1 expression and genes differentially expressed in patients with KIRP. (H,I) Heatmaps showing genes whose expression positively and negatively correlated with SHMT1 expression in patients with KIRP.
 Fig. 13.
Pearson correlation analysis of gene expression and SHMT1 in RCC (LinkedOmics). (A) PRODH in patients with KICH. (B) SH3KBP1 in patients with KICH. (C) EML6 in patients with KICH. (D) ACSM2B in patients with KIRC. (E) ACSM2A in patients with KIRC. (F) PDZK1 in patients with KIRC. (G) SMTNL2 in patients with KIRP. (H) ACSM2A in patients with KIRP. (I) ACSM5 in patients with KIRP.
Our results showed that the expression levels of 19,216 genes were correlated
with SHMT2 expression in KICH. Moreover, 10,436 and 8780 genes were
positively and negatively correlated with SHMT2 expression, respectively
(Fig. 14A). We screened 50 genes whose expression levels were significantly
positively and negatively correlated with SHMT2 expression in KICH
(p
 Fig. 14.
Genes differentially expressed in correlation with SHMT2 expression in RCC (LinkedOmics). (A) A Pearson test was used to analyze correlations between SHMT2 expression and genes differentially expressed in patients with KICH. (B,C) Heat maps showing genes whose expression positively and negatively correlated with SHMT2 expression in patients with KICH. (D) A Pearson test was used to analyze correlations between SHMT2 expression and genes differentially expressed in patients with KIRC. (E,F) Heat maps showing genes whose expression positively and negatively correlated with SHMT2 expression in patients with KIRC. (G) A Pearson test was used to analyze correlations between SHMT2 expression and genes differentially expressed in patients with KIRP. (H,I) Heat maps showing genes whose expression positively and negatively correlated with SHMT2 expression in patients with KIRP.
 Fig. 15.
Pearson correlation analysis of gene expression and SHMT2 in RCC (LinkedOmics). (A) PSAT1 in patients with KICH. (B) ASNS in patients with KICH. (C) YARS in patients with KICH. (D) NDUFA4L2 in patients with KIRC. (E) RALGPS1 in patients with KIRC. (F) NOL3 in patients with KIRC. (G) CDK4 in patients with KIRP. (H) GK5 in patients with KIRP. (I) C12orf52 in patients with KIRP.
The TIMER database was used to evaluate the relationship of immune cell
infiltration levels with SHMT1 and SHMT2 expression among
patients with RCC. Results showed that SHMT1 expression was positively
correlated with B-cell (Cor = 0.308, p = 1.25
 Fig. 16.
Correlation between SHMT expression and immune cell infiltration levels in RCC (TIMER). (A) SHMT1 in patients with KICH. (B) SHMT1 in patients with KIRC. (C) SHMT1 in patients with KIRP. (D) SHMT2 in patients with KICH. (E) SHMT2 in patients with KIRC. (F) SHMT2 in patients with KIRP.
Metabolic reprogramming is an essential hallmark of cancer development. Normal cells typically rely on the uptake of serine/glycine from the environment. However, some cancer subtypes synthesize their own serine/glycine intracellularly and become dependent to synthesis [21, 22] by relying on intracellular serine synthesis to meet the high demands of cancer cells, synthesize purines, control redox homeostasis, regulate DNA methylation, and support lipid metabolism [22]. As a result, tumor growth, differentiation, and metastasis are promoted. SHMT is a central enzyme for metabolic reprogramming in cancer cells, which activates a carbon unit in serine-glycine one-carbon metabolism. Previous studies have shown that SHMT1 and SHMT2 are highly upregulated in some cancers [23]. However, the expression, prognosis, gene regulation network, and regulatory targets of SHMT1 and SHMT2 have not been reported in patients with RCC.
The expression levels of SHMT1 and SHMT2 were compared in patients with RCC based on sample type, individual cancer stage, sex, and patient age. This study found that SHMT2 transcript levels were significantly upregulated in patients with KICH, KIRC, and KIRP. Contrary to previous findings [23], SHMT1 expression was significantly downregulated in these patients. Our results showed that SHMT1 transcript levels in patients with KIRC were significantly upregulated in females compared to that in males. However, SHMT1 transcript levels were significantly downregulated and SHMT2 transcript levels were upregulated in female patients with KIRP compared to those in the corresponding male patients. Nevertheless, this finding has not been previously reported. The differential expression of SHMT1 and SHMT2 between the sexes merits increased attention. This may be an essential basis for the differential treatment of SHMT targets in male and female patients with RCC.
Furthermore, a significant positive correlation between SHMT1 expression and the pathological stages of KIRC and KIRP was found. Similarly, there was a significant positive correlation between SHMT2 expression and the pathological stages of KICH and KIRP. SHMT1 versus SHMT2 were altered by 9% vs 3% (n = 66 patients with KICH), 4% vs 4% (n = 446 patients with KIRC), and 6% vs 7% (n = 280 patients with KIRP), respectively. Moreover, SHMT1 promoter methylation levels were significantly upregulated in patients with KIRP. In contrast, SHMT2 promoter methylation levels were significantly downregulated in patients with KIRC and KIRP. Genetic changes and promoter methylation often result in abnormal gene expression and function. Abnormal SHMT1 and SHMT2 expression caused by genetic changes and promoter methylation may also be an essential factor. In addition, the most frequently altered NG of SHMT1 and SHMT2 in patients with KICH, KIRP, and KIRC were AP5Z1, MUC16, STAG2, AARD, PAPPA2, and CDKN2A. These genes promote cancer cell growth, differentiation, and invasion [24, 25, 26, 27]. Therefore, these gene alterations may be involved, to different degrees and via different pathways, in the occurrence and development of RCC.
Finally, we assessed the prognostic value of SHMT expression in patients with RCC. Patients with KIRC or KIRP with high SHMT1 expression had longer survival period than those with low SHMT1 expression. In contrast, KICH patients with low SHMT2 expression had longer survival period than those with high SHMT2 expression. Interestingly, we found that patients with KIRC with high SHMT2 expression had longer survival period than those with low SHMT2 expression. This contradicts the previous findings that SHMT2 expression levels were significantly upregulated in patients with KIRC. High SHMT2 expression may have other vital functions in patients with KIRC, which requires further investigation. In summary, SHMT1 and SHMT2 may be potential prognostic markers in patients with RCC.
We further evaluated the potential interactions between SHMT and its NG. SHMT1, SHMT2, and their NG were linked to a complex interaction network through co-expression, physical interactions, and shared protein domains. Subsequently, we evaluated the functions of SHMT and its NG. The molecular functions of SHMT1 and its NG in KICH were tumor-associated metalloendopeptidase- and GTPase regulatory activity. For example, membrane metalloendopeptidase inhibits prostate cancer development by attenuating the effects of gastrin-releasing peptides on stem/progenitor cells [28]. Additionally, the activation of Rap1 GTPase mediated by junctional adhesion molecule-A modulates the migration of breast cancer cells [29]. The KEGG pathway was involved in lysosome activity and endocytosis. Multidrug resistance in tumor cells reduces the efficacy of chemotherapy by preventing drug accumulation in cells through drug efflux pumps and lysosomal sequestration/exocytosis. To overcome this anti-cancer resistance, targeting lysosomes is considered an effective strategy for effective and selective anti-cancer therapy [30]. Enhancing receptor-mediated endocytosis is an essential strategy for the treatment of cancer and the reduction of side effects and multidrug resistance [31].
Furthermore, we found that active transmembrane transporter activity is related to tumor resistance, which is the molecular function of SHMT1 and its NG among patients with KIRC [32]. The main molecular functions associated with SHMT1 and its NG among patients with KIRP include type I interferon receptor binding, integrin binding, and protein heterodimerization related to tumor growth. Interferons are the most widely used human proteins for treating various cancers. Cell surface receptors are composed of two subunits, IFNAR1 and IFNAR2, which bind to all type I interferons and inhibit tumor growth [33]. Integrins are cell adhesion receptors (usually transmembrane glycoproteins) linked to the extracellular matrix. Enhanced integrin binding promotes cancer cell invasion and metastasis [34]. Protein heterodimerization is closely associated with tumor growth and migration. For example, HER2 and HER3, two members of the human epidermal receptor family of tyrosine kinase receptors, are associated with poor survival in patients with colorectal cancer. HER2/HER3 heterodimerization promotes the growth of colorectal cancer cells [35]. Moreover, CXCL12-CXCL4 heterodimerization prevents CXCL12-driven migration of breast cancer cells [36]. Their KEGG pathway involved the RIG-I-like receptor signaling pathway, cell cycle, and regulation of the actin cytoskeleton. Upregulation of the RIG-I-like receptor signaling pathway can promote the invasion and migration of non-small cell lung cancer cells [37]. Mitosis, the process by which cells divide, is regulated by cell cycle checkpoints. Interference with the cell cycle is vital in cancer treatment [38]. The actin cytoskeleton is an essential component of the eukaryotic cytoskeleton and plays a vital role in cancer metastasis [39].
Our results showed that the molecular functions of SHMT2 and its NG
among patients with KICH were tumor-associated cell adhesion molecule- and
phospholipid binding. For example, tumor cell migration depends on the
interaction between adhesion proteins and the extracellular matrix.
Lutheran/basal cell adhesion molecule promotes tumor cell migration by binding to
the sub-basal adhesin
Targeting mitogen-activated protein kinases in patients with RCC can inhibit the proliferation and migration of cancer cells [48]. Their KEGG pathway involves miRNAs in cancer. In recent years, miRNAs have become essential factors in cancer-related cachexia occurrence and participate in the mutual regulatory network of pro-inflammatory signaling pathways [49]. Hence, regulating the functions of SHMT and its NG may be an essential strategy for RCC treatment.
Subsequently, we explored the transcription factors and miRNA targets of SHMT in RCC. We found that MYC was a key transcription factor for SHMT1 and its NG in KICH. Moreover, c-MYC promotes the growth of RCC cells by inhibiting PLA2R1 transcription [50]. Our results also showed that STAT1, which inhibits the growth of A498 RCC cells [51], was the key transcription factor of SHMT1 and its NG in KIRC. Furthermore, we found that PPARG, NR3C1, HDAC1, STAT1, and MYC were the key transcription factors of SHMT1 and its NG among patients with KIRP. Recent studies have shown that these transcription factors affect the progression of multiple tumors [52, 53, 54]. Furthermore, this study indicated that AR, a potential target for Xp11.2 translocation RCC therapy [55], was the key transcription factor of SHMT2 and its NG among patients with KICH. We found that SREBF2, MYCN, and SP3 were the key transcription factors of SHMT2 and its NG among patients with KIRC. SREBF2, MYCN, and SP3 regulate the proliferation and migration of multiple cancer cells [56, 57, 58]. Additionally, FOXM1, DNMT1, REST, and E2F1 were the key transcription factors of SHMT2 and its NG among patients with KIRP. These transcription factors are major drivers of tumorigenesis and progression of multiple cancers, and thus are potential targets for anti-cancer therapy [59, 60]. miRNAs can be potentially use as diagnostic markers and therapeutic targets in cancer clinics. Therefore, we explored the miRNA targets of SHMT in patients with RCC. Recent studies have shown that these miRNAs regulate the occurrence and development of cancer. For example, miR-106 overexpression can promote proliferation and inhibit apoptosis of endometrial carcinoma RL95-2 cells [61]. Another study suggested that targeting miR-19 can inhibit the proliferation and invasion of breast cancer [62]. Moreover, miR-492 promotes cancer progression by targeting GJB4, a novel bladder cancer biomarker [63]. These miRNA targets are also involved in the regulation of tumor growth. For example, miR-137-3p inhibits colorectal cancer cell migration by regulating KDM1A-dependent epithelial-mesenchymal transition [64]. In addition, miR-496 inhibits the proliferation of gastric cancer cells through the AKT/mTOR signaling pathway targeting LYN [65]. Further, miR-493 induces the proliferation, migration, and invasion of esophageal cancer cells in vivo and in vitro by regulating the c-Jun target Wnt5a/PD-L1 [66]. Therefore, the transcription factors and miRNA targets of SHMT are associated with tumor cell proliferation, migration, invasion, and drug resistance. Hence, these transcription factors and miRNA of SHMT may be promising targets for cancer therapy. However, their relationship with RCC has not been fully elucidated. These results suggest that the transcription factors and miRNAs of SHMT may be potential RCC therapeutic targets.
We examined the correlation between differentially expressed genes and SHMT expression in patients with RCC. We found that in patients with KICH, KIRC, and KIRP, PRODH, SH3KBP1, and EML6; ACSM2B, ACSM2A, and PDZK1; and SMTNL2, ACSM2A, and ACSM5 were the top three genes, respectively, whose expression levels were positively associated with SHMT1 expression. These genetic abnormalities play essential roles in the development of multiple cancers. For example, PRODH regulates many pathophysiological processes, including cancer cell apoptosis and metastasis [67]. A loss of PDZK1 expression in patients with gastric cancer promotes the proliferation of gastric cancer cells by activating PI3K/AKT signaling through PTEN phosphorylation [68]. However, our results showed that in patients with KICH, KIRC, and KIRP, PSAT1, ASNS, and YARS; NDUFA4L2, RALGPS1, and NOL3; and CDK4, GK5, and C12orf52 were the top three genes, respectively, whose expression levels were positively or negatively correlated with SHMT2 expression. These genetic abnormalities can promote multiple cancer cells’ proliferation, differentiation, and metastasis. For example, PSAT1 may act as an oncogene that plays a vital role in various cancers. PSAT1 upregulation is involved in the growth of cervical cancer cells and cisplatin resistance via PI3K/AKT signaling pathway upregulation [69]. NDUFA4L2 promotes trastuzumab resistance in HER2-positive breast cancer cells [70]. CDK4 is a crucial cell cycle regulator frequently dysregulated in human malignancies. CDK4 inhibitor use can effectively suppress tumor growth and improve the efficacy of cisplatin treatment in patients with breast and ovarian cancers [71]. Therefore, targeting these genes may serve as adjuvant therapy for RCC.
Immunotherapy is a novel clinical treatment for cancer patients. Tumor immune infiltration is closely related to clinical prognosis. As expected, SHMT expression in patients with RCC was positively or negatively correlated with immune cell infiltration levels. Dendritic cells are the most effective antigen-presenting cells, whereas T-cells are highly effective antitumor-effector cells. The lack of interaction between these cells is a principal mechanism of tumor tolerance [72]. B-cell infiltration plays an essential role in tumor progression and prognosis. B-cells are considered the primary effector cells involved in humoral immunity and inhibit tumor progression by secreting immunoglobulins, promoting T-cell response, and directly killing cancer cells [73]. In recent years, the complex role of neutrophils in tumorigenesis and cancer progression has attracted much attention. Neutrophils kill tumor cells through direct cytotoxic and indirect effects by activating adaptive immune responses. In contrast, the pre-tumor phenotype of neutrophils may be related to cell proliferation, angiogenesis, and immunosuppression in the tumor microenvironment. Neutrophils have recently been identified as potential targets for cancer therapy [74]. Our results showed that SHMT1 expression was positively (B-cells and dendritic cells in KICH, B-cells in KIRC, and macrophages in KIRP) and negatively (B-cells and CD8+ T-cells in KIRP) correlated with immune cell infiltration levels. However, SHMT2 expression was positively correlated with immune cell infiltration levels (CD4+ T-cells, neutrophils, and dendritic cells in KICH and B-cells and CD8+ T-cells in KIRP). Therefore, the aim for SHMT or SHMT-related regulatory targets may be feasible for regulating immune cell infiltration in patients with RCC.
This study systematically analyzed the expression, gene regulatory network, prognostic value, and target prediction of SHMT in patients with RCC. SHMT1 and SHMT2 expression levels were different in patients with RCC. Therefore, different patients with RCC should be treated differently. These enzymes may be potential therapeutic and prognostic biomarkers in these patients and an essential strategy for accurately treating patients with RCC. Transcription factor regulation may be an essential strategy for RCC treatment. During this study, we successfully elucidated the relationship between SHMT1, SHMT2, and RCC and provided new insights for RCC treatment. However, further research is required to evaluate the pathological significance of the differential expression of these two SHMT isoenzymes in patients with RCC.
The datasets used and/or analyzed during the current study are available from the corresponding author on reasonable request.
YS, ZS and LD designed the research study. YS performed the research. YS, ZS, LD, JZ, WL, QL, LL, QX, JC, XL, and YC analyzed the data. All authors contributed to editorial changes in the manuscript. All authors read and approved the final manuscript. All authors have participated sufficiently in the work and agreed to be accountable for all aspects of the work.
Not applicable.
We thank Guangdong Medical University for their project support.
This work was supported by the project of financial fund science and technology special competitive allocation of Zhanjiang (Zhanke [2010]174) and postdoctoral Foundation of Guangdong Medical University (4SG22292G).
The authors declare no conflict of interest.
Publisher’s Note: IMR Press stays neutral with regard to jurisdictional claims in published maps and institutional affiliations.