
- Academic Editors
†These authors contributed equally.
Background: Myc-associated zinc finger protein (MAZ) plays a role in
cancer progression and metastasis. However, the role and underlying molecular
mechanism of MAZ in thyroid cancer have not yet been fully elucidated. This study
aimed to explore the clinical significance of MAZ in thyroid cancer tissues,
and clarify its mechanism in the occurrence and development of thyroid cancer.
Methods: The expression level of MAZ protein in thyroid cancer tissues
was detected by bioinformatics analysis and immunohistochemistry (IHC). The
relationship between the expression level of MAZ and clinicopathological
characteristics of thyroid cancer patients was analyzed by multivariate logistic
regression analysis. Quantitative reverse-transcription polymerase chain reaction
(RT-qPCR) was used to detect the mRNA expression level of MAZ in thyroid cancer
cell lines. After MAZ knockdown cell lines were constructed, wound healing and
Transwell assays were used to detect the migratory and invasive abilities of
cancer cells. Results: The results of IHC showed that the expression
level of MAZ protein in thyroid cancer tissues was higher than that in normal
adjacent thyroid tissues (p
Among endocrine malignancies, thyroid cancer accounts for 3% of diagnosed cancer cases worldwide. Medullary thyroid cancer is a tumor arising from the parafollicular cells or C cells of the thyroid gland, accounting for 2–3% of cases with thyroid cancer [1]. The thyroid cancer mainly originates from follicular cells, which is subdivided into poorly differentiated thyroid cancer (PDTC), follicular thyroid cancer (FTC), anaplastic thyroid cancer (ATC), and papillary thyroid carcinoma (PTC) [2]. PTC and FTC are classified as differentiated thyroid carcinoma (DTC) [1]. In the 2004 guideline of the World Health Organization Classification of Tumors, PDTC was considered as a distinct subtype of thyroid cancer [3], in which its prognosis was between DTC and ATC, and it was typically reported in older patients [4]. Preoperative risk assessment determines the primary treatment for thyroid cancer. The majority of patients with thyroid cancer require surgery. Depending on the characteristics of the patient’s disease, surgical modalities, such as lobectomy and total thyroidectomy with or without central cervical lymphatic dissection, are selected. Recurrent disease in DTC patients undergoing total thyroidectomy could be preventable and treatable with radioactive iodine (RAI). However, about 60–70% of PDTC patients and metastatic DTC patients may eventually develop to RAI-refractory (RAI-R) thyroid cancer [5]. The life expectancy of patients with RAI-R thyroid cancer is about 3 to 5 years [6]. ATC has the worst prognosis of follicular cells-derived malignancies, because it is typically diagnosed in an advanced metastatic stage, the primary tumor is large and rapidly grows, and complete resection is not always successful [7]. In addition, current treatment options for ATC are limited, mainly involving multimodal therapy, in vitro high-dose radiotherapy, and surgery or chemotherapy at the same time [5]. A previous study has shown that although multimodal therapy could negatively affect the quality of life of patients with localized ATC, it might provide some survival benefits to them [8]. Therefore, understanding of the molecular mechanism of thyroid cancer is particularly important for developing further efficacious therapeutic approaches.
As a transcription factor with zinc finger domains, Myc-associated zinc finger protein (MAZ) has different regulatory effects on the transcriptional initiation of different genes. It can not only transactivate a great number of genes, such as the RAS gene family [9], platelet aggregation-inducing factor (podoplanin, PDPN) [10], caveolin-1 (CAV1) [11], and vascular endothelial growth factor (VEGF) [12], but also inhibit certain oncogenes, including proto-oncogene c-Myc [13], endothelial nitric oxide synthase [14], c-Myb [15], transcription factor SP4 [16], and telomerase [17]. The high expression level of MAZ in malignant tumors has been confirmed in some studies [12, 18, 19, 20, 21, 22]. The interaction between MAZ and androgen receptor can promote the proliferation and metastasis of prostate cancer cells [14]. Franz et al. [23] found that combination of SPIN1 with MAZ could regulate the expression level of GDNF, thereby controlling the proliferation and apoptosis of human liposarcoma cells. Triner et al. [24] demonstrated that the expression level of MAZ could significantly promote the progression of colon cancer. It has also been shown that overexpression of MAZ could induce epithelial-mesenchymal transition (EMT) process in hepatocellular carcinoma (HCC), and it could be associated with the poor prognosis of HCC patients [20]. However, the functions and potential molecular mechanisms of MAZ in thyroid cancer have not yet been fully elucidated.
In the present study, the expression level of MAZ protein in thyroid cancer tissues was detected by immunohistochemistry (IHC), and the prognostic significance of MAZ in thyroid cancer was also analyzed. Furthermore, biological functions and molecular mechanisms of MAZ in thyroid cancer cells were explored through analyzing the expression level of MAZ. This study may provide a reliable basis for clinicians to treat thyroid cancer.
Analysis of differentially expressed genes (DEGs) in thyroid cancer and normal
tissues was performed using gene expression profiling interactive analysis
(GEPIA, http://gepia.cancer-pku.cn/index.html). The criteria were
A total of 58 pairs of paraffin-embedded papillary thyroid cancer tissue
microarray chips were provided by Xinchao Company (Shanghai, China), which were
routinely dried, dewaxed, hydrated, and the antigens were repaired under high
pressure with citrate repair buffer in 3% hydrogen peroxide. The chips were
soaked for 10 min to remove endogenous peroxidase. Then, goat serum was added for
blocking for 20 min, diluted primary antibody (MAZ, #ab85725, 1:200; Abcam,
Cambridge, UK) was added dropwise, and placed into a refrigerator at 4 °C
overnight. On the next day, the secondary antibody (enzyme-labeled
anti-mouse/rabbit IgG polymer) was added into drops and placed at room
temperature for 30 min. Afterwards, 3,3
All immunostained sections were double-blinded, and five fields of view were randomly selected under a high-magnification microscope for scoring. Staining intensity was scored according to the nuclear staining: 0 indicated no intensity, 1 indicated light intensity, 2 indicated medium intensity, and 3 indicated high intensity that was dark brown. More than 500 cells were counted to determine the percentage of immunostained cells in the total cells.
The percentage of positively stained cells was scored as follows: 0
(
Four thyroid cancer cell lines (human thyroid squamous cell carcinoma cell line
SW579, human papillary thyroid cancer cell lines B-CPAP and TPC-1, and human
anaplastic thyroid cancer cell line 8505C) were purchased and validated by STR
authentication and mycoplasma test from Shanghai Yihe Application Biological Technology Co., Ltd.
(Shanghai, China). The cells were cultured in a complete Dulbecco’s modified
Eagle’s medium (DMEM), consisting of fetal bovine serum (FBS) and
penicillin/streptomycin mixture (Solarbio Science & Technology Co., Ltd.,
Beijing, China) in an 89:10:1 ratio. The growth conditions of the cells were 5%
CO
Cells at the logarithmic growth phase were inoculated into six-well plates and transfected with liposome 2000 (Invitrogen, Carlsbad, CA, USA) according to the manufacturer’s instructions when the cells reached a confluence of 80%. After 6 h of transfection, the cells were stored in a fresh medium for subsequent experiments.
TRIzol reagent (Tiangen, Beijing, China) was used to extract the total RNA of thyroid cancer cell line 8505C after 48 h of transfection. Total RNA concentration was measured by Nanodrop 2000 (Thermo Fisher Scientific, Waltham, MA, USA). The transcriptome sequencing bioinformatics analysis was performed by GeneChem Co., Ltd. (Shanghai, China). The libraries were sequenced using a 150 bp double-ended sequencing strategy on the Illumina-HiSeq2000 platform. The raw imaging data were converted from sequence data generated by base calling (Illumina pipeline CASAVA ver. 1.8.2, Illumina Inc., San Diego, CA, USA). Then, quality control standards were used to remove reads that did not meet the following criteria: (1) readings are paired with joints and primers, at most two mismatches; (2) exceeding 5% of unknown bases at the time of reading; (3) over 50% of the low-quality bases. Finally, after quality control, filtered reads were retained for further analysis.
Analysis of DEGs in two groups (two biological replicates per group) was
performed using DESeq2 (version 1.16.1, R package, Auckland, New Zealand). DESeq2
shares information across genes to generate more accurate estimates of variation
based on the mean expression level of the gene. Benjamini-Hochberg method was
adopted to adjust the p and control the false discovery rate. Using
DESeq2, it was found that DEGs met p
The Gene Ontology (GO) enrichment analysis of DEGs was performed by the
clusterProfiler package of R 3.4.4 software, in which the gene length bias was
corrected. GO terms with corrected p
Total RNA was extracted using TRIzol reagent, and was then reversely transcribed
into a cDNA template, and PCR was performed using the SYBR Green Mixture kit
(Tiangen). The sequences of primers used for RT-qPCR are shown in
Supplementary Table 1. The PCR reaction conditions were summarized as
follows: denaturation at 95 °C for 10 min, extension at 95 °C
for 15 s, and annealing at 65 °C for 60 s for 40 cycles. Relative RNA
expression was calculated using the 2
Cells were harvested and lysed using RIPA Lysis Buffer (Beyotime, Shanghai, China). The concentration of total protein was determined by BCA Protein Assay Kit (Beyotime). 10 µg of protein samples were subjected to SDS-PAGE. After that, PVDF membrane was incubated with MAZ and GAPDH (#AF0006, 1:1000; Beyotime) primary antibody to determine the protein expression of MAZ and GAPDH.
Cells were cultured in 6-well plates. After 12 h of culture, the cells were scratched vertically in one direction with a 10 µL tip, and were then washed with phosphate-buffered saline (PBS) before adding fresh serum-free culture medium. The cells were observed and photographed under a microscope at 0, 24, and 48 h, respectively, and the cell migration was measured using ImageJ software (version 1.8.0, National Institutes of Health, Bethesda, MD, USA). The difference was determined between the scratching width with a mobility of 0 h minus the scratching width of 24 or 48 h and divided by the scratching width of 0 h.
Transwell chambers (BD, Franklin Lakes, NJ, USA) with or without Matrigel were
used to detect cell migration and invasion. Place the chamber into a 24-well
plate, add culture medium, and incubate in an incubator for 30 min. Add 100
µL serum-free culture medium containing 2
In the present study, SPSS 28.0 software (IBM, Armonk, NY, USA) was used to
perform statistical analysis. The comparison between two groups was carried out
by the Chi-square test. Multivariate logistic regression was used to analyze the
relationship between the expression level of MAZ and clinicopathological features
of patients with thyroid cancer. Survival analysis was performed using the
Kaplan-Meier method. The Spearman correlation test was used to analyze the
correlation between the expression levels of MAZ and FN1 in thyroid cancer
tissues. p
In order to determine the expression level of MAZ in thyroid cancer tissues,
bioinformatics analysis was initially conducted. In TCGA database, the expression
level of MAZ in thyroid cancer tissues was significantly higher than that in the
adjacent non-tumor tissues (p
 Fig. 1.
Expression of MAZ in thyroid cancer tissues. (A) Expression of
MAZ in thyroid cancer and adjacent tissues in TCGA database. (B) Representative
results of immunohistochemical staining (red arrows indicate the position of
image at
| Thyroid cancer tissues | Adjacent normal tissues | Total | |
| Positive | Negative | ||
| Positive | 9 | 35 | 44 |
| Negative | 2 | 12 | 14 |
| Total | 11 | 47 | 58 |
Notes: p
To further explore the effects of the expression level of MAZ on the prognosis
of patients with thyroid cancer, the relationship between clinicopathological
characteristics and the expression level of MAZ in 58 papillary thyroid cancer
patients was clarified. Clinicopathological variables presented in Table 2 were
included in the univariate analysis. The results showed that the expression level
of MAZ was correlated with tumor, node, and metastasis (TNM) stage, tumor
diameter, and tumor capsule (p
| Variables | Total | MAZ staining | p | |||
| Positive | Negative | |||||
| Gender | ||||||
| Male | 23 | 17 | 6 | 0.079 | 0.779 | |
| Female | 35 | 27 | 8 | |||
| Age (year) | ||||||
| 34 | 27 | 7 | 0.565 | 0.452 | ||
| 24 | 17 | 7 | ||||
| Tumor stage | ||||||
| III+IV | 18 | 17 | 1 | - | 0.044 | |
| I+II | 40 | 27 | 13 | |||
| Clinical stage | ||||||
| T3+T4 | 21 | 17 | 4 | 0.466 | 0.495 | |
| T1+T2 | 37 | 27 | 10 | |||
| Tumor diameter (cm) | ||||||
| 24 | 22 | 2 | 5.585 | 0.018 | ||
| 34 | 22 | 12 | ||||
| Tumor location | ||||||
| Bilateral | 10 | 7 | 3 | - | 0.691 | |
| Unilateral/isthmus | 48 | 37 | 11 | |||
| Tumor capsule | ||||||
| Yes | 52 | 42 | 10 | - | 0.026 | |
| No | 6 | 2 | 4 | |||
| Lymph node metastasis | ||||||
| Yes | 15 | 13 | 2 | - | 0.317 | |
| No | 43 | 31 | 12 | |||
Notes: Bold values indicate significance.
| Variables | S.E. | Walds | p-value | OR | 95% CI | ||
| Lower | Upper | ||||||
| Tumor stage | 2.102 | 1.083 | 3.769 | 0.052 | 8.185 | 0.980 | 68.366 |
| Tumor diameter | 1.792 | 0.821 | 4.761 | 0.029 | 6.000 | 1.200 | 29.998 |
| Tumor capsule | 2.128 | 0.935 | 5.183 | 0.023 | 8.400 | 1.345 | 52.476 |
Notes: Bold values indicate significance.
According to the clinical data downloaded from TCGA database, the Kaplan-Meier
method was used to analyze the relationship between the expression level of MAZ
and the prognosis of patients with thyroid cancer. According to the expression
level of MAZ, all patients were divided into two groups. Compared with the low
MAZ expression group, thyroid cancer patients in the high MAZ expression group
had lower OS and DFS (p
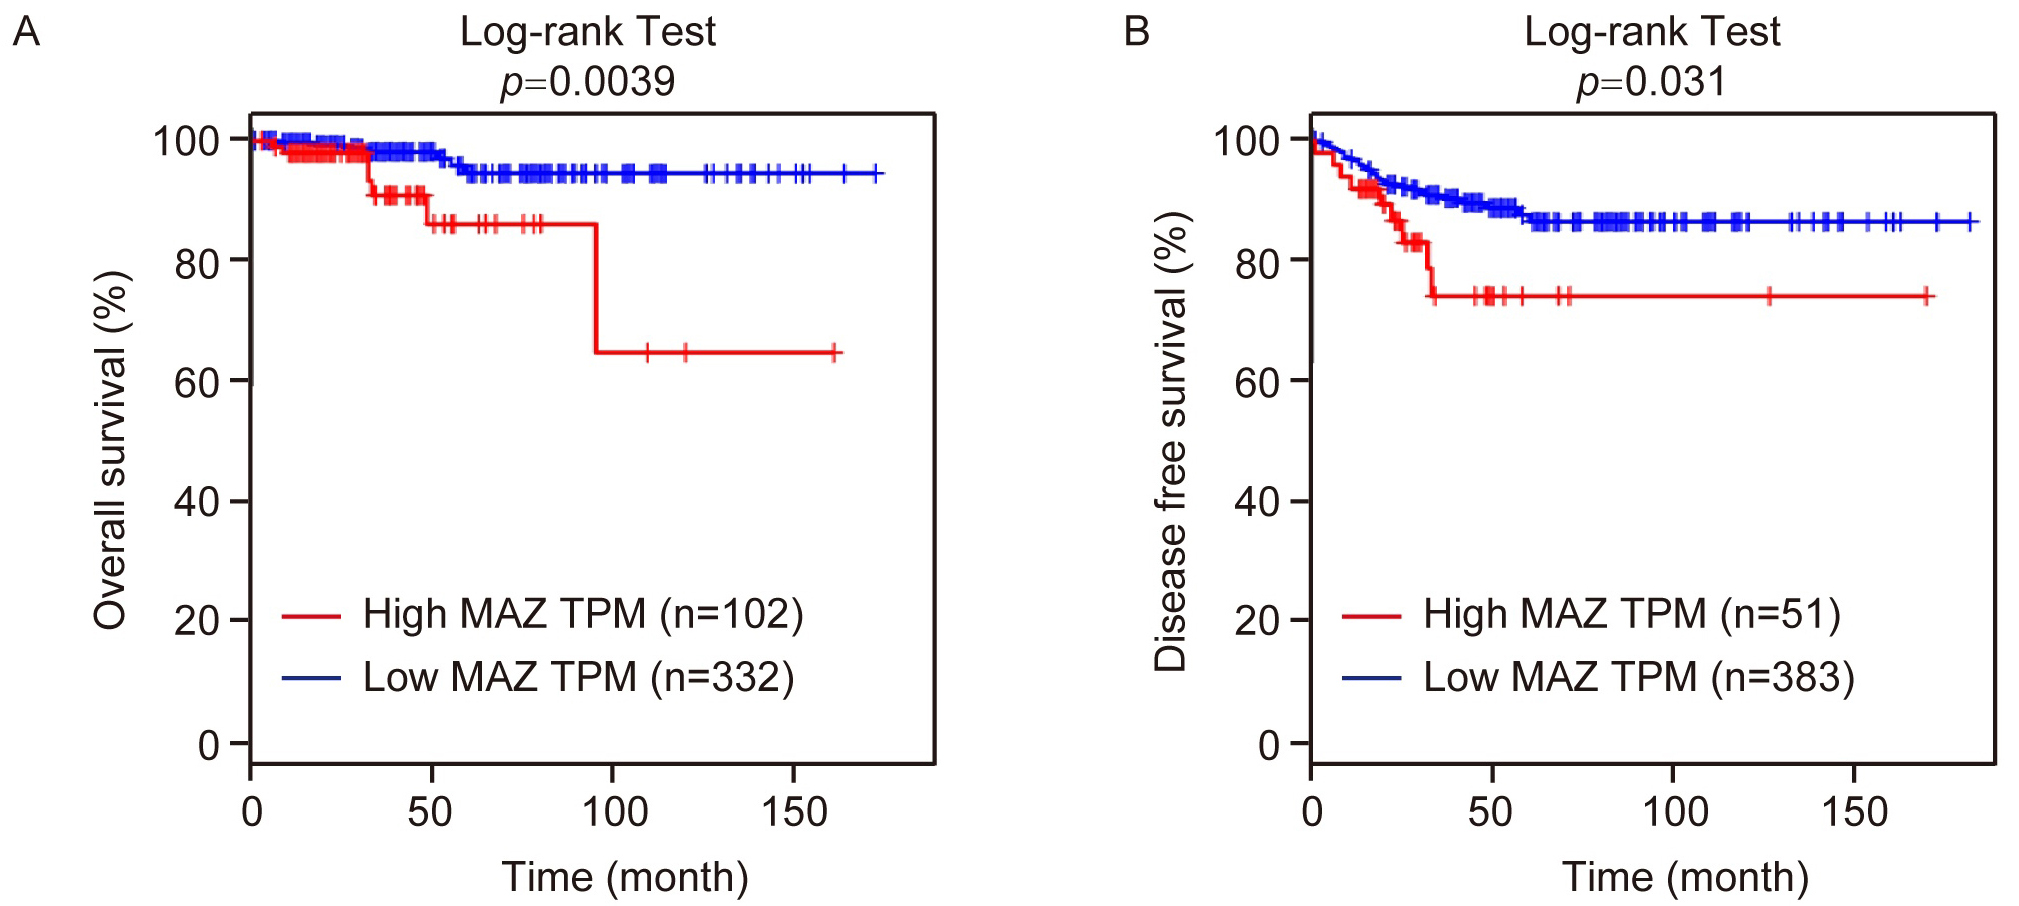 Fig. 2.
Relationship between MAZ expression and thyroid cancer prognosis. (A) Kaplan-Meier plotter analysis of OS and (B) DFS of MAZ was conducted in patients with thyroid cancer. TPM, transcripts per million
To investigate the biological functions of MAZ in thyroid cancer cells, the mRNA
expression levels of MAZ in four thyroid cancer cell lines (SW579, B-CPAP, TPC-1,
and 8505C) were detected by RT-qPCR. It is noteworthy that 8505C cell line was
selected for the following experiment, because it had the highest MAZ mRNA
expression level among the four cell lines (Fig. 3A). Two short hairpin RNAs
(shRNAs) targeting MAZ were purchased from GeneChem Co., Ltd., including KD-1#
and KD-2#, to knockdown the expression level of MAZ in cells. Two shRNAs were
introduced into 8505C cells, and the expression level of MAZ in 8505C cells was
detected after 48 h. Compared with the negative control (NC) group, both the mRNA
and protein expression level of MAZ in the two groups (KD-1# or KD-2#) was
significantly reduced (p
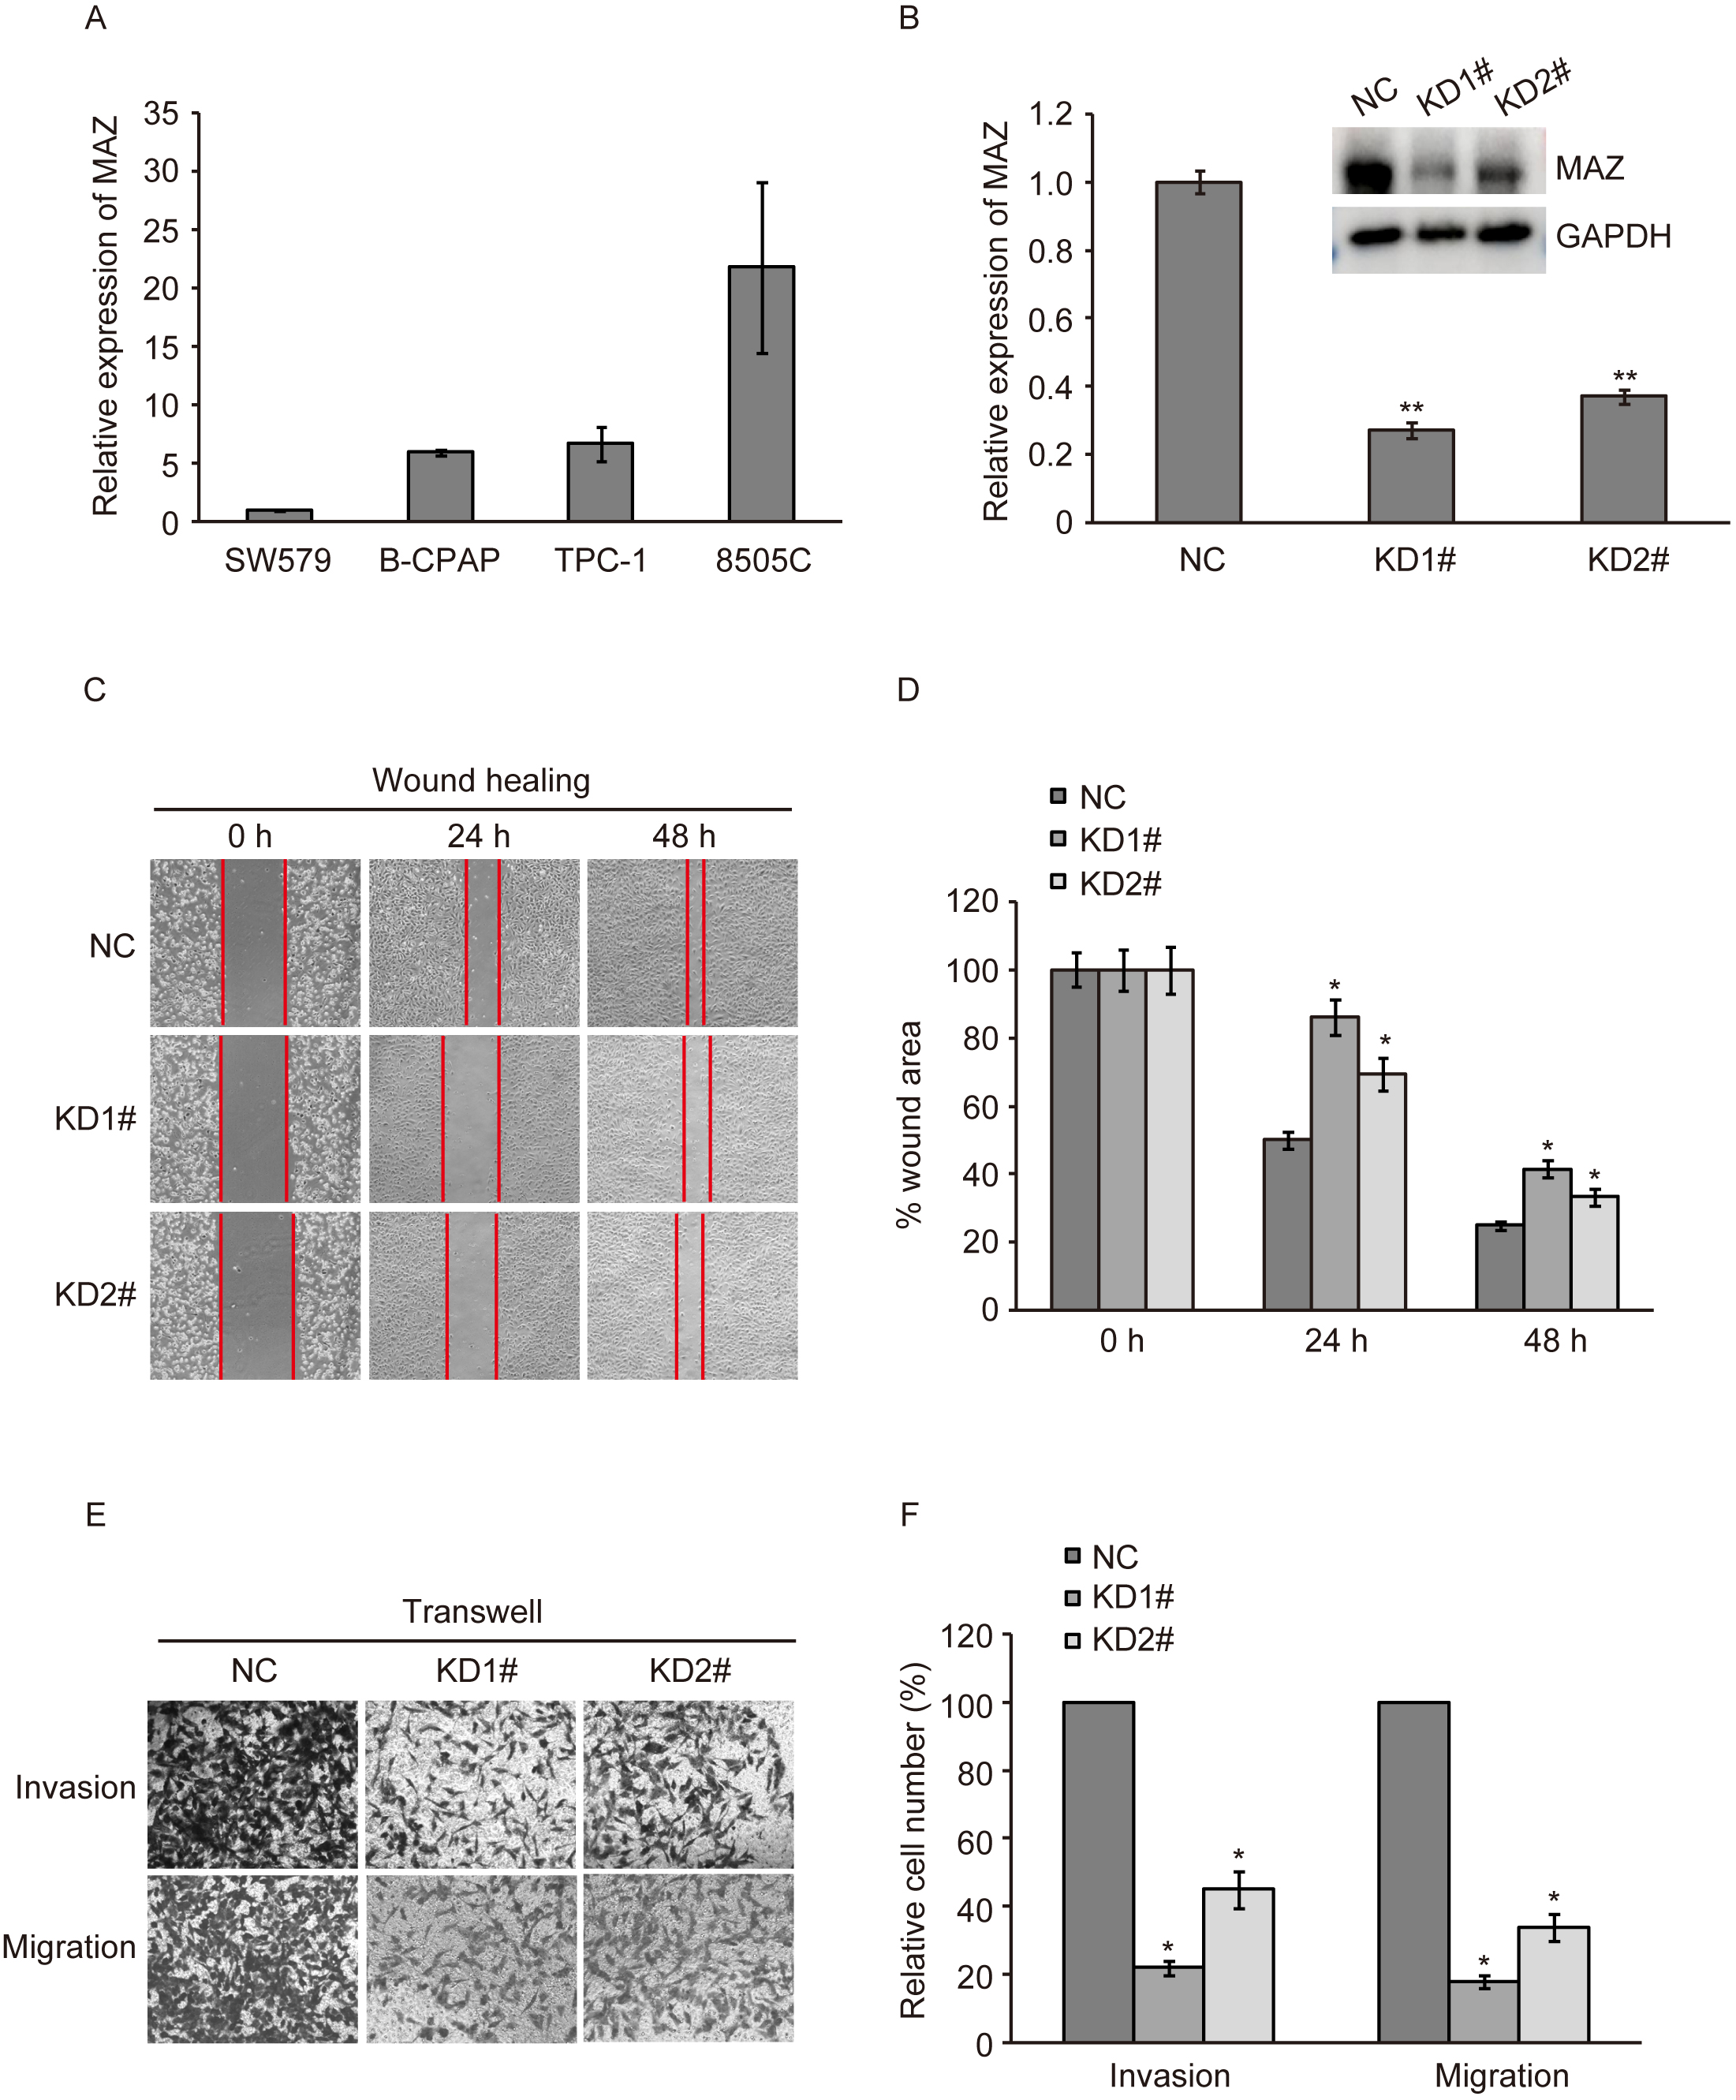 Fig. 3.
Role of MAZ in metastasis of thyroid cancer. (A) RT-qPCR
detection of relative expression of MAZ mRNA in thyroid cancer cell lines. (B)
MAZ mRNA and protein expression after MAZ knockdown in 8505C cells. (C,D) Wound
healing assay. (E,F) Transwell assay. *, p
The migratory ability of 8505C cells with MAZ knockdown was detected by wound
healing assay. Compared with the NC group, the cell migratory ability was
significantly reduced after MAZ knockdown in the KD-1# and KD-2# groups, and
the wound healing speed in the KD-1# group was slower than that in the KD-2#
group (p
RNA sequencing of thyroid cancer cells after MAZ knockdown was performed using the GeneChip Human Gene 1.0 ST array. Then, according to the normalized expression levels, the correlation values between each sample were calculated and the correlation heat map was drawn. As shown in Fig. 4A, downregulation of MAZ changed the expression levels of various genes at the transcriptome level. Compared with the NC cells, there were 25,535 DEGs in MAZ knockdown cells, including 2129 upregulated genes and 2237 downregulated genes (Fig. 4B). To understand the relevant functions of DEGs in thyroid cancer after MAZ downregulation, GO enrichment analysis was conducted based on biological process (BP), cell component (CC), and molecular function (MF). The results indicated that MAZ-related DEGs were mainly enriched on ribonucleoprotein complex biogenesis, ribosome biogenesis, and rRNA metabolism in BP; in CC, they were mainly associated with focal adhesion, cell-substrate junction, and cell-substrate adhesion; in MF, they were mainly correlated with cadherin binding, structural composition of ribosomes, cell adhesion molecule binding, and mRNA binding (Fig. 4C). The results of KEGG pathway analysis showed that MAZ-related DEGs were mainly enriched in cancer pathway, neurotrophic factor signaling pathway, regulation of actin cytoskeleton, apoptosis pathway, protein processing in endoplasmic reticulum, and other pathways (Fig. 4D). The GO and KEGG pathway enrichment analyses further confirmed the involvement of MAZ in thyroid cancer progression.
 Fig. 4.
RNA-seq results of MAZ knockdown thyroid cancer cells. (A) Heatmap of the differentially expressed genes (DEGs). (B) Volcano plot. (C) The Gene Ontology (GO) enrichment analysis. (D) The Kyoto Encyclopedia of Genes and Genomes (KEGG) enrich distribution point diagram. BP, biological process; CC, cell component; MF, molecular function.
EMT-related factors participate in the metastatic progression of a great deal of
malignant tumors. The expression level of EMT-related factor FN-1 was obtained
from RNA-seq data of MAZ knockdown in thyroid cancer cells. The expression level
of FN1 after MAZ downregulation was then examined to determine the EMT process.
As shown in Fig. 5A, RT-qPCR assay showed that the expression level of FN1 was
elevated in MAZ knockdosswn in thyroid cancer cells, and the expression level of
FN1 in KD1# groups was higher than that in KD2# group (p
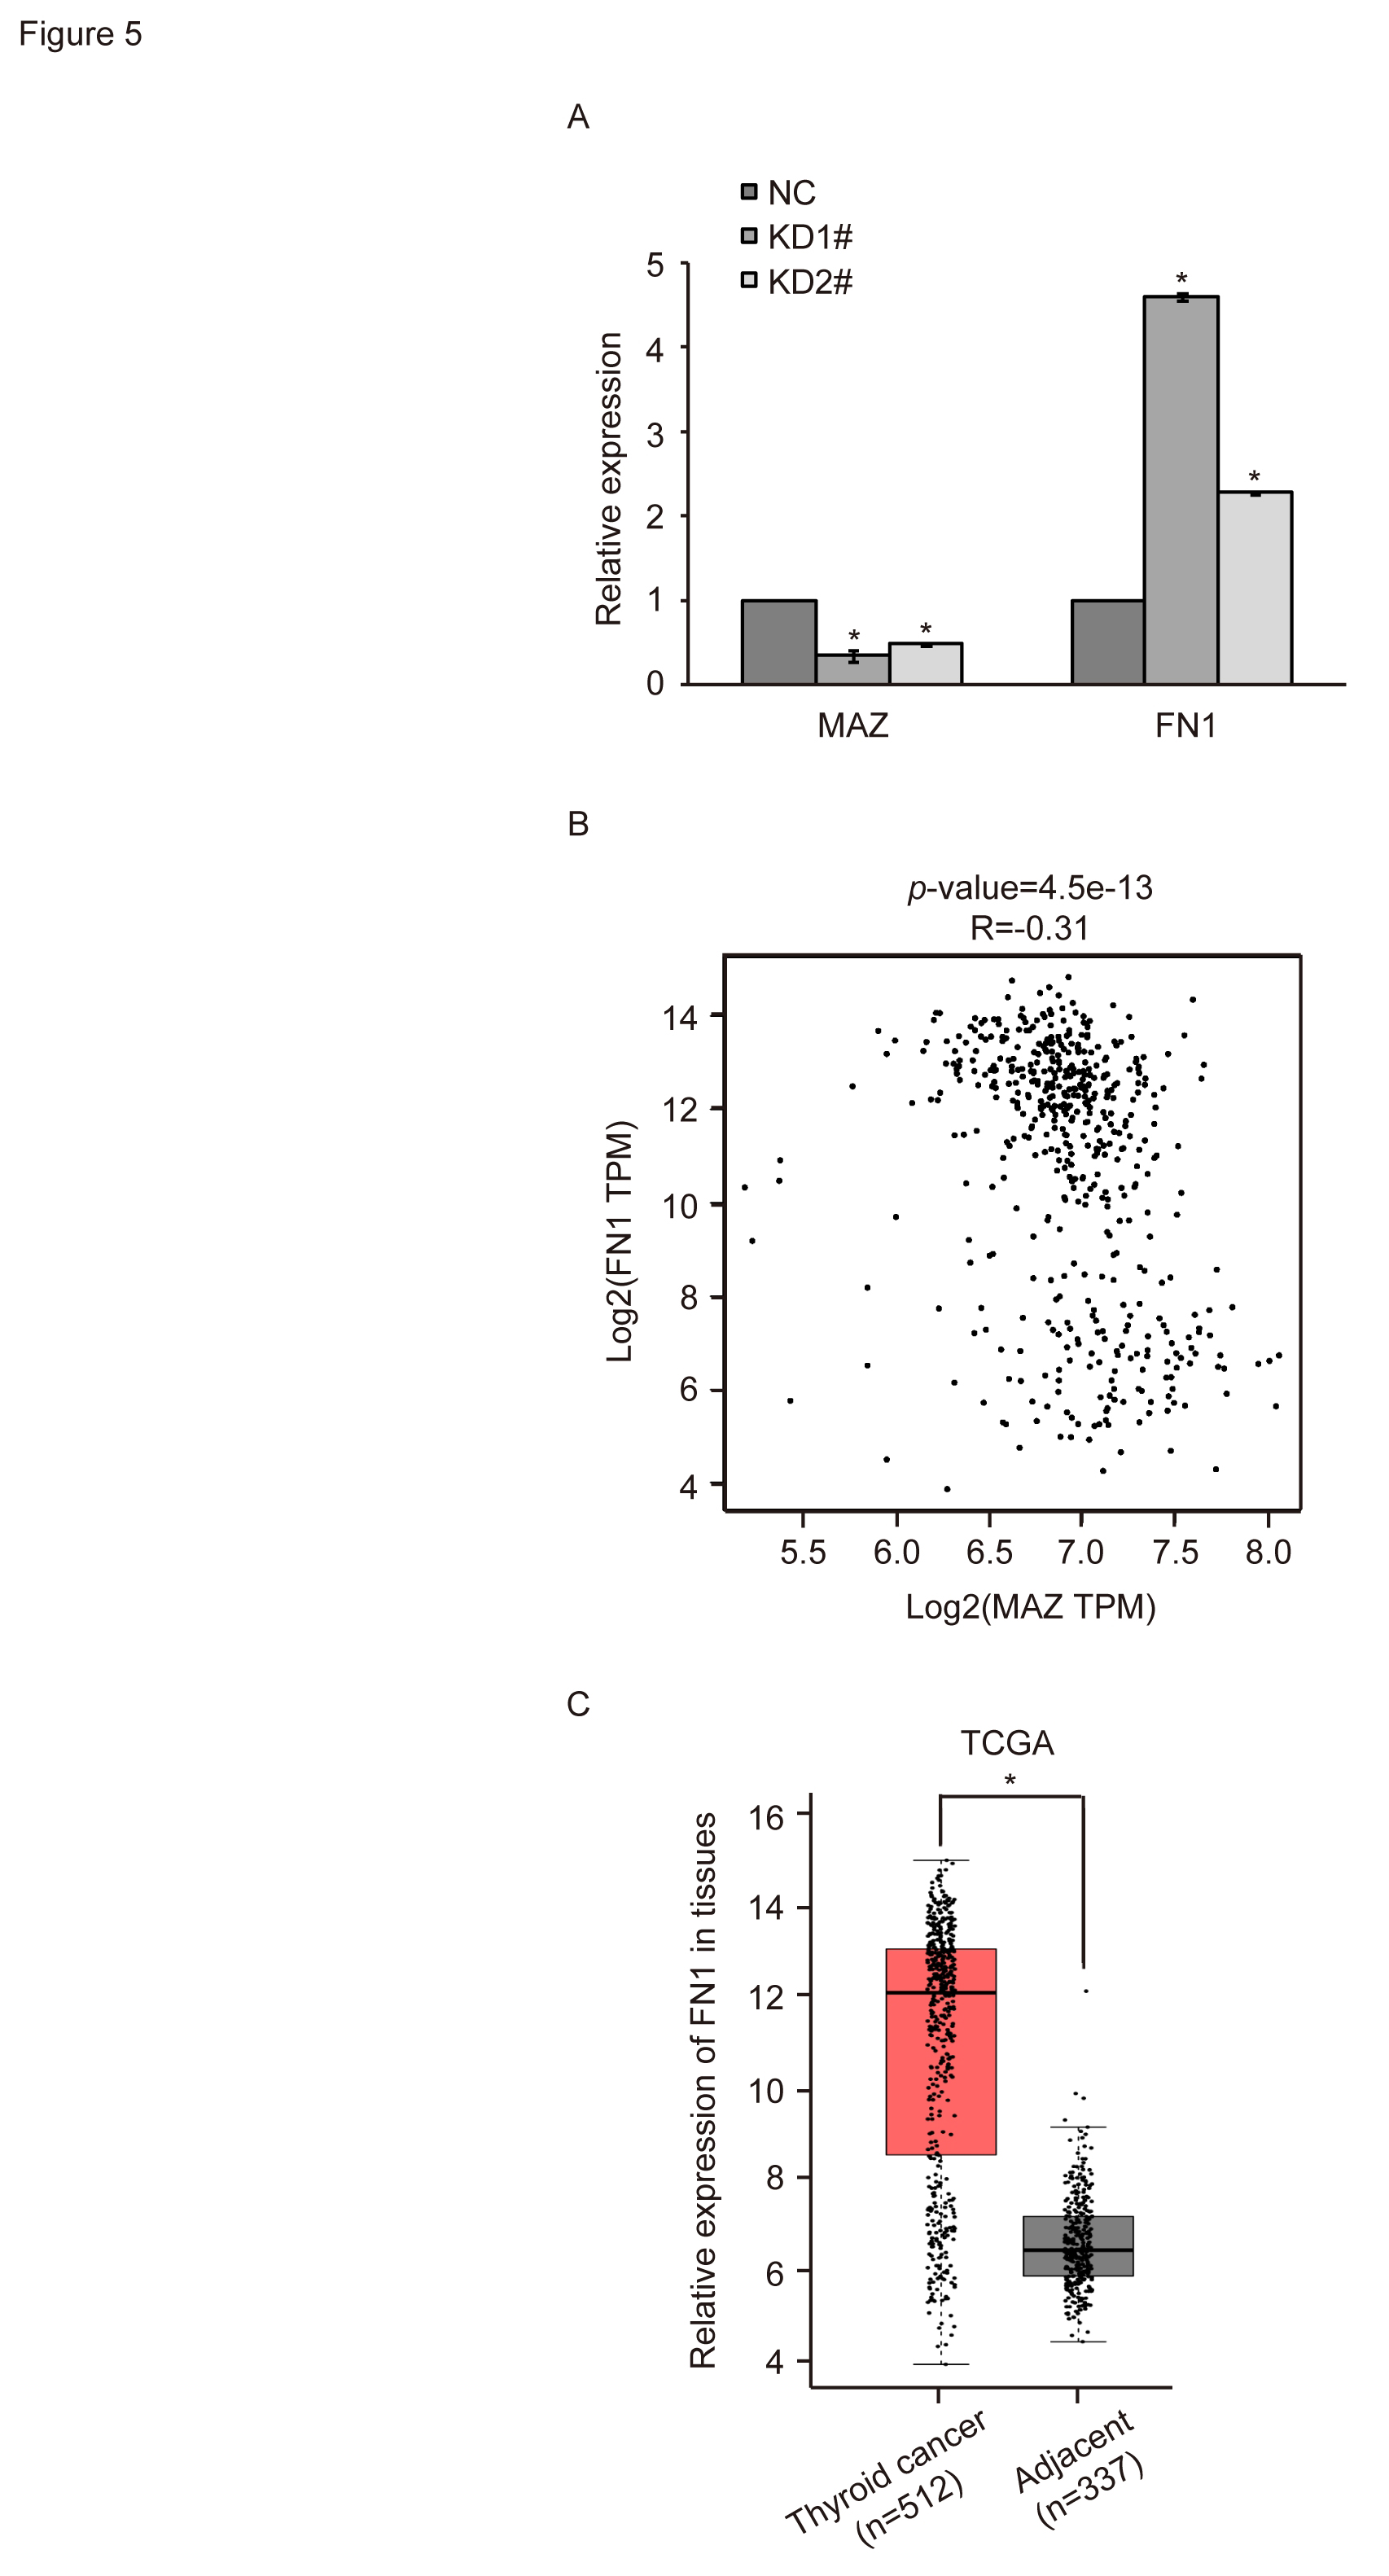 Fig. 5.
Relationship between MAZ expression and FN1 expression in
thyroid cancer. (A) RT-qPCR detection of relative expression of FN1 mRNA after
MAZ down-regulation. (B) Correlation analysis between MAZ and FN1. (C) Expression
of FN1 in thyroid cancer and adjacent tissues in TCGA database. *, p
Thyroid cancer, as an endocrine malignant tumor, accounts for about 1% of human malignant tumors. Thyroid cancer can be treated by a variety of therapeutic approaches, such as surgery, RAI or chemotherapy, while its recurrence rate is still noticeable [25, 26]. Therefore, exploration of potential prognostic markers for thyroid cancer patients is of great significance to improve patients’ quality of life.
MAZ is a Cys-His-2 transcription factor that is widely expressed in different tissues of the human body [27]. It plays a dual regulatory role in transcription. Previous studies demonstrated that MAZ plays an integral role in the pathogenesis of triple-negative breast cancer [28, 29]. A study also found that MAZ increased the activation of extracellular signal-regulated kinase (ERK) signaling pathway, and promoted renal clear cell carcinoma cell proliferation [30]. Maity et al. [31] showed that the acquisition of the invasive phenotype of pancreatic ductal adenocarcinoma may be related to MAZ activation of CRAF-ERK signaling pathway. The interaction between MAZ and miR-29b-3p was found to have an impact on the migration and invasion of gastric cancer cells [32]. Overexpression of miR-149-3p inhibited the lung cancer cell migration and invasion by targeting MAZ [33]. These findings suggest that MAZ has the potential in current cancer therapy through regulating cancer cell proliferation and metastasis. However, the clinical significance and biological functions of MAZ in thyroid cancer should be further clarified.
In the present study, it was found that the expression level of MAZ was upregulated in thyroid cancer tissues by bioinformatics analysis and IHC. Combined with the analysis of clinicopathological data, it was revealed that the expression level of MAZ was significantly correlated with tumor diameter and tumor capsule, rather than with other clinicopathological features of papillary thyroid cancer patients. Moreover, thyroid cancer patients with a low MAZ expression level had longer OS and RFS, suggesting a poor prognosis of patients with a high MAZ expression level. To investigate MAZ-related cellular functions, validation experiments were performed. The results of wound healing and Transwell assays showed that downregulation of MAZ reduced the migratory and invasive abilities of thyroid cancer cells. The above-mentioned findings confirmed that in thyroid cancer, MAZ plays a role in promoting tumor growth.
To reveal the pathological function and underlying mechanism of MAZ in thyroid cancer development, RNA-seq of thyroid cancer cells after MAZ knockdown was performed. It was found that downregulation of MAZ changed the expression levels of various genes at the transcriptome level. There were 25,535 DEGs in MAZ knockdown cells, including 2129 upregulated DEGs and 2237 downregulated DEGs. The GO and KFGG pathway enrichment analyses of DEGs indicated that these DEGs were involved in the occurrence and development of thyroid cancer, such as focal adhesion, cell-substrate junction, cancer pathway, etc. Focal adhesion controls cell morphology, adhesion, and migration by linking the extracellular matrix with intercellular F-actin. Its ability to metastasize and invade is a key determinant of tumor resistance to treatment [34, 35].
The expression level of EMT-related factor FN-1 was obtained from the RNA-seq of MAZ knockdown in thyroid cancer cells. FN1 is an extracellular matrix protein with multiple alternative splicing variants [36]. It regulates the interaction between cells and the extracellular matrix, and it is irreplaceable during cell growth, adhesion, differentiation, and migration [37, 38]. Numerous studies have shown that FN1 is involved in oral squamous cell carcinoma [39], ovarian cancer [40], nasopharyngeal cancer [41], esophageal cancer [42], serous ovarian cancer [43], gastric cancer [44], and cervical cancer [45]. Different expression levels of FN1 exhibited different effects on tumor proliferation, migration, and invasion [46, 47]. In the present study, bioinformatics analysis revealed that FN1 was highly expressed in thyroid cancer tissues. Moreover, the expression level of MAZ was negatively correlated with the expression level of FN1 in thyroid cancer tissues. Combined with the results of RT-qPCR assay after knockdown of MAZ, it was found that the expression level of MAZ could affect the expression level of FN1, and the two proteins were negatively correlated together. Collectively, downregulation of MAZ may inhibit the malignant progression of thyroid cancer by inducing the EMT process. However, the specific mechanism remains to be further explored.
In conclusion, the upregulated expression level of MAZ in thyroid cancer tissues was found to be associated with the poor prognosis of patients, and downregulated expression level of MAZ could inhibit the migratory and invasive abilities of thyroid cancer cells by regulating the EMT process, suggesting that MAZ could play a role in promoting the development of thyroid cancer. Therefore, MAZ is expected to become a new early diagnostic marker and therapeutic target for thyroid cancer.
The datasets used and analyzed during the current study are available from the corresponding authors on reasonable request.
CZ, HW, XZ and ST designed the research study. CZ and HW performed the research. SZ, RT, HL, HZ, XG and DL analyzed the data. CZ, HW, XZ and ST wrote the manuscript. All authors contributed to editorial changes in the manuscript. All authors read and approved the final manuscript.
This study was approved by the Ethics Committee of Guilin Medical University (GLMC2020057), and the written informed consent of each patient participating in the study was obtained.
Not applicable.
This study was supported by the National Natural Science Foundation of China (81860586, 82060607, and 82060621), Natural Science Foundation of Guangxi Province (2020GXNSFDA297010) and the Graduate Student Joint Training Base Program of School of Public Health, Guilin Medical University (GWXY202006).
The authors declare no conflict of interest.
Publisher’s Note: IMR Press stays neutral with regard to jurisdictional claims in published maps and institutional affiliations.