
- Academic Editors
†These authors contributed equally.
Background: High-grade serous ovarian cancer (HGSOC) treatment is
facing clinical challenges. The tumor immune microenvironment (TME) has recently
been shown to perform a critical function in the prediction of clinical outcomes
as well as the effectiveness of treatment. Leukocyte migration is enhanced in
malignant tumors and promotes immunity. However, its role in how to underlie the
migration of immune cells into the TME remains to be further explained in HGSOC.
Methods: We built a prognostic multigene signature with
leukocyte migration-related differentially expressed genes (LMDGs), which is
associated with TME by single-sample gene set enrichment analysis (ssGSEA), in
the The Cancer Genome Atlas (TCGA) cohort. Furthermore, we systematically
correlated risk signature with immunological characteris-tics in TME, mutational
profiles of HGSOC, and potential value in predicting efficacy of platinum-based
chemotherapy and immunotherapy. Screening of the most important prognostic factor
among risk signatures by Friends analysis, and immunofluorescence was employed to
examine both the expression of CD2 as well as its relationship with CD8 and PD-1.
Results: LMDGs-related prognostic model showed good
prediction performance. Patients who had high-risk scores exhibited significantly
reduced progression-free survival (PFS) and overall survival (OS) than those with
low-risk scores, according to the results of the survival analysis (p
Ovarian cancer (OC) has been shown to have the worst prognosis when compared to other gynecologic cancers. High-grade serous ovarian cancer (HGSOC), the most common kind of epithelial ovarian cancer (EOC), is usually diagnosed in an advanced stage [1, 2]. HGSOC accounts for more than 80% of advanced-stage ovarian cancers and over 70% of all ovarian cancer deaths [3, 4]. At present, the 5-year survival rate for HGSOC is roughly 47%, with the majority of these deaths occurring as a result of recurrence and chemoresistance [5]. In most cases, the surgery is accompanied by platinum-based chemotherapy as part of the standard therapy for HGSC. To overcome chemoresistance, a strong emphasis has been placed on targeted treatments, including anti-angiogenic and poly (ADP-ribose) polymerase (PARP) inhibitors, which have shown promising results when used for maintenance or recurrent disease treatment [6, 7, 8, 9, 10]. Nevertheless, long-term outcomes still pose significant challenges, with the prognosis for advanced stage patients remaining poor.
Numerous clinical studies for HGSOC are now focusing on immunotherapy. However,
emerging clinical data have shown limited clinical efficacy of immunotherapy in
ovarian cancer, with an objective response rate of 10–15%, which may be related
to the highly immunosuppressive tumor microenvironment [11]. Zhang et
al. [10] found that tumor-infiltrating T cells were significantly associated
with median progression-free time (22.4 months vs 5.8 months, p
Therefore, our study aimed to systematically assess the association of leukocyte migration with HGSOC prognosis and TME. Then, using the single-sample gene set enrichment analysis (ssGSEA) approach in the TCGA cohort, we built a predictive multigene signature containing leukocyte migration-related differentially expressed genes (LMDGs) and verified it in the GEO cohort. Subsequently, we applied functional enrichment analysis to elucidate the fundamental processes of immune response mediation. Further analysis demonstrated that CD2 could be considered as a new biomarker in HGSOC.
The data were acquired from the TCGA database (https://portal.gdc.cancer.gov/) and comprised normalized whole-genome mRNA expression data of 379 HGSOC samples, somatic mutation data, and corresponding clinical data. After removing 1 patient without complete survival information, 378 HGSOC patients with simultaneously accessible OS and mRNA expression profile data were included in the study. GSE149940 and GSE32062 were extracted from GPL4133 and GPL6480 using the GEO database (http://www.ncbi.nlm.nih.gov/geo). The validation cohort (GSE32062) were external cohorts. The platform annotation files downloaded from the database were adopted to convert the probe data in the matrix files into gene symbols. To eliminate the batch effect, the “sva” R package (https://bioconductor.org/packages/release/bioc/html/sva.html) was utilized [15]. These data were obtained from publicly available web sources and we conducted this research in accordance with applicable protocols regarding the use of databases.
The human ovarian carcinoma SKOV3 cell lines and normal ovarian cell line IOSE80
were obtained from (ATCC, Manassas, VA, USA). IOSE80 cells were cultured in RPMI-1640 medium
(BasalMedia, L210KJ, Shanghai, China) with 10% fetal bovine serum (Gibco, cat.
no. 10270-106, Thermo Fisher Scientific, Waltham, MA, USA), and SKOV3 cells were
cultured in McCoy’s 5a Medium (cat. no. 30-2007, American Type Culture Collection
(ATCC)) with 15% fetal bovine serum. Cells were cultivated at 37 °C in
a humidified atmosphere containing with 5% CO
The immune cells marker gene sets were acquired from another publication [16].
Furthermore, for each immune-related cell, the R package “gsva”
(https://bioconductor.org/packages/release/bioc/html/GSVA.html) was utilized to
perform ssGSEA to calculate the enrichment score [17]. The
“ConsensusClusterPlus” algorithm (50 iterations, resample rate of 80%) was
used to cluster the HGSOC samples into three distinct groups (low-, medium-, and
high-immunity) according to immune cell enrichment scores in ssGSEA [18]. To
confirm that the three subgroups had distinct immunological profiles, we
employed the R package “estimate”
(https://bioinformatics.mdanderson.org/estimate/rpackage.html) to determine the
immune, ESTIMATE, and stromal scores of each tumor sample [19]. Differential
expression analysis of DEGs between low- and high-immunity groups was realized
using the “limma” R package
(https://bioconductor.org/packages/release/bioc/html/limma.html) [20]. p
In order to generate a prognostic multigene signature in the
training set, univariate Cox analysis and LASSO regression analysis were
conducted. The “glmnet” R package
(https://cran.r-project.org/web/packages/glmnet/index.html) was used to implement
the abovementioned processes [22]. In order to calculate the risk score, the
following equations were used: risk score =
GSEA was utilized to determine if a previously established gene set exhibited obvious differential expression between the low- and high-risk groups in the enrichment of MSigDB Database (c2.cp.kegg and c5.go.bp. v7.2. symbols.gmt). Then, it was assumed that the phenotypic labels were represented by the low- and high-risk and gene set permutations were undertaken 1000 times for each analysis. Classification of the gene ontology (GO) and Kyoto Encyclopedia of Genes and Genomes (KEGG) pathways that were enriched in differential phenotype was done using the normalized enrichment score (NES) and the false discovery rate (FDR).
The TME in HGSOC exhibits immunological properties such as activation of the anticancer immunity cycle, tumor infiltrating immune cells (TIICs) infiltration, and expression of inhibitory immune checkpoints and immunomodulators. From the study conducted by Charoentong et al. [23], we initially compiled data on 92 immunomodulators, such as receptors, chemokines, and MHC. In the anticancer immune response, there are seven steps inside this cancer immunity cycle [24]. These steps and their influence on the ultimate fate of tumor cells were examined by Xu et al. [25] using ssGSEA, based on the gene expression levels of individual samples. Thereafter, in order to reduce the possibility of computation mistakes, we computed the infiltration levels of TIICs using seven separate algorithms: xCell, Cibersort-ABS, TIMER, quanTIseq, MCP-counter, Cibersort, and EPIC [25, 26, 27, 28, 29, 30]. Using earlier research, we were able to identify the effector genes of TIICs.
Then, type I interferon (IFN) response and its marker genes were obtained from Akul’s study [31]. From Auslander’s investigation [32], we also obtained ten inhibitory immune checkpoints with treatment significance for further evaluation. The other gene sets, which present T cell-inflamed gene expression profile (GEP) or immune cytolytic activity (CYT), were collected from earlier studies [33, 34]. Finally, we obtained the T cell receptor (TCR) and B cell receptor (BCR) Shannon Entropy data from Vésteinn Thorsson et al. [35].
In order to identify single nucleotide variants (SNVs), single nucleotide polymorphisms (SNPs),
and insertion-deletions (INDELs), we utilized the WES somatic
mutations data from both the low-risk (n = 136) and high-risk (n = 135) groups
with the aid of VarScan2.39 program. The Fisher’s exact test was utilized to
assess the differential mutation genes that had a p-value
The Genomics of Drug Sensitivity in Cancer (GDSC) (https://www.cancerrxgene.org/) was used to estimate each patient’s chemotherapeutic response. Ridge regression was employed to evaluate the half-maximal inhibitory concentration (IC50) and the “pRRophetic” R package (https://github.com/paulgeeleher/pRRophetic) was used to conduct 10-fold cross-validation [39].
We used two computational approaches to anticipate the immunotherapy response in HGSOC patients at low- and high-risk groups in order to investigate the association between the immunological signature and immunotherapy effectiveness. To begin with, Tumor Immune Dysfunction and Exclusion (TIDE) (http://tide.dfci.harvard.edu) was utilized to anticipate each sample’s anti-CTLA4 and anti-PD1 immunotherapy response on the basis of the transcriptome patterns [40]. Second, we retrieved patient immunophenoscore (IPS) from The Cancer Immunome Atlas [23].
Real time PCR was performed as previously described [41]. The expression levels of CD2 were measured by normal ovarian cell (IOSE80) and ovarian cancer cell (SKOV3) on ABI 7700 system using the following primers: forward CD2-F: 5′-TCAAGAGAGGGTCTCAAAACCA-3′, reverse CD2-R 5′-CCATTCATTACCTCACAGGTCAG-3′; GAPDH-F: 5′-TGACTTCAACAGCGACACCCA-3′, reverse GAPDH-R 5′-CACCCTGTTGCTGTAGCCAAA-3′. Total RNA from cultured cells was isolated at 80% confluence with TRIzol reagent (T9424, Sigma Aldrich, STL, USA). Total RNA (1 µg) was reverse transcribed into cDNA using a reverse transcription kit (Takara, Japan). Real-time PCR was performed using SYBR Premix Ex Taq (Takara, Otsu, Japan) according to the manufacturer’s instructions. PCR reaction conditions: denaturation at 95 °C for 10 s, annealing at 60 °C for 15 s, and extension at 72 °C for 30 s. This cycle is amplified for 45 times, and the melting curve is analyzed after the cycle. 23 HGSOC samples (OC-1601) were procured from Servicebio Company (Wuhan, China) and utilized to IF with anti-human CD2 (ab4055, Abcam, MA, USA), anti-PD-1 antibody (ab213524, Abcam, MA, USA) and CD8-specific antibody (ab4055, Abcam, MA, USA). We evaluated only the proportion of cells that had a high membrane staining intensity (brown staining) for CD2 and CD8. The corresponding secondary antibodies included CY5-TSA (G1224, Servicebio), which was utilized to detect PD1, FITC-TSA (G1223, Servicebio), which was utilized to detect CD8, and CY3-TSA (G1222, Servicebio), which was utilized to detect CD2. DAPI was used to highlight the nuclei. Lastly, we calculated the percentages of positive cells across the field.
In order to categorize tumor, stromal, and immune cells, we implemented hierarchical clustering based on the ovarian Cancer (OV) single-cell sequencing data (GSE118828) collected from the electronic website of the Tumor Immune Single-cell Hub (TISCH) (http://tisch.comp-genomics.org/) [42, 43]. After that, the expression of CD2 in these cells was determined, and the findings were shown graphically using scatter plot.
R software version 4.0.3 (https://www.r-project.org/) was utilized to conduct all statistical analyses and plot drawings. The unpaired Student’s t-test and the Whitney U-test were utilized to compare variations between two groups with normal distributed and non-normal distributed variables, respectively [44]. Categorical variables were compared utilizing a Chi-square test [45]. With regard to non-parametric data, the Wilcoxon rank-sum test was employed when two groups were involved, whereas the Kruskal-Wallis test was employed when more than two groups were involved. Using Pearson’s chi-square test, correlations between qualitative variables were examined. A p-value less than 0.05 was interpreted as having statistical significance if it was not indicated above.
With the application of the ssGSEA method, 48 infiltrating immune cells were integrated into HGSOC tissues in order to measure their immunological capability (Fig. 1A). Consensus clustering analysis was used to categorize the overall TCGA cohort into three different groups (high-immunity: 217 samples; median-immunity: 120 samples, and low-immunity: 42 samples). For the purpose of validating the immunity of the three immune groups, we included the ESTIMATE, the immune, and the stromal scores in the heatmap (Fig. 1B). We discovered that when compared to the group with low immunity, the group with high immunity exhibited stronger immune components as well as lesser tumor purity.
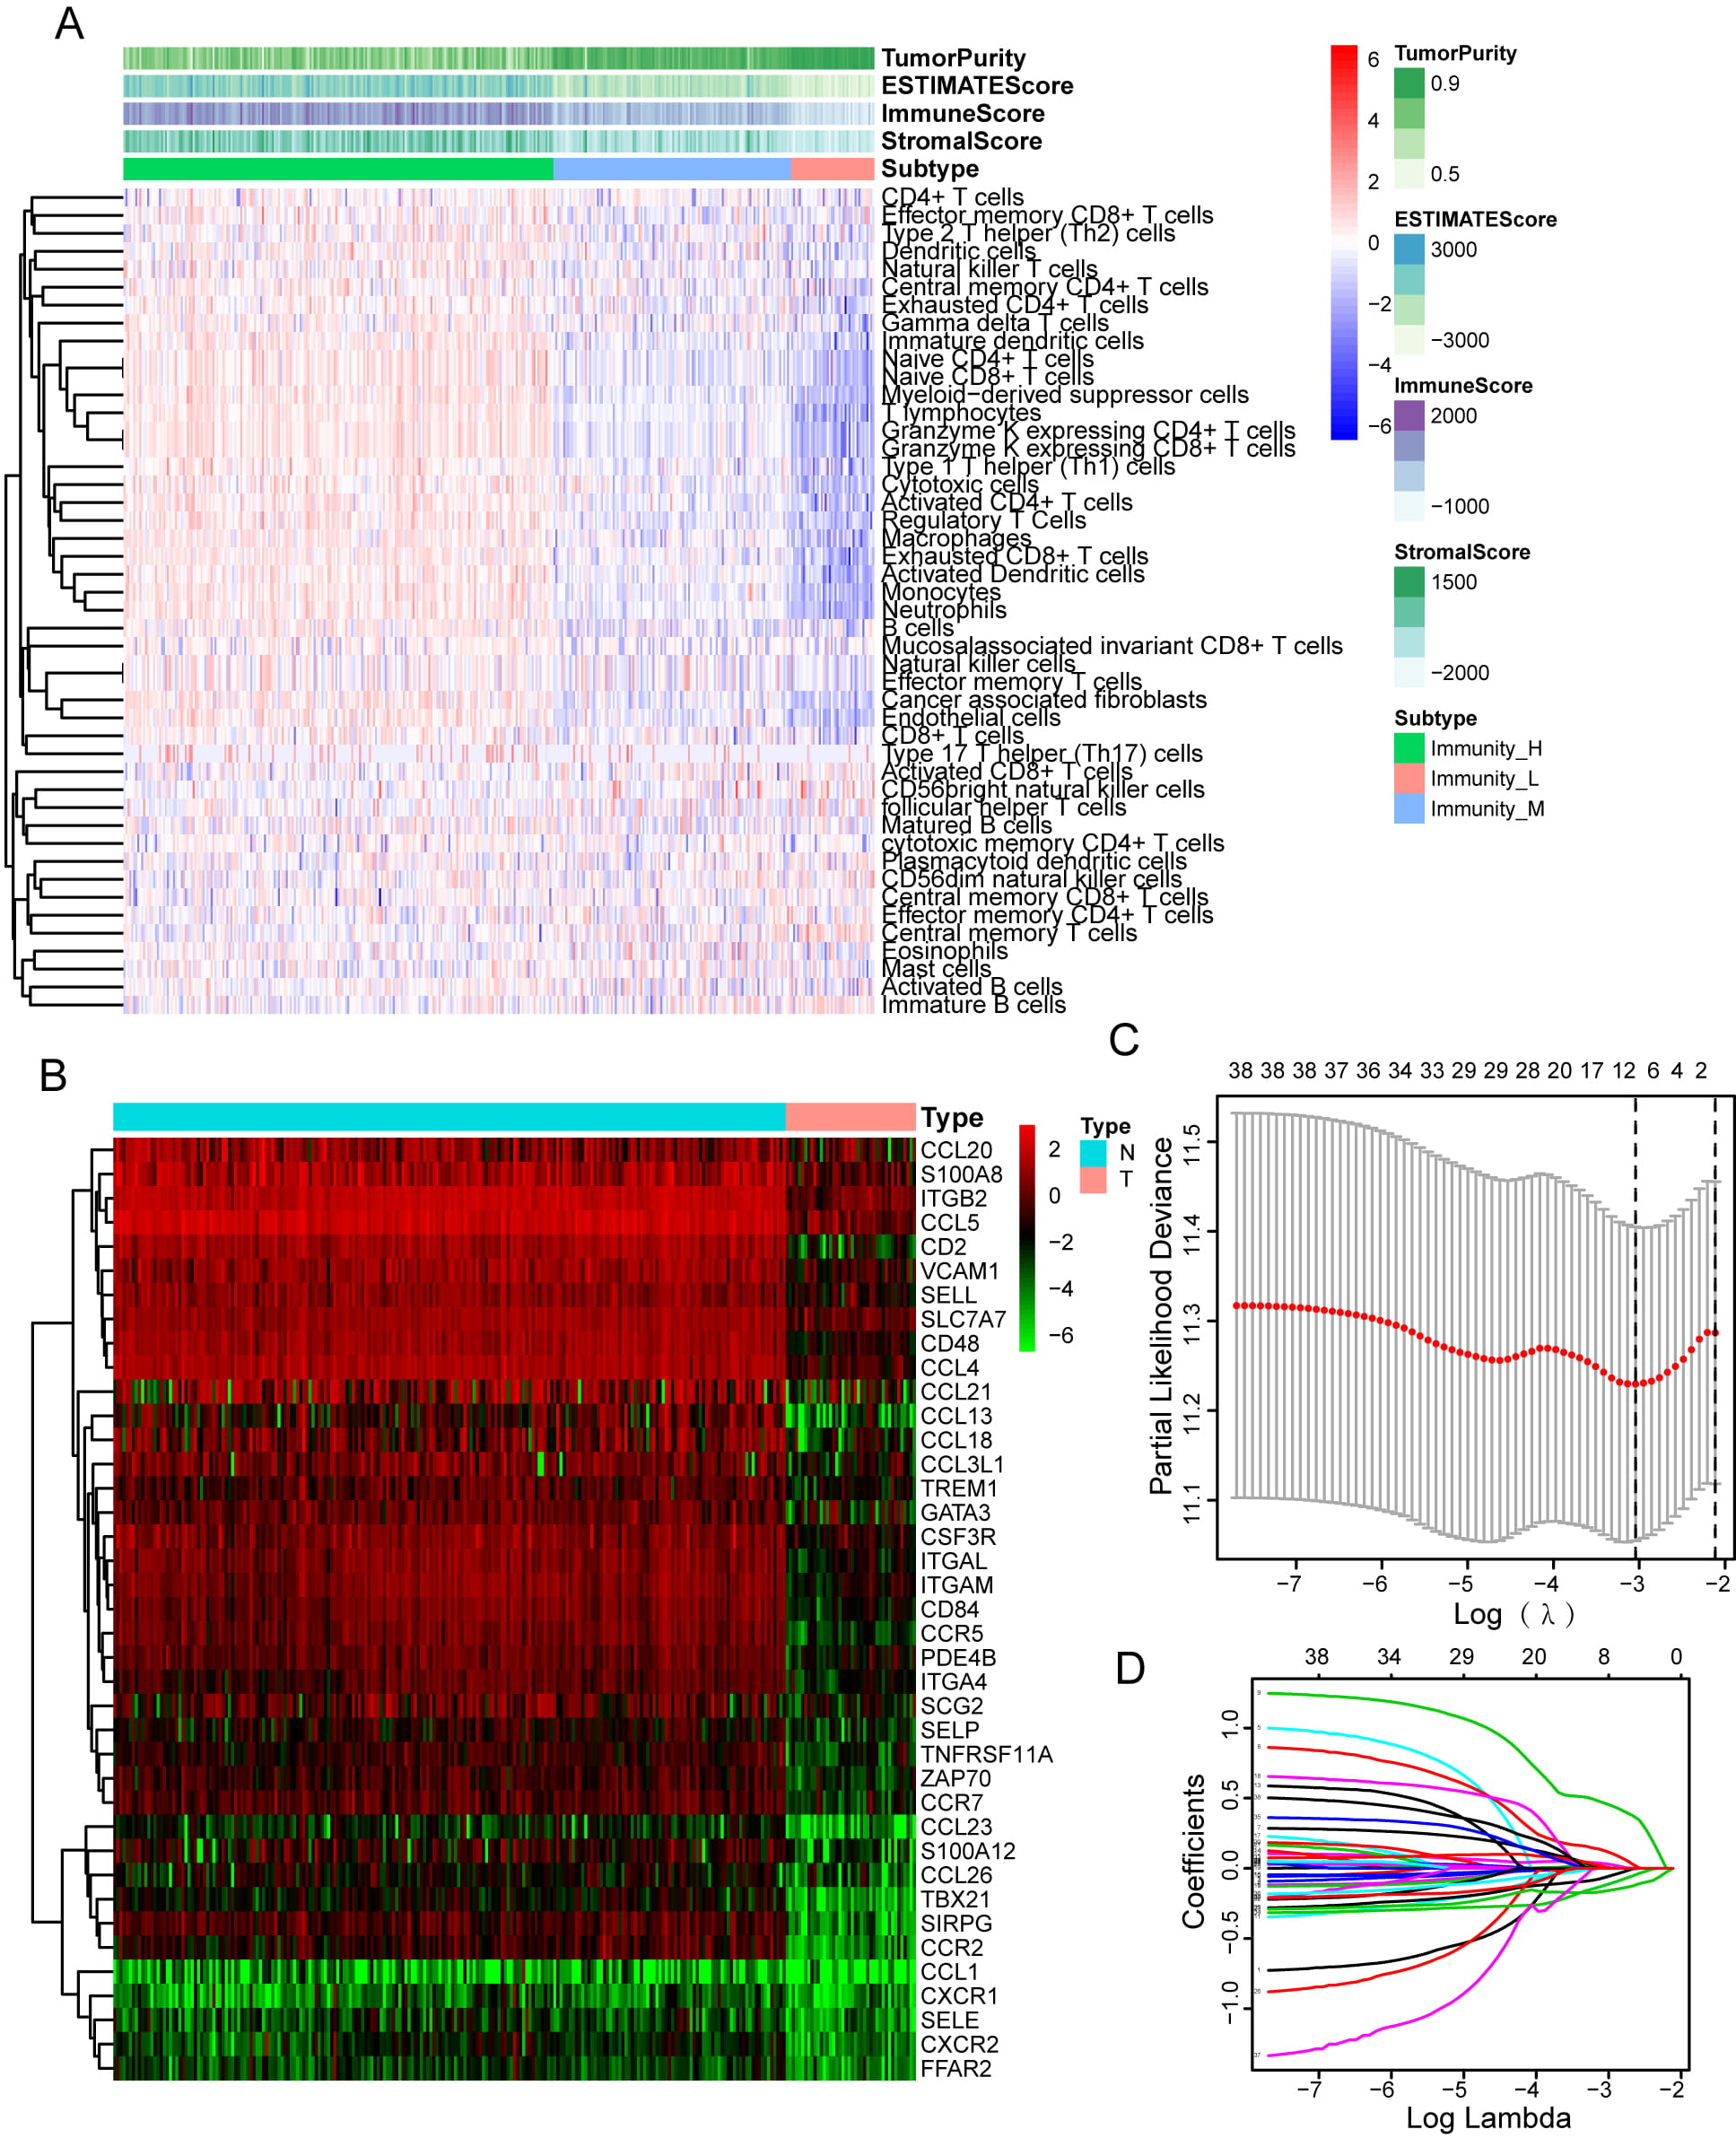 Fig. 1.
Immune microenvironment clustering of HGSOC and Construction of Prognosis Prediction Model. (A) There are 48 immune-related gene sets in ssGSEA that have been enriched in HGSOC cancer The gene sets are comprised of immune processes and immune cells. This heatmap also displays the tumor purity, stromal scores, immune scores, and ESTIMATE scores. (B) Comparison of leukocyte migration-related differential expression genes (DEGs) of low- and high-immune infiltration groups in this heatmap. (C) Nine genes were found to be correlated with the prognosis according to the LASSO Cox analysis. (D) 1000-round cross-validation. was used to determine the best values for the penalty parameter.
To examine the function of leukocyte migration in modulating microenvironment immunity of HGSOC, we performed limma analysis to identify 39 differentially expressed leukocyte migration-related genes in the low- and high-immunity group (Fig. 1B, Supplementary Table 1). Then, Univariate Cox and LASSO regression analyses were carried out in order to detect significant prognostic biomarkers, and the results were used to create a risk signature (Fig. 1C,D). The formula for the risk signature was determined using corresponding coefficients: risk score = 0.6054 × CXCR2 - 0.2539 × CCR7 - 0.2659 × SELL - 0.0251 × CD2 + 0.0127 × TREM1 - 0.8400 × TBX21-0.1818 × CCL13 + 0.3648 × ITGAM + 0.4273 × SIRPG.
HGSOC samples were categorized into low- and high-risk groups according to their
median risk score. The Kaplan-Meier curve revealed that the high-risk group
samples exhibited poorer overall survival (OS) and progression-free survival
(PFS) as opposed to the low-risk group samples, demonstrating that the prognostic
signature of the risk score is efficacious for predicting survival. Notably, the
data from the GEO (GSE32062) database was used to validate this finding (Fig. 2A,B). In addition, by applying receiver operating characteristic curve analysis
on the TCGA data, it was discovered that risk signature was a strong predictor
for 1-year (AUC = 0.646), three-year (AUC = 0.634), and five-year survivals (AUC
= 0.685). The validity of this discovery was greatly increased by incorporating
data gathered from the GEO database (AUC = 0.640, 0.595, 0.628) (Fig. 2C).
Univariate Cox analysis revealed that risk signature (HR = 1.783; 95% CI =
1.440–2.207; p
 Fig. 2.
The prognostic value of risk signature. (A) In the GEO and TCGA datasets, low-risk group patients had a favorable OS rate as opposed to those in the high-risk group. (B) In the TCGA and GEO datasets, low-risk group patients had a longer PFS as opposed to the high-risk group patients. (C) The ROC curve for 1-, 3-, and 5-year OS of HGSOC patients in the GEO and TCGA datasets.
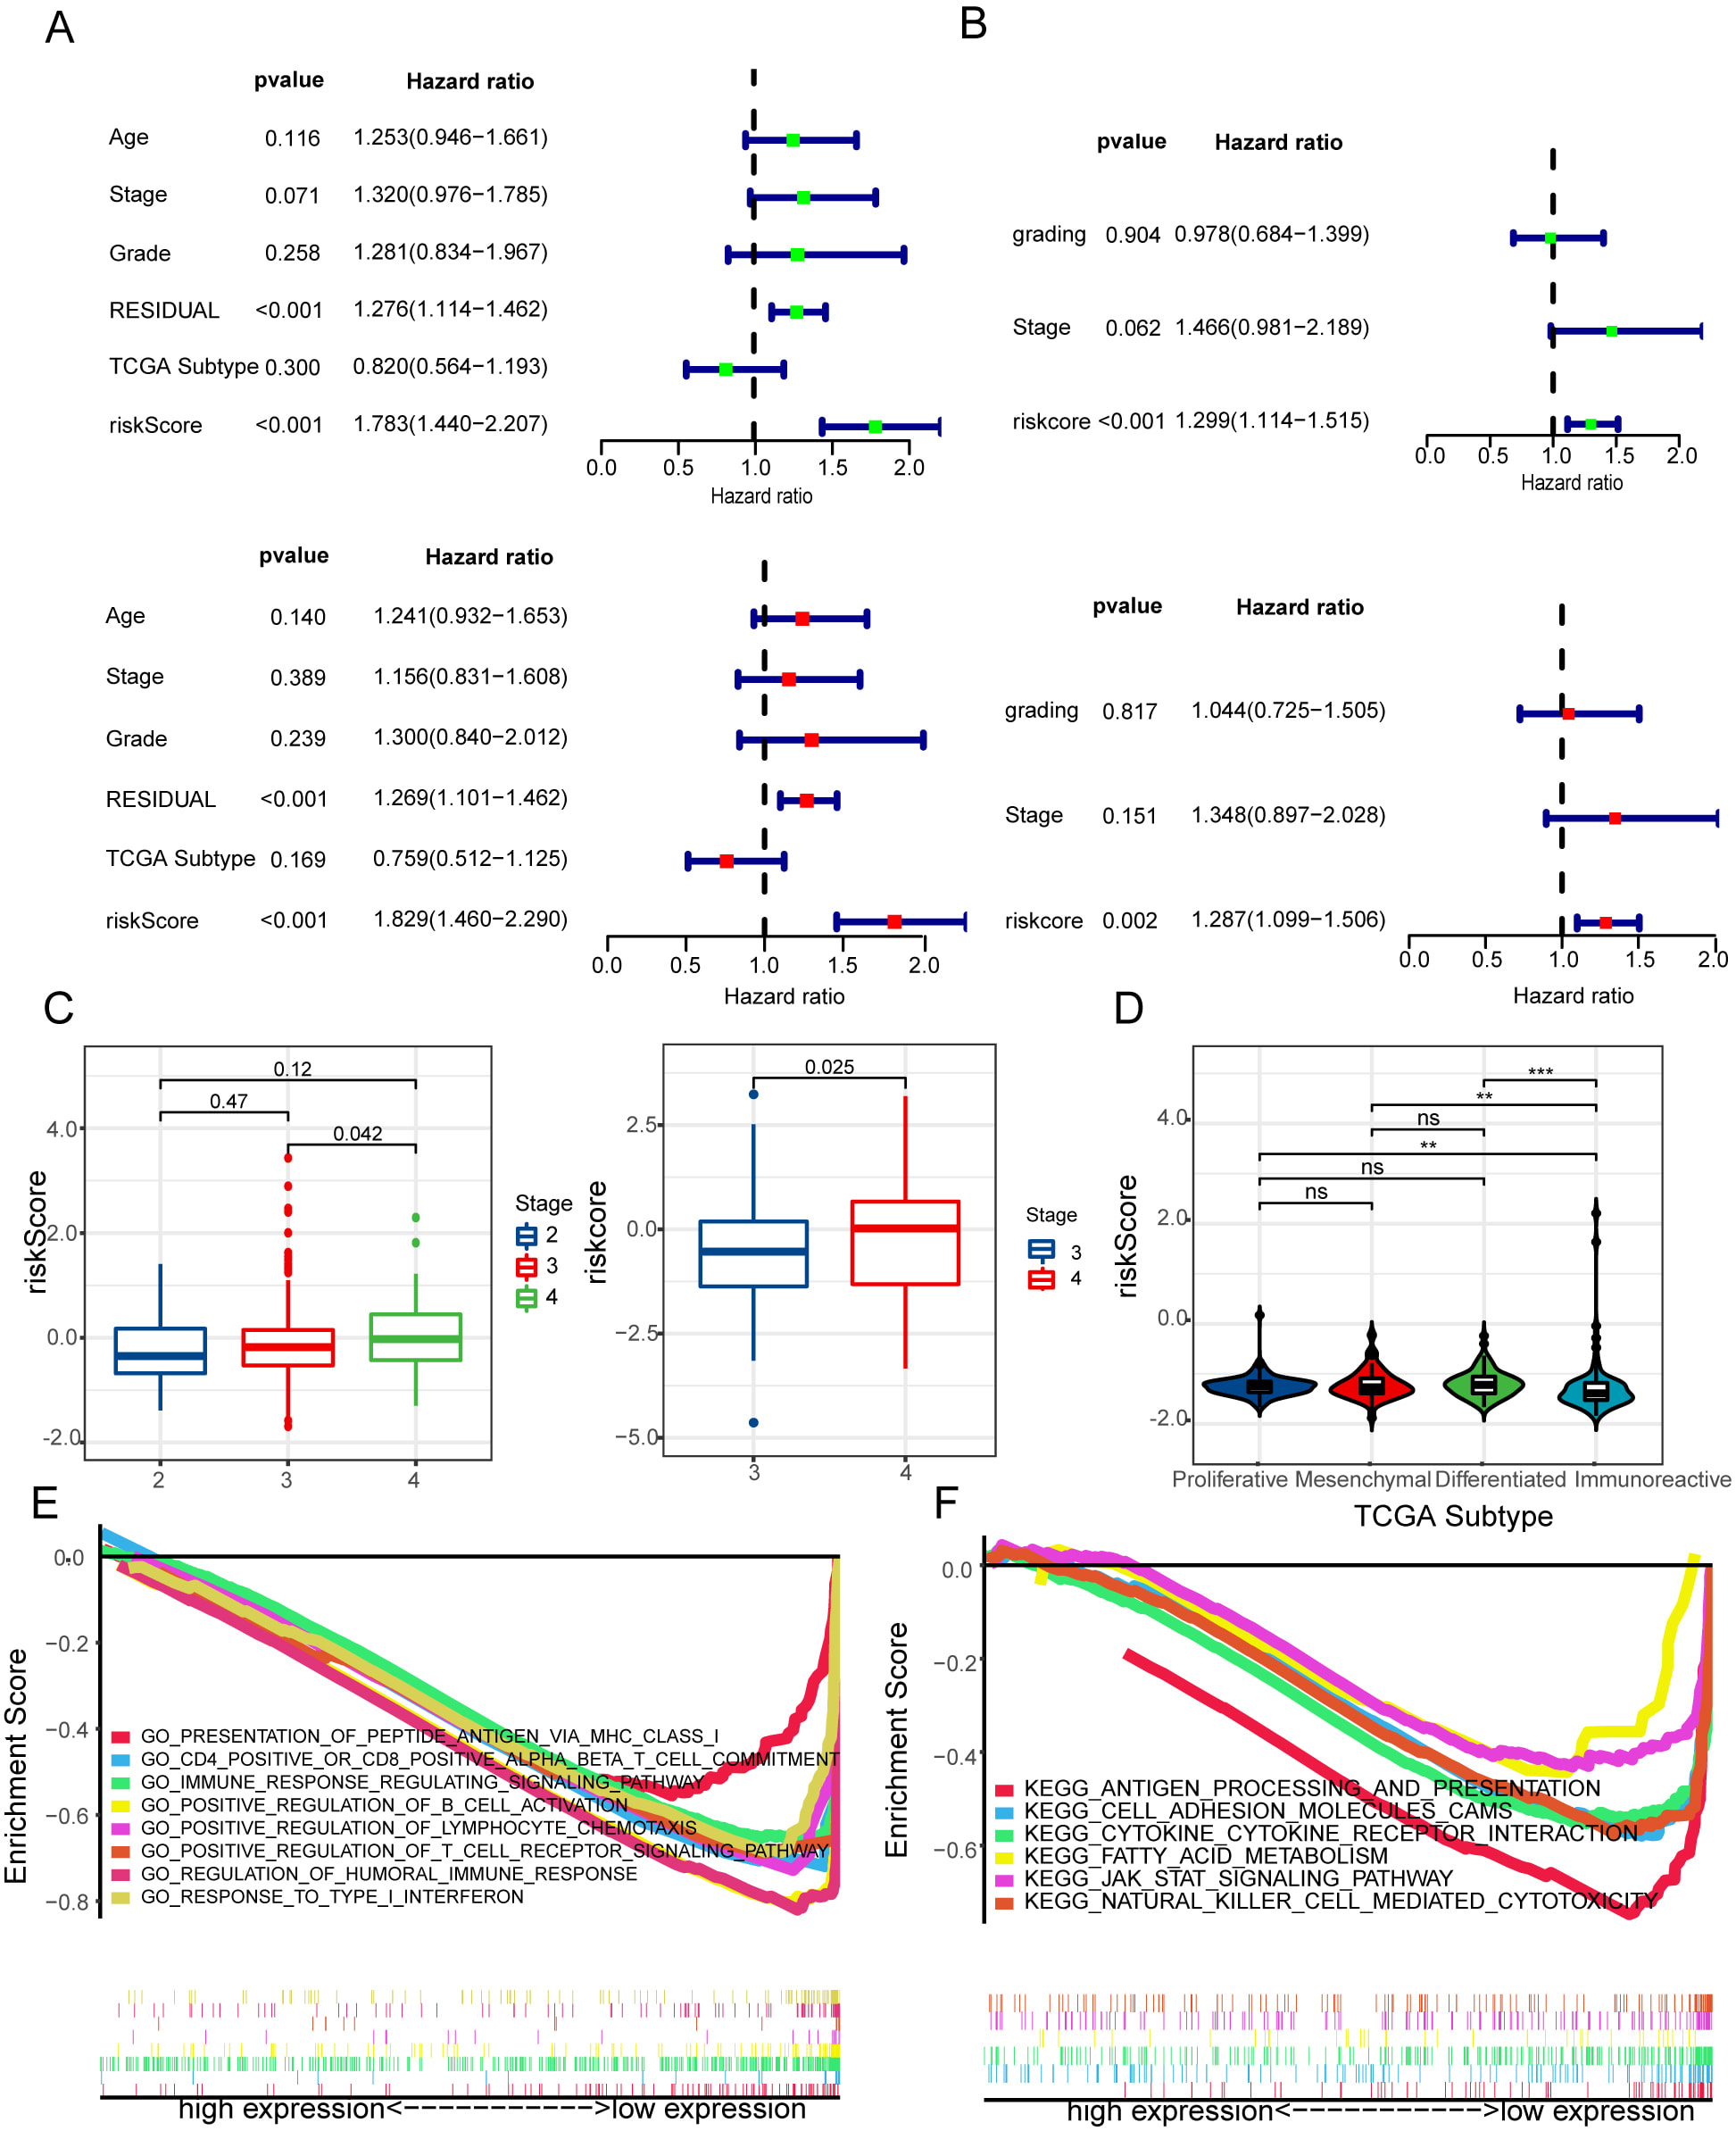 Fig. 3.
Evaluation of the independent prognostic significance and GSEA
enrichment analysis of risk signature. (A,B) Cox analyses, both univariate and
multivariate, were used to determine the independent prognostic significance of
the risk signature with regard to OS in glioma patients based on the CGGA
and TCGA datasets. (C) Relationships between risk signature and stage in HGSOC.
(D) Relationships between risk signature and TCGA subgroup in HGSOC. (E,F) GO and
KEGG were evaluated utilizing the GSEA. **p
Then, we explored relationships between risk signature and stage in HGSOC. According to the data from the TCGA and GEO databases, HGSOC patients showed significantly higher risk scores with the high stage as opposed to the low stage group patients (Fig. 3C). Interestingly, we discovered that the immunoreactive group had a lower risk score compared to patients in the other TCGA subgroups (Fig. 3D). These findings identify that risk signature is crucial to anti-tumor immunity.
Gene set enrichment analysis was performed on the GO and KEGG databases
utilizing the MSigDB database (FDR
Depending on the proportion of cytotoxic immune cells infiltrating TME, the tumor can be described as either immunologically active ‘inflamed’ or immunologically passive ‘non-inflamed’ [46]. Risk signature was observed to exhibit a negative correlation with a vast proportion of immunomodulators (Fig. 4A). Most of the MHC molecules were downmodulated in the high-risk group, indicating that the ability to present and process antigens had been reduced. Three key chemokines (CXCR3, CXCL10, and CXCL9), which are required to recruit CD8+ T cells into the TME in HGSOC, were shown to be upmodulated in the low-risk group. Further investigation revealed that paired receptors and other chemokines such as CXCL13, CXCL11, CCL5, XCL2, and CCL4, exhibited a negative association with risk signature. These receptors and chemokines stimulate the mobilization of effector TIICs, including antigen-presenting cells and CD8+ T cells.
 Fig. 4.
The low-risk signature shapes an inflamed TME in HGSOC. (A) In
HGSOC, there are differences in the expression of 122 immunomodulators (MHC,
receptors, and chemokines). (B) Difference between low- and high-risk groups at
distinct stages of the cancer immunity cycle. (C) Relationship between the risk
score and infiltration levels of severe TIICs, as determined by seven separate
algorithms. (D) Differences in the effector genes of CD8+ cells between
low- and high-risk groups. (E) Relationship between risk score and CD8+ cell
effector genes. *p
The cancer immunity cycle is a representation of our body’s immunological response to cancer. The functions of the cancer-immunity cycle meticulously represent the ultimate impact of the intricate immunomodulatory interplay in the TME [24, 25]. Most of the cycle steps were shown to be increased in the low-risk group, such as the production of cancer cell antigens (Step 1), priming and activation (Step 3), as well as immune cells transportation to tumors (Step 4) (recruitment of DC, NK cells, Macrophages, Th1 cells, and CD8 T cell) (Fig. 4B). Consequently, the decreased activity of these steps might result in a decrease in the infiltration levels of effector TIICs in the TME. Notably, the low-risk group had a decreased T cell activity in recognizing cancer cells (Step 6). The reason for this phenomenon might lie in the fact that the low-risk group had an elevated level of PD-L1 expression. Step 7 activity (cancerous cell death) was discovered to be upmodulated in the low-risk group.
Following that, we estimated the infiltration levels of TIICs utilizing seven separate algorithms provided by the TIMER website. In our result, risk signature was inversely associated with DC cells, B cells, and CD8+ T cells in the TCGA datasets (Fig. 4C). These results were confirmed in the Geo cohort (Supplementary Fig. 1). Similarly, risk signature was inversely associated with the CD8+ T cells effector genes, which was elevated in the low-risk group (Fig. 4D,E). Moreover, the marker genes of type I IFN response were a high expression in the low-risk group. The risk model was inversely associated with type I IFN response (Fig. 5A,B). Consistently, risk signature was observed to be inversely associated with most of the immune checkpoint inhibitors such as TIGIT, IDO1, TIM-3, LAG-3, PD-1, CTLA-4, and PD-L1 (Fig. 5C,D). Collectively, the low-risk signature shapes an inflamed TME.
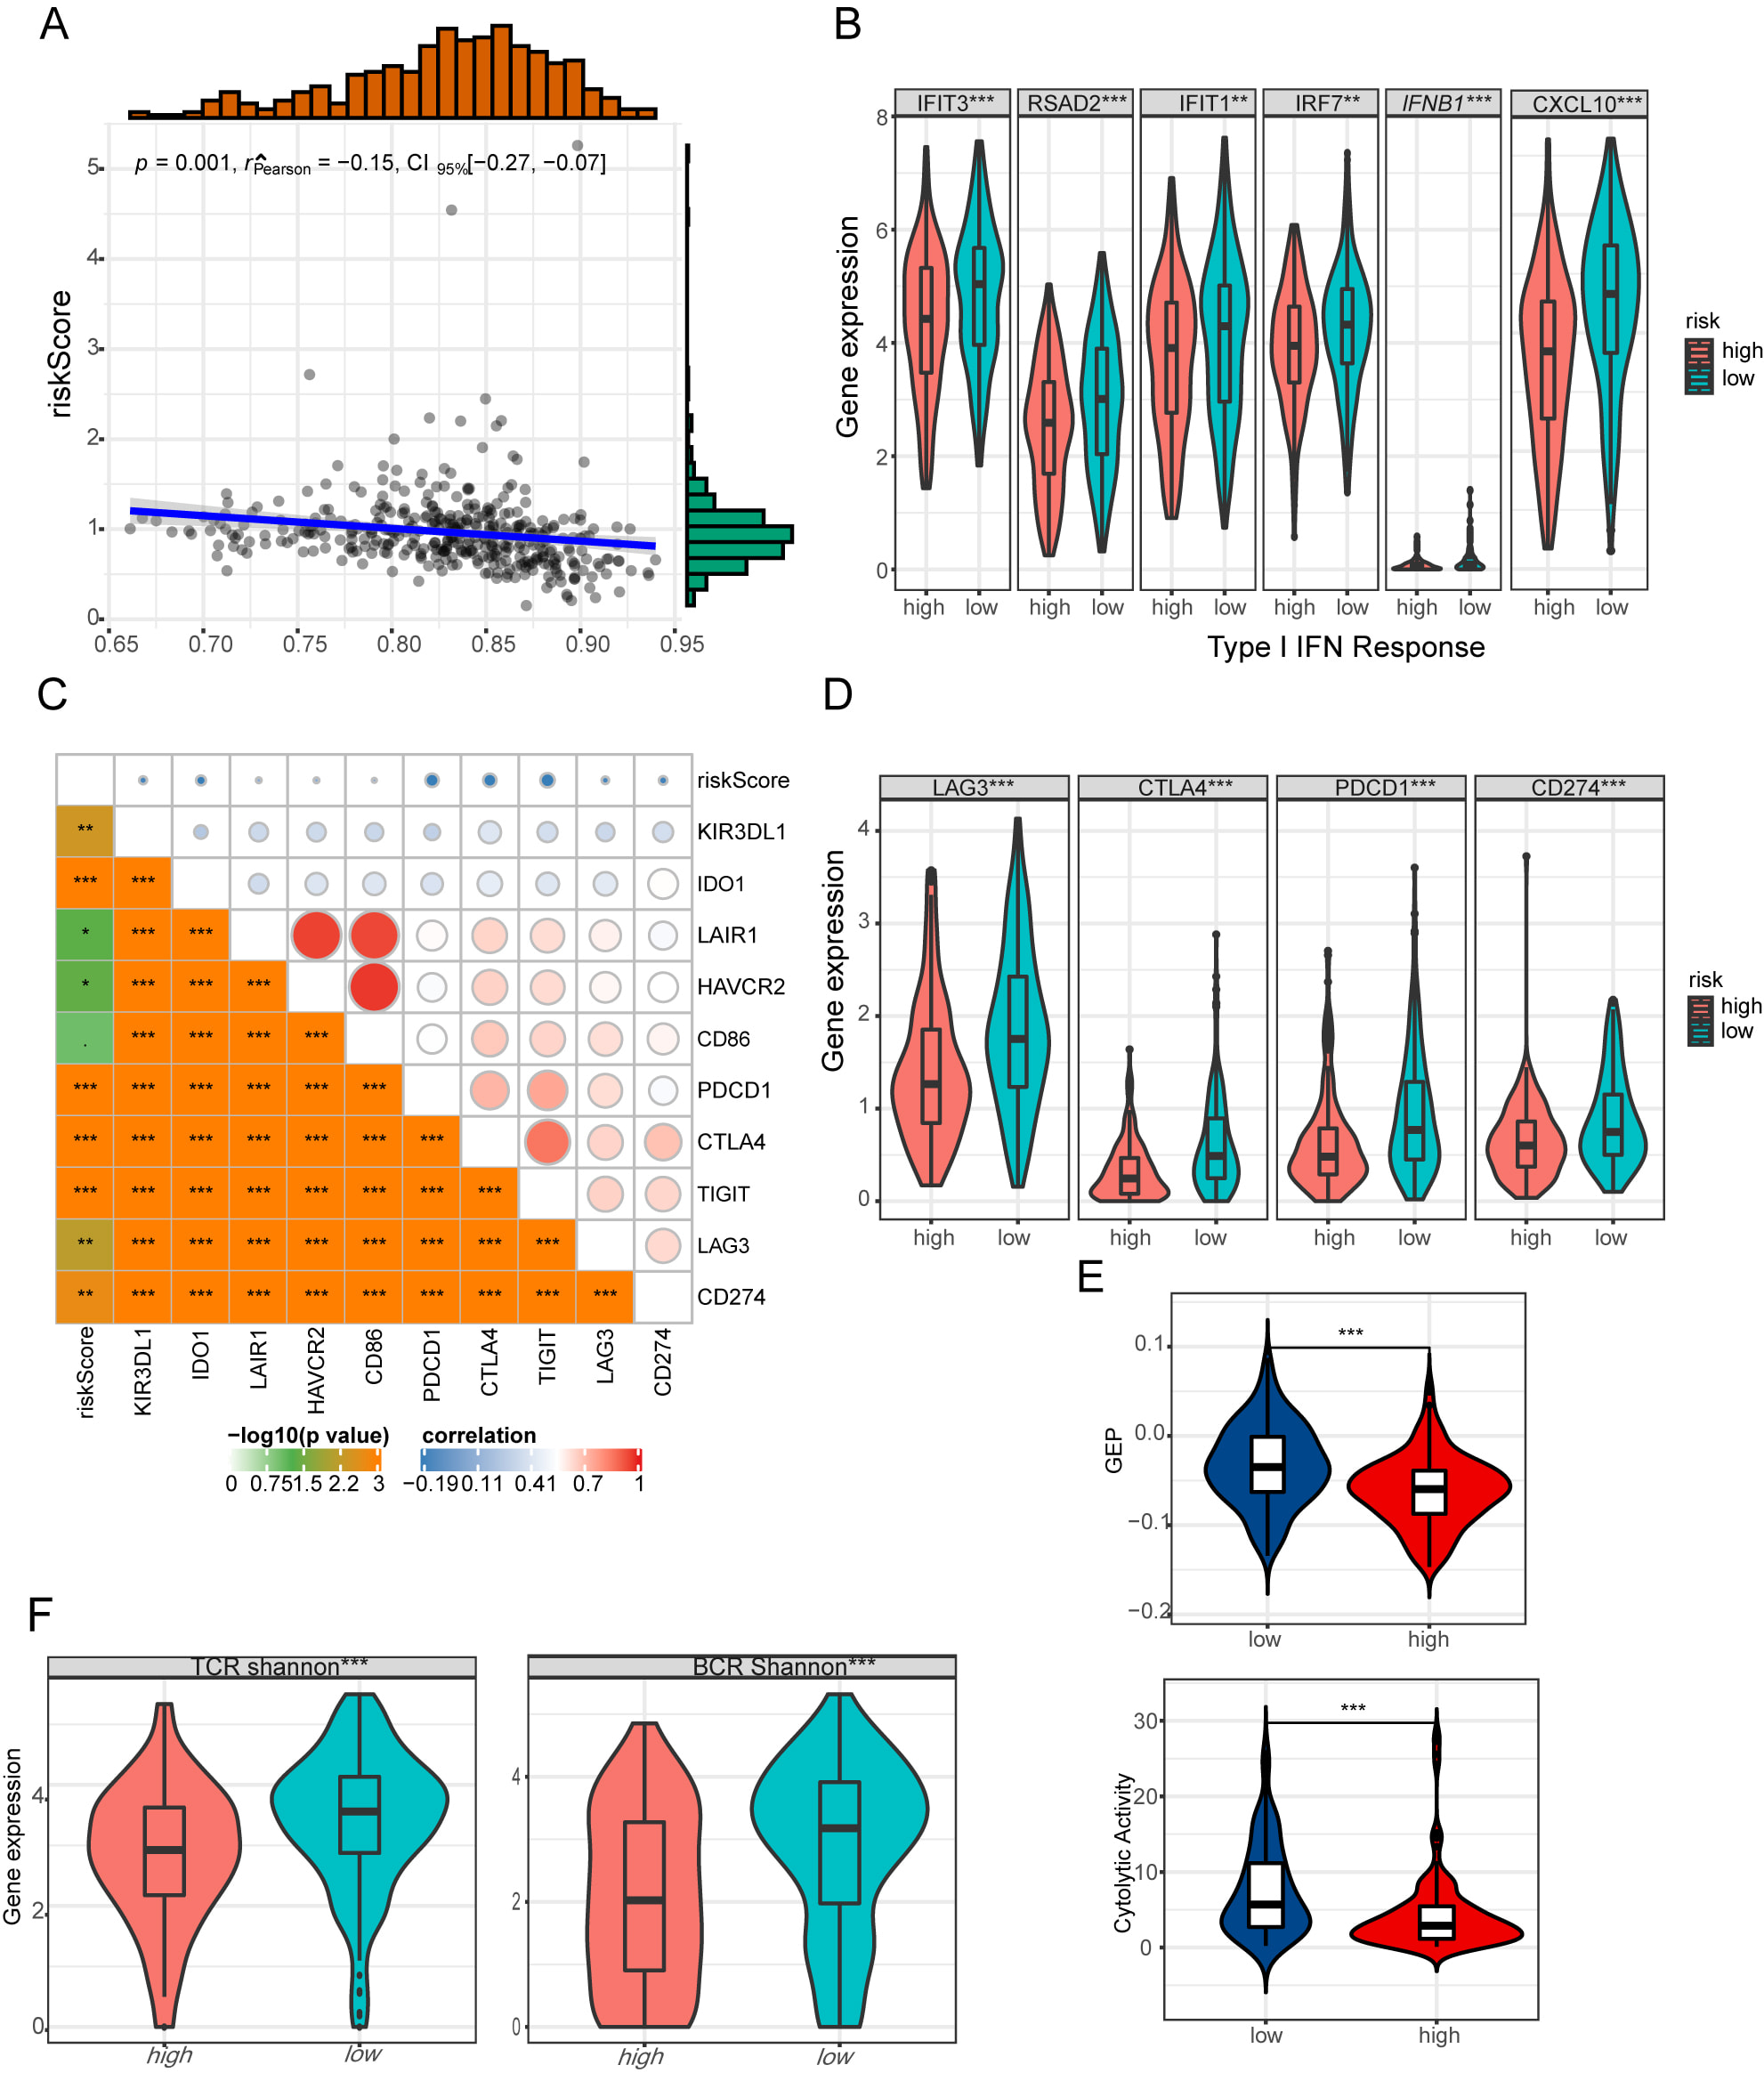 Fig. 5.
The immune profile of risk signature in HGSOC. (A) Relationship
between risk score and type I IFN response. (B) Differences in the effector genes
of type I IFN signature between low- and high-risk groups. (C) Relationship
between risk score and 10 inhibitory immune checkpoints. (D) Differences in PD1,
PDL-1, CTLA4, LAG3 between low- and high-risk groups. (E) Differences in
GEP and CYT between low- and high-risk groups. (F) Differences in TCR
and BCR diversity values between low- and high-risk groups.
**p
Meanwhile, we discovered the risk signature strongly correlated with CYT and GEP in HGSOC, which both decreased in the low-risk group (Fig. 5E). Furtherly, we evaluated TCR and BCR repertoires from the TCGA HGSOC cohort. Mean TCR and BCR diversity values, which were measured by Shannon entropy, differed by the risk signature, with the highest diversity in the low-risk score groups (Fig. 5F). A powerful anti-tumor response may be associated with antigen-specific BCR and TCR repertoires that are essential for the identification of malignant cells and pathogens. Our finding indicated risk signature was strongly associated with the inflamed TME and anti-tumor response.
To find the relevant genetic alterations, we dissected the somatic mutations between the low and high-risk cohorts. The top 30 most commonly mutated genes in the corresponding cohorts are depicted in Fig. 6A. Then we explored the association between risk signature and measures of DNA damage, including aneuploidy score, homologous recombination deficiency (HRD). The low-risk group correlated negatively with aneuploidy score, positively with HRD (Fig. 6B,C). Due to lower leukocyte infiltration in high aneuploidy samples, aneuploidy was negatively associated with immunological signaling gene expression [36]. These results suggest that the risk signature of the affected immune infiltrations may be associated with aneuploidy. It has been hypothesized that the genetic instability exhibited in HRD tumors alters immunogenicity, making these malignancies highly sensitive to immunotherapy. We next calculated the TMB and MATH by the maftools R package. Despite the fact that the TMB was greater in the low-risk group as opposed to that of the high-risk group, this difference was not significant. No differences in MATH were found between the low- and high-risk groups (Fig. 6D). This result demonstrated that risk signature may serve as an immune marker independent of TMB and MATH.
 Fig. 6.
Mapping of mutations found in HGSOC. (A) The top 30
commonly mutated genes between low- and high-METTL7B groups. (B) Differences in
AS, including AS_amp and AS_del between low- and high-risk groups. (C)
Differences in HDR between low- and high-risk groups. (D) Differences in
TMB and MATH between low- and high-risk groups. *p
The commonly used treatment options for ovarian cancer include chemotherapy,
targeted therapy, and immunotherapy. Platinum-based chemotherapy is the
cornerstone of treating HGSOC. To determine the effect of Risk signature on
Platinum-Based Chemoresistance in HGSOC, according to platinum-based response
(whether to platinum resistance) and risk score, we categorized the samples in
TCGA and GEO databases into four groups, including high-risk score groups with or
without platinum resistance and low-risk score groups with or without platinum
resistance. We found that no matter whether the risk score in HGSOC patients was
high or low, patients who were sensitive about platinum had a longer survival
time as opposed to those with platinum resistance. But the low-risk score group
was found to have a survival advantage as opposed to the high group in HGSOC
patients who were sensitive about platinum, but not those with platinum
resistance (Fig. 7A). Moreover, patients with platinum resistance had a higher
risk score (Fig. 7B). Furthermore, we estimated the IC50 for each subtype using
the prediction model for the three agents developed by Xiaofan Lu [47]. The
findings indicated that the low-risk group responded more favorably to
chemotherapy as opposed to the high-risk group (cisplatin, p
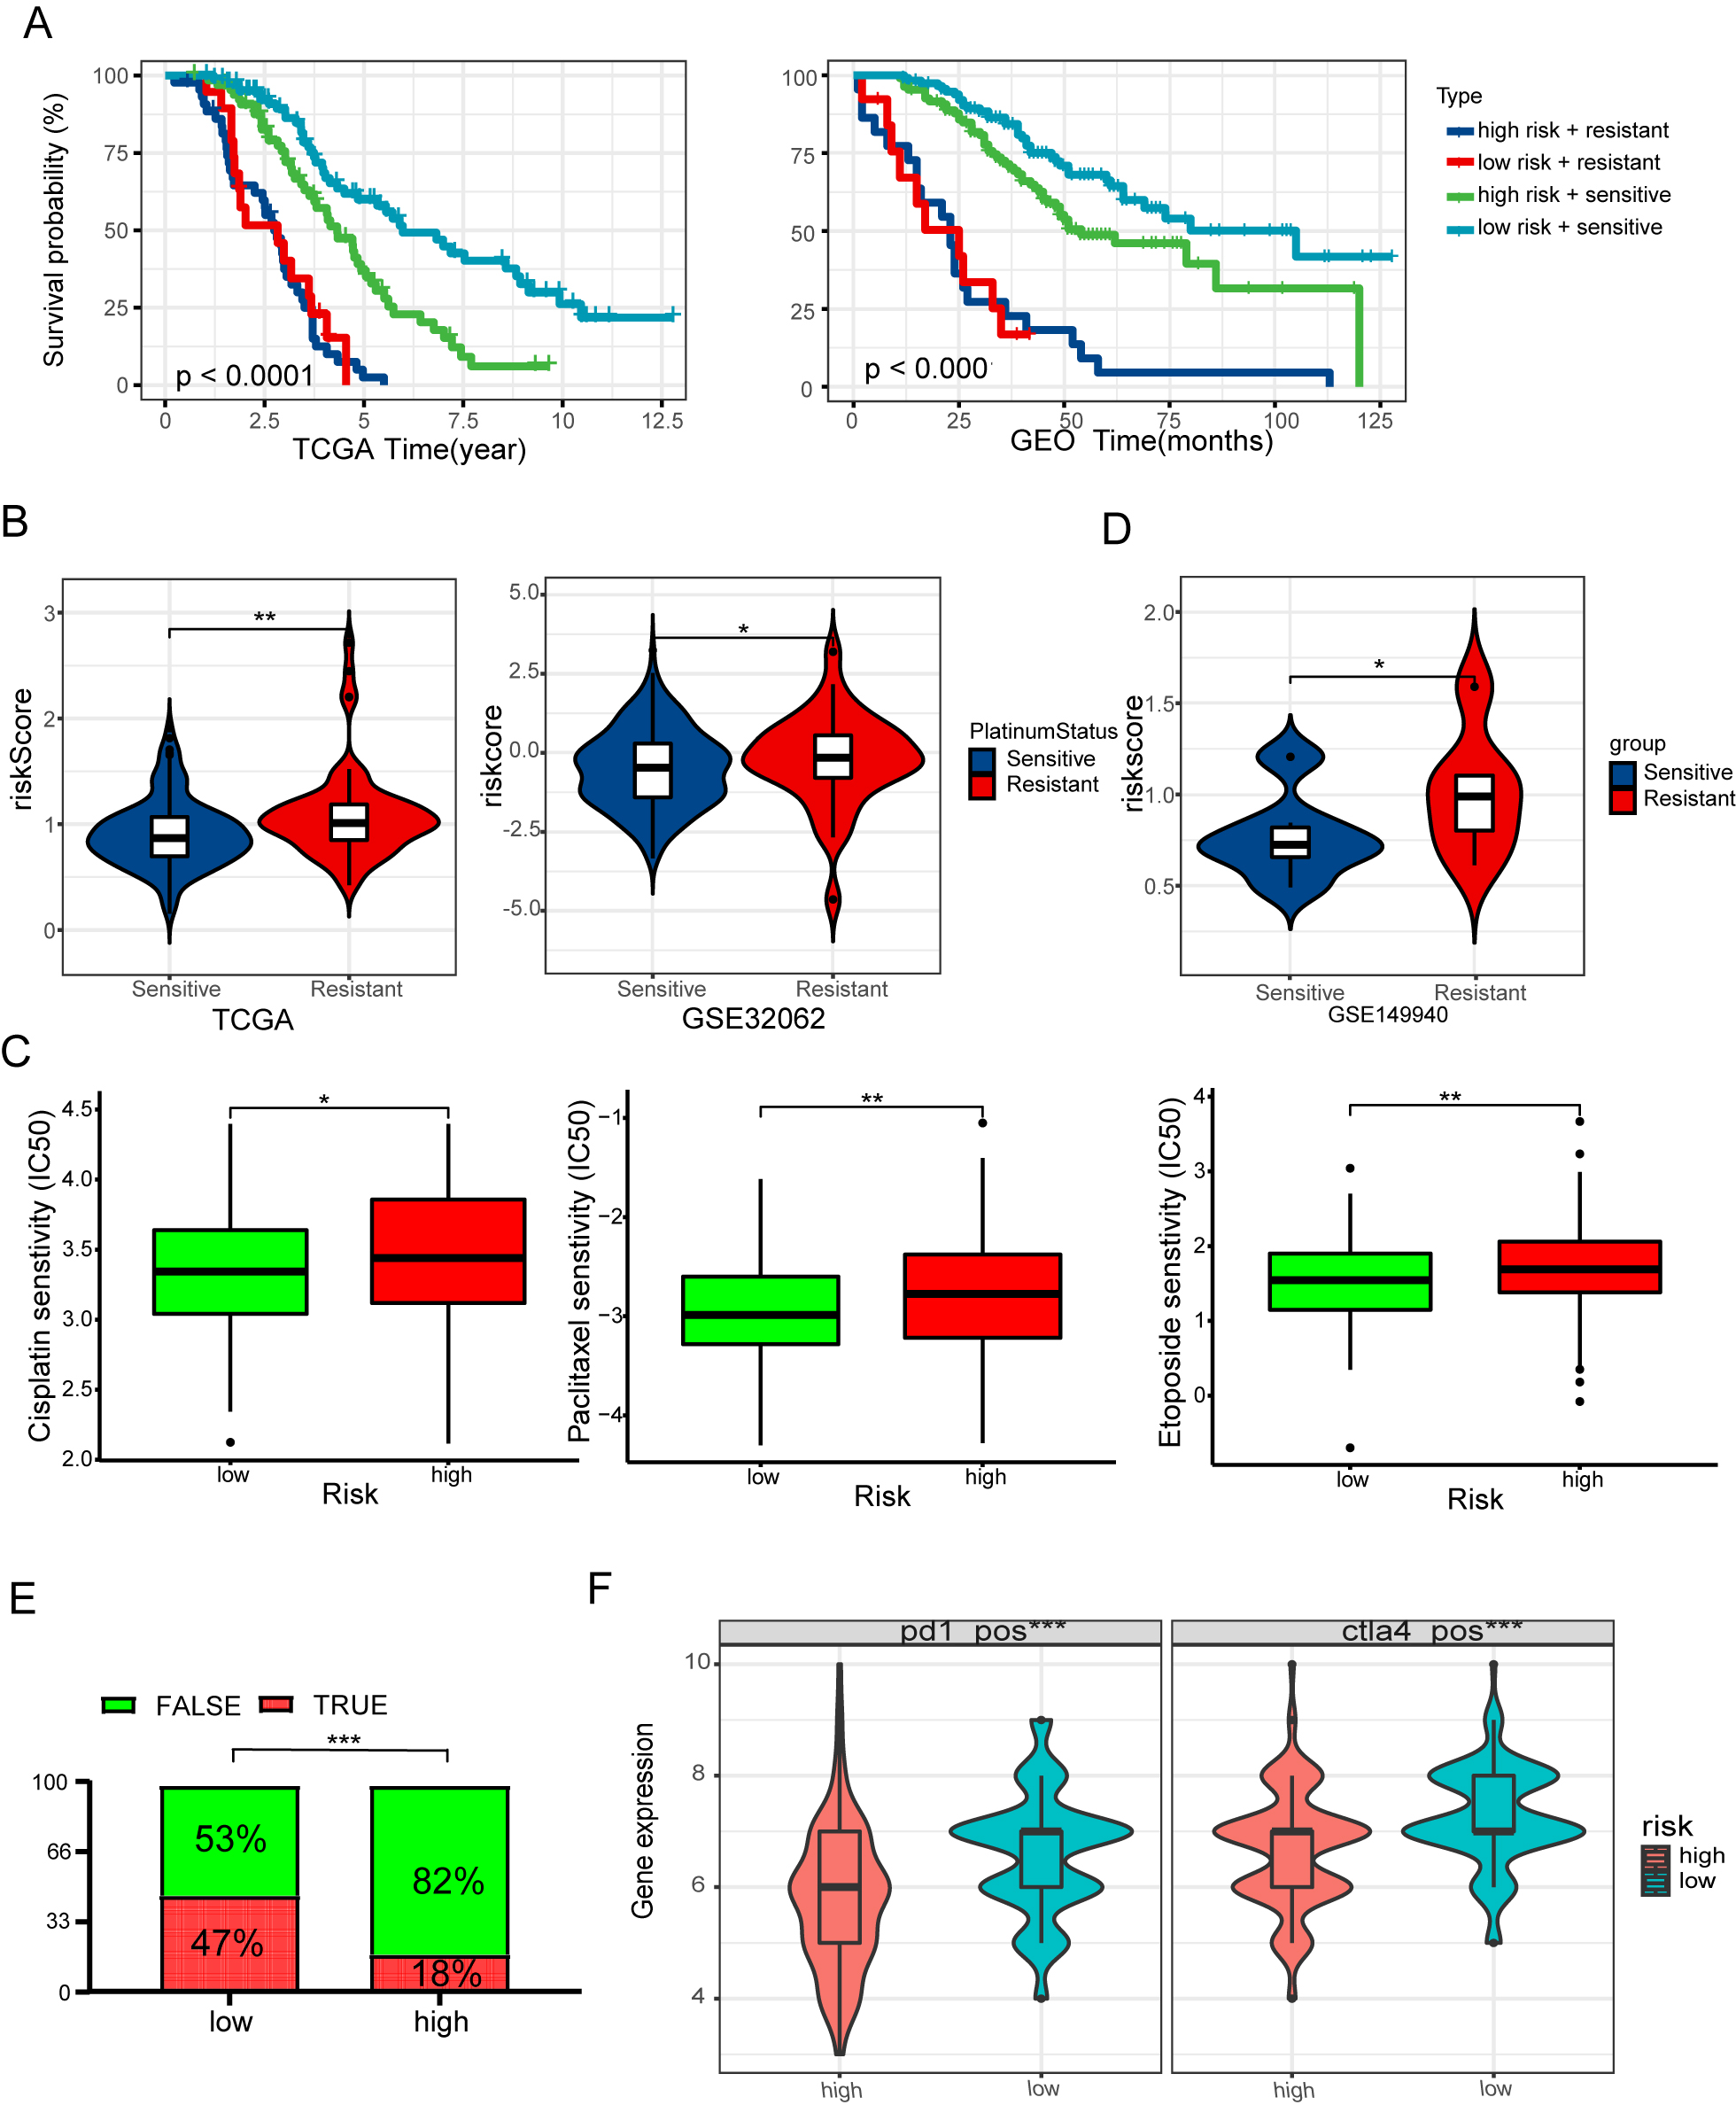 Fig. 7.
Risk signature predicts the response of conventional
therapy. (A) Kaplan-Meier curves of OS for the high-risk score with or
without platinum resistance and low-risk score with or without platinum
resistance in the TCGA and GEO cohort. (B) Differences in risk score between
platinum resistance and platinum-sensitive groups. (C) Differences in risk score
between PARP inhibitors resistance and PARP inhibitors sensitive groups. (D) The
boxplots depict the estimated IC50 values for doxorubicin, paclitaxel, and
cisplatin for three subtypes, as determined by the GDSC database. (E) The
anticipated immunotherapy (TRUE/FALSE) response rate to anti-PD-L1 in low- and
high-risk groups in the TCGA cohort. (F) Differences in IPS between low- and
high-risk groups. *p
Despite recent advances in the maintenance treatment of HGSOC, patients with locally progressive or metastatic HGSOC have been less successful in achieving satisfactory clinical results. We utilized the TIDE algorithm to estimate immune checkpoint blockade (ICB) treatment response in order to determine possible groups of patients who may gain benefit from immunotherapy. Results illustrated that the low-risk group displayed a significantly improved response to immunotherapy as opposed to the high-risk group (Fig. 7E). The Cancer Immunome Atlas (https://tcia.at/) showed similar results. The low-risk group exhibited a greater response rate to CTLA4 and PD-1 inhibitors, implying that patients who have low-risk scores may gain benefit from immunotherapy (Fig. 7F).
We further performed a Friends analysis of 9 risk genes by using GOSemSim R package to screen a hub gene, CD2 (Fig. 8A) [49]. Notably, the expression of CD2 was greatly decreased in normal tissues compared to HGSOC tissues using Gene Expression Profiling Interactive Analysis (GEPIA) (Fig. 8B,C) [50]. Based on the cellular level, the expression of CD2 was shown to be greater in tumor cell as opposed to normal ovarian cell by PCR (Fig. 8D). In the TCGA database, patients with HGSOC who exhibited low expression of CD2 had obviously poorer OS compared with those who exhibited high CD2 expression (Fig. 8E). Following that, the survival analysis was tested utilizing the GEO database (Fig. 8F).
 Fig. 8.
CD2 Expression and Survival Analyses. (A) The boxplots
of the estimated factor value for 9 LMDGs based on Friends analysis. (B)
Pan-cancer analysis of CD2 expression across the cancerous tissue and the
corresponding adjacent normal tissue from TCGA. (C) Differential expression of
CD2 in HGSOC. (D) Real-time quantitative PCR analysis of CD2 expression in normal
ovarian cells and skov3 ovarian cancer cells. (E,F) Kaplan-Meier curves of OS for
CD2 in the GEO and TCGA cohorts. *p
TIICs of HGSOC samples were utilized to further explore the interaction between CD2 expression and the TME. Seven separate algorithms from the TIMER online platform were employed to analyze these TIICs. Results showed CD8+ T cells, dendritic cells, M1 macrophages strongly correlated with CD2, which offers convincing evidence for the critical function played by CD2 in the TME of HGSOC samples (Supplementary Fig. 2). Interestingly, the radar plot demonstrated that CD2 strongly correlated with immune checkpoint inhibitors (PD1, PDL1, CALT4, IDO1), TCR scores, BCR scores, GEP, and CYT, negatively correlated with TIDE score (Fig. 9A). Moreover, the group displaying elevated CD2 expression was found to have a considerably improved response to immunotherapy as opposed to the low group using the TIDE algorithm (Fig. 9B). Furthermore, multicolor immunofluorescence analysis demonstrated that CD2, PD-1, and CD8 were co-localized in HGSOC tissues, suggesting that CD2 and CD8+ cells spatially interact in the TME and optimizing the CD2 intensity in HGSOC tissue could enhance the effectiveness of immunotherapy by enhancing the anti-tumor immune responses (Fig. 9C,D). In addition, we found that the expression level of CD2 was higher in T cells compared with malignant cells and stromal cells in the OV patients (GSE118828) by using TISCH database (Fig. 9E).
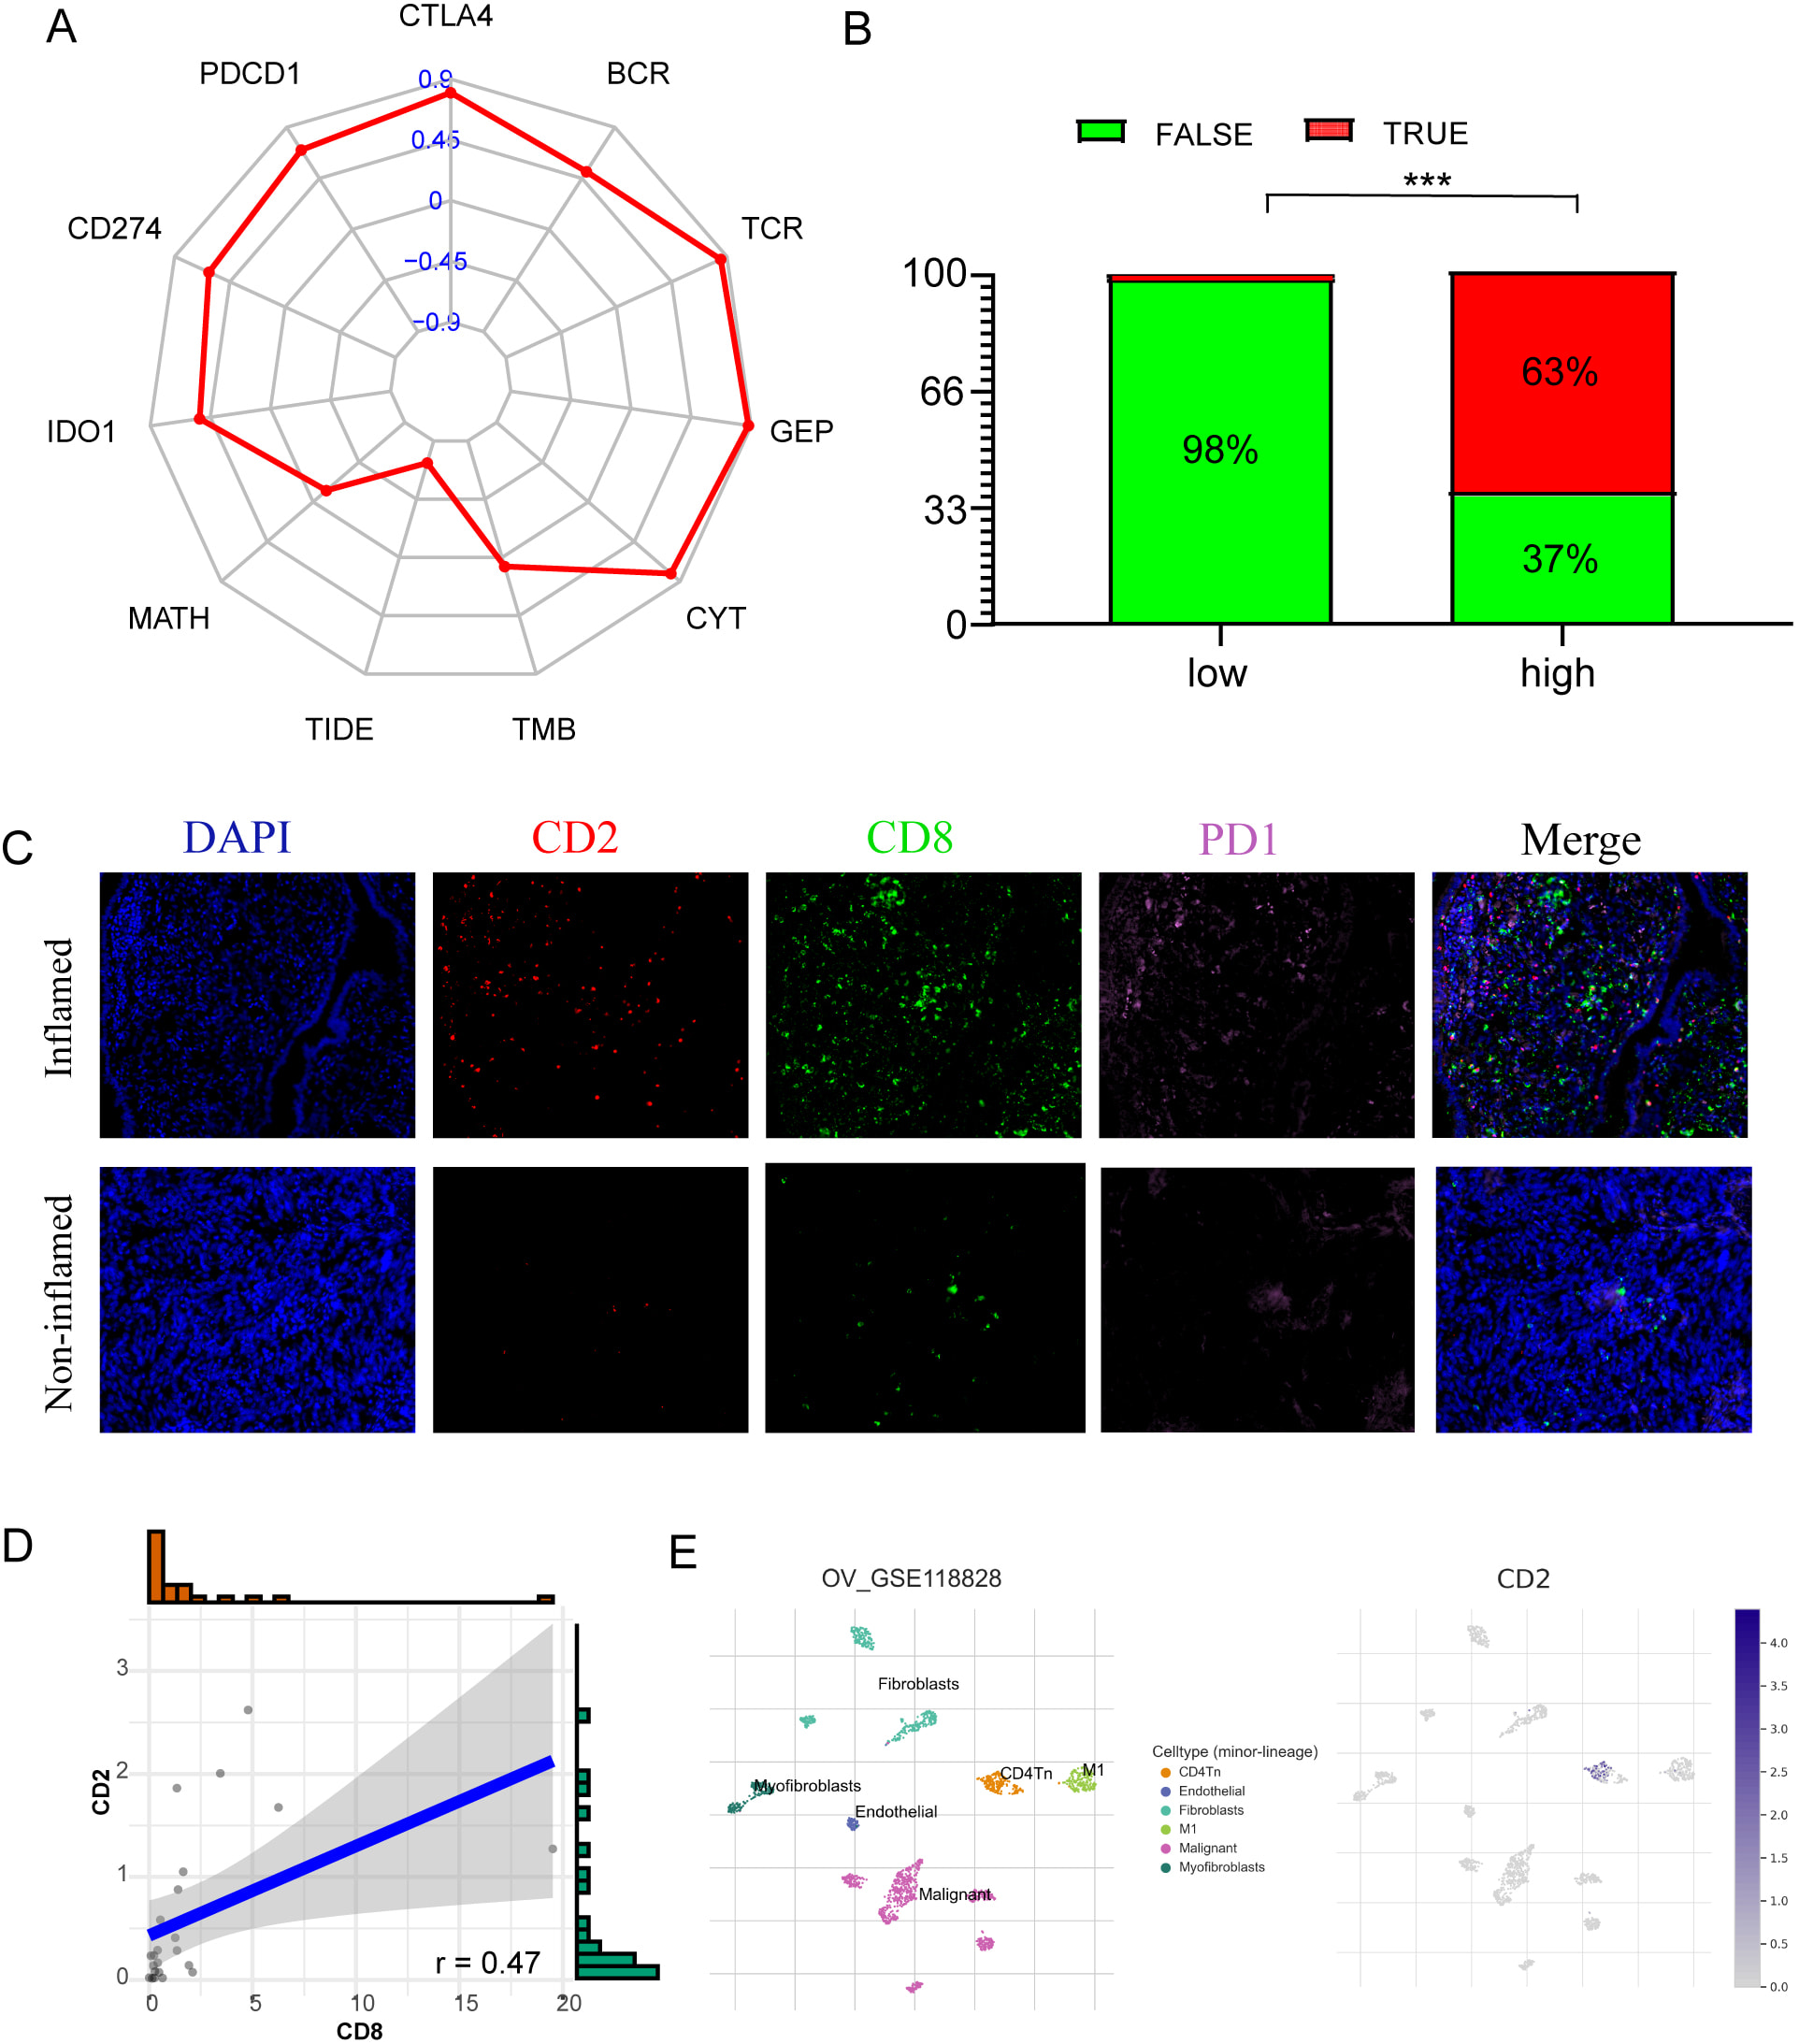 Fig. 9.
Correlations between CD2, the immune infiltration, and the
response of immunotherapy in HGSOC. (A) Radar graph of the correlation between
CD2 and immune checkpoint inhibitors (PD1, PDL1, CALT4, IDO1), TCR scores, BCR
scores, GEP, CYT, and TIDE score. (B) The anticipated immunotherapy (TRUE/FALSE)
response rate to anti-PD-L1 in low- and high-risk CD2 in the TCGA cohort. (C)
Expression of CD2, CD8, and PD-L1 in our cohort was detected using
immunofluorescence in two immune phenotypes based on the expression of CD8+ T
cells. (D) Correlation between the CD2 positive rate and CD8 positive rate
detected using immunofluorescence. (E) Single cell level analysis evaluating the
expression of CD2. ***p
In the present research, we utilized RNA-seq data retrieved from TCGA together with 39 differentially expressed leukocyte migration-related genes to construct a prognosis-related 9-LMGs signature that can be used to establish risk classification and anticipate clinical outcomes in cancer patients. We discovered that there is a strong correlation between the risk signature and clinical-pathological factors. The efficiency of the risk signature as an independent prognostic indicator was validated using Cox regression. Immune-related pathways were shown to be significantly enriched in the low-risk group, as demonstrated by the functional enrichment analysis. We discovered that the risk signature was associated with the processes of the cancer immunity cycle. Furthermore, the high-risk group was inversely associated with a large number of immunomodulators and exhibited a suppressive immune microenvironment. Moreover, we examined the prognostic significance of risk score for HGSOC responses to different treatments. We discovered that patients in the low-risk group had a higher likelihood of benefiting from chemotherapy treatment as opposed to those in the high-risk group. ICB therapy might be efficacious for HGSOC patients with low-risk scores. Subsequent analysis demonstrated that CD2 was a hub gene related to TME, played a significant prognostic role in HGSOC patients. Tumors with elevated levels of CD2+ cell infiltration were shown to have a higher abundance of intratumoral PD1+ cells and CD8+ T cells infiltration, according to immunofluorescence analyses.
Leukocytes are immune cells that comprise both adaptive immune cells (T and B lymphocytes) and innate immune cells (NK cells, dendritic cells, macrophages, monocytes, granulocytes, etc.) [51]. The migration of leukocytes is critical for immune system development as well as in the response to tumor rejection, inflammation, and infection [52]. Several research reports have demonstrated that defects in the migration of NK cells to tumor locations resulted in the development of immune-suppressive TME [53]. Trafficking of T cells into the TME is key to the success of cancer immunotherapy, such as the adoptive cell transfer therapy [54]. Nevertheless, most studies mainly focused on chemokines, the proteins that modulate the migration of leukocytes, inducing the recruitment of pro-tumorigenic immune cells while inhibiting the buildup of anti-tumorigenic immune cells. CXCR2 inhibition reduced the count of MDSC cells in tumors while increasing the number of T cells and natural killer cells [55]. In a previous study, CXCR3 was identified as a prognostic marker as well as a possible therapeutic target for individuals with solid malignancies [56]. Our findings revealed that risk classification based on integrated LMRG sets had a crucial function in the TME and prognosis of HGSOC patients
TME may be classified into two groups: those with T-cell inflammation (with positive CD8+ T-cell infiltration and also type I interferon features) and those without T-cell inflammation (lacking both). The TME with T cell–inflammation is often correlated with improved prognosis and enhanced susceptibility to ICB [57, 58, 59]. Here, we noted that the infiltration levels of CD8+ T cells were obviously elevated in the low-risk group, which enriched in the response to type I interferon. The recruitment of CD8+ T cells to tumors is modulated by a variety of chemokines. Multiple chemokines are associated with the infiltration levels of CD8+ T cells in melanoma, such as the CCR5 ligands, CCL4 and CCL5, as well as the CXCR3 ligands, CXCL9 and CXCL10, which are interferon-responsive genes that have been shown to be activated in DC following the activation of type I interferon [60]. The stimulation of the Janus kinase-signal transducer and activator of transcription (JAK-STAT) pathway is necessary for the mediation of cellular responses to interferons. STAT proteins are known to be the primary signaling proteins for inflammatory cytokines, and they perform a critical role in the function and differentiation of immune cells [61]. Our study demonstrated that the low-risk group was passively associated with several key chemokines and strongly enriched in the modulation of the immunity pathways, including JAK-STAT pathway and antigen processing and presentation, by using KEGG analysis. Moreover, the present study also indicated that higher CYT and GEP, both of which are strong anti-tumor immune effector signature and inflammation indicators, were observed in the low-risk group. Taken together, these findings illustrated that the low-risk group would shape the T cell–inflamed TME in HGSOC.
Numerous studies have shown that the presence of CD8+ T cells is correlated with the up-modulation of immunological inhibitory pathways, which are responsible for immune suppression. In the T-cell-inflamed TME, there are four primary immune evasion mechanisms: (i) PD-L1 up-modulation and subsequent T cells suppression via PD-L1 interaction with PD-1; (ii) IDO up-modulation; (iii) recruitment of regulatory T cells (Tregs) via CCL22 (produced from effector T cells); (iv) selection of tumor cells that have decreased antigenic immunogenicity [57]. As opposed to the T-cell inflammation TME, the TME with non-T-cell-inflammation has neither any T cells nor upmodulated immune suppressive mechanisms [58]. As a result, it should come as no surprise that checkpoint blocking is ineffective in this group of patients [62]. Our findings also imply that the low-risk group had an elevated level of immune checkpoint inhibitors and CCL22 as opposed to the high-risk group. The patients with low-risk scores tend to respond to ICB immunotherapy.
Aneuploidy has been shown to be correlated with diminished immune infiltration in a variety of tumor forms, according to the research literature [63]. The expressions of specific genes associated with cytotoxic actions facilitated by NK cells and CD8+ T cells were greatly decreased in tumors with high aneuploidy. Furthermore, genes involved in pathways that are associated with the existence of a continuous immune response and a cytokine-rich microenvironment were shown to be downregulated in high aneuploidy tumors [36]. These reports are consistent with what we have observed in the low-risk group. In our research, we discovered a strong positive correlation between risk signature and aneuploidy. Collectively, our findings indicate a decrease in immune-mediated pro-inflammatory and cytotoxic activity in the microenvironment of high-risk score tumors. When compared to non-HRD tumors, the response of HRD tumors to anti-neoplastic drugs such as platinum chemotherapy [64, 65, 66] or poly(ADP-ribose) polymerase (PARP) inhibitors [67, 68] has been shown to be varied. We found the high-risk group tends to have lower HRD scores and acquire resistance to platinum-based chemotherapy in HGSOC. Moreover, defects in the HR pathway have been correlated with the activation of the stimulator of interferon genes (STING) pathway, which has been demonstrated to enhance the responses of antigen-specific T cell and transcription of type I interferon (IFN) genes in dendritic cells [69] and tumor cells [70]. This finding further corroborated our conclusion that the low-risk group may define a T cell-inflamed TME and exhibit a better response to ICB therapy.
CD2 is a well-recognized transmembrane glycoprotein belonging to the immunoglobulin superfamily, who expressed on the surface of dendritic cells, thymocytes, NK cells, and T cells [71, 72]. Despite the fact that CD2 has been recognized for many years to be involved in a costimulatory pathway of T cell activation, studies of other costimulatory pathways with greater impact on mice have received considerable attention from immunologists up to now. Multiple studies showed that elevated expression of CD2 was correlated with the improved OS and distant metastasis-free survival in BRCA samples [73]. Our data indicated that elevated expression of CD2 resulted in an obviously longer FPS and OS. According to a recent research report, the downmodulation of CD2 could decrease the responses of anti-tumor T cells in colorectal and endometrial cancers, and even offset the efficacy of PD-1 immunotherapy in these cancers [74]. These reports are consistent with what we have observed in HGSOC by immunofluorescence. According to our findings, the infiltration levels of numerous effector TIICs, for example, CD8+ T cells and M1 macrophages, were considerably higher in the high-CD2 group, indicating that the expression of CD2 has an influence on the TME in HGSOC patients.
In spite of the fact that we have developed a prognostic signature and that our research gives new directions for improving HGSOC management, there exist a few drawbacks to this research. Firstly, the size of our sample and cell lines might be insufficient. Our external validation cohort only consisted of OS, which cannot further validate our signature effectively. The findings need to be validated by more independent cohorts to prove the clinical utility of risk model. Moreover, despite our efforts to elucidate the correlation between 9 LMRGs and immune infiltration, additional functional experiments are required to investigate the possible mechanisms in HGSOC. Lastly, there is currently no relevant dataset on HGSOC immunotherapy to validate the efficacy of our model and to screen HGSOC patients who may benefit from immunotherapy. Prospective clinical trials are recommended in order to further verify the clinical efficiency of the risk model in the context of ICB decisions.
We validated our results using two independent cohorts, which strengthened the robustness of our conclusion in terms of prognostic value of our 9 LMRGs prognostic signature. Our study identified the risk model of leukocyte migration associated with inflammatory TME in HGSOC and the role of the hub gene CD2 in TME, which may provide some potential clinical implications for comprehensive treatment of HGSOC. Meanwhile, CD2 may become a new biomarker for predicting immune efficacy, and relevant experiments are needed to further confirm the key mechanism of CD2 regulation of TME.
HGSOC, High-grade serous ovarian cancer; TME, tumor immune microenvironment; LMDGs, leukocyte migration-related differentially expressed genes; ssGSEA, single-sample gene set enrichment analysis; TIICs, tumor-infiltrating immune cells; PFS, progression-free survival; OS, overall survival; OC, Ovarian cancer; EOC, epithelial ovarian cancer; GO, gene ontology; NES, normalized enrichment score; FDR, false discovery rate; MHC, Major Histocompatibility Complex; GEP, T cell-inflamed gene expression profile; CYT, cytolytic activity; TCR, T cell receptor; BCR, B cell receptor; HRD, homologous recombination deficiency; MATH, Mutant-allele tumor heterogeneity; TMB, Tumor mutation burden; IC50, half-maximal inhibitory concentration; TIDE, Tumor Immune Dysfunction and Exclusion; IPS, immunophenoscore; IF, Immunofluorescence; PARP, poly(ADP-ribose) polymerase; GEPIA, Gene Expression Profiling Interactive Analysis.
The public dataset used in this study is freely available at https://xenabrowser.net/ and https://www.ncbi.nlm.nih.gov/.
The authors declare their contribution as follows. JP, XC and LY conceived and drafted of the manuscript. YS and JL assisted with data curation. LL and YL analyzed the data. SQ and LT participated in the formal analysis of the study. QX contributed to the concept, revised the article and provided project administration and funding acquisition. All authors have read and agreed to the published version of the manuscript.
Not applicable.
The results here are in whole or part based upon data generated by the TCGA Research Network: https://www.cancer.gov/tcga and the GEO Research Network: https://www.ncbi.nlm.nih.gov/geo/.
The project was funded by the grants of Joint Funds for the National Clinical Key Specialty Construction Program (2021); Innovative Medicine Subject of Fujian Provincial Health Commission (2020CX0101); Natural Science Foundation of Fujian Province (2020J011126); Fujian Provincial Clinical Research Center for Cancer Radiotherapy and Immunotherapy (2020Y2012).
The authors declare no conflict of interest.
Publisher’s Note: IMR Press stays neutral with regard to jurisdictional claims in published maps and institutional affiliations.