
- Academic Editor
Background: With the rapid development of next-generation sequencing technology, more plants plastomes have been sequenced, further advancing species identification and phylogenetic studies. However, there are a few studies on the genetic and phylogenetic analysis of the plastomes of Dicranostigma lactucoides Hook. f. et Thoms. and Hypecoum leptocarpum Hook. f. et Thoms. Methods: In this study, we sequenced and analyzed the plastomes of Dicranostigma lactucoides Hook. f. et Thoms. and Hypecoum leptocarpum Hook. f. et Thoms., and conducted a phylogenetic analysis using 13 related species. Results: The results showed that the plastomes of both D. lactucoides and H. leptocarpum had a typical tetrad structure, with sizes of 166,819 bp and 163,282 bp, respectively. We annotated 133 genes for D. lactucoides and 120 genes for H. leptocarpum. A total of 72 and 43 simple repetitive sequences were detected in D. lactucoides and H. leptocarpum, respectively. Codon preference analysis showed that the relative usage frequency of codons and the relative abundance of synonymous codons used were the same for both plastomes. Nucleotide polymorphism analysis identified seven variant loci with high nucleotide diversity (Pi) values, all located in the large single copy (LSC) region. Inverted repeat (IR) boundary analysis revealed differences in gene types and locations on both sides of the boundary, except for the small single copy/inverted repeat a (SSC/IRa) boundary. The phylogenetic analysis showed the species clustered into two major groups, one with five genera (Hypecoum, Corydalis, Papaver, Meconopsis, and Dicranostigma) and the other with two genera (Coreanomecon; and Hylomecon). Conclusions: Comparative analysis of the plastome genomic characteristics and phylogeny of D. lactucoides and H. leptocarpum laid the foundation for identifying the above two species and the phylogenetic study and comprehensive exploitation of the Papaveraceae.
There are about 30 genera and 700 species of the Papaveraceae Juss. family worldwide, among which 18 genera and 362 species are native to China, mainly southwest China, with about 9 genera and 158 species in the Qinghai-Tibet Plateau [1]. Dicranostigma lactucoides Hook. f. et Thoms. is a herbaceous plant of the Dicranostigma Hook. f. & Thomson genus in the Papaveraceae family, which is distributed in the central Himalayas in Tibet, western Sichuan, northwestern India, and Nepal [2]. It is cold and drought-tolerant species growing on rocky slopes above 3000 meters above sea level [3]. D. lactucoides, which is considered a rare Chinese herbal medicine, is recorded in the “Shaanxi Chinese Herbal Medicine” and “National Compilation of Chinese Herbal Medicine” [4]. Its alkaloids have beneficial biological activities, such as antibacterial, antitumor, and hepatoprotective activities, excellent healing properties on tuberculosis, gastric ulcers, and surgical wounds and the ability to boost immunity [5]. Hypecoum leptocarpum Hook. f. et Thoms. is an annual herb of the Hypecoum L. genus in the family Papaveraceae and is found in grasslands, valleys, riverbanks, gravels, and other parts of the slopes of northeast China and Tibet [6]. H. leptocarpum has a long history of medicinal applications in China. According to ancient materia medica, the whole herb is used as medicine; H. leptocarpum is bitter and cold and is mainly used for treating cold, fever, and sore throat due to its heat clearing, detoxification, blood cooling, and pain-relieving effects [7]. H. leptocarpum also has strong vitality, branching, and other characteristics and is common around river banks and wetlands, where it exhibits an ecological value in preventing soil erosion [8]. In recent years, the research on Tibetan D. lactucoides and H. leptocarpum has mainly focused on their chemical composition and pharmacological effects. However, there are fewer reports on the genetic information of Tibetan D. lactucoides and H. leptocarpum. Currently, there are no reports on the complete plastome sequences of D. lactucoides and H. leptocarpum.
Chloroplasts are the main photosynthesis sites in higher plants, some algae, and a few protists, which are important for energy conversion in nature [9]. As semi-autonomous organelles with relatively independent genetic material, chloroplasts can synthesize some of their own proteins [10]. The plastomes has a complete set of DNA sequences, typically 120–180 kb in size, containing 110–130 genes with a highly conserved structure and gene content [11]. The plastomes has a ring-like tetrameric structure that exists in multiple copies in the cell and mainly encodes photosynthetic light response-related proteins, which also regulate transcription and translation processes during gene expression [12]. Because of its high stability, small molecular weight, and easy sequencing, the plastomes has been widely used in plant classification, phylogenetic analysis, and evolutionary studies [13]. Therefore, sequencing and analyzing plastomes of the Tibetan D. lactucoides and H. leptocarpum are important for the molecular identification and population genetic diversity of the Papaveraceae.
In this study, the plastomes of two Tibetan poppy families were sequenced using next-generation sequencing (NGS) and were assembled and annotated. The obtained plastomes sequences of Tibetan D. lactucoides and H. leptocarpum were compared, and their sequence composition, sequence characteristics, and phylogenetic relationships were analyzed, aiming to provides a foundation for the rational classification and molecular identification of Papaveraceae species.
The plant materials of both D. lactucoides and H. leptocarpum were harvested from the Tibet Autonomous Region, China (Table 1) and dried in silica gel for analysis. The leaves were identified by researcher Guoyue Zhong of Jiangxi University of Traditional Chinese Medicine (JJUCM) as Papaveraceae plants, and the voucher specimens were deposited in the herbarium of JJUCM (Fig. 1).
| Species | Collection location | Longitude and Latitude | Altitude | Sample number | Accession number |
| D. lactucoides | Rikaze, Tibet | 86°16′7.5″E | 3722.3 m | H3050312 | OR085636 |
| Gyirong County Gompa Village | 28°37′49.3″N | ||||
| H. leptocarpum | Lhasa, Tibet | 90°38′9.46″E | 3596.0 m | H3050148 | OR085637 |
| Daga Township, Qushui County | 29°18′33.49″N |
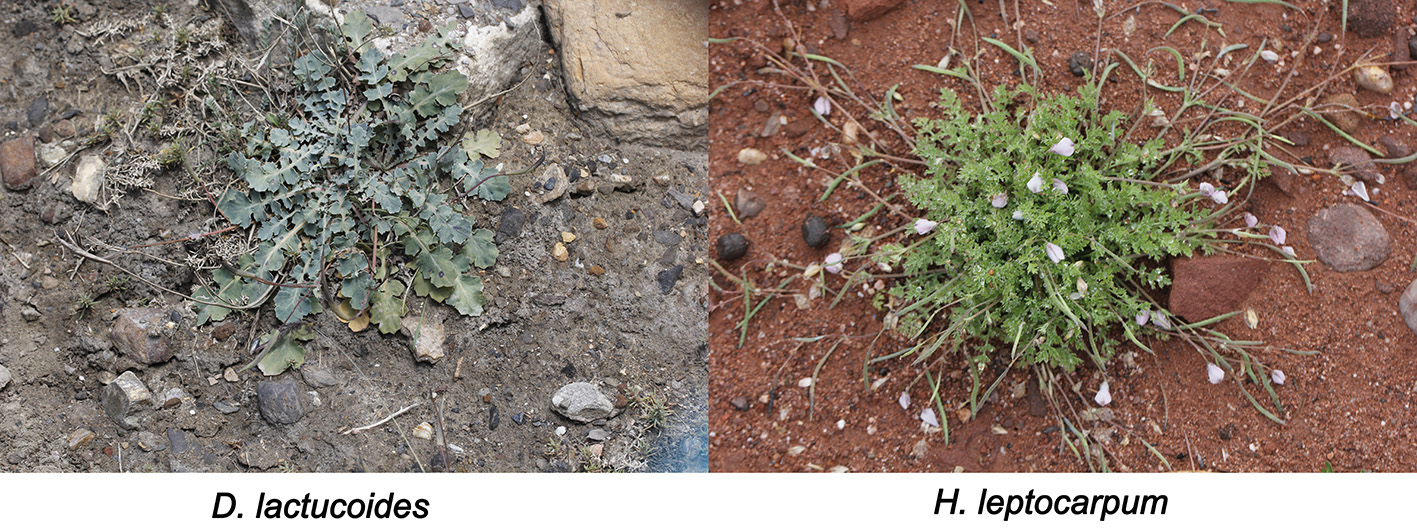 Fig. 1.
Primitive plant pictures of D. lactucoides and H. leptocarpum.
The genomic DNA was extracted from the leaves of D. lactucoides and
H. leptocarpum using a plant genomic DNA kit (Tiangen Biochemical
Technology (Beijing) Co., Ltd., Beijing, China). The quality of genomic DNA was
detected by a spectrophotometer and 1% agarose gel electrophoresis. Samples with
qualified DNA concentration greater than 20 ng
The raw sequencing data were filtered using Trimmomatic software [14] (Aachen and Institute of Bio- and Geosciences: Plant Sciences, Forschungszentrum Jülich, Leo-Brandt-Straße, Jülich, Germany) to remove splice sequences and low-quality base sequences. The filtered plastomes were assembled from scratch using GetOrganelle 1.7.5 software [15] (Chinese Academy of Sciences, Kunming, Yunnan, China) and were annotated using CPGAVAS2 software [16] (Faculty of Technology, University of Bielefeld, Bielefeld, Germany) (http://47.96.249.172:16019/analyzer/annotate/). The plastome physical structure mapping was performed using OGDRAW software [17] (Max-Planck-Institut für Molekulare Pflanzenphysiologie, Am Mühlenberg, Germany) (https://chlorobox.mpimp-golm.mpg.de/OGDraw.html).
Simple sequence repeat (SSR) was screened using the online tool MISA v2.1 (Leibniz Institute of Plant Genetics and Crop Research, Gatersleben, Germany) (https://webblast.ipk-gatersleben.de/misa/) software with parameters set to 10 for single nucleotide SSR repeats, 5 for dinucleotide SSR repeats, 4 for single and trinucleotide SSR repeats, and 3 for tetranucleotide and pentanucleotide SSR repeats. The REPuter software [18] (Faculty of Technology, Bielefeld, Germany) (http://bibiserv.techfak.uni-bielefeld.de/reputer/) was used to annotate the plastome repeats, including forward, reverse, complementary, and palindromic repeats.
CodonW 1.4.2 software [19] (Paul Sharp lab, Dept of Genetics, University of Nottingham, Nottingham, UK) was used to calculate the codon preference (Relative synonymous codon usage, RSCU), and PAML v4.973 software [20] (Department of Biology, Galton Laboratory, London, UK) was used to calculate the ratio between non-synonymous mutation frequency (Ka) and synonymous mutation frequency (Ks) for each gene.
The MAFFT v7 software [21] (Bioinformatics Center, Institute for Chemical Research, Kyoto University Uji, Kyoto 611-0011, Japan) was used to compare the plastome sequences of D. lactucoides and H. leptocarpum (with default parameters), while DnaSP v5.1 software [22] (Departament de Genètica, Facultat de Biologia and Institut de Recerca de la Biodiversitat, Universitat de Barcelona, Barcelona, Spain) was used to assess the nucleotide diversity (Pi) of the plastomes with a step size of 200 bp and a window length of 600 bp.
IR boundary analysis was conducted using the online tool IRSCOPE (https://irscope.shinyapps.io/irapp/) [23] to compare the gene types and the location in the border area. The contraction and expansion of the IR regions in the plastomes of the 2 species were also analyzed.
Covariance analysis of the whole genome sequences of the D. lactucoides and H. leptocarpum plastomes was performed using the online mVISTA software (http://genome.lbl.gov/vista/mvista/submit.shtml) [24] to determine whether there were changes in the order of gene arrangement (Shuffle-Lagan was used for the alignment).
Phylogenetic analysis was performed using 14 spliced plastome sequences of the family Papaveraceae downloaded from the National Center for Biotechnology Information (NCBI) database (Table 2) and 2 newly sequenced plastomes of the Papaveraceae species in Tibet. Chelidonium majus L. was used as an outgroup. The phylogenetic tree was constructed based on the maximum likelihood (ML) method using PhyloSuite v1.2.2 [25] (Key Laboratory of Aquaculture Disease Control, Chinese Academy of Sciences, Wuhan, China) with bootstrap values of 10,000 replicates.
| Species | GenBank accession number | Genome size/bp |
| Corydalis saxicola Bunting | MT077877.1 | 189,155 |
| Corydalis saxicola Bunting | MT077879.1 | 189,029 |
| Corydalis tomentella Franch. | MT093187.1 | 190,247 |
| Corydalis tomentella Franch. | MT077878.1 | 190,198 |
| Corydalis conspersa Mazim. | NC_047208.1 | 187,810 |
| Corydalis bungeana Turcz. | MW538958.1 | 167,629 |
| Papaver somniferum L. | NC_029434.1 | 152,931 |
| Papaver rhoeas L. | NC_037831.1 | 152,905 |
| Papaver orientale L. | NC_037832.1 | 152,799 |
| Meconopsis punicea Maxim. | NC_050878.1 | 153,281 |
| Meconopsis henrici Bur. et Franch. | NC_050877.1 | 153,788 |
| Coreanomecon hylomeconoides Nakai | NC_031446.1 | 158,824 |
| Hylomecon japonica (Thunb.) Prantl et Kundig | NC_045388.1 | 160,011 |
| Chelidonium majus L. | NC_046829.1 | 159,734 |
The full-length plastomes of D. lactucoides and H. leptocarpum are 166,819 and 163,282 bp, respectively, and exhibit a typical tetrad structure (Fig. 2, Table 3) with the GC contents of 39.23% and 38.57%, respectively. The large-single copy (LSC) regions of the plastomes of D. lactucoides and H. leptocarpum are 82,927 bp and 90,852 bp, while their small-single copy (SSC) regions are 19,538 bp and 17,600 bp, respectively. The LSC and SSC regions of D. lactucoides and H. leptocarpum are separated by two reversed IR regions of 32,177 bp and 27,415 bp, respectively.
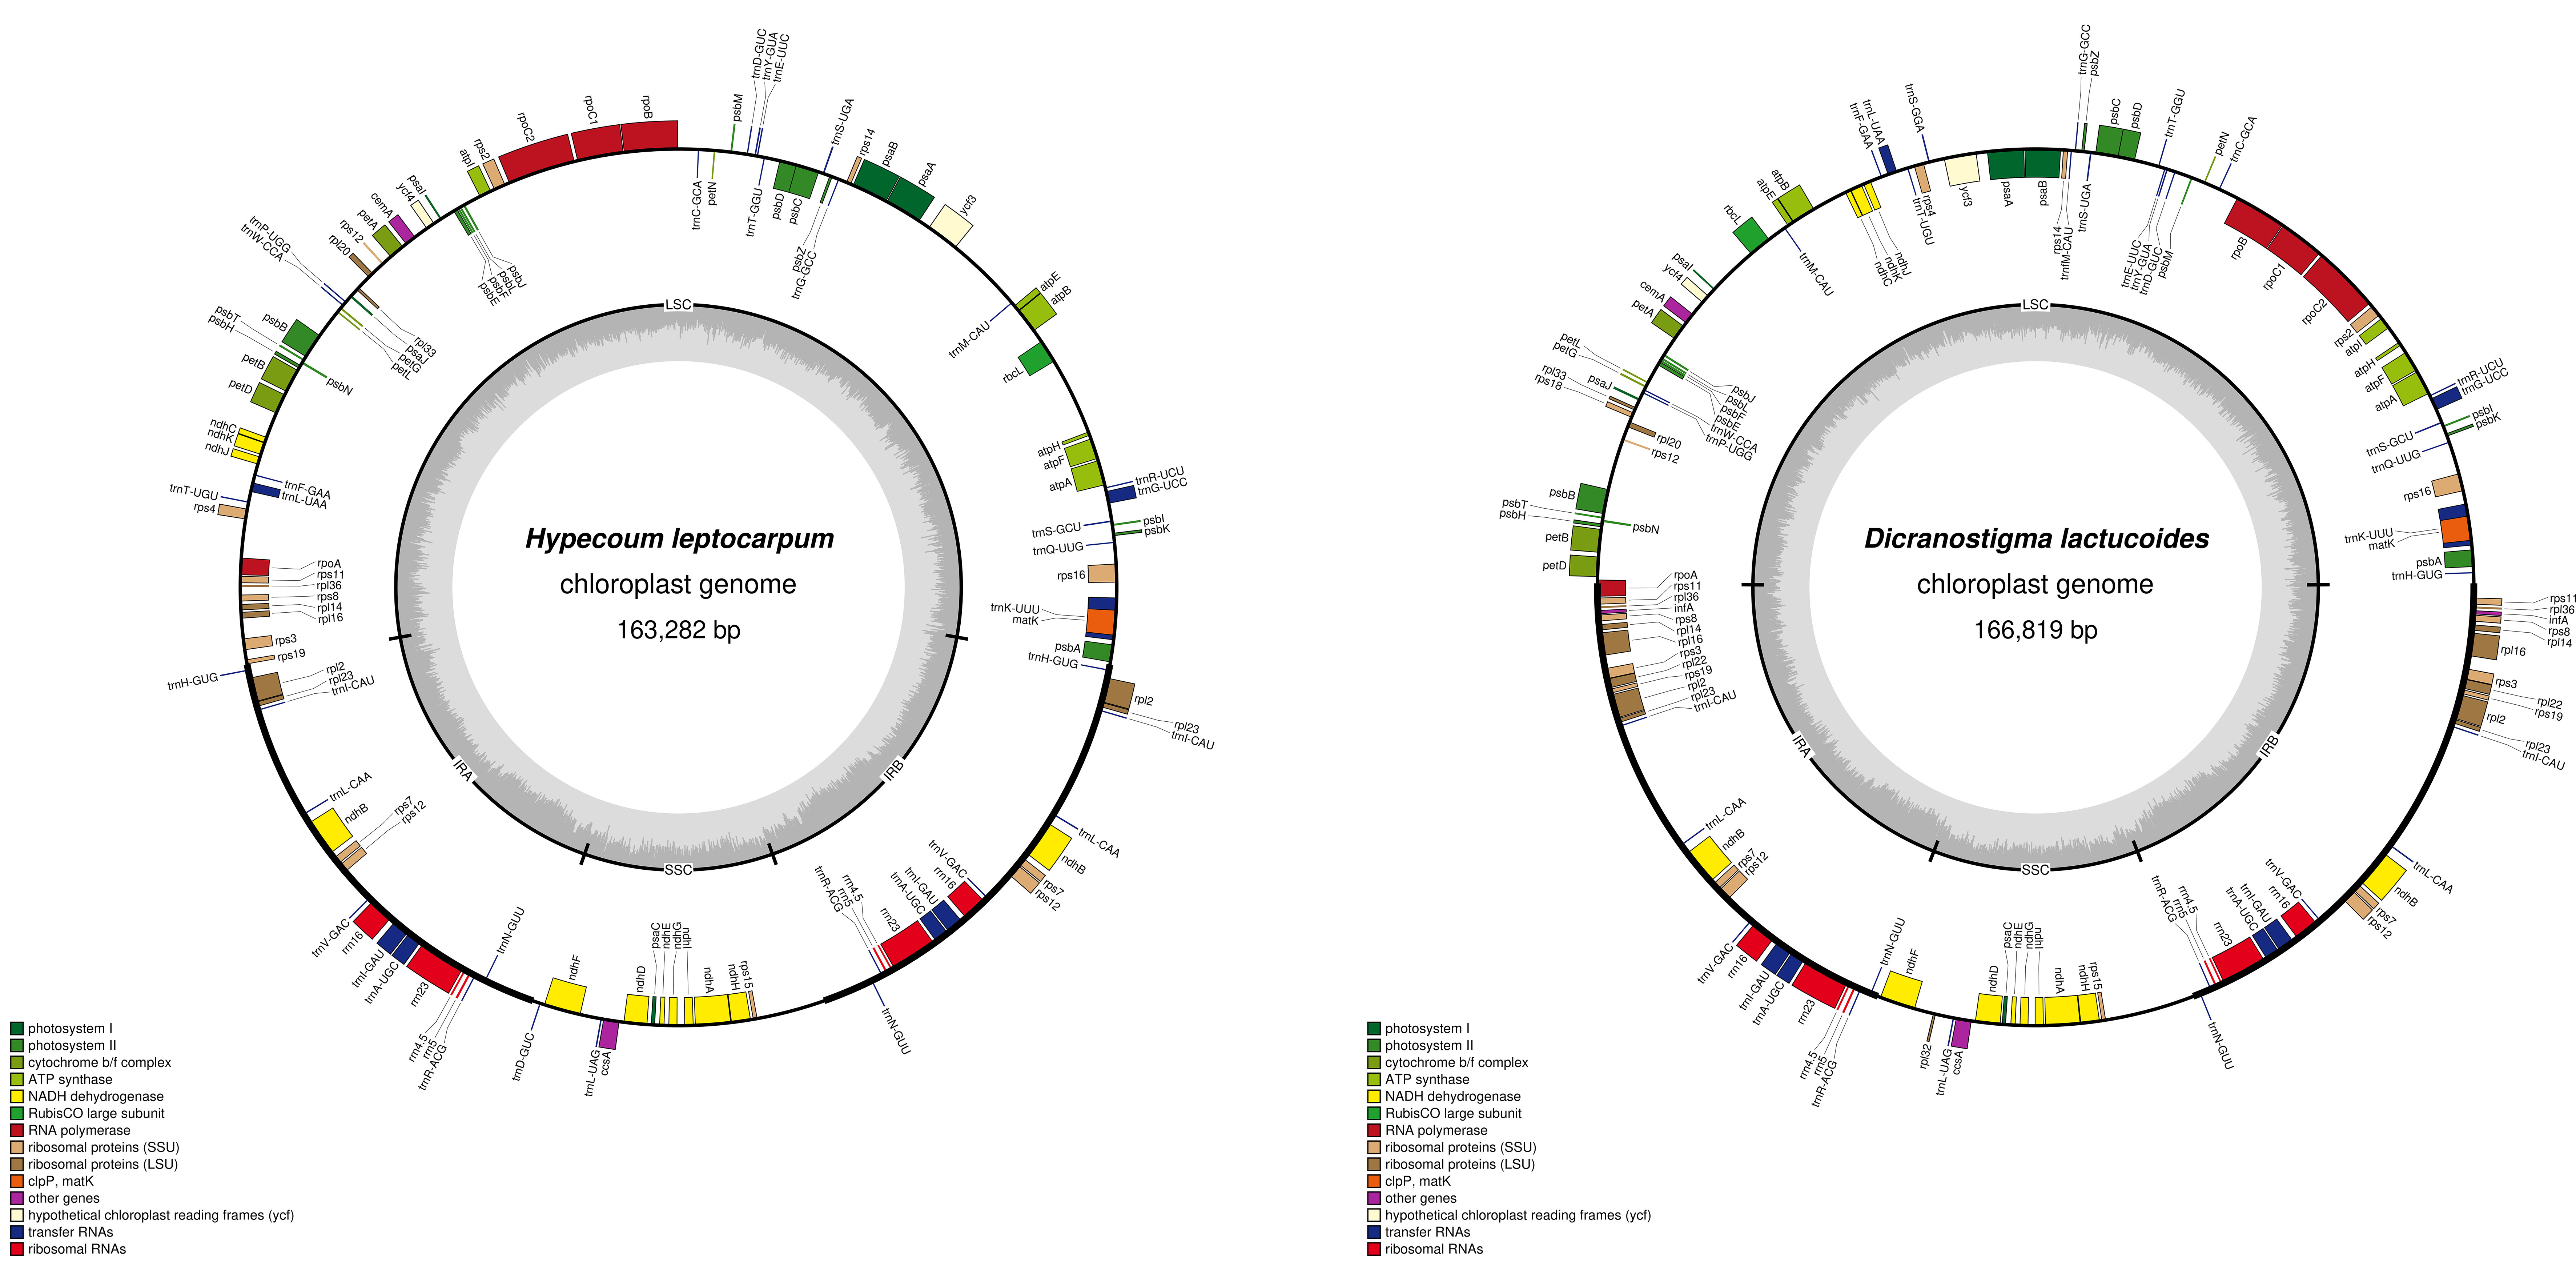 Fig. 2.
Plastome structure of D. lactucoides and H. leptocarpum. Note: The thick black line indicates that the two reverse repeat regions IRa and IRb will be the large single copy region (LSC), the small single copy region (SSC) separated; dark part of inner circle indicates GC content.
| Species | Size | Length (LSC) | Length (SSC) | Length (IR) | GC% | PCGs | tRNAs | rRNAs | Genes |
| D. lactucoides | 166,819 | 82,927 | 19,538 | 32,177 | 39.23 | 89 | 36 | 8 | 133 |
| H. leptocarpum | 163,282 | 90,852 | 17,600 | 27,415 | 38.57 | 76 | 36 | 8 | 120 |
For D. lactucoides, we annotated 133 genes (Table 4), containing 89 protein- coding genes (PCGs), 36 tRNA, and 8 rRNA genes. Among the 89 PCGs,14 (ndhB, rpl2, rpl14, rpl16, rpl22, rpl23, rpl36, rps3, rps7, rps8, rps11, rps12, rps19, and infA) were double-copy genes. Similarly, seven tRNA genes (trnA-UGC, trnI-CAU, trnA-GAU, trnL-CAA, trnN-GUU, trnR-ACG, and trnV-GAC) and four rRNA genes (rrn4.5, rrn5, rrn6, and rrn23) had double copies. For H. leptocarpum, we annotated 120 genes containing 76 PCGs, 36 tRNA, and 8 rRNA genes. Five PCGs (ndhB, rpl2, rpl23, rps7, and rps12), nine tRNA genes (trnA-UGC, trnD-GUC, trnH-CUG, trnI-CAU, trnI-GAU, trnL-CAA, trnN-GUU, trnR-ACG, and trnV-GAC), and four rRNA genes (rrn4.5, rrn5, rrn6, and rrn23) had double copies. D. lactucoides and H. leptocarpum had 14 identical genes containing one intron and 2 identical genes containing two introns. However, D. lactucoides had 13 more genes than H. leptocarpum, with rpl16 containing one intron. rpl22, rpl32, rpl18, infA, trnS-GGA, and trnfM-CAU were unique genes.
| Gene function classification | Gene type | Gene name |
| Photosynthetic | Optical System I | psaA, psaB, psaC, psaI, psaJ |
| Optical Systems II | psbA, psbB, psbC, psbD, psbE, psbF, psbH, psbI, psbJ | |
| psbK, psbL, psbM, psbN, psbT, psbZ | ||
| NADH-dehydrogenase subunit | ndhA*, ndhB*(×2), ndhC, ndhD, ndhE, ndhF, ndhG | |
| ndhH, ndhI, ndhJ, ndhK | ||
| Cytochrome b/f complex | petA, petB*, petD*, petG, petL, petN | |
| ATP synthase | atpA, atpB, atpE, atpF*, atpH, atpI | |
| Ribulose diphosphate carboxylase large subunit | rbcL | |
| Self-replication | Ribosomal large subunit (LSU) | rpl14(×2), rpl16*(×2), rpl2*(×2), rpl20 |
| rpl22(×2) | ||
| Small subunit of ribosome (SSU) | rps11(×2), rps12**(×2), rps14, rps15, rps16*, rps18 | |
| rps19(×2), rps2, rps3(×2), rps4, rps7(×2), rps8(×2) | ||
| RNA polymerase subunits | rpoA, rpoB, rpoC1*, rpoC2 | |
| Ribosomal RNA genes | rrn16(×2), rrn23(×2), rrn4.5(×2), rrn5(×2) | |
| Transfer of RNA genes | trnA-UGC*(×2), trnC-GCA, trnD-GUC, trnE-UUC | |
| trnF-GAA, trnG-GCC, trnG-UCC*, trnH-GUG, trnI-CAU(×2), trnI-GAU*(×2), trnK-UUU*, trnL-CAA(×2), trnL-UAA*, trnL-UAG, trnM-CAU, trnN-GUUU(×2) | ||
| trnP-UGG, trnQ-UUG, trnR-ACG(×2), trnR-UCU | ||
| trnS-GCU, trnS-GGA | ||
| trnV-GAC(×2), trnW-CCA, trnY-GUA, trnfM-CAU | ||
| Transcription initiation factor | infA(×2) | |
| Other genes | Mature enzymes | matK |
| Periplasmic proteins | cemA | |
| Cytochrome C synthesis genes | ccsA | |
| Hypothetical conserved chloroplast open reading frame | ycf3**, ycf4 |
Note: The parentheses stand for multi–copy genes; * and ** refer to genes containing 1 intron and 2 introns, respectively; # represents the specific gene of D. lactucoides.
We identified 72 simple repeat sequences (SSRs) from D. lactucoides (Fig. 3), of which 43 were single nucleotide, 14 were dinucleotide, 5 were trinucleotide, 7 were tetranucleotide, and 3 were hexanucleotide sequences. The SSR sequences were mostly distributed in the LSC region (49), followed by the SSC region (11), and the IRa and IRb regions which both had 6. H. leptocarpum had 43 SSRs, which contained 16 single nucleotides, 12 dinucleotide, 6 trinucleotide, and 9 tetranucleotide sequences. The distribution pattern was similar to that of D. lactucoides, with 24 SSRs located in the LCS, 7 in the SSC, 12 in the IRa and IRb regions (six each). Among the single nucleotide sequences, the A/T repeats were predominant. Thus, SSRs were widely distributed in the plastomes and are important for molecular marker development, which could aid hybrid breeding and variety identification in Papaveraceae plants [26].
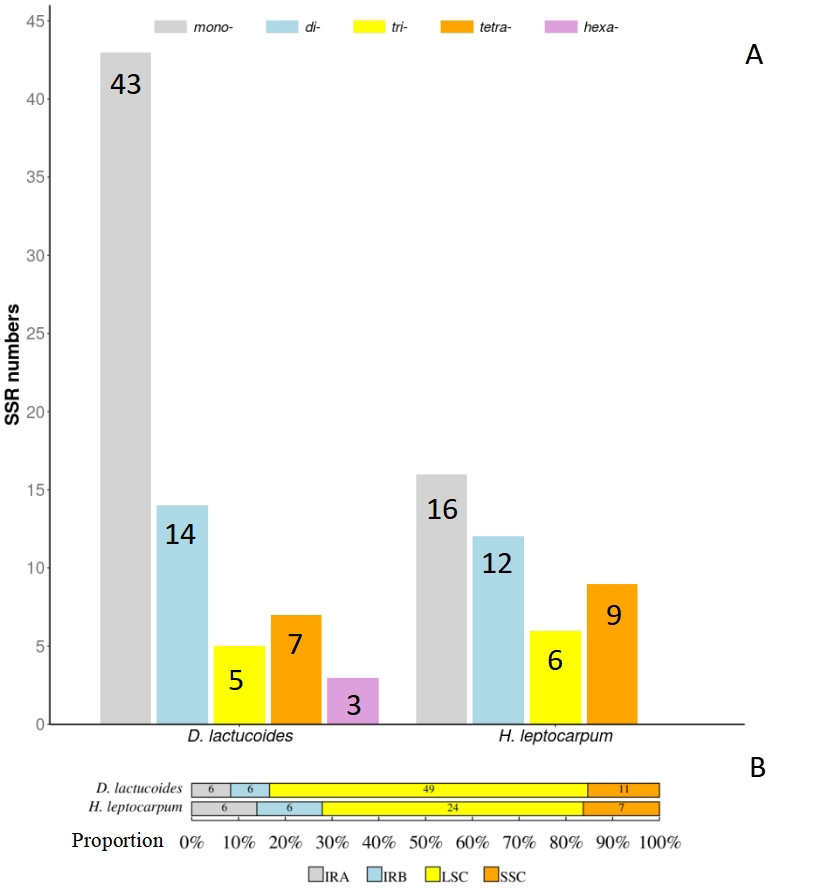 Fig. 3.
Type and number of SSRs in the plastomes of D. lactucoides and H. leptocarpum (A); Number of SSRs in the LSC, SSC and IR regions (B). SSRs, simple repeat sequences.
The tandem repeat sequence analysis showed 258 and 91 long repeats in D. lactucoides and H. leptocarpum, respectively, including forward, palindromic, reverse, and complementary sequences (Fig. 4). These long repetitive sequences can be used to study the evolutionary history of species [27].
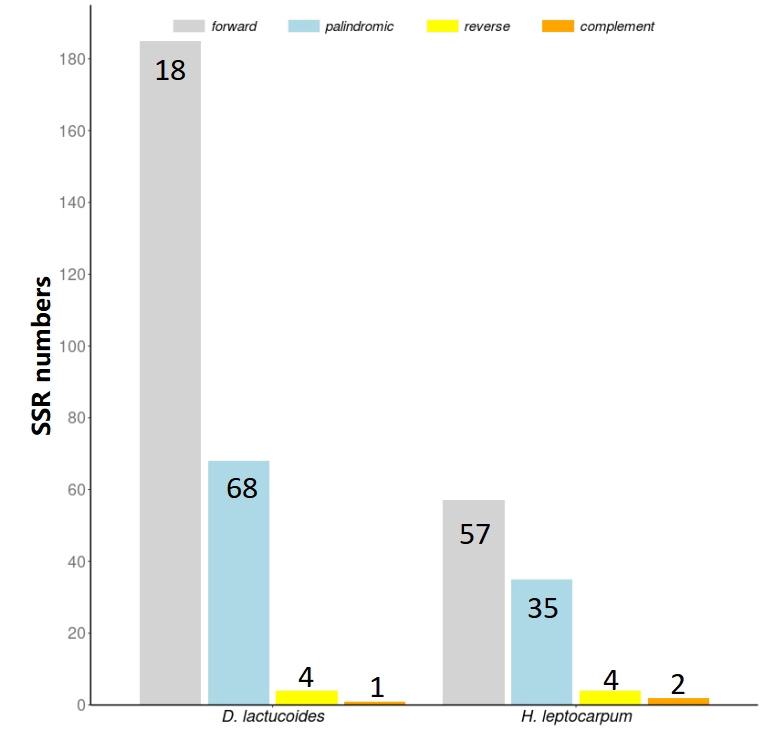 Fig. 4.
Analysis of long repeat sequences of plastomes of D. lactucoides and H. leptocarpum.
The RSCU value is the ratio of the actual frequency of codon usage to the
desired frequency of use and is often used to measure the codon use preference.
The RSCU value
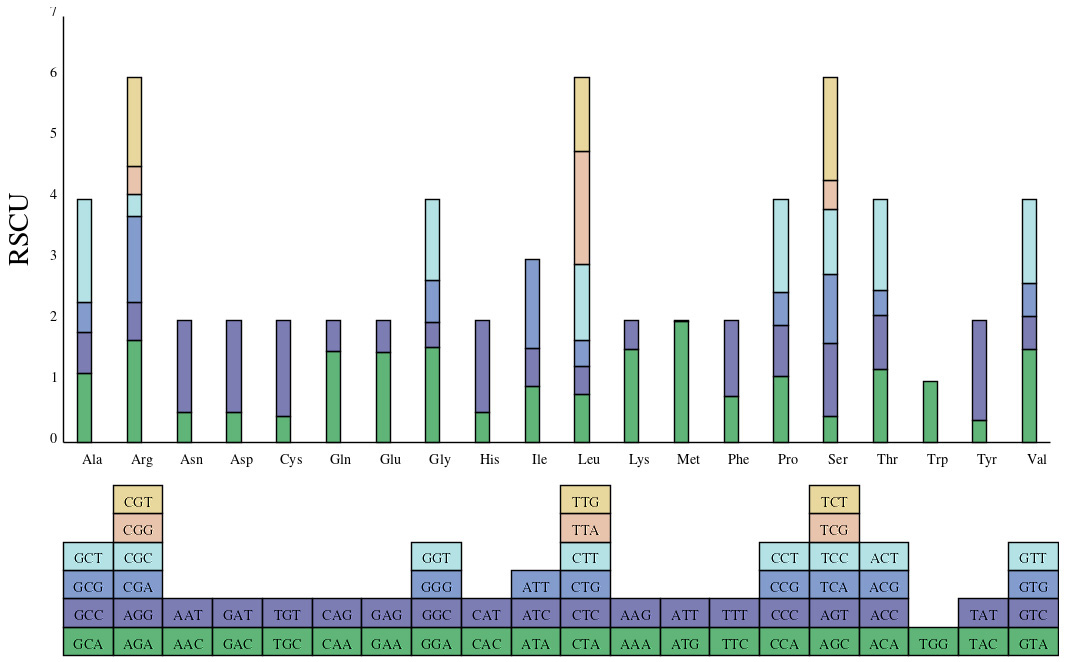 Fig. 5.
Relative use abundance of synonymous codons in chloroplast genomes of D. lactucoides and H. leptocarpum.
Ka/Ks indicates the ratio between heterosense substitution (Ka) and synonymous
substitution (Ks) and is often used to determine whether the coding gene is
subject to selective pressure during evolution; thus, it is important to
determine the Ka/Ks ratio during evolutionary analysis [29]. If Ka/Ks is
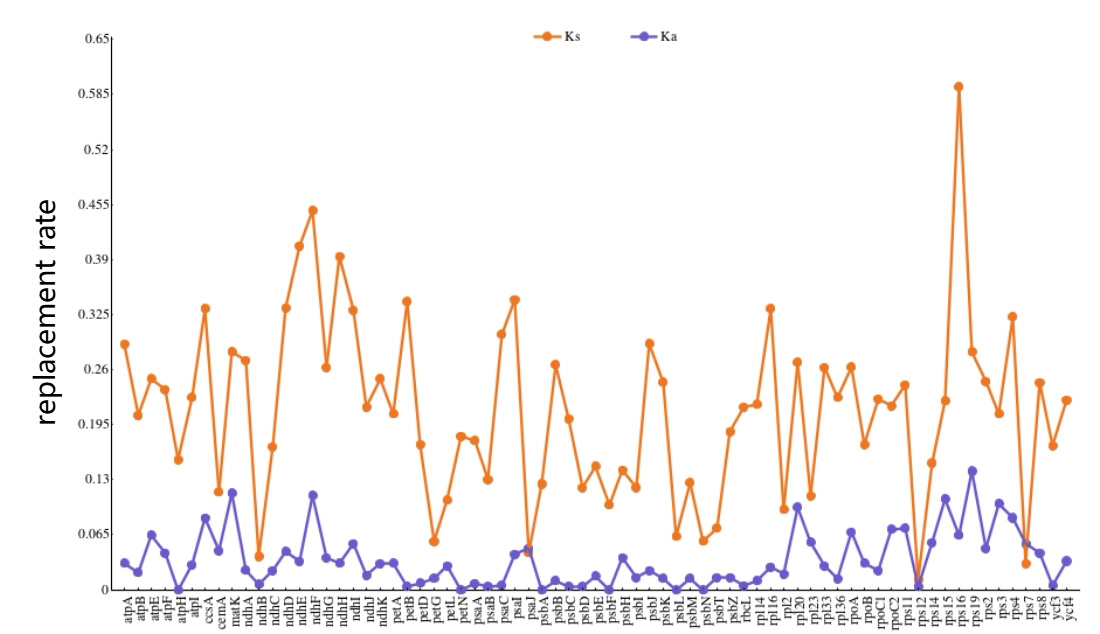 Fig. 6.
Gene selection pressure analysis of plastomes of D. lactucoides and H. leptocarpum.
A total of 828 polymorphic loci were detected in the plastomes of D.
lactucoides and H. leptocarpum (Fig. 7), with nucleotide diversity (Pi)
values ranging from 0 to 0.5096 with a mean value of 0.1947. The IR region was
less variable and more conservative than the LSC and SSC regions in terms of
sequence variation. In addition, there were seven polymorphic loci with Pi values
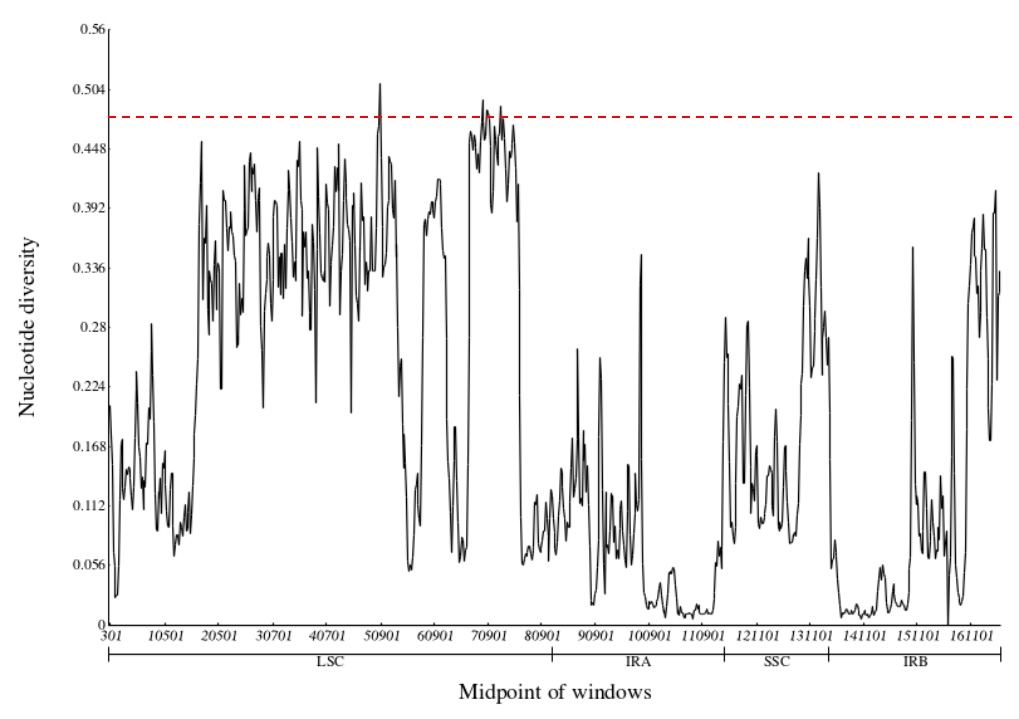 Fig. 7.
Nucleotide diversity analysis of plastomes of D. lactucoides and H. leptocarpum.
The JBL boundary (the boundary between the LCS and IRb regions) of D. lactucoides is located within the rpoA gene (Fig. 8), while that of H. leptocarpum is located between the rsp19 and trnH genes. Moreover, the JSB boundary (the boundary between the IRb and SSC regions) of D. lactucoides is flanked by the trnN and ndhF genes, while that of H. leptocarpum is flanked by the trnN and trnD genes. Overall, the JSA boundary had the least difference variance, while the JLB boundary had the most variance, which may be caused by the expansion or contraction occurring in these regions.
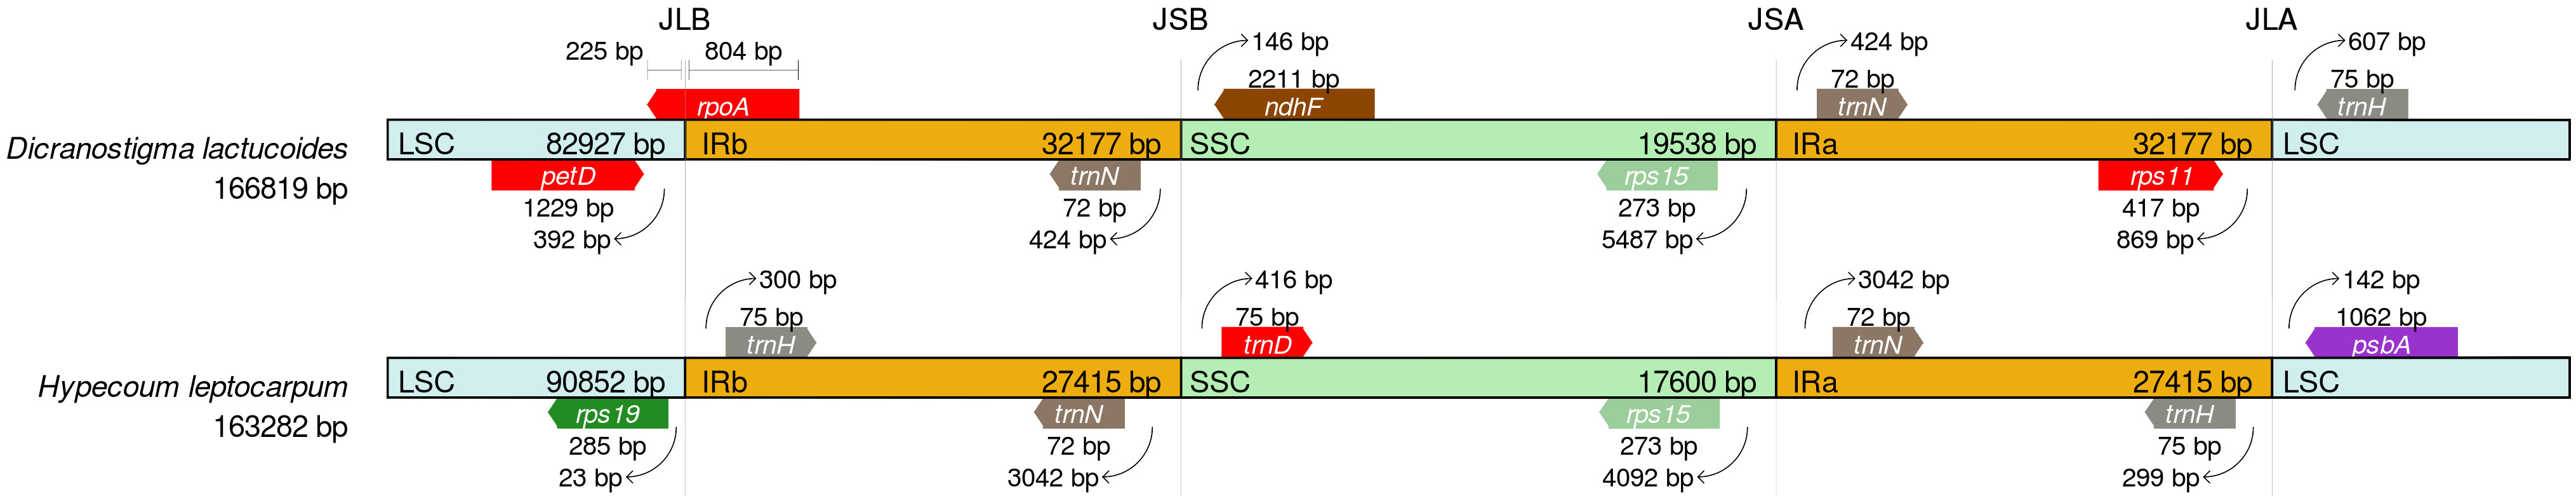 Fig. 8.
Comparative analysis of expansion and contraction of plastome genomic boundary regions (LSC, SSC, IR) in D. lactucoides and H. leptocarpum.
Covariance reveals interlocking homologous genes in the genomes of different species and their order of arrangement in the genetic map. The genetic distance between two species is positively correlated with the degree of covariance [30]. The genomes of different species may have some regions of covariance, which may be interrupted by rearrangements and inversions during evolution, and such phenomena can be detected visually through covariance analysis. As shown in Fig. 9, rearrangements and inversions occurred roughly between 15,000 and 85,000 bp region. The covariance is good at both ends, indicating that the gene homology is higher in this region.
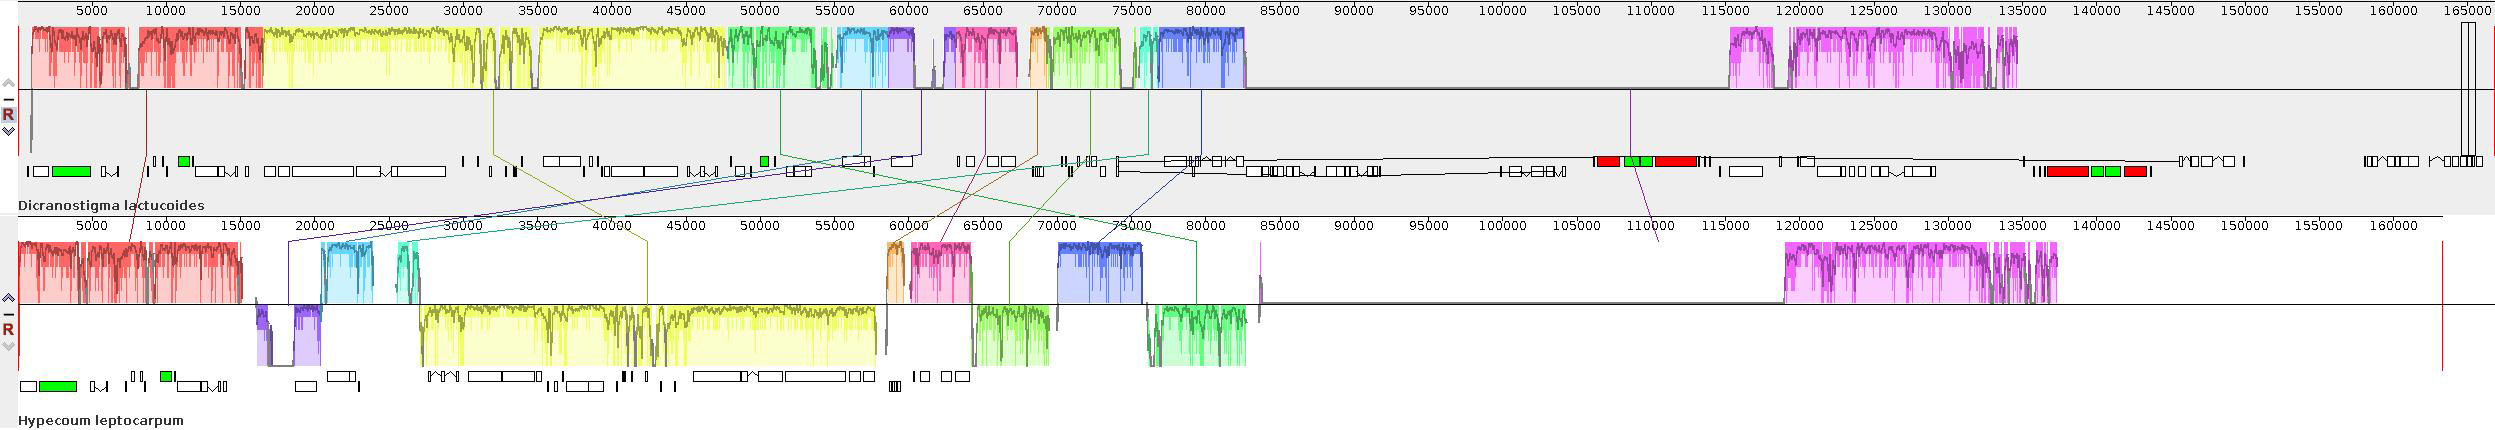 Fig. 9.
Covariance analysis of plastomes of D. lactucoides and H. leptocarpum. Note: Blocks of the same color connected by the same line represent similar gene segments of different species.
In this study, the plastomes of D. lactucoides and H. leptocarpum (obtained by sequencing) and 12 other published species of Papaveraceae were used to construct a maximum likelihood (ML) phylogenetic tree (Fig. 10), with the plastomes of C. majus as an outgroup. The results showed that the self-extension values of all branch nodes were greater than 70%, indicating the reliability of the constructed developmental tree. All species originated from seven genera, and species of the same genus clustered together. The Hylomecon japonica and the genus Coreanomecon hylomeconoides clustered as the first major branch, located at the base of the phylogenetic tree. The second major branch included four species of the genus Corydalis (C. saxicola, C. tomentella, C. conspersa, and C. bungeana), one species of Hypecoum (H. leptocarpum), three species of Papaver, (P. somniferum, P. rhoeas, and P. orientale), two species of Meconopsis (M. punicea and M. henrici), and one species of Dicranostigma (D. lactucoides). In the second major branch, the genus Dicranostigma clustered separately as a single group, and the remaining four genera clustered into a large group, within which Meconopsis and Papaver diverged into a separate group from that of Hypecoum and Corydalis. Thus, the genus Meconopsis is closely related to Papaver, while Hypecoum is closely related to Corydalis. The results of this study are consistent with the taxonomic results reported by Ma Wenming [31].
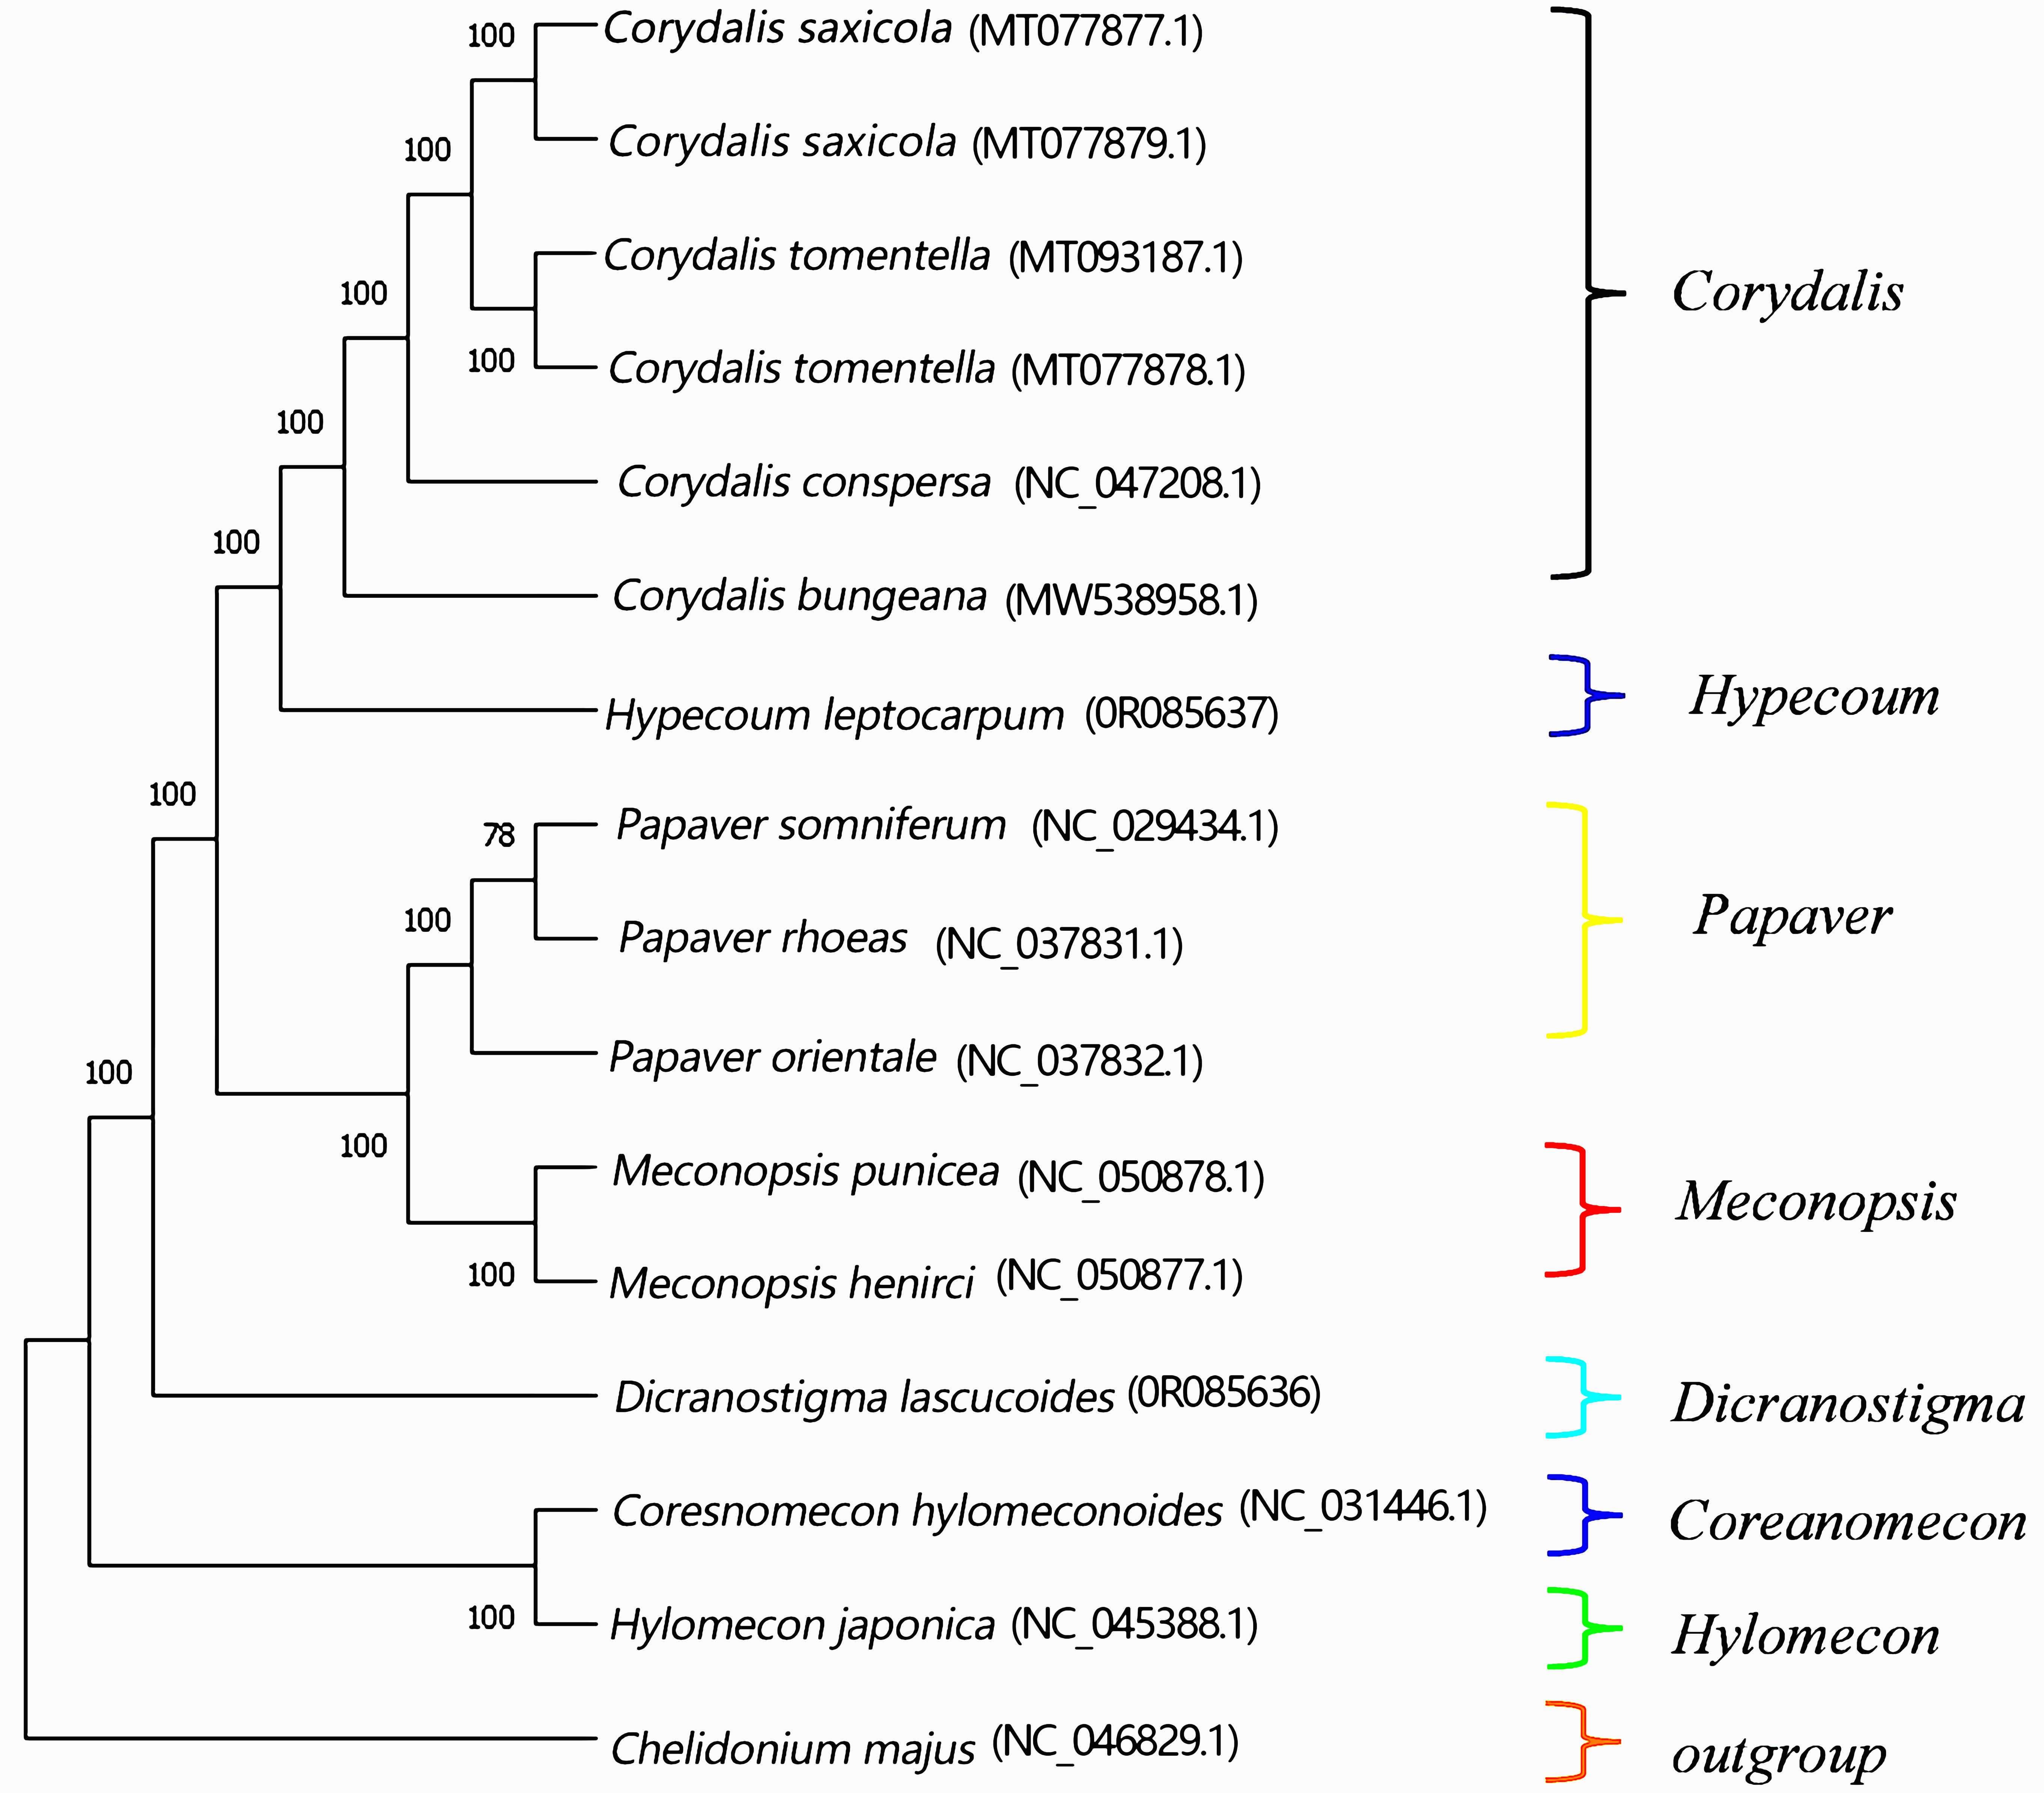 Fig. 10.
Phylogenetic tree of plastomes of 14 species in Papaveraceae. Note: The parameter is, model = GTR+G, method = maximum likelihood, bootstrap = 10,000.
This study sequenced, assembled, and annotated the plastomes of the Tibetan D. lactucoides and H. leptocarpum for the first time. The results showed that the structure (tetrad structure), length (166,819 bp for D. lactucoides and 163,282 bp for H. leptocarpum), and GC content (39.23% for D. lactucoides and 38.57%, H. leptocarpum) of these two species were similar to those of other reported Papaveraceae speecies [32, 33]. The annotation of D. lactucoides and H. leptocarpum plastomes yielded 133 and 120 functional genes, respectively. The comparison revealed that H. leptocarpum was missing two rpl22 and infA genes, one rpl14, rpl16, rpl32, rpl36, rps3, rps8, rps11, rps18, rps19, trnS-GGA, and trnfM-CAU genes, and one trnD-GUC and trnH-GUG genes. Loss of the infA gene, encoding a translation initiation factor and regulates protein translation, occurred in H. leptocarpum. A high loss frequency of the infA gene was also repoeted in several angiosperms [34]. Since the morphological characteristics of D. lactucoides and H. leptocarpum are relatively similar, the existing methods could not distinguish them; thus, the variation analysis of the plastomes and gene loss may supplement their identification methods.
Simple repeat sequences (SSRs) are widely present in plant plastomes but vary in number and fragment length in different species; thus, they can be used to distinguish different species due to their high specificity [35]. Long repetitive sequences can influence gene expression and play an important role in biological evolution [36]. We identified 72 and 43 SSR loci in the genomes of D. lactucoides and H. leptocarpum, respectively, including single, dinucleotide, trinucleotide, tetranucleotide, and hexanucleotide sequences. In addition, 258 and 98 long repeat sequences were detected in D. lactucoides and H. leptocarpum, respectively, including forward, palindrome, reverse, and complementary sequences. These SSR loci and long repeat sequences provide candidate molecular markers for species identification in the family Papaveraceae.
Codon preference helps to study the evolution and environmental adaptations of
different species [37]. In this study, we found that the preference for codons
ending in A/U and the weak codon numbering in the plastomes of chicory leaf
vulture flower and fine-fruited hornbeam fennel were consistent with most of the
species previously reported [38, 39]. Natural selection pressures cause
differences in base composition at the three positions of synonymous codons in
the protein-coding sequences of organisms, and changes in the third base of the
codon usually do not alter the coding amino acids [40]. The results of the
present study indicate that the codon preferences of the plastomes of D.
lactucoides and H. leptocarpum wrer mainly affected by selection,
similar to previous studies on related plants such as Rabdosia rubescens
[41]. In this study, seven variant loci with high nucleotide polymorphism (Pi
The contraction and expansion of IR regions during biological evolution can lead to variations in plastomes, and analyzing the IR region boundaries of the plastomes can reveal the direction of biological evolution [42]. Previous studies found that the IR/SSC boundary is relatively conserved in early-differentiated dicotyledons, whereas the frequency of the IR/LSC boundary variation is higher [43], consistent with the present study. In this study, we found that the genes on both sides of the SSC/IRa boundaries were identical in D. lactucoides and H. leptocarpum, while the boundary genes of LSC/IRb, SSC/IRb, and LSC/IRa differed significantly. These differences could provide new insights for identifying Papaveraceae species.
In this study, we constructed an ML phylogenetic tree using the plastomes of D. lactucoides, H. leptocarpum, and 13 other reported relatives, using C. majus as the outgroup. The tree had two main branches, one with five genera, including Hypecoum, Corydalis, Papaver, Meconopsis, and Dicranostigma, and the other containing two genera, Coreanomecon and Hylomecon, with 100% support values. Genera Corydalis and Hypecoum are more closely related, and the genera Papaver and Meconopsis are sister branches of the same clade.
In conclusion, the phylogenetic relationships among Papaveraceae genera obtained in this study using the plastomes of 16 poppy families are relatively accurate and reliable. However, additional plastomes of Papaveraceae plants need to be sequenced and annotated, and further phylogenetic studies of Papaveraceae plants should incorporate various data types, such as plant morphological characteristics and nuclear genomic and transcriptomic data.
The plastome genomic data obtained in this study can provide a basis for genetic diversity studies of D. lactucoides and H. leptocarpum and molecular identification of the Papaveraceae genus.
The datasets usedand/or analysedduring the current study are available from the first author upon reasonable request. Raw data for the plastomes sequencing can be accessed by logging on to the website https://www.ncbi.nlm.nih.gov/.
DW: Conceptualization, Methodology, Software, Investigation, Formal Analysis, Writing Original Draft; QQ: Data Curation, Writing Original Draft; XW: Designed the research study and provided help and advice on paper writing; YN: Visualization, Investigation; SZ and ZM: Conceptualization, Funding Acquisition, Resources, Supervision, Writing Review & Editing. All authors read and approved the final manuscript. All authors contributed to editorial changes in the manuscript. All authors have participated sufficiently in the work and agreed to be accountable for all aspects of the work.
The plant materials of 2 species of the Papaveraceae in this study were collected from the Tibet Autonomous Region of China (Tibet) and identified by Pro-fessor Guoyue Zhong of Jiangxi University of Chinese Medicine (JUTCM). The certificate specimens were all stored in the herbarium of JUTCM.
Not applicable.
This research was funded by the Jiangxi University of Chinese Medicine Science and Technology Innovation Team Development Program (GrantCXTD22002).
The authors declare no conflict of interest.
Publisher’s Note: IMR Press stays neutral with regard to jurisdictional claims in published maps and institutional affiliations.