
- Academic Editor
†These authors contributed equally.
Background: Ankylosing spondylitis (AS) is a chronic inflammatory
autoimmune disease that affects axial joints such as the spine. Early diagnosis
is essential to improve treatment outcomes. The purpose of this study is to
uncover underlying genetic diagnostic features of AS. Methods: We
downloaded gene expression data from the Gene Expression Omnibus (GEO) database
for three studies of groups of healthy and AS samples. After preprocessing and
normalizing the data, we employed linear models to identify significant
differentially expressed genes (DEGs) and further integrated the differential
genes to acquire reliable differential transcriptional markers. Gene functional
enrichment analysis was conducted to obtain enriched pathways and regulatory gene
interactions were extracted from pathways to further elucidate pathway networks.
Seventy-three reliably differentially expressed genes (DEGs) were integrated by
differential analysis. Utilizing the regulatory relationships of the 21 Kyoto
Encyclopedia of Genes and Genomes (KEGG) Pathway genes that were enriched in the
analysis, a regulatory network of 622 genes was constructed and its topological
properties were further analyzed. Results: Functional enrichment
analysis found 73 DEGs that were strongly associated with immune pathways like
Th17, Th1 and Th2 cell differentiation. Using KEGG combined with DEGs, six hub
genes (KLRD1, HLA-DRB3, HLA-DRB5, IL2R
Ankylosing spondylitis (AS) is a chronic inflammatory disease mediated by immunity that primarily impacts the axial joints like the spine [1]. AS can lead to severe stiffness, back pain and the formation of new bone, often resulting in progressive joint stiffness that decreases the quality of life [2]. Although the current evaluation of the disease state of AS measures disease activity, its progression and prognosis remain difficult to predict [3]. Furthermore, the potential molecular processes that promote AS progression remain largely unclear. Consequently, it is urgent to investigate the AS pathogenesis.
The rapid development of high-throughput transcriptomic profiling has made available massive repositories of data, enhancing efforts to improve the diagnosis of target diseases. In the past decade, several studies have used gene chips to determine candidate genes associated with AS [4, 5, 6, 7] focusing on a single data set of samples. Specifically, Pimentel-Santo et al. [4] reported a group of differentially expressed genes (DEGs) highly correlated with AS that also modulate the joint destruction and inflammatory process. Similarly, Zhao et al. [7] utilized a bioinformatics approach to predict genes related to AS, including MRPL22, RPL17, PSMA4 and PSMA6. However, to date, most studies evaluating AS genetics have been concerned with individual genes or individual pathways, and multi-dataset integration analysis and multi-gene joint diagnosis are often overlooked.
A pathway contains a large amount of information about the interaction between genes and the synergy among them. Abnormality in some genes may lead to changes in other genes in the same pathway. As a result, establishing a pathway network and mining for disease markers has been an effective method in disease research.
This study integrates multi-platform high-throughput expression profiling data to (1) study altered gene expression patterns between AS and healthy women, (2) pre-screen diagnostic markers for AS, and (3) analyze these genes for their functions. These AS candidate biomarkers were further investigated by building Kyoto Encyclopedia of Genes and Genomes (KEGG) pathway networks and an AS diagnostic classifier was established to assist clinical diagnosis.
Our method consisted of the following steps: collection of data, standardization, differential gene integration analysis, enrichment analysis, pathway integration analysis, pathway network construction, feature selection, and the construction and verification of the classifier. Fig. 1 summarizes the workflow.
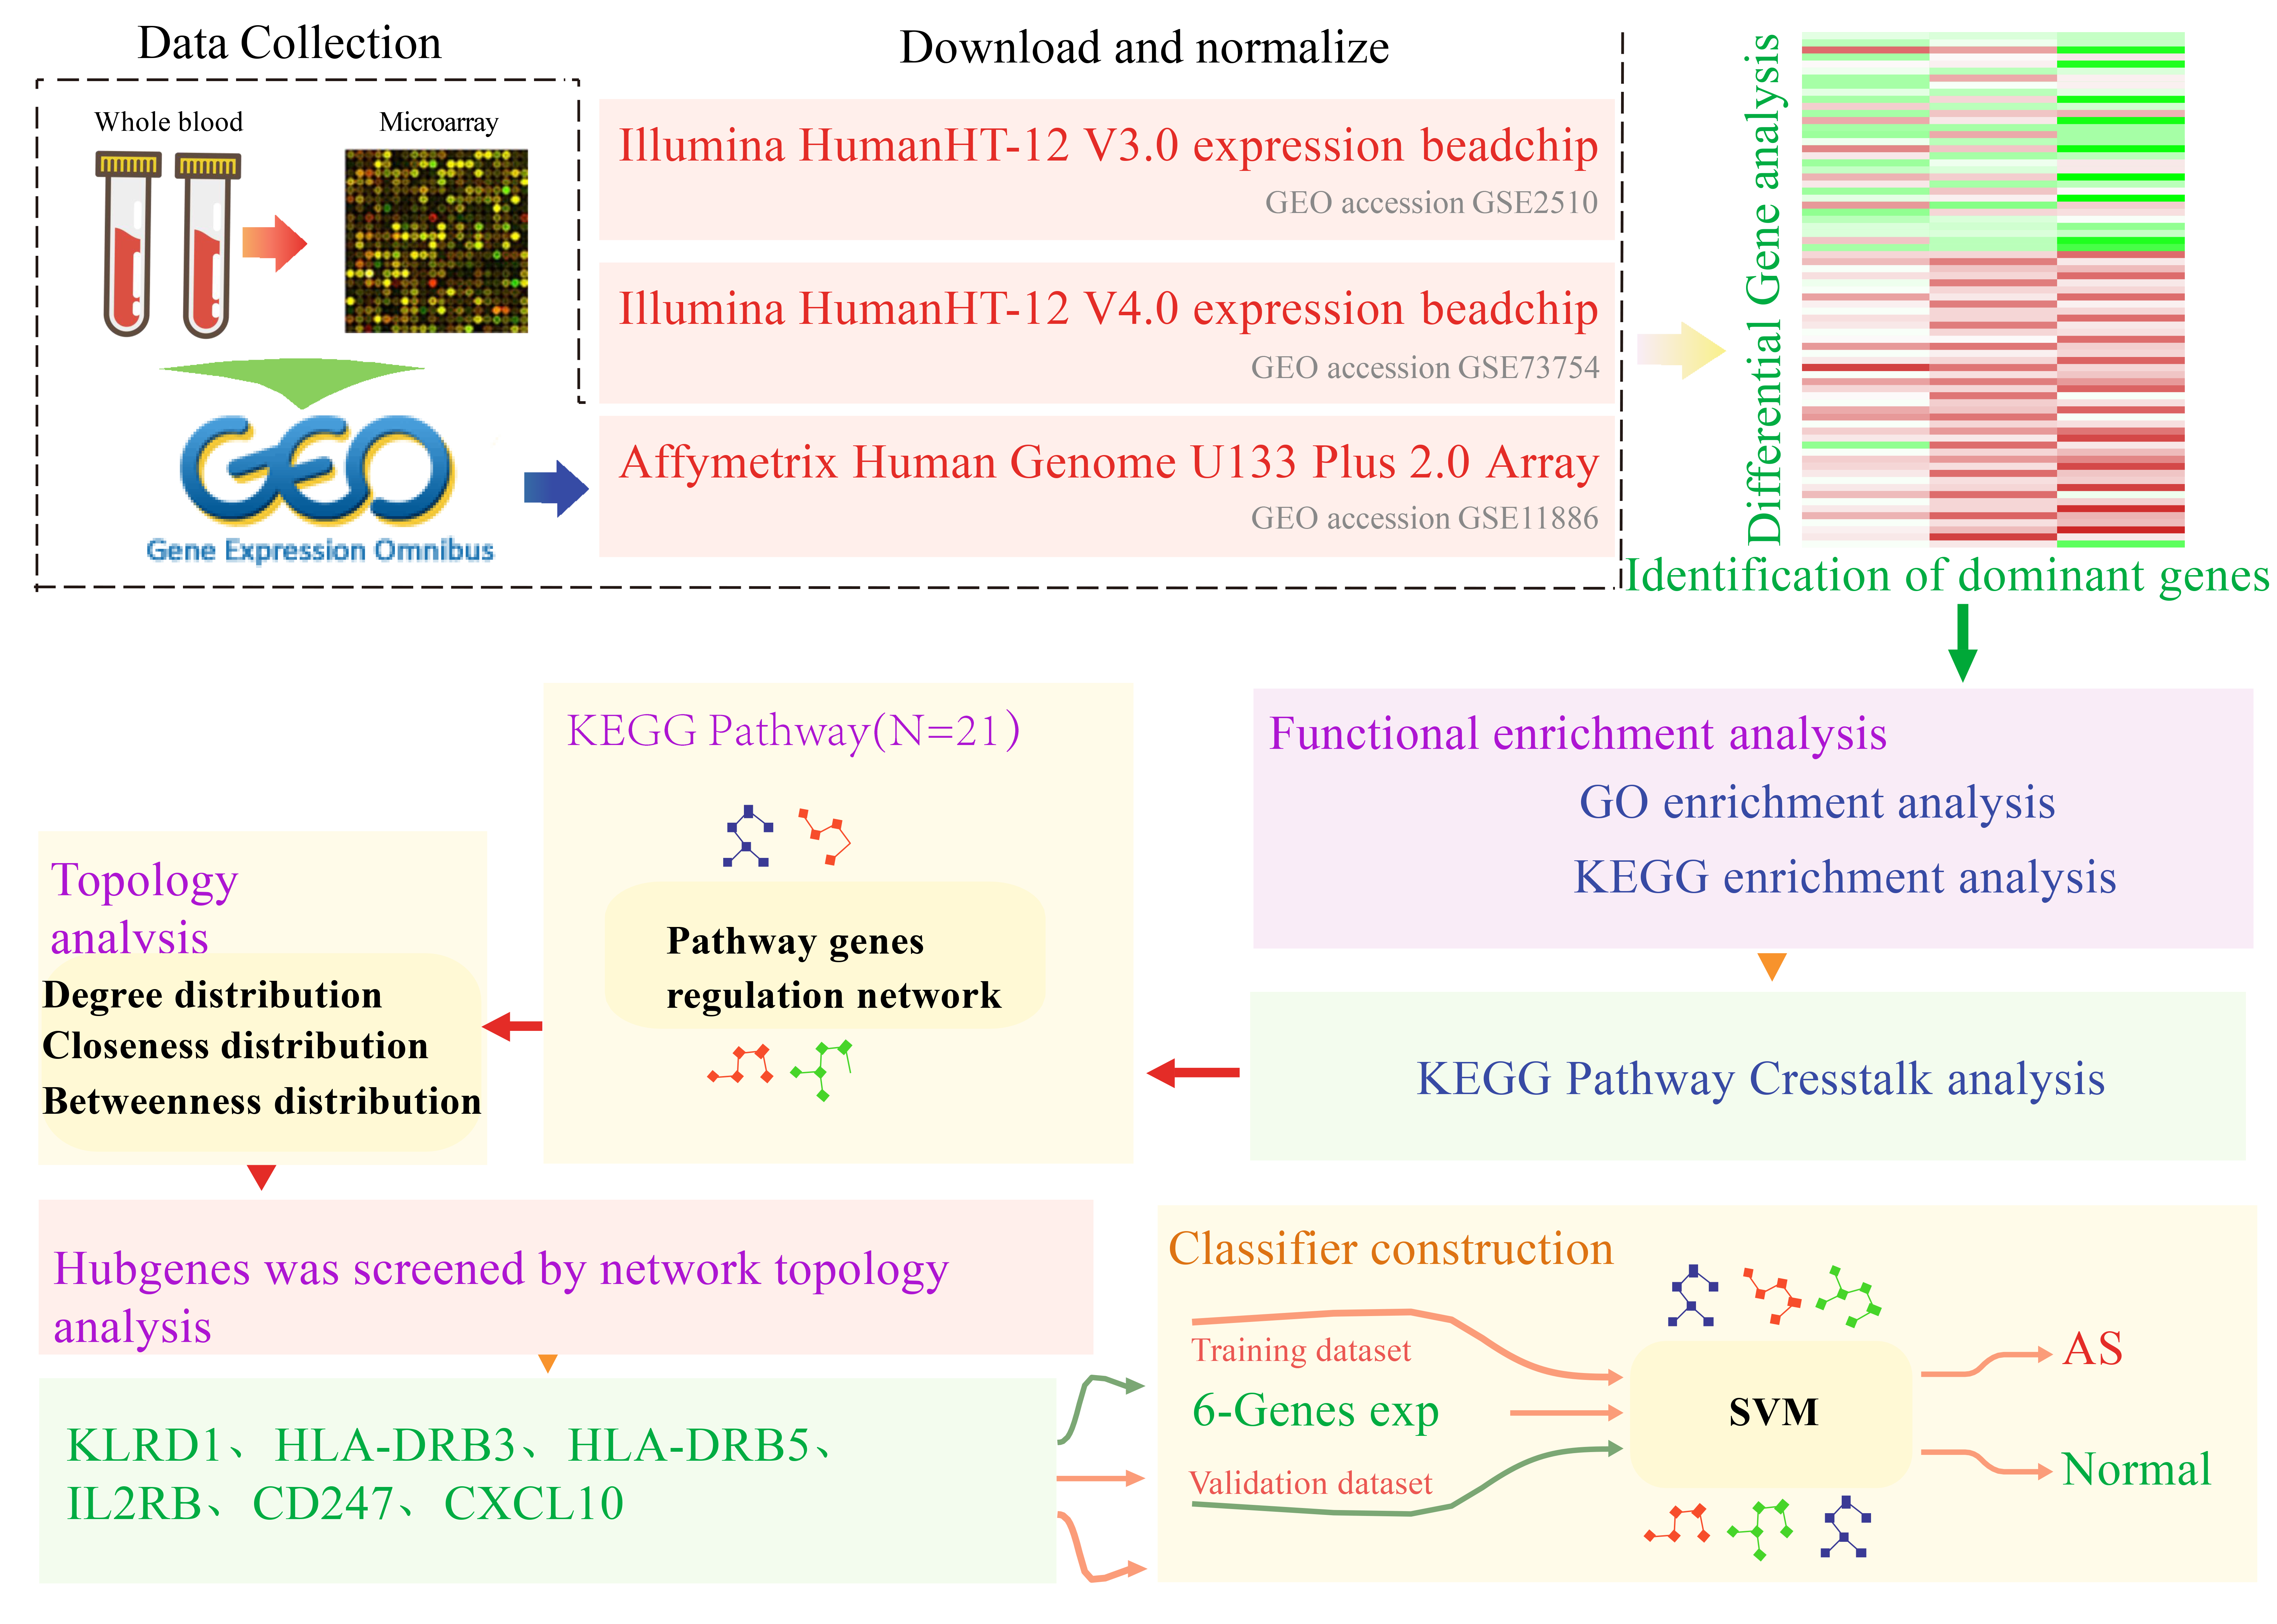 Fig. 1.
Workflow chart. GO, Gene Ontology; KEGG, Kyoto Encyclopedia of Genes and Genomes; SVM, Support Vector Machine; GEO, Gene Expression Omnibus; AS, Ankylosing spondylitis.
We searched the Gene Expression Omnibus (GEO) database for studies on patients with AS and expression profiles from human blood samples were obtained. Three studies were identified and from them a dataset created of 76 cases and 45 healthy controls. Details are in Table 1.
| Study | GEO accession | Sample size | Sample source | Platform | |
| AS case | Control | ||||
| 1 | GSE2510 | 16 | 16 | Blood | GPL6947 Illumina HumanHT-12 V3.0 expression BeadChip |
| 2 | GSE73754 | 52 | 20 | Blood | GPL10558 Illumina HumanHT-12 V4.0 expression BeadChip |
| 3 | GSE11886 | 8 | 9 | Blood | GPL570 Affymetrix Human Genome U133 Plus 2.0 Array |
For the two sets of gene expression data from the Illumina platform (http://www.ncbi.nlm.nih.gov/geo/), we downloaded the expression data after quantile normalization. Since there is no quantile normalization available for the GSE11886 dataset (http://www.ncbi.nlm.nih.gov/geo/), we downloaded the raw data and processed the data using the R package affy (version 4.2.0) [8] to acquire the probe expression profiles, which were further normalized using the RMA approach [9]. The result was an expression matrix of 54,675 gene probes for the 17 samples. The probes were annotated with R package hgu133plus2.db; probes matching multiple genes were deleted, and where multiple probes were matched to one gene, the median of the probes was used as the gene expression value. Subsequently, 23,313 gene expression profiles were acquired.
The R software package limma [10] was used to log
R package clusterProfiler [14] was exploited for analyzing KEGG and Gene Ontology (GO) pathway enrichment to determine GO terms that appeared disproportionately in three categories (cellular component, molecular function, and biological processes). KEGG pathways were also analyzed by visualization with R package DOSE [15]. In both analyses, q-values (adjusted p-values for multiple tests) less than 0.05 indicate statistical significance.
We downloaded the XML file of each KEGG pathway that was enriched in the DEGs from the KEGG website [16]. The R package XML was employed to extract entries, relationships, and group relationships from these XML files. The information on gene interactions was subsequently extracted with a combination of scripts to build the KEGG gene interaction network to visualize the network on Cytoscape [17], and examine the topological characteristics of the cytohubba network [18].
Visualization was performed using Cytoscape [17], with the degree and closeness
of the network computed through the use of the Cytoscape [17] plug-in cytohubba
[18]. Genes of degree
A support vector machine (SVM) [19] was used to build a diagnostic predictive model using genes to predict healthy versus AS individuals. As a supervised learning model, SVM uses machine learning algorithms for data analysis and pattern recognition. SVM builds a hyperplane that can be applied to categorization and regression in infinite-dimensional or high-dimensional spaces. A group of training samples, each labeled as belonging to one of two classes is used by the SVM training algorithm to create a model, and new instances are then assigned to a category according to the model, thereby making it a non-probabilistic binary linear categorization. The three datasets were categorized into two validation datasets and one training dataset. The model was built with the training dataset, and its classification capability was confirmed using the 10-fold cross-validation approach. The constructed model was, in turn, used to predict the category of samples in the validation dataset. The model’s predictive power was evaluated using the area under the receiver operating characteristic curve (ROC) curve (AUC), and the model was analyzed for its specificity and sensitivity in predicting AS.
Subjects were AS patients aged between 16 and 61 who were hospitalized in Jishuitan Hospital for the first time. The inclusion criteria were: (1) the diagnosis was in accordance with the New York classification revised in 1984; and (2) patients had not yet received medical treatment, including non-steroidal anti-inflammatory drugs or disease-modifying anti-rheumatic drugs. The exclusion criteria were: (1) individuals with a history of severe infection, surgery, or tumor; (2) Individuals with severe heart, lung, liver, and kidney dysfunction; and (3) individuals with a history of autoimmune diseases such as rheumatoid arthritis. Included in the study was a control group consisting of healthy volunteers between 24 and 60 without acute or chronic diseases, such as rheumatoid arthritis, and no long-term use of any drugs. Table 2 shows the characteristics of the AS patients and healthy control subjects.
| Characteristics | AS patients | Healthy controls | p-value |
| Age (years) | 35.73 |
33.64 |
0.6687 |
| Male (%) | 73% | 64% | 1.000 |
| Weight (kg) | 72.82 |
69.82 |
0.7053 |
| Height (cm) | 167 |
168.7 |
0.5568 |
| BMI (kg/m |
28.09 |
24.45 |
0.2315 |
| Disease duration (years) | 11.7 (1, 20) | __ | __ |
| HLA-B27 (+) | 55% | __ | __ |
Values are presented as mean
Our experiments were in line with the principles of the Declaration of Helsinki and were approved by the ethics committee of Beijing Jishuitan Hospital (ethics code: 201611-03). From all participants, fasting whole blood was collected in sodium heparin-coated tubes (Greiner Bio-one, Chonburi, Thailand) and stored at –80 °C until further analysis. All RNA samples had an A260/A280 ratio between 1.66 and 2.58 and concentrations ranging from 10.9–143 ng/mL and thus met the criteria for gene expression analysis.
Extraction of total RNA from blood samples was implemented with Trizol reagent
(Tiangen Biochemical, Beijing, China) and later extracted RNA was reverse
transcribed to cDNA using FastQuant RT Kit containing gDNase (Tiangen
Biochemical). Amplification was performed on an ABI7500 real-time fluorescence
quantitative PCR instrument utilizing the Power SYBR® Green PCR
Kit (Applied Biosystems, Foster City, CA, USA). Table 3 gives the primer
sequences. The procedure followed was: pre-denaturation 95 °C for 10
min; 95 °C for 15 s; and 60 °C for 60 s for 40 cycles. Three
replicates were employed. Relative expression levels were determined via the
2
| Genes | F/R | Sequences (5 |
| KLRD1 | Forward | CAGGACCCAACATAGAACTCCA |
| Reverse | GGAAATGAAGTAACAGTTGCACC | |
| HLA-DRB3 | Forward | CGGGGTTGGTGAGAGCTTC |
| Reverse | AACCACCTGACTTCAATGCTG | |
| HLA-DRB5 | Forward | CGGGGTTGGTGAGAGCTTC |
| Reverse | AACCACCTGACTTCAATGCTG | |
| IL2RB | Forward | CTGCTTCACCAACCAGGGTTA |
| Reverse | GGGGTCGTAAGTAAAGTACACCT | |
| CD247 | Forward | GCCAGAACCAGCTCTATAACG |
| Reverse | GGCCACGTCTCTTGTCCAA | |
| CXCL10 | Forward | GTGGCATTCAAGGAGTACCTC |
| Reverse | TGATGGCCTTCGATTCTGGATT |
All data are expressed as mean
Gene chip data from three datasets, GSE2510, GSE73754, and GSE1188655, were acquired from the GEO database. Following standardization, the gene expression distribution of each sample appeared similar (Fig. 2A). Genes with differential expression between AS and healthy samples from all three data sets were then further integrated and analyzed using limma. Altogether, 73 DEGs were identified (Supplementary Table 1), with 31 and 42 genes increased in the healthy and AS group, respectively, as indicated by the differential multiple heatmaps in each dataset (Fig. 2B). The enrichment results of the differential multiple GSEA [20] in all data sets were analyzed (Fig. 2C). In each data set, up- and downregulated genes were predominantly enriched in groups with high and low differential multiples, respectively. The only exception was observed for the upregulated genes in data set GSE2510 where they were enriched in the group with lower differential multiplicity, which may be caused by sampling error.
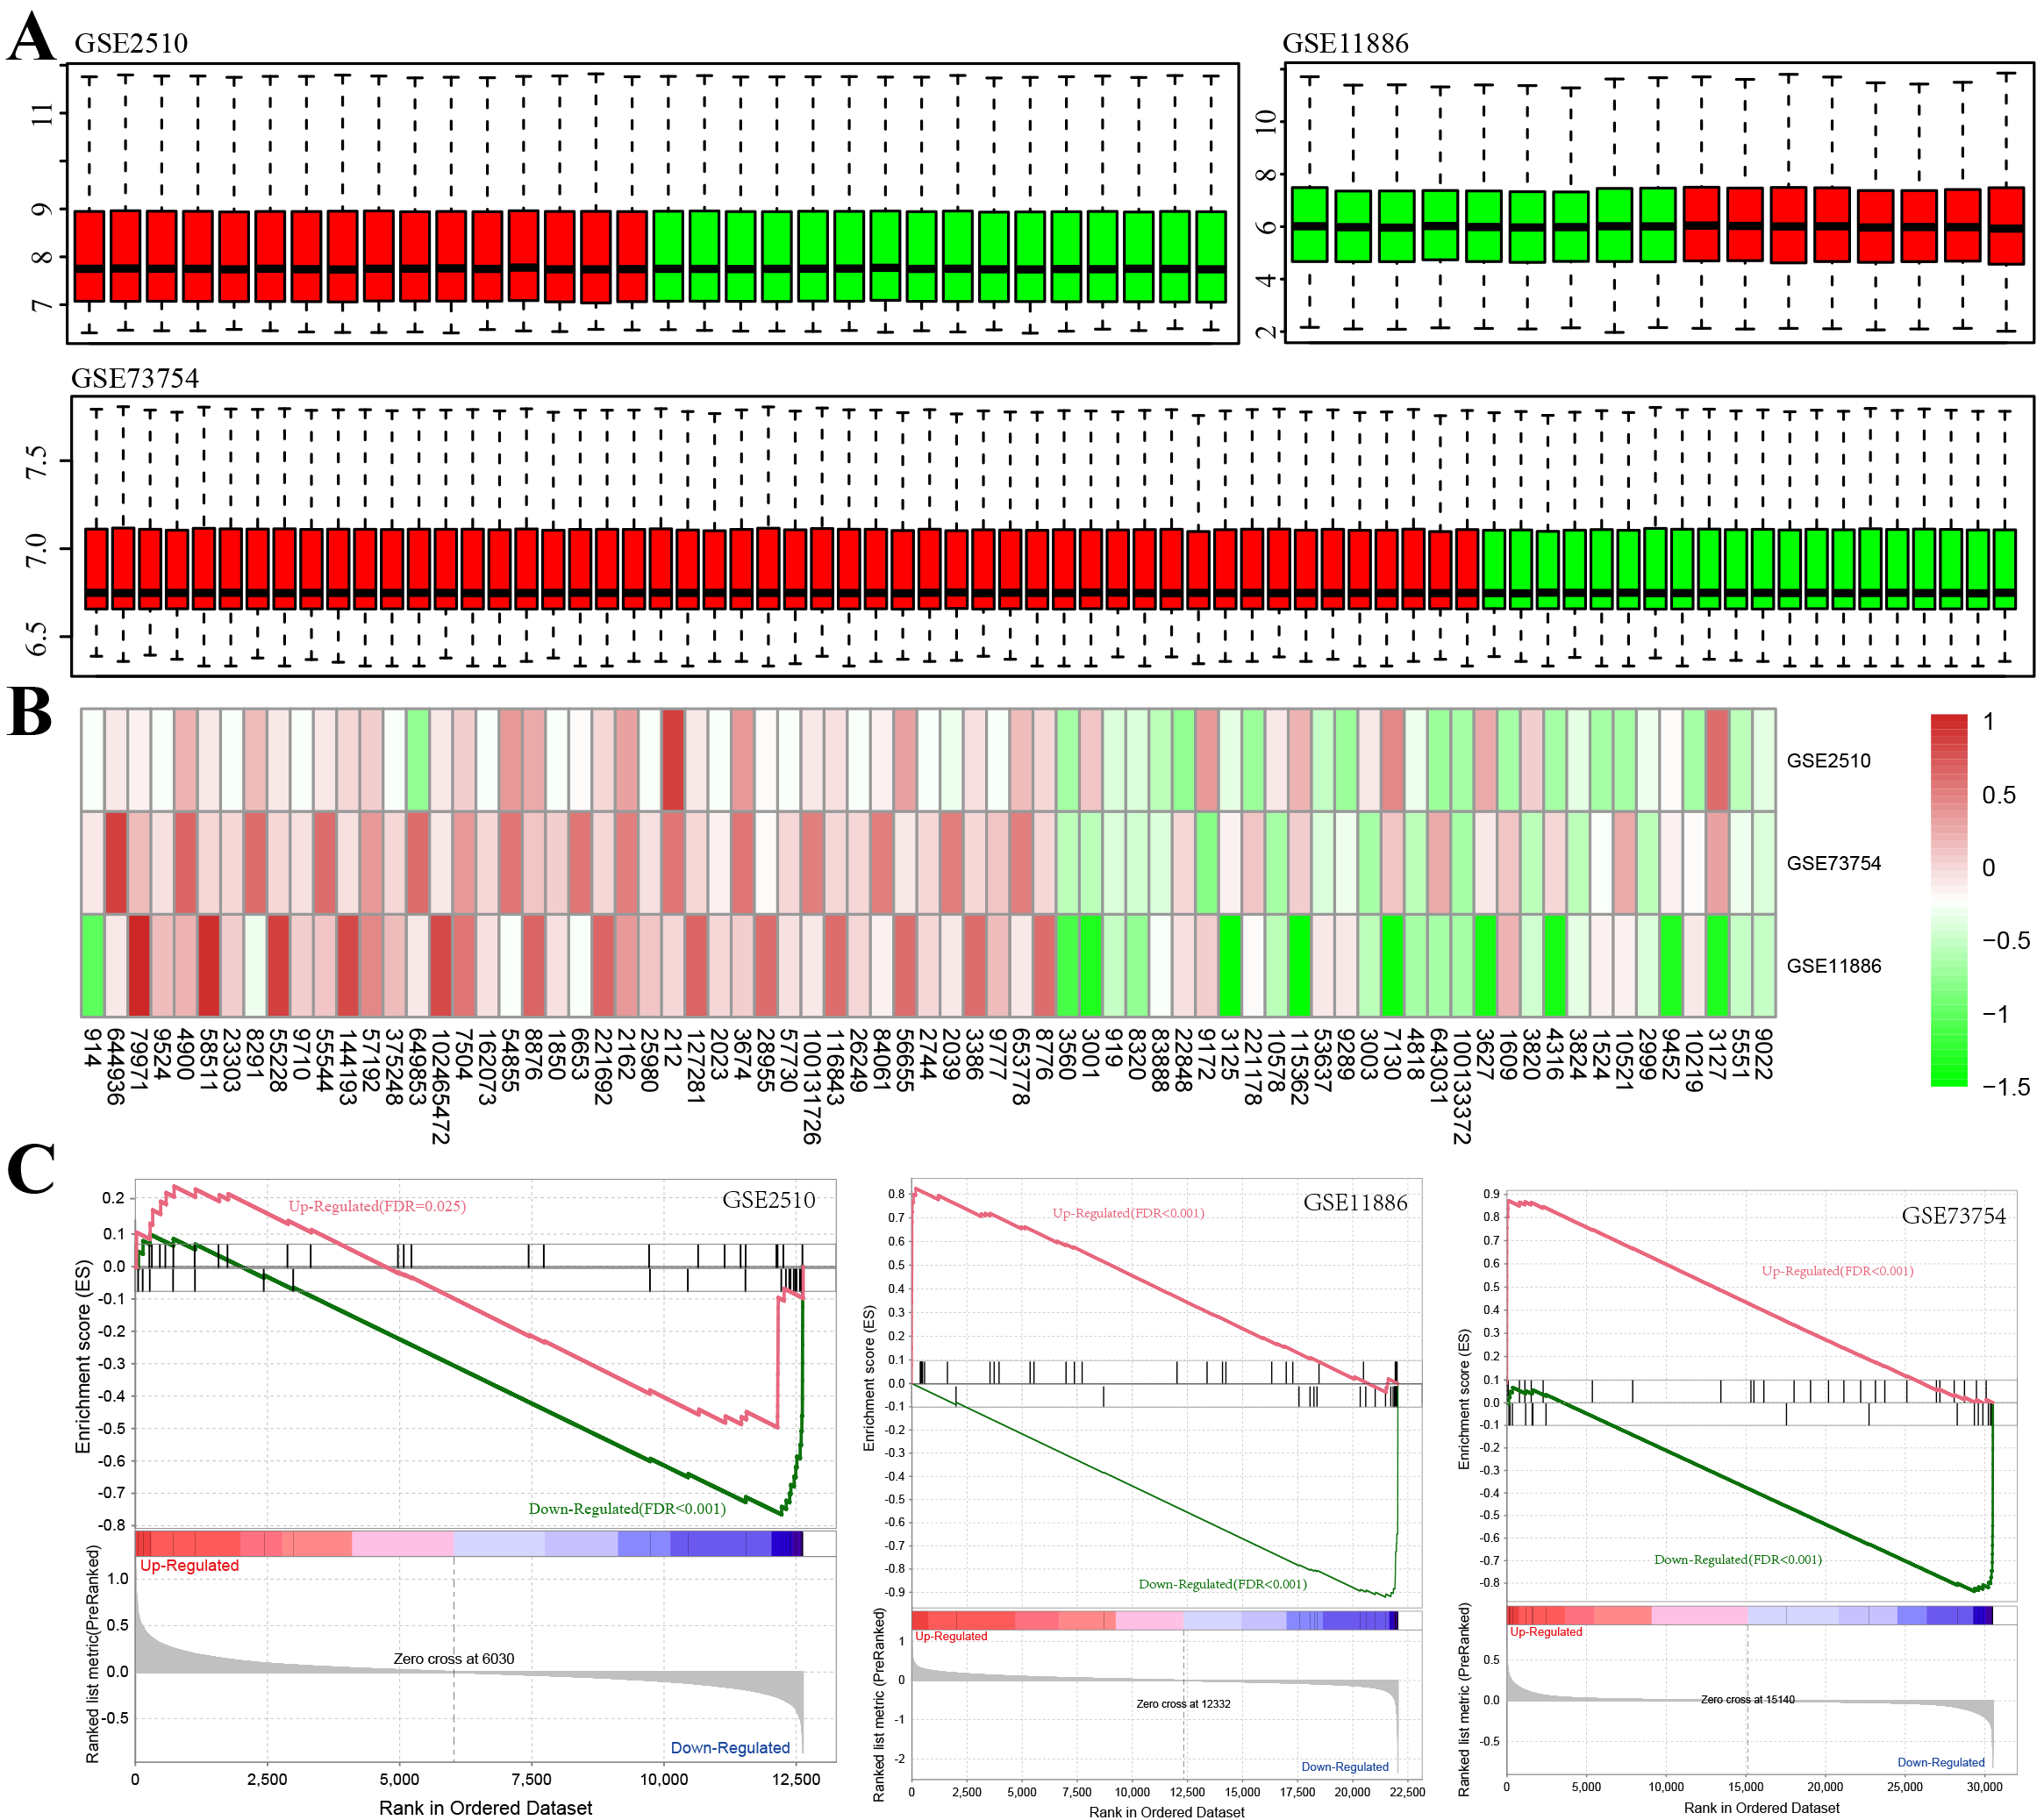 Fig. 2.
Determination of differentially expressed genes (DEGs) between Healthy Control and AS
Samples. (A) Box plot of the overall expression level of the normalized samples
(green bars: normal samples, red bars: AS samples). (B) Heatmap of the down- and
up-regulated DEGs from the integrated microarray analysis. Each column and row
denote a dataset and a gene, separately. In each rectangle, the color denotes the
log
To gain insight into the functional implications of these 73 DEGs, GO and KEGG functional enrichment analyses were implemented on the 31 upregulated and 42 downregulated DEGs. While 42 increased genes were not enriched in any KEGG pathways and GO terms, 31 decreased genes were identified as enriched in multiple KEGG pathways and GO terms. In the bioprocess group, five enriched GO terms were noted, including “cellular defense response”, “cytolysis”, and “T cell costimulation” (Fig. 3A), suggesting that these genes are associated with the cellular defense response. Classification by cellular component displayed seven enriched GO terms, for example, “lumen side of endoplasmic reticulum membrane” and “MHC protein complex” (Fig. 3B). Seven molecular functions were found to be mediated by these genes and were primarily related to “heparin-binding” and “antigen-binding” (Fig. 3C). Furthermore, 21 KEGG pathways were identified including “Type I diabetes mellitus”, “Th17 cell differentiation”, and “Th1 and Th2 cell differentiation” (Fig. 3D). Previous studies have also found a close relationship between “Th17 cell differentiation” and AS [21, 22, 23]. Together these data suggest that the downregulated DEGs are closely related to immunity.
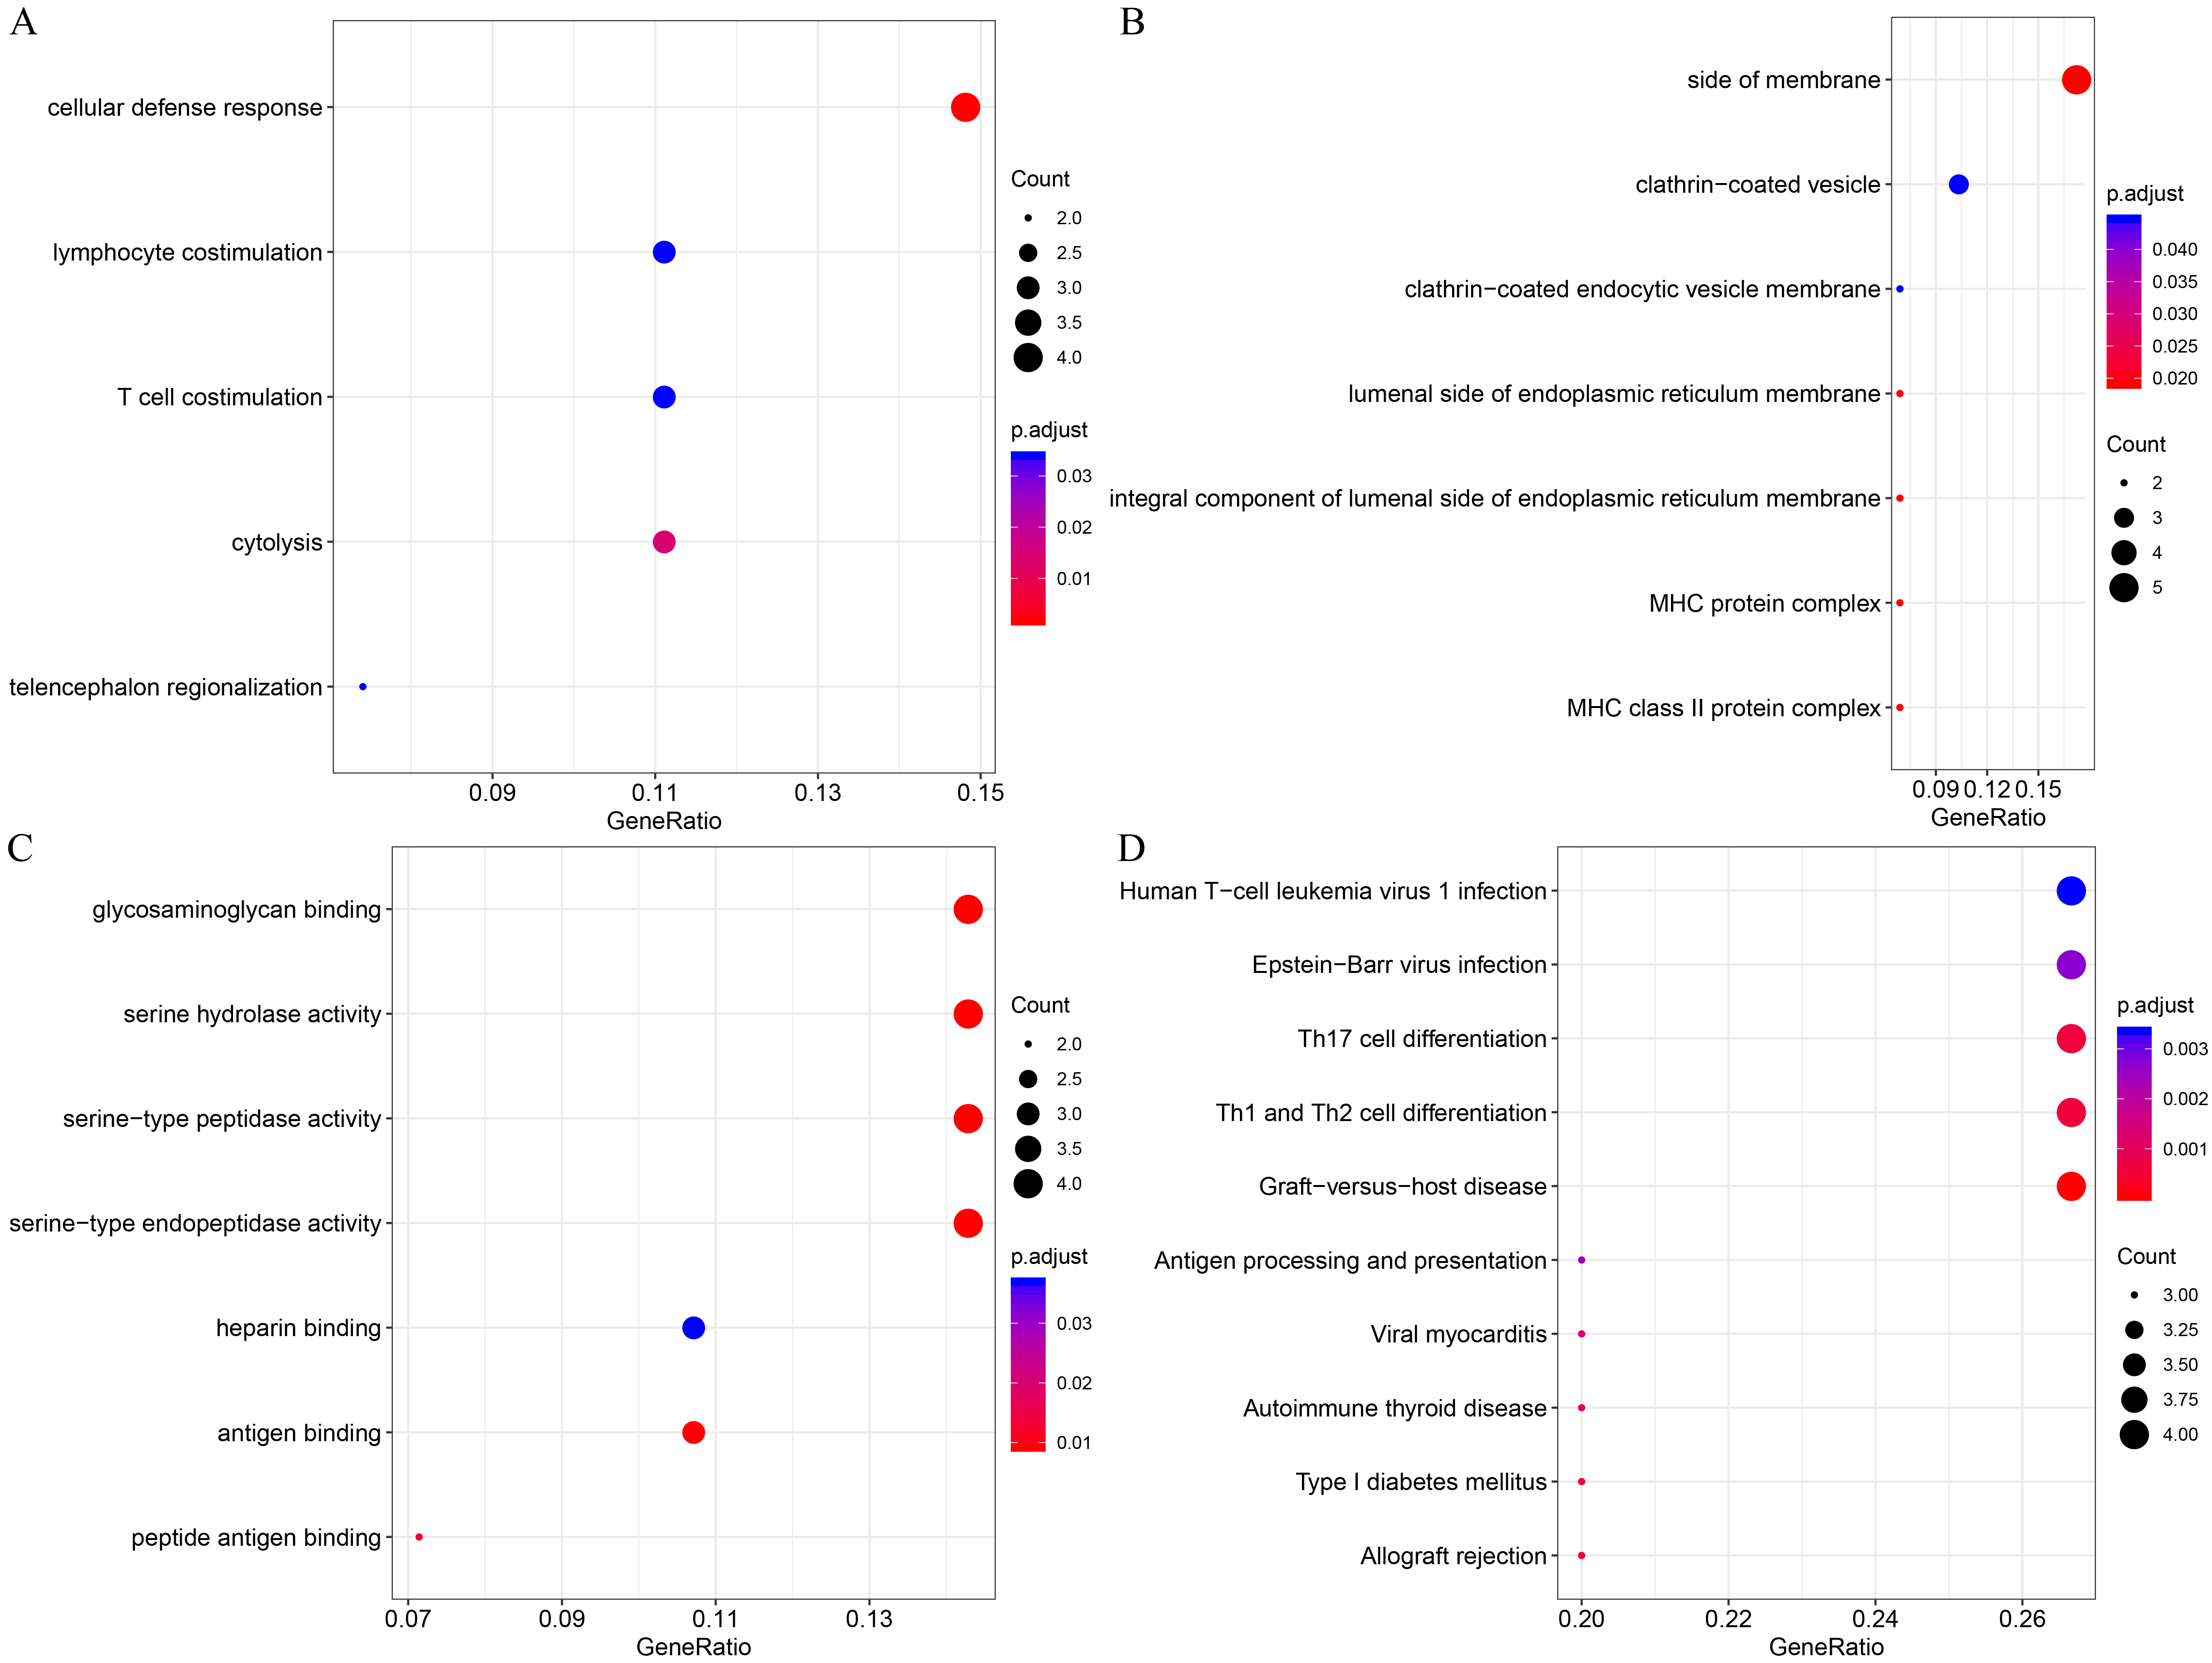 Fig. 3.
Functional enrichment analysis of 31 downregulated DEGs. (A) Enriched GO terms in the “biological process” category. (B) Enriched GO terms in the “cellular component” category. (C) Enriched GO terms in the “molecular function” category. (D) Enriched KEGG biological pathways. The x-axis indicates the ratio of DEGs, the y-axis shows the various categories, the different colors denote levels of significance, and the size represents the number of differentially expressed genes. All enrichment results are provided in the Supplementary Table 2.
For the 21 KEGG pathways identified, the XML files were downloaded from the KEGG website, and genetic interaction information was extracted using the R package XML. Specifically, gene ID was transformed into a gene symbol, a KEGG pathway gene interaction network was built and 622 genes were derived. Genetic analysis of the crosstalk between these pathways indicates that a close relationship exists among most pathways, and some genes are involved in multiple pathways (Fig. 4A). A total of 1663 genetic interactions were obtained based on the regulatory information of genes in the KEGG pathway (Fig. 4B). In addition, most of the genes involved in multiple pathways are closely related to other genes in the network.
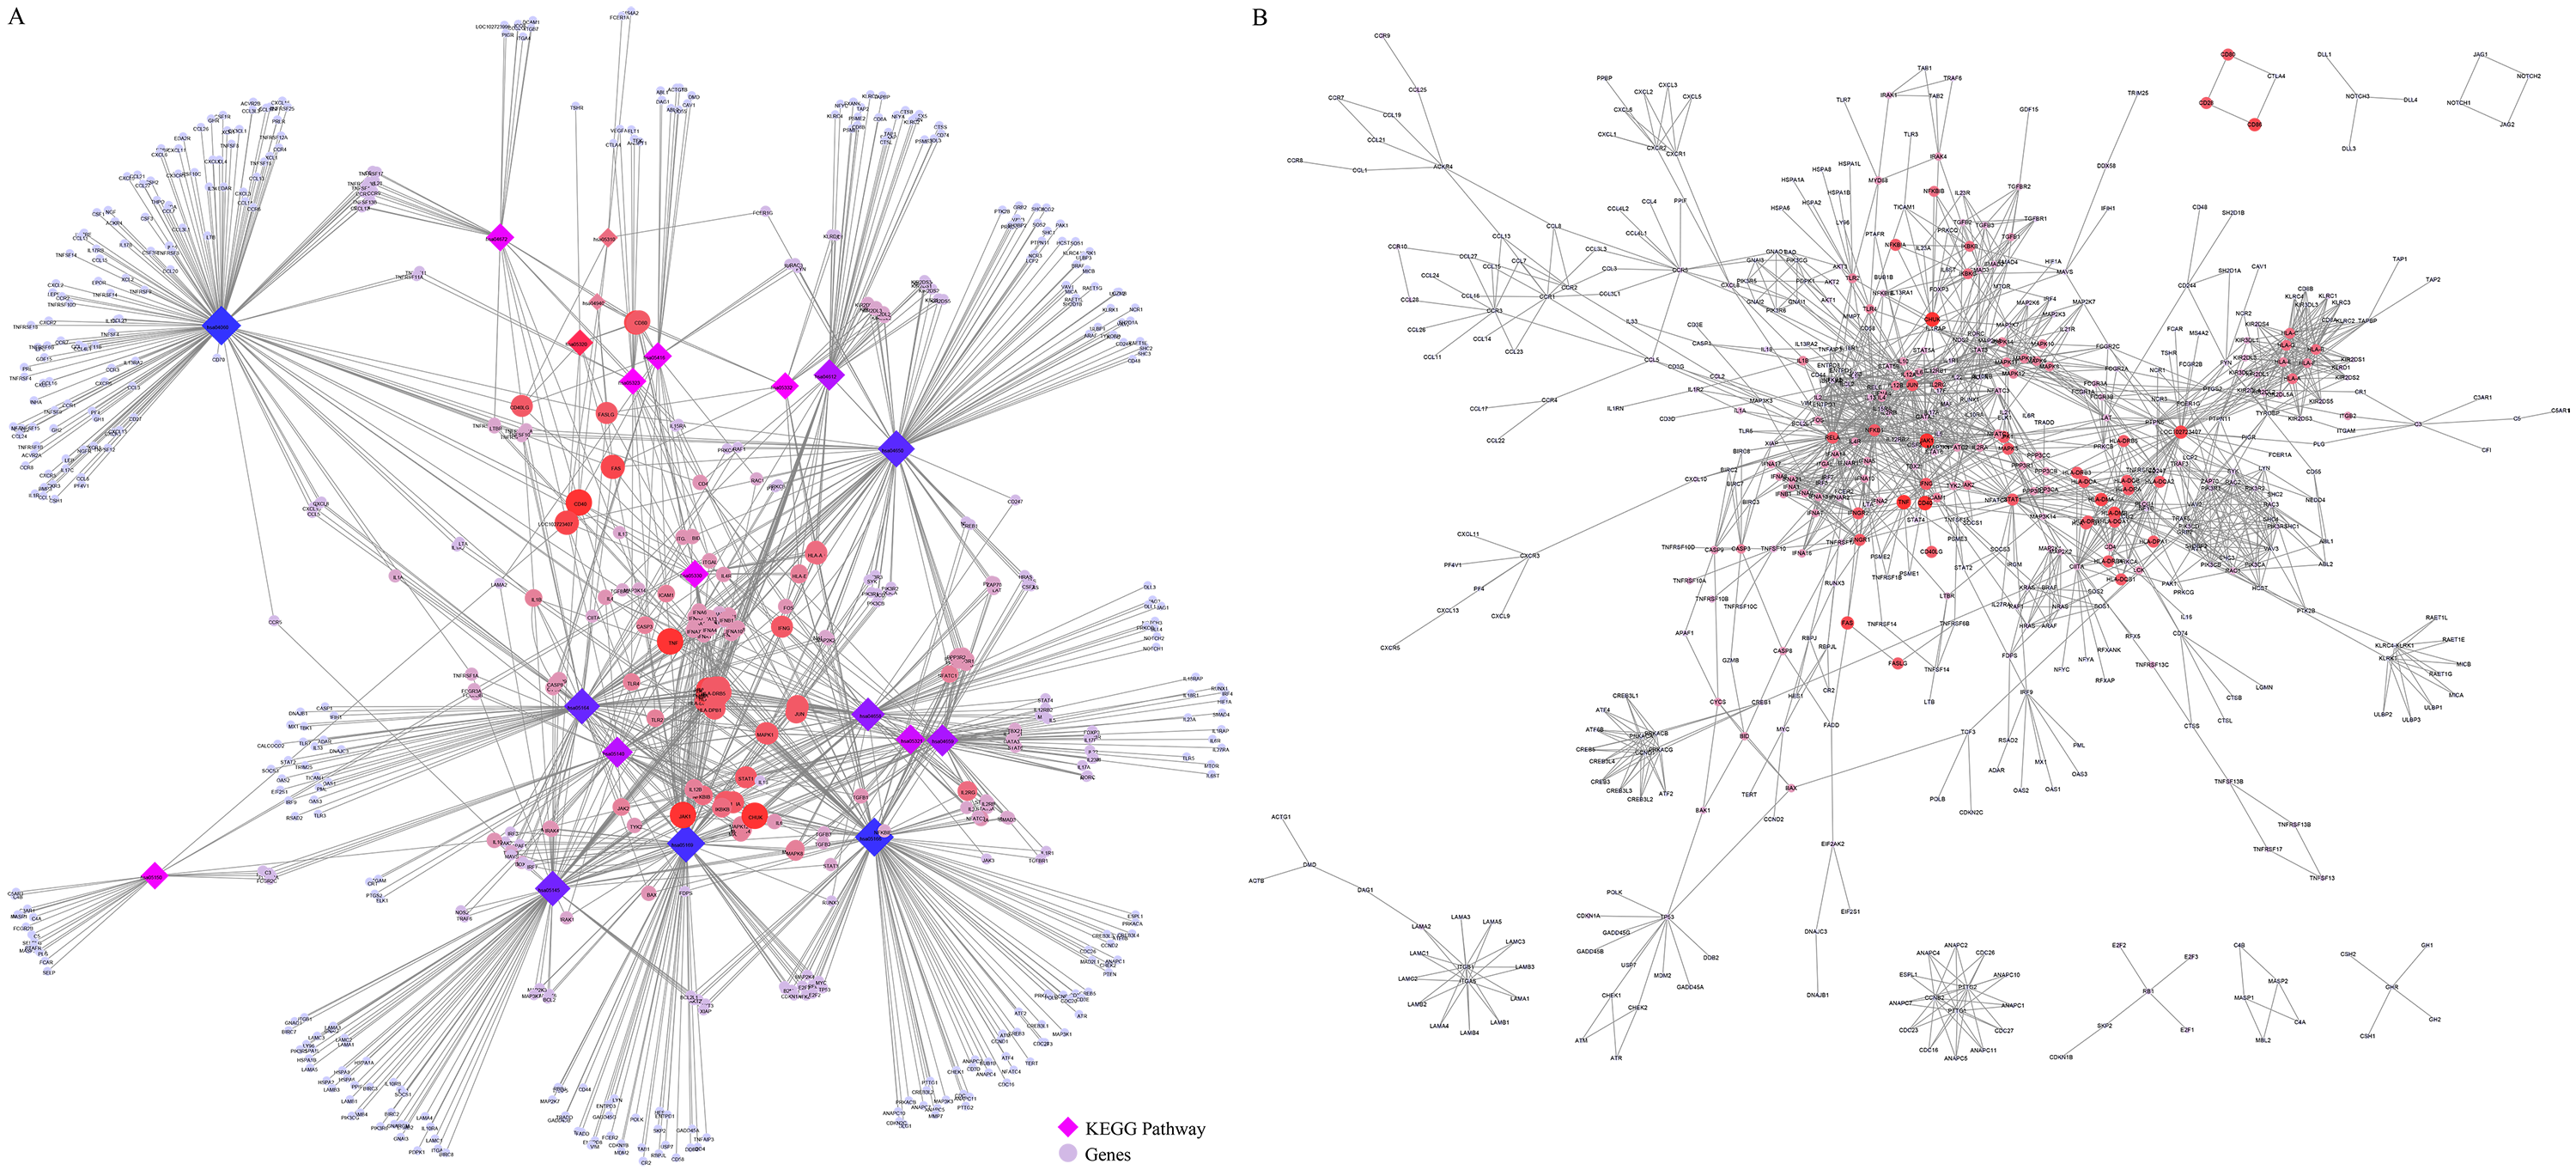 Fig. 4.
KEGG pathway gene interaction network analysis. (A) Crosstalk among genes; color, and size between KEGG pathways indicate the number of pathways in which a particular gene is involved. (B) The interaction network; color and size of KEGG pathway genes indicate the number of pathways in which genes participate.
We analyzed the pathways involved in the KEGG gene interaction network and found that in total, 248 (39.8%) genes were involved in only one pathway (Fig. 5A). A small number of genes are involved in multiple pathways. We also observed a power-law degree distribution in our network (Fig. 5B), where the degree of most genes is less than 20. Additionally, closure of the network revealed that the majority of the nodes have lower closeness and only a few have high closeness (Fig. 5C). The network distribution of betweenness was also computed and the majority of the nodes exhibit a lower betweenness (Fig. 5D). Nodes with high degree, high betweenness or high closeness are viewed as significant in a network.
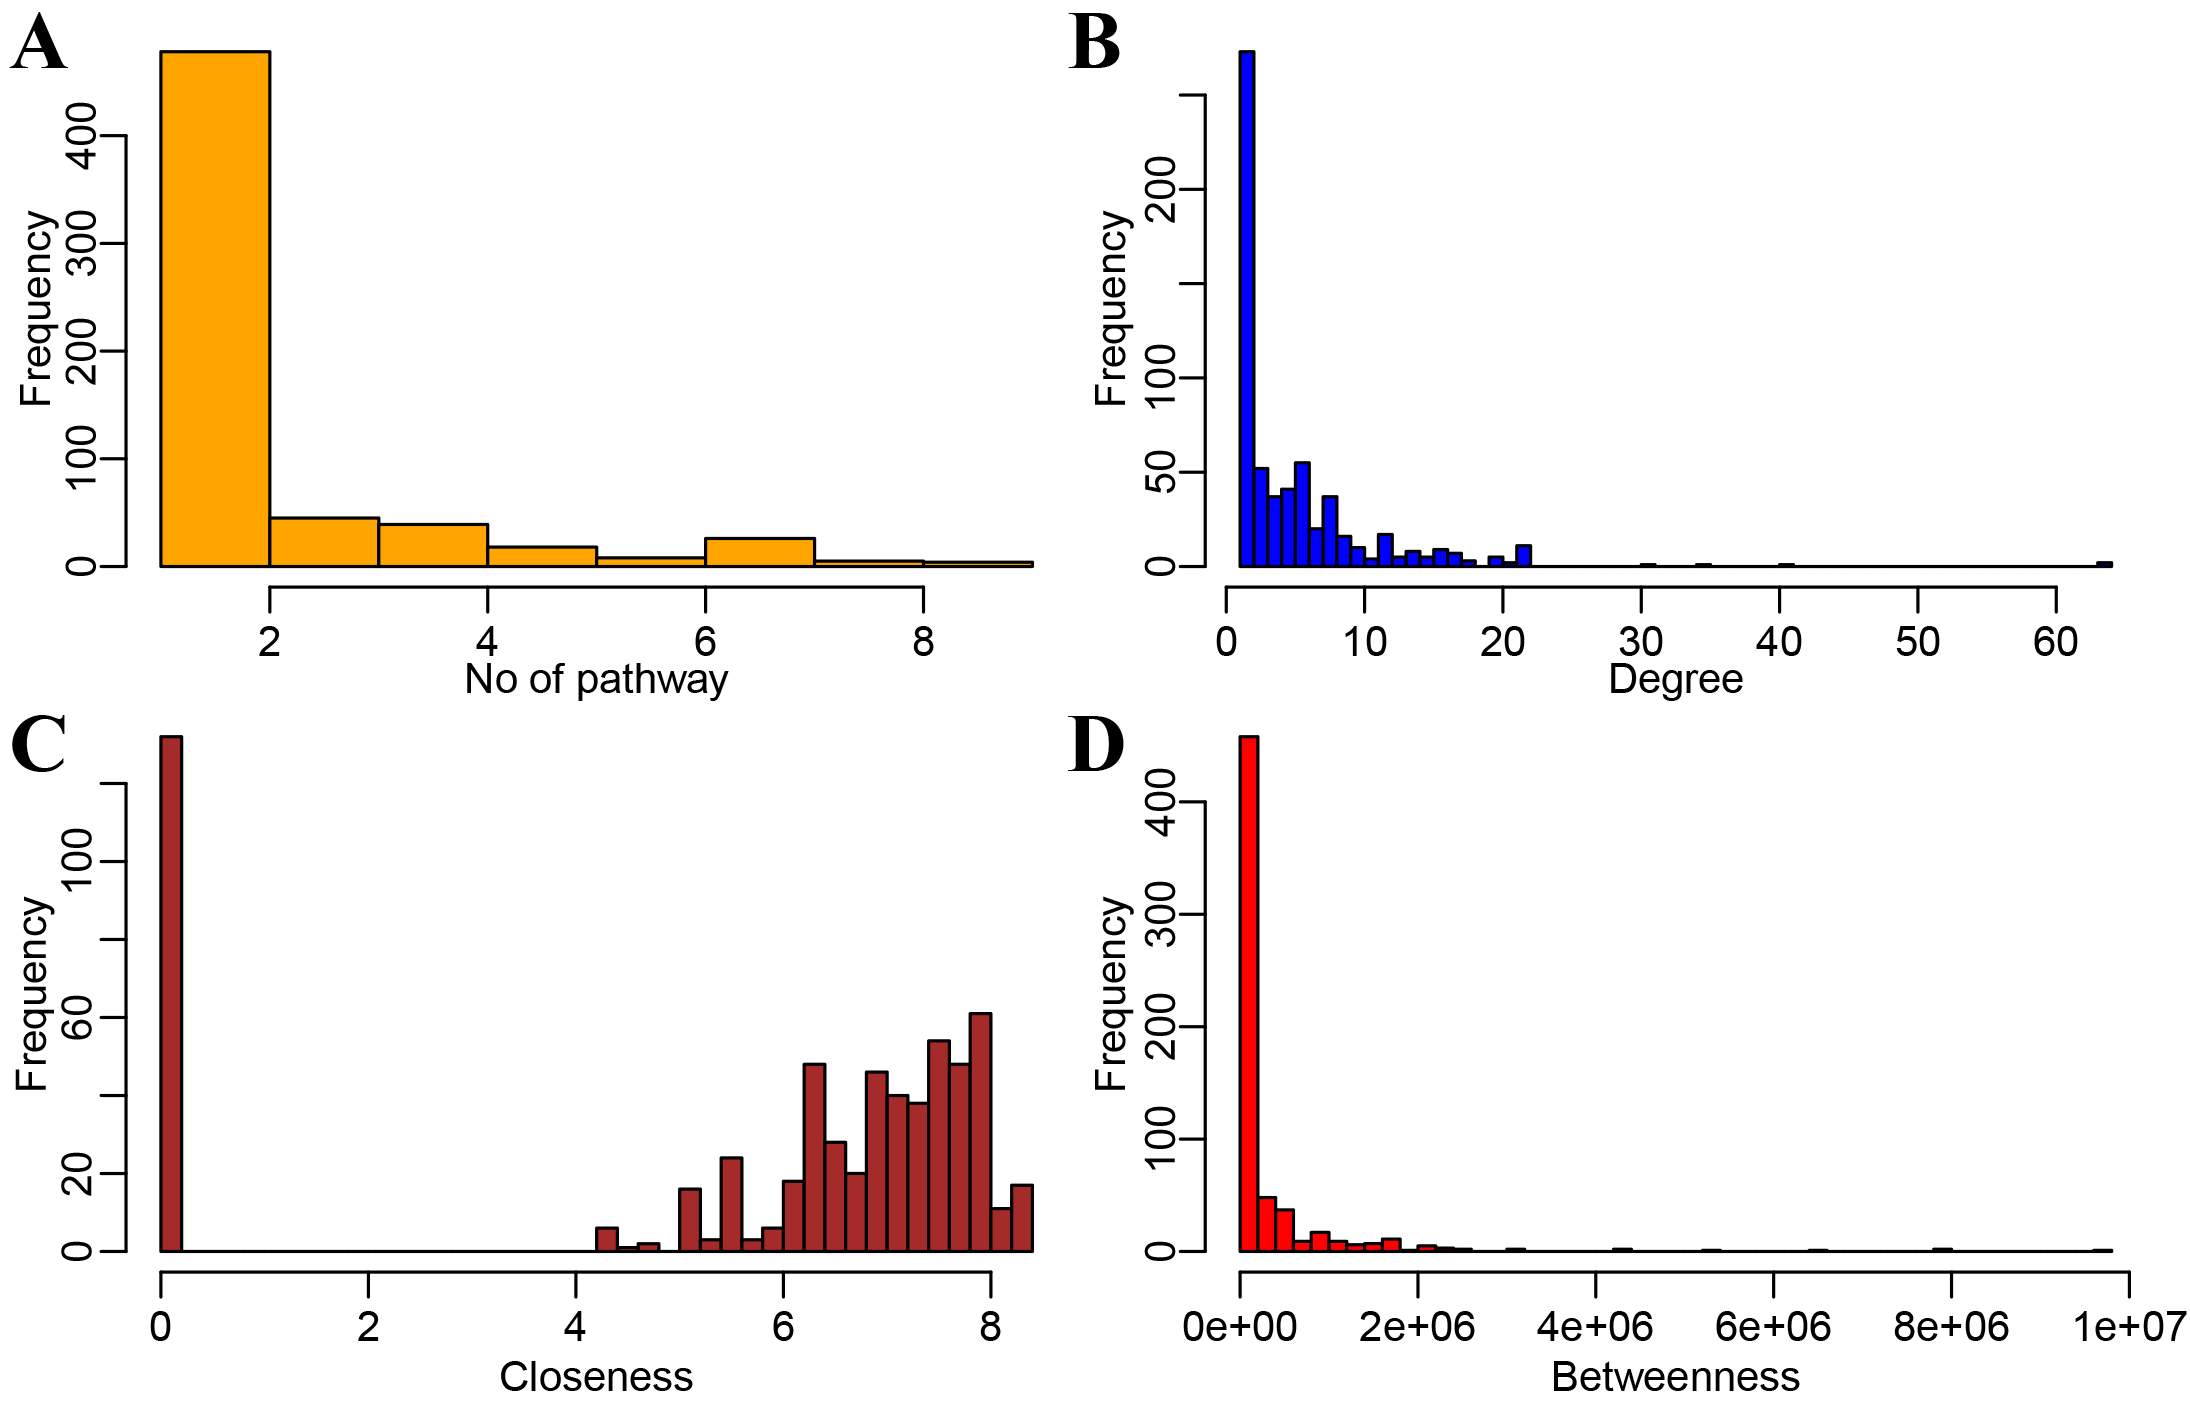 Fig. 5.
Network topological property analysis to screen AS key genes. (A) Distribution of the number of pathways involved in the pathway gene network. (B) Degree distribution of the network. (C) Closeness distribution of the network. (D) Betweenness distribution of the network.
We considered a node to be the hub gene of the access network when it met the
criteria of degree
To construct a diagnostic model, GSE2510 was used as the training dataset (n = 32, AS = 16) while GSE73754 (n = 72, AS = 52) and GSE11886 (n = 17, AS = 8) were used as validation datasets. Six previously chosen hub genes were utilized as features in the training dataset to acquire their corresponding expression profiles. After the z-score, the support vector machine classification model was established. A 10-fold cross-validation indicated the classification accuracy was 93.8%, with 30 of the 32 samples categorized correctly (Fig. 6A). The model’s specificity and sensitivity for AS were both 93.8%. The AUC was 0.94 (Fig. 6D). Validation of the model was then conducted with the GSE73754 dataset; 62 out of 72 samples were categorized correctly for an 86.1% classification accuracy. The model’s specificity and sensitivity for AS in this dataset were 60% and 96.2%, respectively (Fig. 6B) and the AUC was 0.78 (Fig. 6E). Finally, for the GSE11886 dataset, 15 of 17 samples were correctly categorized with 88.2% classification accuracy. The model’s specificity and sensitivity for AS were 88.9% and 87.5%, separately (Fig. 6C) and the AUC was 0.88 (Fig. 6F).
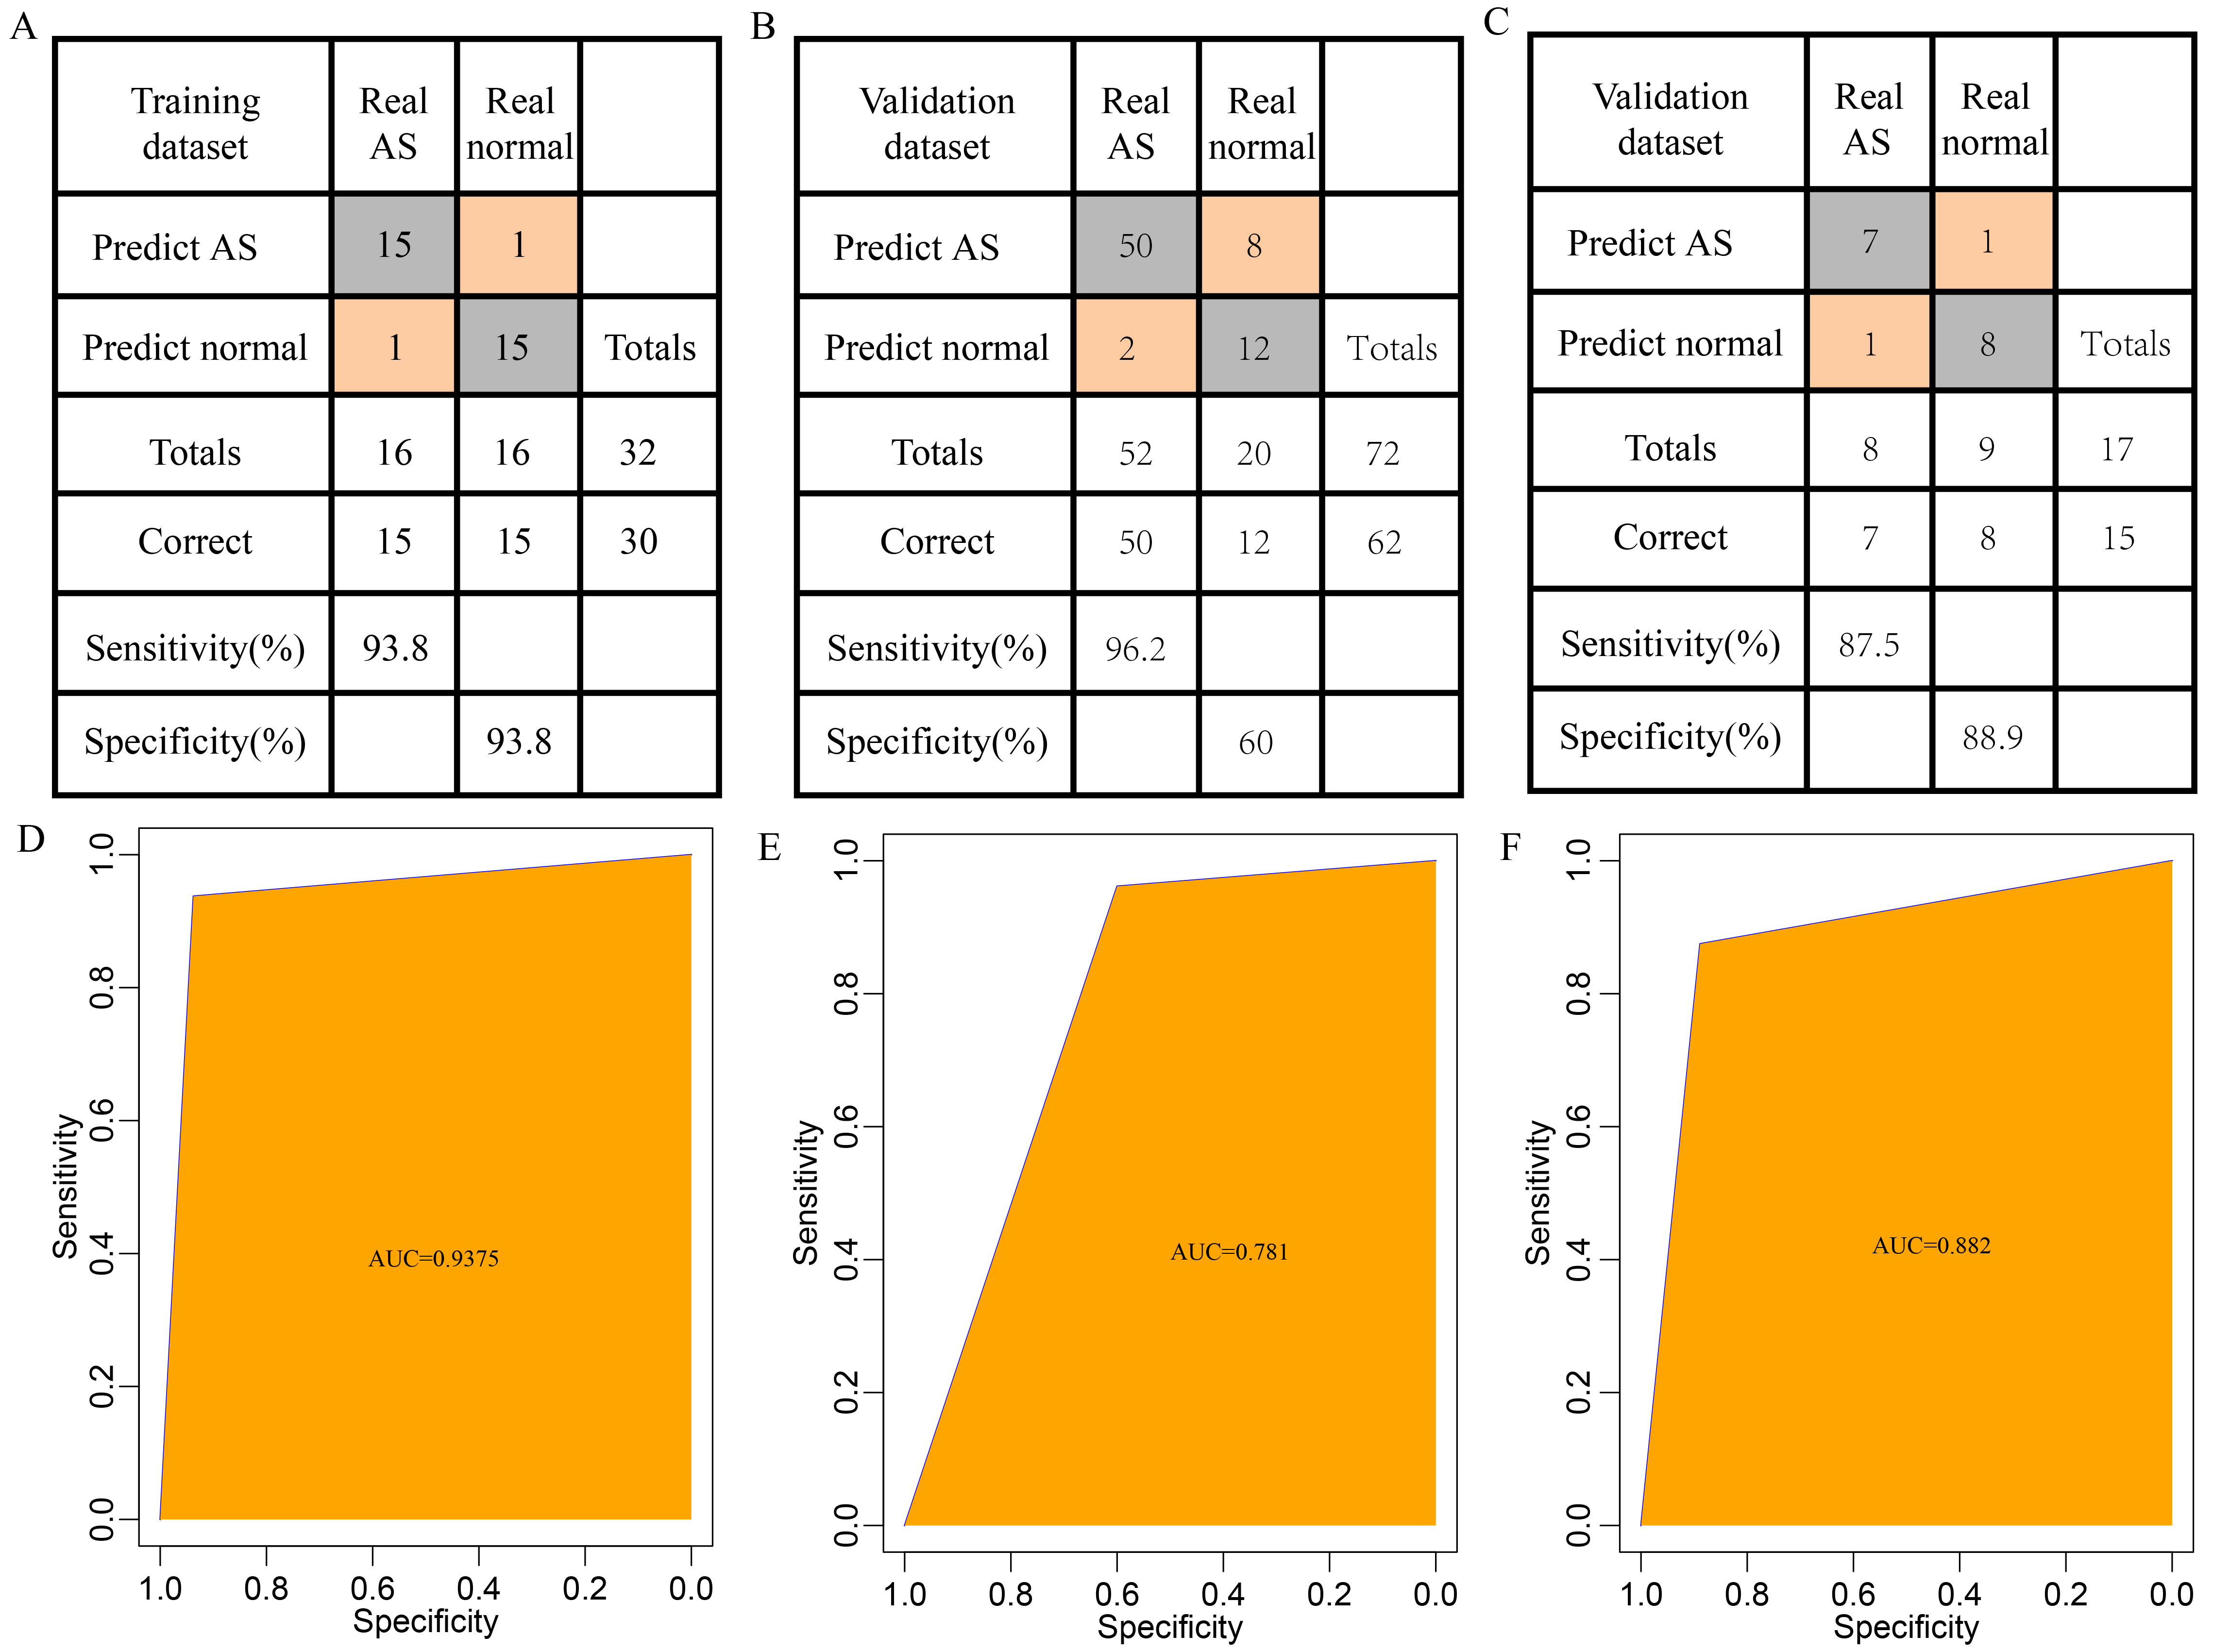 Fig. 6.
Establishment and Testing of the Diagnostic Model. (A) Categorization results of the diagnostic model for the GSE2510 training dataset. (B) Categorization results of the diagnostic model for the GSE73754 validation dataset. (C) Categorization results of the diagnostic model for the GSE11886 validation dataset. (D) Receiver operating characteristic curve (ROC) curve of the diagnostic model for the training dataset (area under the curve (AUC) = 0.9375). (E) ROC curve of the diagnostic model for the GSE73754 validation dataset (AUC = 0.781). (F) ROC curve of the diagnostic model for the GSE11886 validation dataset (AUC = 0.882).
We validated these gene expressions in clinical samples. The findings
demonstrated a significant difference in IL2R
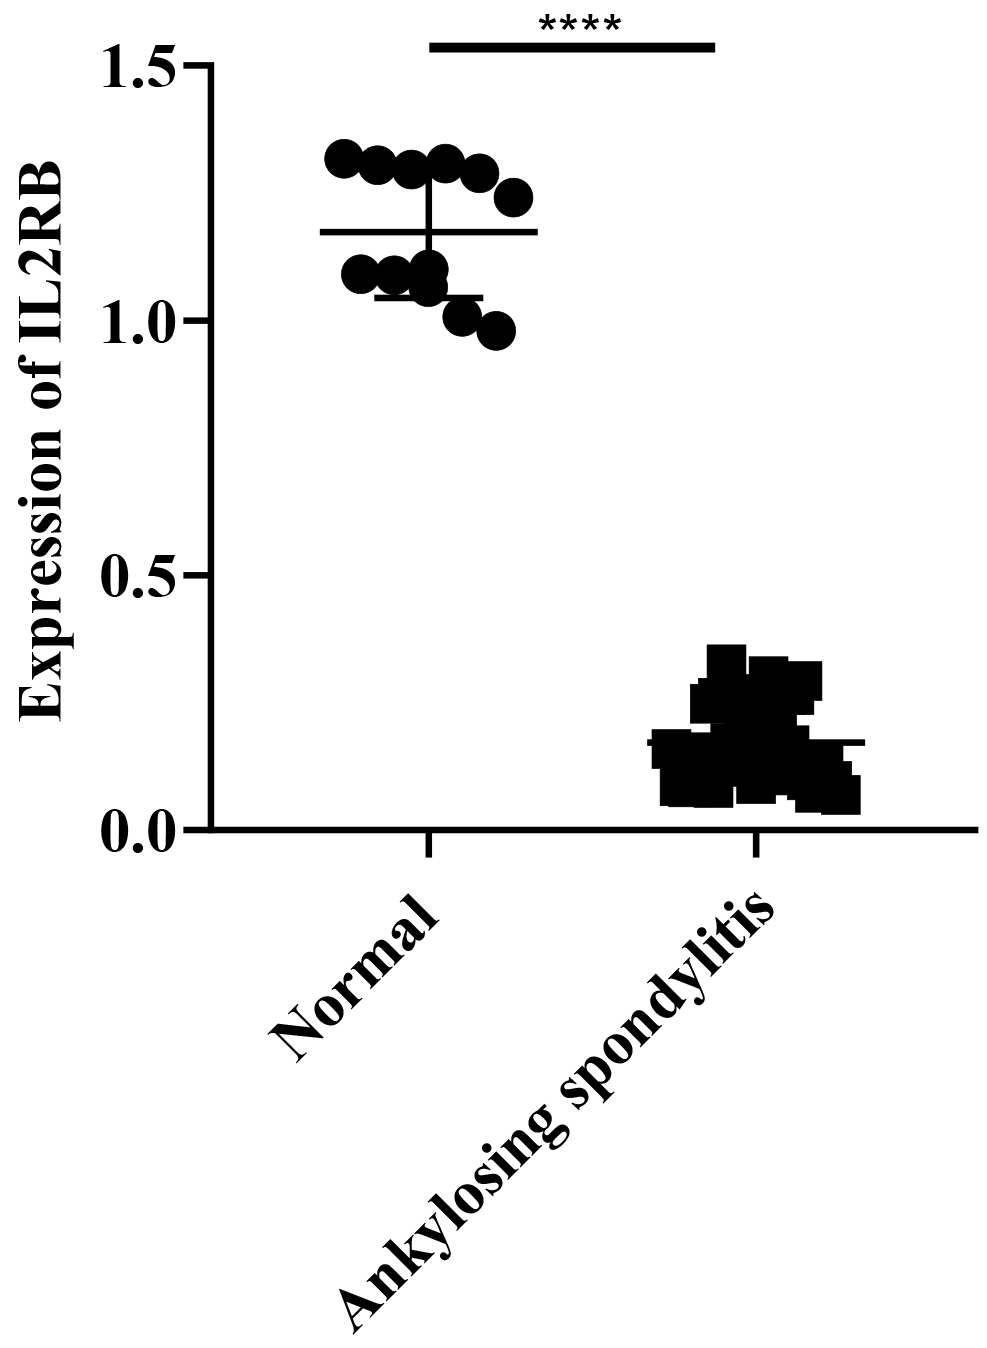 Fig. 7.
Expressions of IL2R
These findings suggest that the diagnostic prediction model established in this
research can differentiate effectively between healthy individuals and those with
AS and that IL2R
The comprehensive bioinformatics analysis focuses on the molecular screening of differential gene expression, and the network-based hub gene discovery has been extensively applied to determine underlying biomarkers relevant to the AS diagnosis and therapy. For example, Xu et al. [27] screened for hub genes by combining DEG screening, functional enrichment analysis, and PPI network construction, and further verified their outcomes by qRT-PCR. Ma et al. [28] used a set of GEO datasets to identify AS-related genes. Kanwal et al. [29] used protein interaction network analysis to find a CD4-centered AS anomaly-related regulatory network. Zhao et al. [7] used a set of GEO datasets for DEG screening, miRNA target gene analysis, and PPI network construction in efforts to screen for AS-related genes. Compared with previous studies, the current research not only integrates a relatively large sample size of microarray data from multiple GEO datasets but also constructs a pathway-based gene regulatory network in addition to an AS diagnostic model to identify potential diagnostic biomarkers for AS.
In our study, 73 consistent DEGs were identified, of which 42 were increased and
31 were decreased. The genes downregulated were enriched in multiple GO terms and
KEGG pathways. These pathways and GO terms were primarily correlated with
immunological functions and the major histocompatibility complex (MHC), which is
in keeping with prior findings that the immune pathway is affected in AS patients
[6, 30]. CD2 is the most upregulated gene, a T-cell surface antigen that
optimizes immune recognition by interacting with LFA3 (CD58) on
antigen-presenting cells and is linked to the onset and progress of various
diseases [31, 32, 33]. The upregulated genes are not enriched in any of the KEGG
pathways and GO terms, and thus their exact contribution to AS development is
unknown. Further investigation is essential to clarify the roles of these genes
as potential transcriptomic markers for AS. We identified six key genes,
KLRD1, HLA-DRB3, HLA-DRB5, IL2R
In addition, as a common rheumatic disease, AS can cause inflammatory back pain,
which greatly reduces quality of life [34]. Therefore, early diagnosis together
with personalized medical interventions for AS are critical. In the past several
years, gene expression profiling has been broadly applied to recognize biomarkers
correlated with the disease [35, 36, 37]. Some of these identified biomarkers are
functionally similar but have poor reproducibility, indicating they may not have
accurate classification capabilities. In the current study, SVMs were employed to
build and verify classifiers based on the expression profiles of six genes
related to AS. The AUC of the training set reached 0.94 with our model, showing
that these genes classify AS well. Additionally, in the verification datasets, we
achieved AUCs of 0.88 and 0.78, which suggests these six genes could be applied
as diagnostic markers for AS. Our results in clinical samples show that
IL2R
Our work employed bioinformatics tools to identify underlying candidate genes involved in AS pathogenesis with large samples. However, limitations remain. First, the sample lacked other information about the clinic. Consequently, we did not account for the factors like whether the patients had other diseases or health conditions. Second, the clinical sample size was small in validation experiments. Hence, further experimental and genetic studies with larger sample sizes and preclinical validation are required.
IL2R
AS, ankylosing spondylitis; GEO, Gene Expression Omnibus; DEGs, differentially expressed genes; GO, Gene Ontology; KEGG, Kyoto Encyclopedia of Genes and Genomes; SVM, support vector machine.
The datasets generated or analyzed during this study are available from the corresponding author on reasonable request.
CAW, BX and CW designed the study. BX, PLC, ZMW and YZZ carried out data acquisition and analysis. ZMW, YZZ and HCL carried out the verification experiment. BX and PLC wrote the manuscript. CW and CAW were revising the paper. HCL and CW contributed to preparing and making figures. All authors contributed to editorial changes in the manuscript. All authors read and approved the final manuscript. All authors have participated sufficiently in the work and agreed to be accountable for all aspects of the work.
All procedures for sample collection and use were approved by the Ethics Committee of Beijing Jishuitan Hospital, Beijing, China (ethics code: 201611-03). All authors approved to participate.
Not applicable.
This work was supported by the Beijing Municipal Health Commission (Grant No. BMHC-2021-6 and BJRITO-RDP-2023).
The authors declare no conflict of interest.
Publisher’s Note: IMR Press stays neutral with regard to jurisdictional claims in published maps and institutional affiliations.