


 , Ziyan Li 3,*
1 Department of Oncology, Changzhou Tumor Hospital, 213032 Changzhou, Jiangsu, China
2 Department of Oncology, The Affiliated Yantai Yuhuangding Hospital of Qingdao University, 264000 Yantai, Shandong, China
3 Department of Pathology, Changzhou Tumor Hospital, 213032 Changzhou, Jiangsu, China
4 Department of Gastrointestinal Surgery, Changzhou Tumor Hospital, 213032 Changzhou, Jiangsu, China
5 Department of Gastroenterology, Changzhou Tumor Hospital, 213032 Changzhou, Jiangsu, China
6 Department of Pathology, Changzhou Hospital of Traditional Chinese Medicine, 213003 Changzhou, Jiangsu, China
†These authors contributed equally.
Abstract
Background: The Wnt/
Keywords
- colorectal cancer
- recurrence biomarker
- disease-free survival
- MEIS3
- metastasis
In recent decades, radical surgical resection and subsequent adjuvant radiotherapy and chemotherapy have been the most important treatments for patients with colorectal cancer (CRC) [1, 2]. Clinicians mainly rely on magnetic resonance imaging (MRI), positron emission tomography (PET), clinical staging, metastasis, pathological grading of cancer tissue, gene stability, and other indicators before deciding whether to perform adjuvant chemotherapy, targeted therapy, palliative treatment, or other measures on patients [1, 3, 4, 5, 6]. However, it is difficult to identify early micrometastases with these clinical indicators. As a result, some patients with metastatic cancer fail to receive the appropriate intervention. At least 50% of patients have in situ and/or distant metastasis in the liver, lung, and other tissues 2–5 years after surgery, although 25% of patients with CRC have already undergone clinical metastases at the time of diagnosis or surgical resection [7, 8]. Cancer metastasis and recurrence have always been the dominant reason for mortality in CRC patients [9].
Tumor budding is the detachment of single cells or small clusters of no more than five cancer cells from the main tumor mass, and predominantly enters the invasion frontier of the tumor stroma [10, 11]. This type of cell disconnects from the bulk cells of the tumor body, degrades the surrounding matrix, migrates away from the tumor body, and becomes the component cell of the invasion front. As a result, tumor budding cells spread to the peripheral circulatory system through lymphatic infiltration, which causes distant metastases and postoperative recurrence [10, 12]. Tumor budding and the epithelial–mesenchymal transition (EMT) control how differentiated cancer cells change from having stable properties to actively invasive behavior. These invasive behaviors are the leading events of cancer metastasis, which then dominates the process of cancer recurrence [13, 14, 15]. According to the results of a study by Müller et al. [16], tumor budding and related genes indicate a worse clinical prognosis and can be used as important markers for clinical decision-making, especially for patients with stage II CRC [11, 16].
During the EMT and tumor budding processes, Wnt/
The TALE family consists of myeloid ecotropic viral insertion site (MEIS)
and the pre-B cell leukemia transcription factors (PBXs) [19]. The MEIS family
includes MEIS1, MEIS2, MEIS3, Prep1, and
Prep2 genes, which are essential for embryonic development and cancer
progression [19, 20]. MEIS3 is expressed in spatial and temporal patterns and is
essential for early embryonic development [20, 21]. As a target gene of
Wnt/
Based on the function of MEIS3 in the gut and cancer development, we hypothesized that MEIS3 may be crucial for CRC metastasis, recurrence, and survival. Thus, we investigated the MEIS3 expression pattern in CRC tissues, as well as the relationship with CRC progress in the clinic. We also analyzed the role of MEIS3 in CRC cell metastasis. Furthermore, we stratified the patients by protein level and clinical stage to confirm the value of MEIS3 as a prognostic biomarker for CRC recurrence after radical resection.
This study was approved by the ethics committee of the Changzhou Tumor Hospital (Changzhou, China). The consent form was signed by patients according to the International Ethical Guidelines for Human Biomedical Research standards. The clinical staging of CRC patients was carried out following the American Joint Committee on Cancer (AJCC) standard, meaning that clinical staging was based on cancer tissue invasion, lymph node metastasis, and distal metastasis [1]. All patients were treated according to the CRC guidelines of the Chinese Society of Clinical Oncology. During follow-up, once recurrence was found, it was recorded as the endpoint of disease-free survival (DFS). If the patient died for any reason other than CRC, the data were deleted. From 2015 to 2020, a total of 323 patients participated in the study, and 292 patients were ultimately included in the analysis (Supplementary Table 1). Cancer and paracancer tissues from patients were treated with liquid nitrogen for at least 1 h before being stored at –80 °C for subsequent Western blotting (WB) and immunohistochemistry (IHC) analyses.
In this study, we used the following antibodies: rabbit anti-MEIS1 (1:500; Atlas
Antibodies, Bromma, Sweden), rabbit anti-MEIS2 (1:500; Proteintech Group,
Rosemont, IL, USA), rabbit anti-MEIS3 (1:500 for WB, 1:100 for IHC; Atlas
Antibodies), rabbit anti-laminin beta 1 (anti-LamB1) (1:500; Proteintech Group),
rabbit anti-MMP2 (1:500; Proteintech Group), rabbit anti-E-cadherin (1:1000; Cell
Signaling Technology [CST], Danvers, MA, USA), mouse anti-beta catenin (ACTB,
1:1000; Proteintech Group), mouse anti-vimentin (VIM, 1:2000; Proteintech Group),
rabbit anti-ACTB (1:3000; Proteintech Group), horseradish peroxidase
(HRP)-conjugated Affinipure Donkey Anti-Mouse IgG (H+L) (1:5000; Proteintech
Group), HRP-conjugated donkey anti-rabbit IgG (H+L) (1:5000; Proteintech Group),
rabbit anti-E-cadherin (1:500; Thermo Fisher Scientific, Waltham, MA, USA), and
mouse anti-vimentin (1:500; CST). Dulbecco’s Modified Eagle Medium (DMEM) and
fetal bovine serum for cell culture were purchased from Thermo Fisher Scientific.
The CRC strains SW480 and SW1116 were from Shanghai ZJ Bio-Tech Co., Ltd.
(Shanghai, China) and Fuheng Biology Co., Ltd. (Shanghai, China). All cell lines were
validated by STR profiling and tested negative for mycoplasma. Cells were all
cultured in a humidified incubator at 37 °C and 5% CO
The total RNA in cells was extracted with the Trizol method, and reverse
transcription was performed with AMV Reverse Transcriptase (Promega, Madison, WI,
USA). Quantitative PCR (qPCR) was performed using a SYBR Green PCR Master Mix
(Toyobo, Tokyo, Japan) according to the manufacturer’s instructions. The
2
Protein extraction and WB were carried out according to the protocols described in MolecularCloning: A Laboratory Manual, with modification [27]. Briefly, RIPA buffer was used to lyse the tissues or cells, and the Bradford method was used to quantify the protein. After boiling in Laemmli buffer for 10 min, protein samples were resolved on a 10% sodium dodecyl sulfate polyacrylamide gel electrophoresis gel, followed, and electrophoreticallytransferred to a PVDF membrane. After blocking in 5% fat-free milk powder in Tris-buffered saline with 0.1% Tween20 detergent (TBST) for 30 min, the membrane was incubated with primary antibody overnight at 4 °C. The next day, the membrane was washed three times with TBST for 5 min, and then incubated with a secondary antibody at a dilution of 1:5000 at room temperature for 2 h. The film was scanned after developing, and its gray-scale value was analyzed using Quantitative One 4.40 software to evaluate the relative protein expression. The ratio = (MEIS3c/ACTB c)/(MEIS3p/ACTBp) was employed to determine the protein abundance of MEIS3 in the CRC tissue, and the ratio = (target/ACTB) was used to determine the abundance of the target protein in the cell sample.
The tissues were dehydrated in various alcohol concentrations (i.e., 70%, 80%, 95%, 100%, and 100%), made transparent with xylene, fixed in 4% paraformaldehyde, and finally embedded in paraffin wax for 24 h. Then slices were prepared by cutting the tissues at a thickness of 8 µm using a microtome (Leica, Wetzlar, Germany). The tissue samples were reverse-treated with 100% to 50% alcohol from xylene, dipped in sodium citrate antigen repair solution, and repaired with the microwave method. Following a 10-min soak in 5% hydrogen peroxide, the tissue samples were rinsed under running water for 1 min before being incubated in 10% rabbit serum for 1 h. Then the serum was replaced with MEIS3 antibody (1:100) and incubated overnight at 4 °C. The next day, slices were washed three times with phosphate-buffered saline (PBS) and incubated in HRP-conjugated IgG (1:500) for 1 h at room temperature. The color was developed with the SABC method. Slices were sealed with neutral gum after being dehydrated with a gradient of ethanol and xylene, and the images were photographed using a microscope.
The lentiviral particles for MEIS3 silencing were packaged with the assistance
of Shanghai ZJ Bio-Tech Co., Ltd. The knockdown expression vector was composed of
three U6 promoters connected in series, each of which directed a short hairpin
MEIS3 RNA (shMEIS3) sequence. The three shRNA sense sequences were as follows:
5
The cells were first cultured in DMEM without FBS for 24 h. During this time,
the Transwell chambers were soaked and moistened with 1
The patient’s MEIS3 mRNA level, DFS, and overall survival (OS) analysis of The Cancer Genome Atlas (TCGA) database were performed on the Gene Expression Profiling Interactive Analysis (GEPIA) portal (http://gepia.cancer-pku.cn/) [28]. The data of GSE17537 in the Gene Expression Omnibus (GEO) database was downloaded from GenomicScape (http://www.genomicscape.com/) and analyzed again with GraphPad Prism 8.0 (GraphPad Software, San Diego, CA, USA) [29, 30]. Independent OS analysis was also implemented on this platform.
For statistical analyses, we used GraphPad Prism 8.0 (GraphPad Software, Boston, MA, USA). To examine the differences between comparisons in protein level, cell migration, and invasion, the t-test and/or one-way analysis of variance were utilized. The 5-year DFS and OS of patients with different factors were estimated with Kaplan–Meier curves and log-rank tests.
First, we analyzed the localization pattern of MEIS3-positive cells in CRC
tissues by IHC. Although regulated by Wnt/
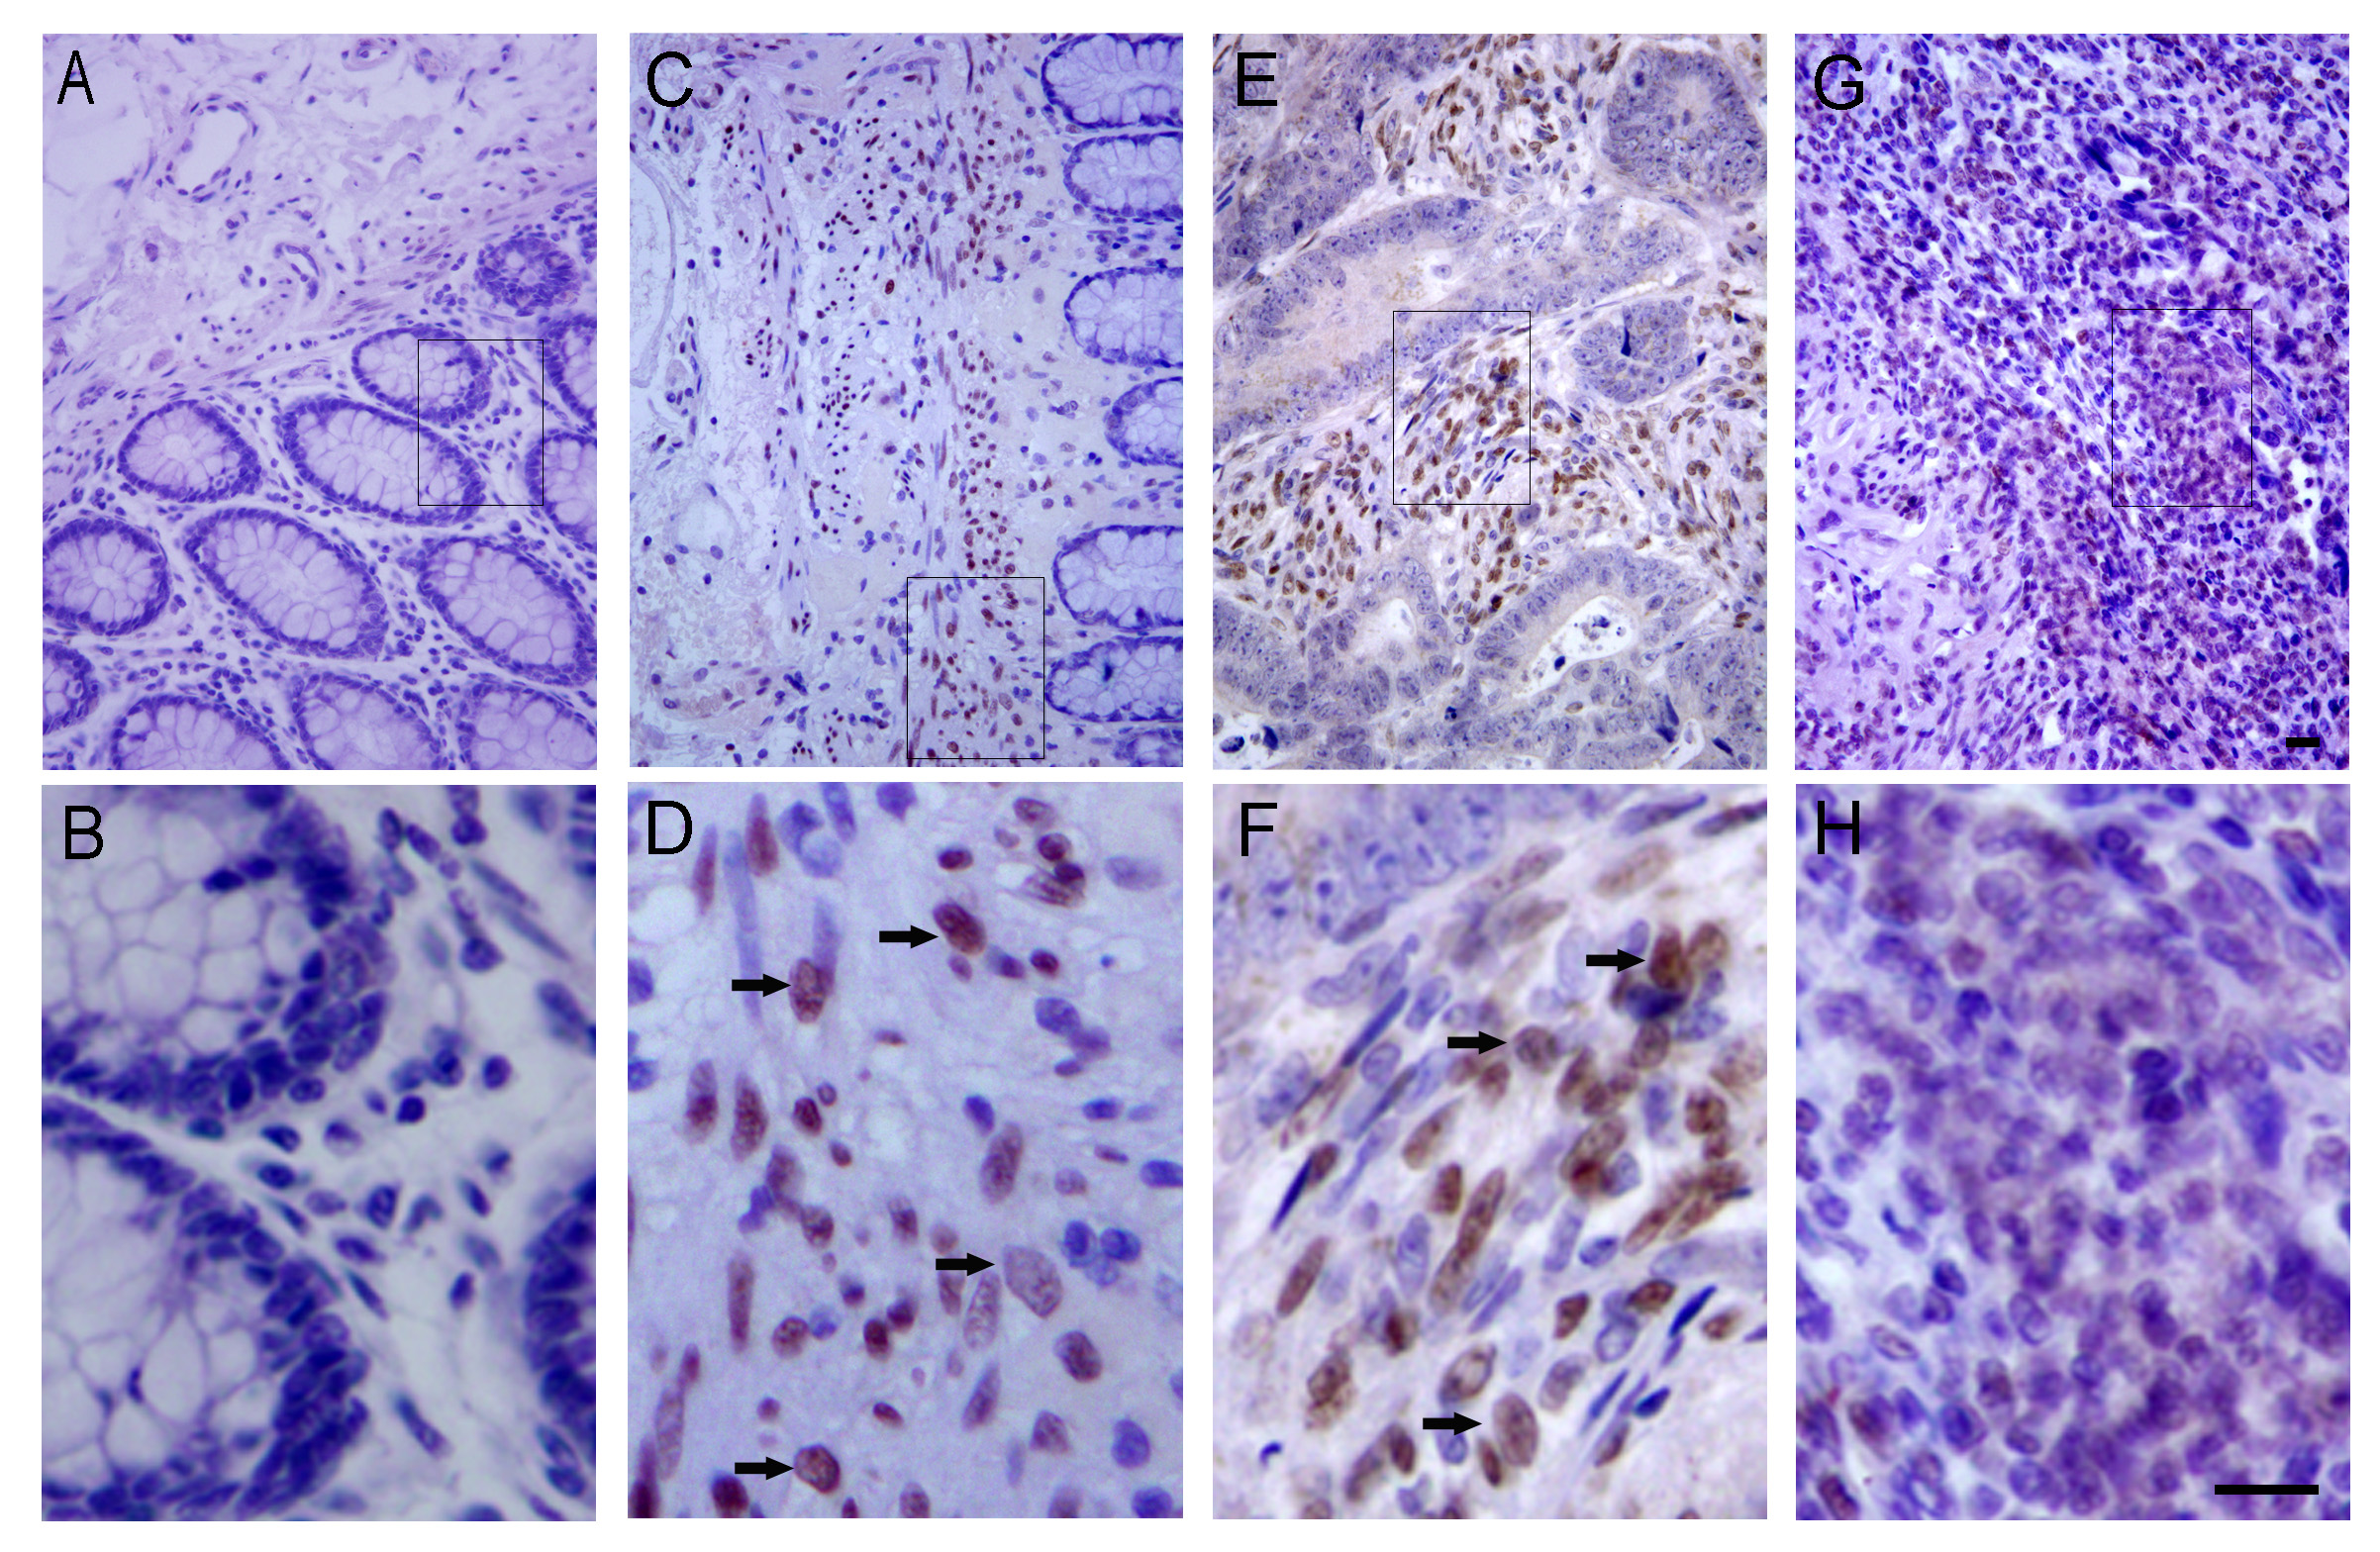 Fig. 1.
Localization of myeloid ecotropic viral insertion site 3 (MEIS3) protein in colorectal cancer (CRC) tissues. MEIS3 was not detected in well-differentiated CRC tissue areas (A,B) but was detected in the cancer nucleus of the growth front (C,D) and tumor–stroma interface regions (E,F) containing an abundance of budding cells (black arrows, D, F), and was widely distributed in poorly differentiated cells, although the intensity was weak (G,H). Among them, B, D, F, and H are the screenshots within the boxes of A, C, E, and G diagrams, respectively. Scale bar = 50 µm.
We employed the ratio of protein abundance between cancer and paracancer to
evaluate MEIS3 protein expression. We found that the MEIS3 expression was
significantly increased in CRC compared to paracancer (2.81
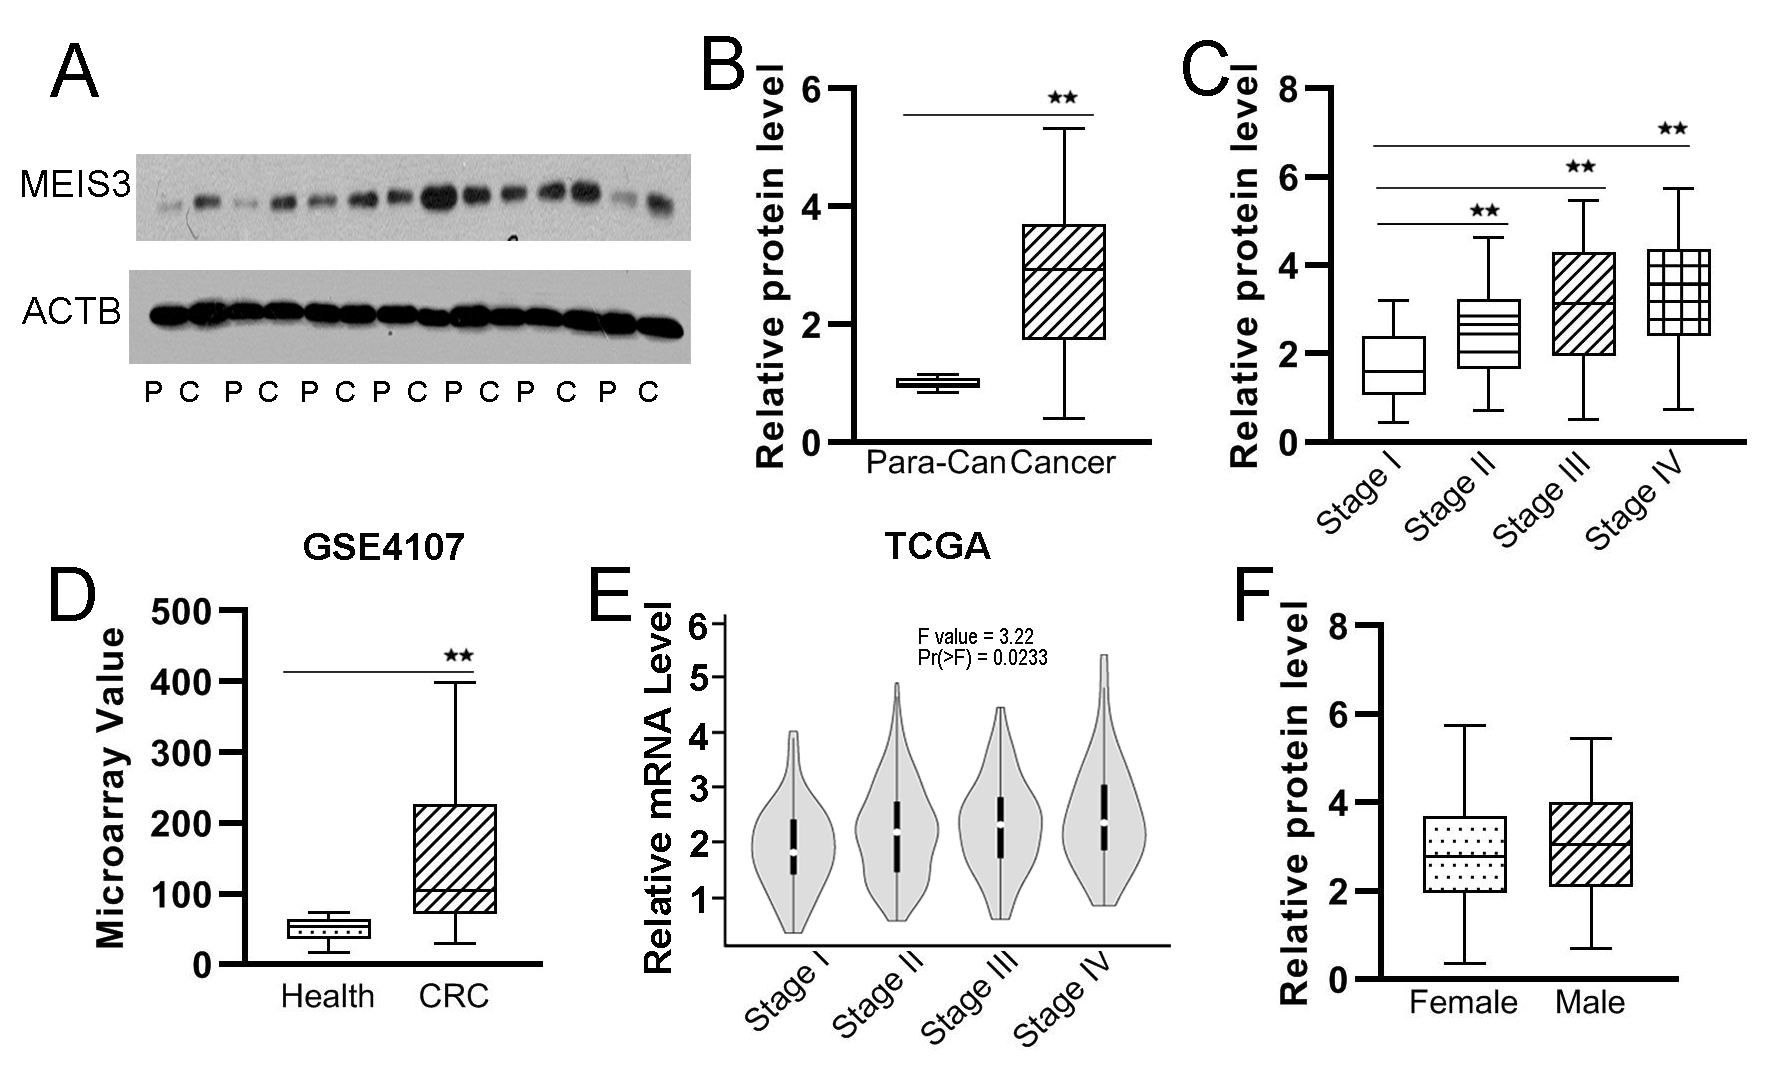 Fig. 2.
Expression level of MEIS3 in CRC. The MEIS3 protein expression
in CRC cancer and paracancer tissues was detected by Western blotting (WB) (A)
based on which we analyzed the ratios of MEIS3 protein abundance in CRC tissues
to paracancer tissues in our cohort (B) and GSE4107 cohort (D) and the tendency
of MEIS3 expression in cancer tissues according to clinical stage in our cohort
(C) and The Cancer Genome Atlas (TCGA) cohort (E). The relative protein
expression of MEIS3 in CRC tissues was also analyzed according to sex (F). P,
Paracancer tissue; C, Cancer tissue. **p
To verify the results, we employed the GSE4107 cohort data to analyze MEIS3
expression in CRC tissues [34]. As shown in Fig. 2D, MEIS3 mRNA expression in
cancer tissues was significantly increased to about 3 fold that in normal control
tissue (p = 0.015). By employing the GEPIA platform, we found that MEIS3
mRNA levels gradually increased with clinical staging progression (Fig. 2E).
Although the expression of some genes was found to be sex-related, we did not
find this trend for MEIS3 in our cohort (female vs. male: 2.86
Based on the distribution characteristics of MEIS3-positive cells (Fig. 1), the correlation between MEIS3 expression and CRC progression in tissues (Fig. 2), and the role of MEIS3 in promoting cell migration into gut tissue, we hypothesized that MEIS3 may contribute to CRC cell migration and invasion [22, 23]. We constructed lentiviral particles carrying three tandem U6-promoter-MEIS3-shRNA, which were employed to silence MEIS3 expression in SW480 and SW1116 cells (Supplementary Fig. 1A). By analyzing the mRNA and protein levels of MEIS1, MEIS2, and MEIS3, we determined that the virus particle could specifically and effectively silence MEIS3 expression (Supplementary Fig. 1B–E, Supplementary Table 2).
The scratch wound healing assay was used to analyze cell migration ability. When
the wound area of the SW480 cells was covered by 67.1
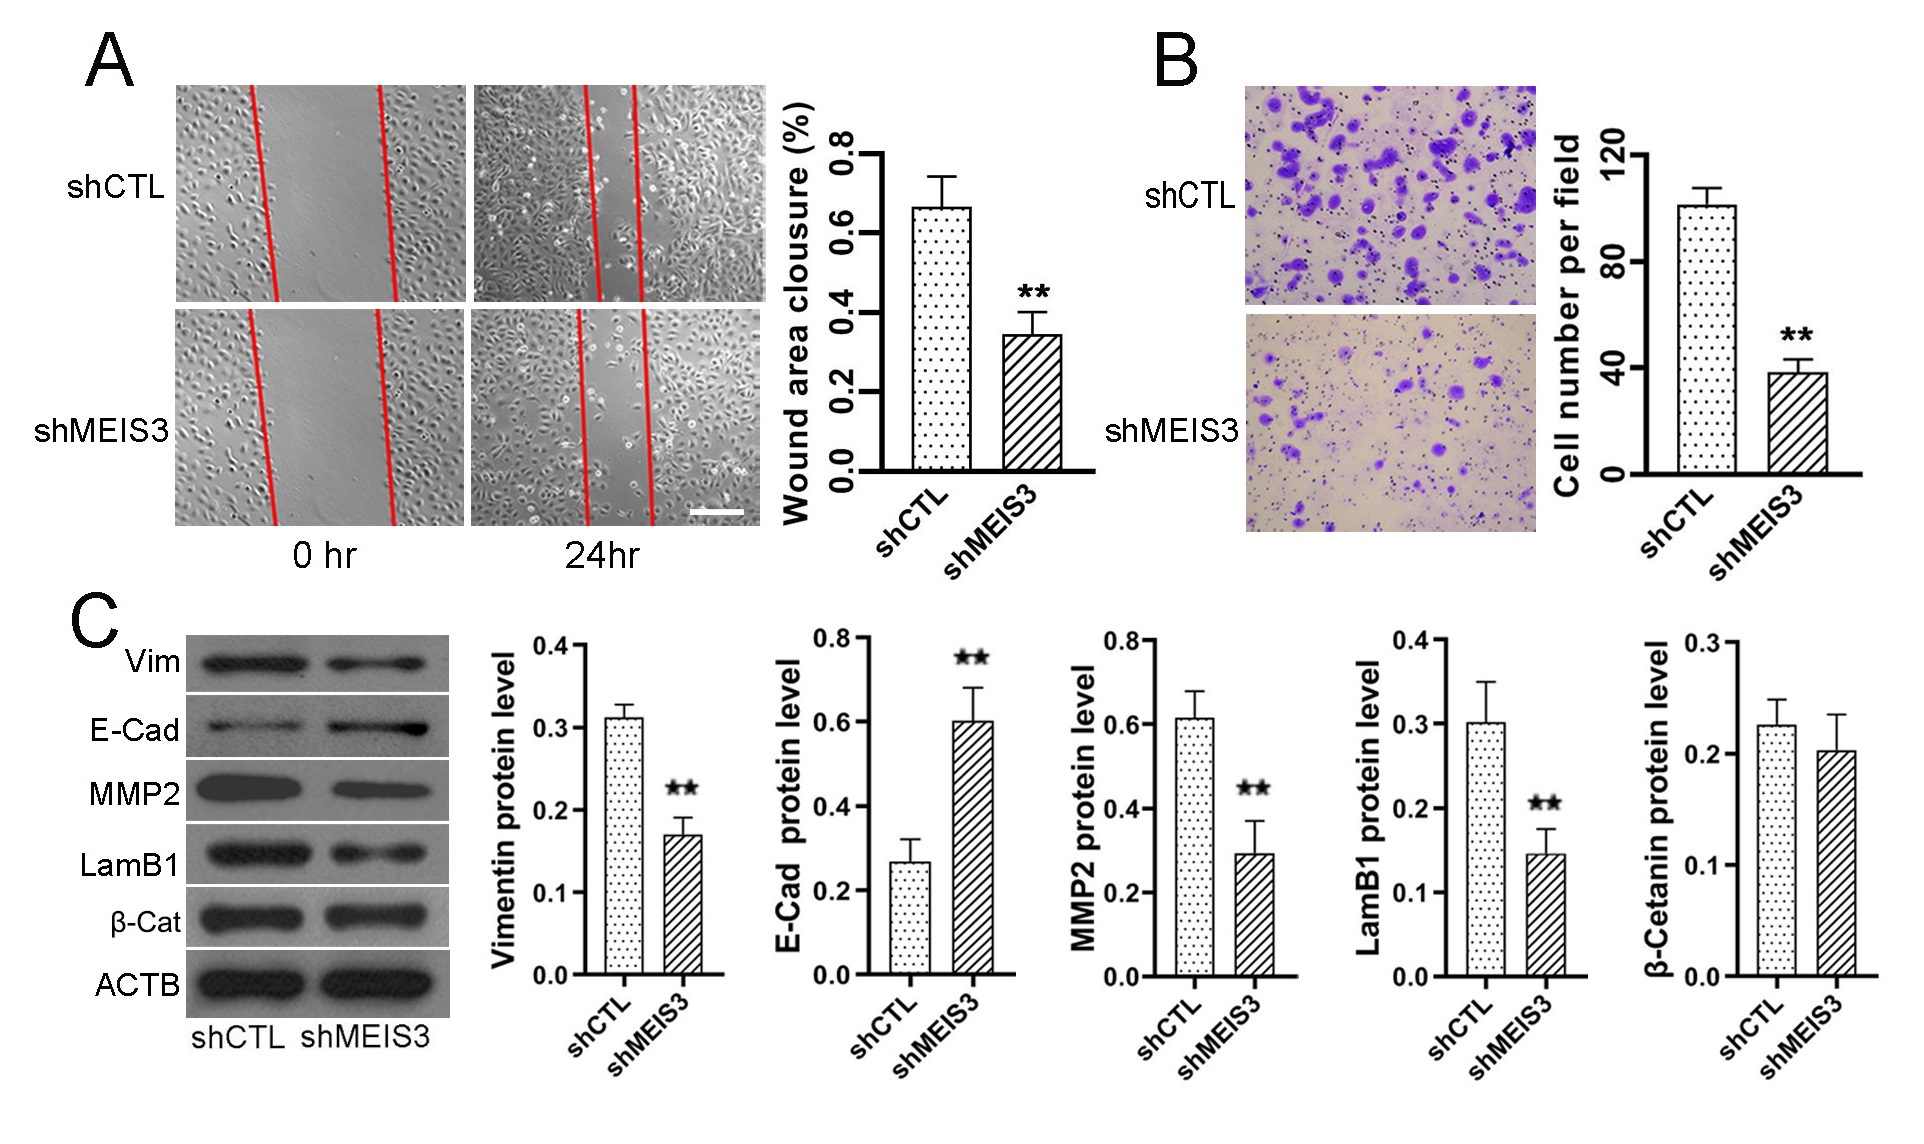 Fig. 3.
Silencing of MEIS3 expression results in a significant decrease
in SW480 cell metastasis. After treatment with lentivirus particles expressing
negative control shRNA or shMEIS3, we analyzed the wound closure area of SW480
cells (A) with the scratch wound healing assay, and crystal violet-stained SW480
cells (B) in transwell analysis and counted the cells. MEIS3 silencing also
resulted in the decreased protein expression of VIM, LamB1, and MMP2, and
increased expression of E-cadherin in SW480 cells (C). **p
The invasion process of cancer cells relies on degrading the surrounding matrix
and penetrating adjacent tissues; thus, we employed Matrigel-covered transwells
to analyze the role of MEIS3 in invasion. When MEIS3 was silenced, the
penetration level of SW480 cells was reduced by 61.8% (Transwell cell number,
shCTL vs. shMEIS3: 101.3
We analyzed the protein expression of LamB1, E-Cadherin, VIM, MMP2, and
Then we made an expression association analysis between MEIS3 and genes that
regulate cancer cell metastasis and proliferation in TCGA cohort on the GEPIA
platform [28]. MEIS3 expression was positively correlated with genes promoting
cell migration and invasion such as VIM (R = 0.78; p
Based on the MEIS3 protein ratio of cancer/para-cancer, CRC patients were
stratified into two groups with equal numbers. We used the Kaplan–Meier curve to
analyze the 5-year DFS of CRC patients. As shown in Fig. 4A, the 5-year DFS of
MEIS3-high and MEIS3-low cohorts were 61.7% and 40.6%, respectively (hazard
ratio [HR] = 2.441, 95% confidence interval [CI]: 1.493–3.989; p
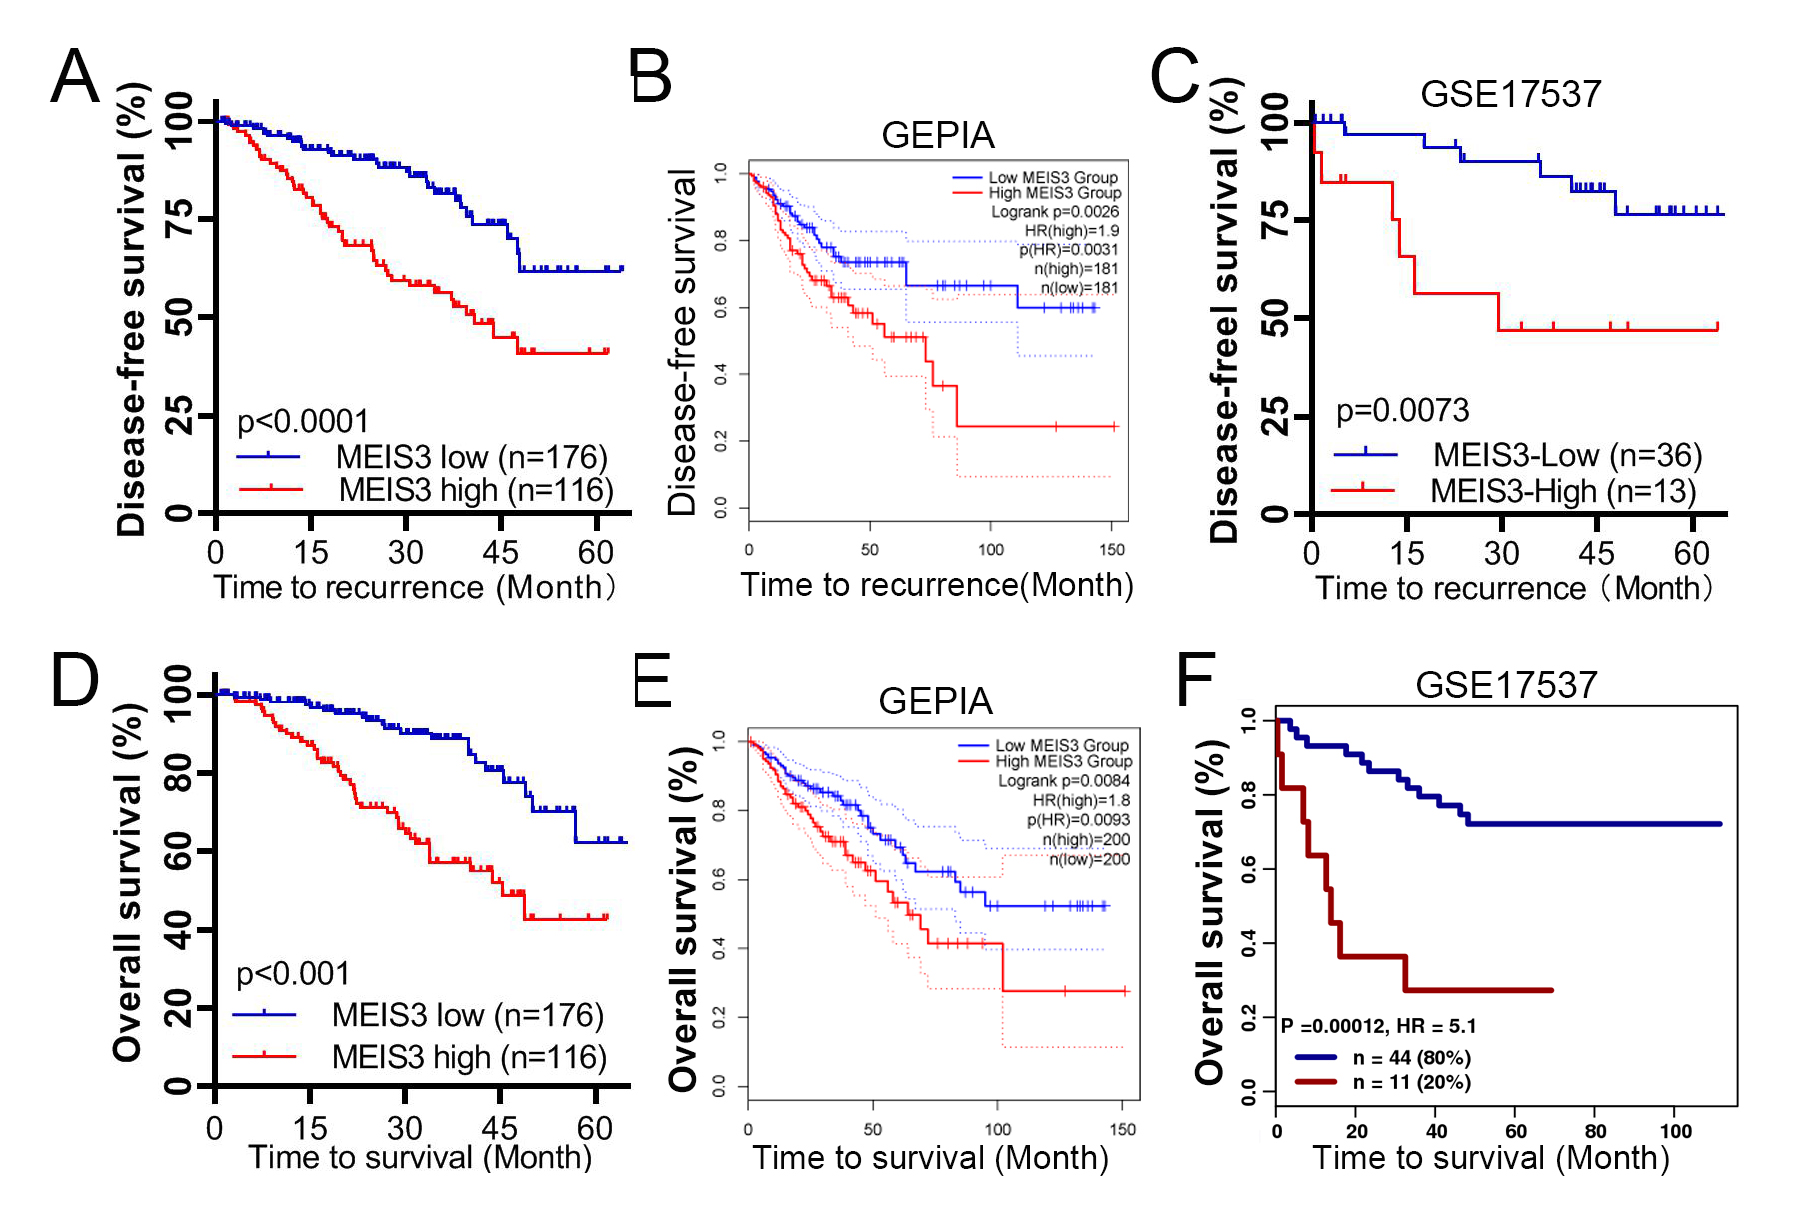 Fig. 4.
Disease-free survival (DFS) and MEIS3 level in CRC patients. The 5-year DFS of our cohort was stratified by MEIS3 level (A) and verified through independent analysis in the Gene Expression Profiling Interactive Analysis (GEPIA) portal (B) and GSE17537 dataset (C). The relationship of 5-year OS of patients and MEIS3 level are shown from our cohort (D), GEPIA platform of TCGA cohort (E), and GSE17537 by GenomicScape portal (F). The blue line indicates the MEIS3-low group, and the red line indicates the MEIS3-high group.
| Variables | MEIS3 High/Low | Percent (%) | 5-Year DFS (%) | Hazard ratio | 95% CI | p-value | |
| Age (years) | |||||||
| 72/91 | 55.8 | 46.3/68.9 | 3.259 | 1.634–6.499 | 0.0008 | ||
| 44/85 | 41.2 | 36.3/53.9 | 2.245 | 1.150–4.384 | 0.0075 | ||
| Sex | |||||||
| Male | 64/89 | 52.4 | 28.1/66.5 | 2.924 | 1.520–5.628 | 0.0005 | |
| Female | 52/87 | 47.6 | 54.2/55.2 | 1.992 | 1.004–3.951 | 0.0378 | |
| Position | |||||||
| Colon | 62/114 | 60.3 | 37.8/67.9 | 2.812 | 1.453–5.443 | 0.0006 | |
| Rectum | 54/62 | 39.7 | 45.3/49.2 | 1.955 | 0.9900–3.862 | 0.0491 | |
| Tumor size (cm) | |||||||
| 61/104 | 56.2 | 51.7/63.3 | 2.205 | 1.175–4.140 | 0.0057 | ||
| 55/72 | 43.8 | 28.4/56.1 | 2.908 | 1.415–5.974 | 0.0021 | ||
| MEIS3 expression | |||||||
| High | 116 | 39.7 | 40.6 | 2.441 | 1.493–3.989 | 0.0001 | |
| Low | 176 | 60.3 | 61.7 | ||||
| AJCC stage | |||||||
| I | 18/29 | 16.1 | 82.1/85.7 | 6.0180 | 0.4402–82.26 | 0.0875 | |
| II | 36/71 | 36.6 | 53.4/67.3 | 2.3870 | 0.9843–5.786 | 0.0123 | |
| III | 43/52 | 32.5 | 30.9/49.5 | 2.8170 | 1.370–5.792 | 0.0038 | |
| IV | 19/24 | 14.7 | 29.9/28.7 | 1.2360 | 0.4973–3.073 | 0.6426 | |
CI, confidence interval; AJCC, The American Joint Committee on Cancer.
To verify these results, we analyzed the DFS of CRC patients from TCGA cohort on the GEPIA platform [28]. The 5-year DFS of the MEIS3-high cohort was significantly lower than that of the MEIS3-low cohort with a cutoff of 50% (p = 0.0026; Fig. 4B). Then we analyzed the GSE17537 cohort from the GEO database and found the same trend (p = 0.0073; Fig. 4C). Therefore, MEIS3 can be employed to independently assess the recurrence risk of CRC patients after surgery.
We also analyzed the 5-year OS rate grouped as the 5-year DFS. The 5-year OS of
the MEIS3-high cohort was 42.6%, which was significantly lower than that of the
MEIS3-low cohort (62.3%; p
Currently, the prognosis for the postoperative recurrence of CRC is predominantly based on clinical stage [1]. We determined whether a more precise prognosis could be made when MEIS3 expression is introduced into the prognosis system. To this end, we performed multivariate analysis according to MEIS3 expression with The American Joint Committee on Cancer (AJCC) stage and other independent factors (Table 1). As shown in Fig. 5, the 5-year DFS of the stage II MEIS3-high cohort was significantly lower than that of the MEIS3-low cohort (53.4% vs. 67.3%, HR = 2.38, 95% CI: 0.9843–5.786; p = 0.0123) (Table 1, Fig. 5B). The 5-year DFS of the stage III MEIS3-high cohort was also significantly lower than that of stage III MEIS3-low cohort (30.9% vs. 49.5%, HR = 2.817, 95% CI: 1.370–5.792; p = 0.0038) (Table 1, Fig. 5C). Moreover, the 5-DFS was comparable between the stage II MEIS3-high cohort and stage III MEIS3-low cohort (53.4% vs. 49.5%; p = 0.23) (Fig. 5E), and between the stage III MEIS3-high cohort and overall stage IV cohort (29.6% and 30.9%; p = 0.7844) (Fig. 5F). However, when grouped by MEIS3 expression, there was no prognostic difference in the sub cohort of stage I and IV patients (Fig. 5A,D, Table 1).
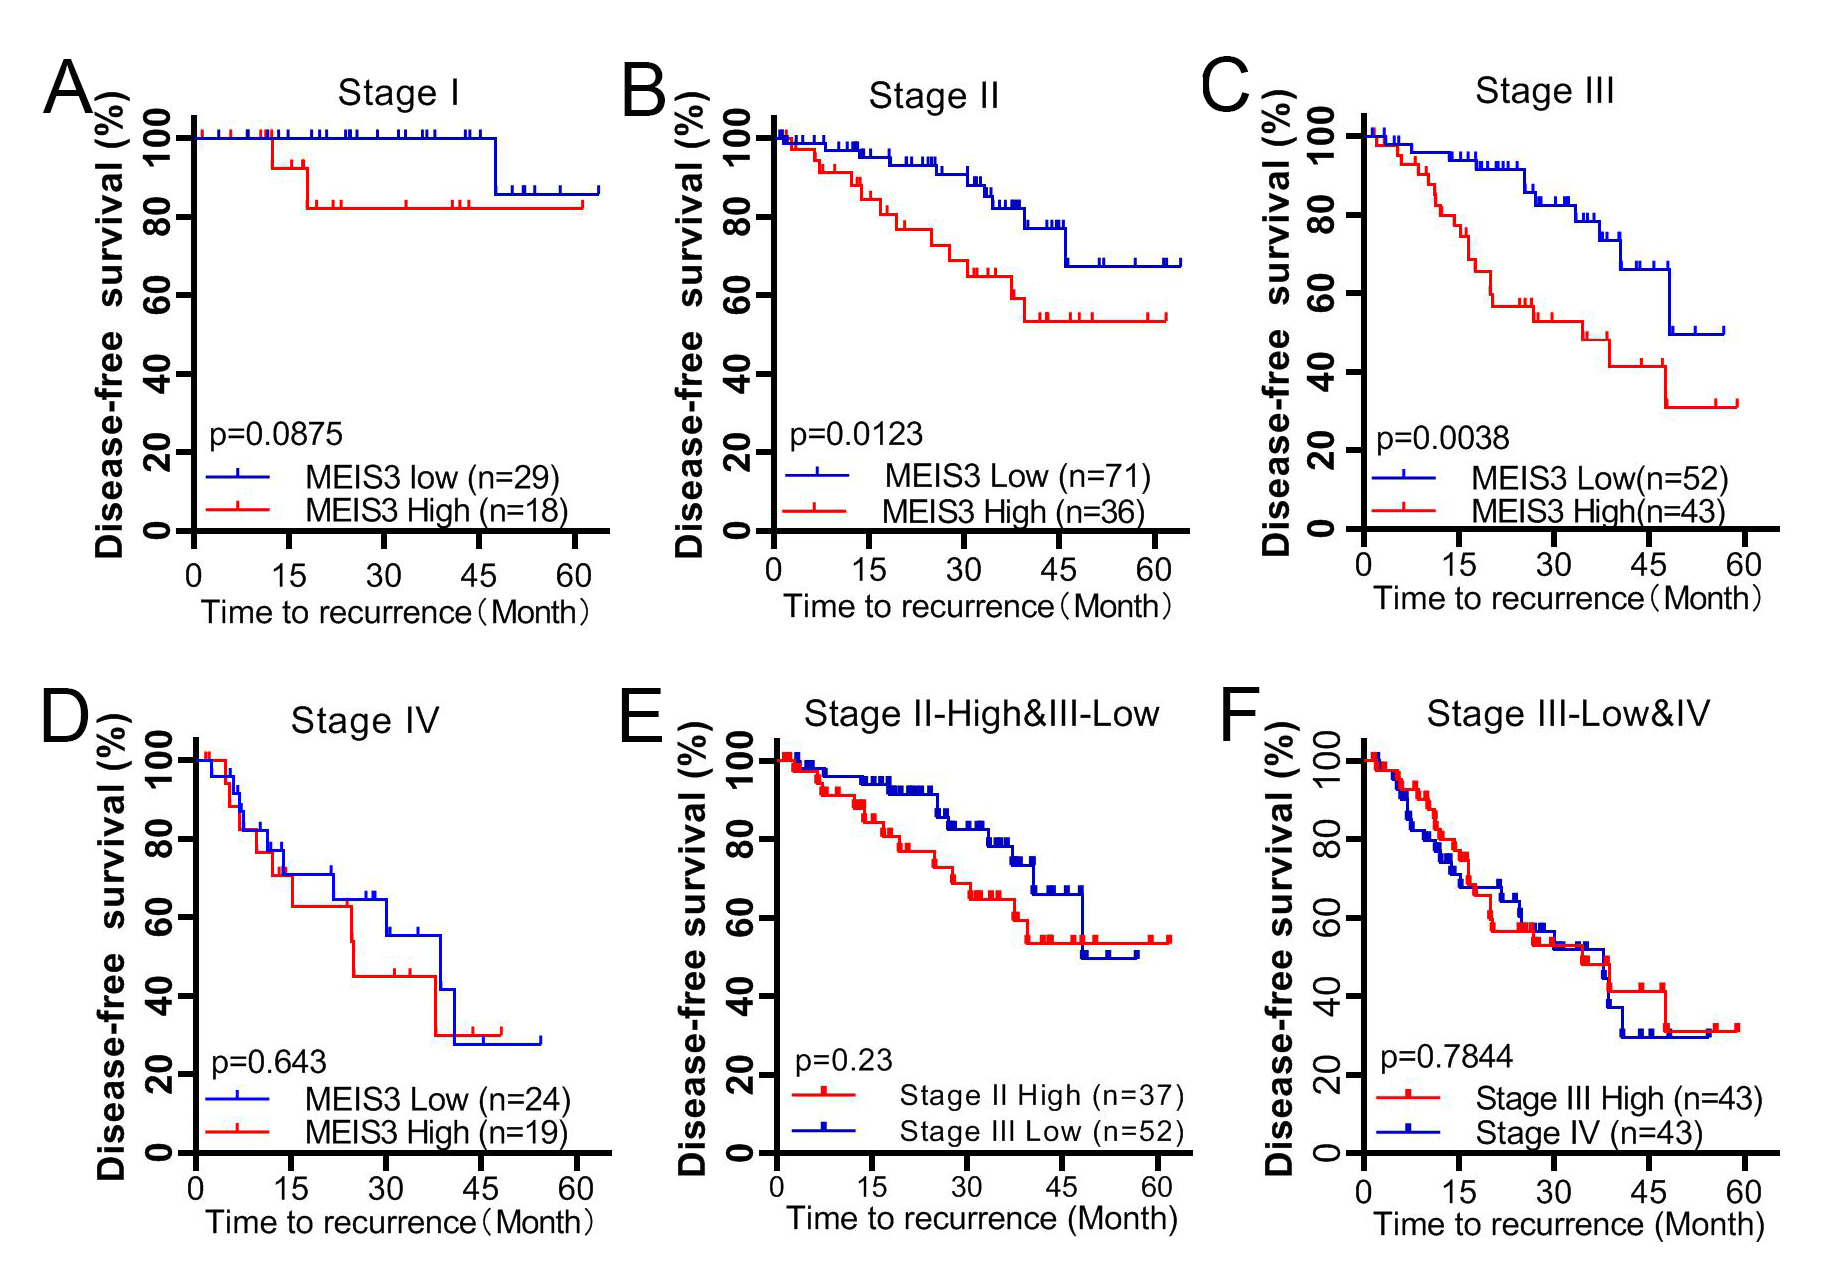 Fig. 5.
DFS in different clinical stages of CRC patients. The 5-year DFS of postoperative CRC patients was stratified by MEIS3 expression according to clinical stage I (A), stage II (B), stage III (C), and stage IV (D). Comparison between the stage II MEIS3-high cohort and stage III MEIS3-low cohort (E), and between the stage III MEIS3-high cohort and stage IV cohort (F).
It is well known that budding and the EMT are common mechanisms in organ development and tumor progression, and play essential roles under orderly regulation [32, 35, 36]. Genes that guide cell migration in organ development also tend to regulate cancer progression. MEIS3 is responsible for promoting neural cell migration into gut tissue during embryonic development [23]. Clinical cases show that the genetic deletion of chromosome 19q13.32 region containing MEIS3 leads to Hirschsprung’s disease, a birth defect of the intestines caused by a congenital developmental disorder [24].
Here, we found that MEIS3 is overexpressed in the invasion front of CRC tissues, especially in tumor budding cells presenting with high metastasis activity [23, 33]. MEIS3 is also highly overexpressed in tumor stroma, which is consistent with the expression characteristics of VIM [32, 37]. High expression of VIM promotes cell invasion, which is one of the hallmark events of both the EMT and tumor budding [37]. Although the transcription of MEIS3 is inhibited bythe protein that has been produced, we found that MEIS3 expression increased with metastatic CRC progression in the CRC and TCGA cohorts [38]. The biomarkers and results of our cohort and TCGA cohort were different, yet they all gradually increased with the decrease in cancer metastasis. Therefore, MEIS3 expression may reflect the metastasis potential in CRC tissue.
MEIS3 is essential for the migration of nerve cells in embryonic gut development [22, 23]. The migration and invasion abilities of CRC cells were significantly reduced upon MEIS3 silencing, confirming the value of this gene in cancer metastasis. These results were also consistent with the MEIS3 expression pattern in CRC tissues, meaning that the IHC signal intensity of MEIS3 in cells with high metastatic activity was stronger than that in active proliferation cells and negative in differentiated tumor stroma cells.
Among the related biological phenomena and molecular mechanisms, E-cadherin and
The survival rate of CRC patients with primary regional diseases has benefited from radical surgical resection; however, distant metastasis often indicates terminal illness and is the primary cause of death [10, 39]. The prognostic diagnosis of recurrence risk is mainly based on the clinical stage, pathological assays, chest X-ray, computed tomography (CT), MRI, and PET, which were the basement to give adjuvant radiotherapy and chemotherapy, targeted drugs, or palliative care [1, 2, 6, 40]. Tumor budding, EMT, and related genes have also been recognized as independent prognostic factors [10, 11, 14].
When stratifying the postoperative patients by MEIS3 level, we found that the DFS and OS of the MEIS3-high cohort were significantly worse than those of the MEIS3-low cohort. These results were also supported by the cohorts from ATGC and GSE17537 [30]. When we stratified stage II/III patients by MEIS3 level, we found that patients could be regrouped. Among stage II patients, the sub cohort with high MEIS3 expression had a similar recurrence risk as stage III patients with low MEIS3 expression, whereas those with low MEIS3 expression had a recurrence risk closer to stage I patients. Similarly, among stage III patients, the recurrence risk of those with high MEIS3 expression was almost the same as that of overall stage IV patients. Thus, when stratified by MEIS3 protein level and clinical stage, we could detect the patients with higher recurrence risk who would not be discovered by current clinical methods. By contrast, carcinoembryonic antigen, carbohydrate antigen 19-9, and other biomarkers are not more discriminative than clinical staging in predicting recurrence after operation [41, 42]. The combination of tumor budding/EMT, functional genes, and clinical stage may effectively screen patients with high recurrence risk.
Open databases and analysis platforms such as TCGA and GEO provided abundant clinical and corresponding gene expression data, most of which are mRNA levels based on gene chips and high-throughput sequencing [28, 29]. This allows our research to be based on a more solid and reliable foundation, although the expression of mRNA and protein is not a simple linear relationship. Our research has benefited from these public platforms, but we need a larger retrospective cohort to study the feasibility of MEIS3 as a biomarker for high recurrence risk before this marker can be applied clinically.
We also found that MEIS3 can promote metastasis by activating functional genes such as LamB1, VIM, and FN1, which play crucial roles in the EMT and tumor budding process [17, 43]. Yet, we do not know the specific regulation process. Additional studies are needed to determine how MEIS3 regulates these genes to understand the specific roles in tumor budding and/or EMT processes.
In summary, we found that MEIS3 plays a crucial role in the tumor budding/EMT of CRC cells, and the high expression of this gene can promote cancer cell metastasis. The highMEIS3 expression in CRC tissues is strongly associated with cancer progression and indicates a poor recurrence risk for stage II/III patients after radical surgery. MEIS3 is expected to be used as a poor prognostic biomarker for CRC patients in the middle stages. Genes that play important roles in the EMT or tumor budding during development, but are low or even quiescent in normal organs, may provide new insights into understanding CRC metastasis and recurrence.
CRC, colorectal cancer; MEIS, myeloid ecotropic viral insertion site; DFS,
disease-free survival; OS, overall survival; MRI, magnetic resonance imaging;
PET, positron emission tomography; EMT, epithelial–mesenchymal transition; TALE,
three amino acid loop extension homeobox; PBX, pre-B cell leukemia; MAPK,
mitogen-activated protein kinase; CSCO, Chinese Society of Clinical Oncology; WB,
Western blotting; IHC, immunohistochemistry; PBS, phosphate-buffered saline;
shCTL, short hairpin control RNA; shMEIS3, short hairpin MEIS3 RNA; LamB1,
laminin subunit beta 1; MMP2, matrix metalloproteinase 2; ACTB,
The datasets used and/or analyzed during the current study are available from the corresponding author on reasonable request.
JM, ZL, XS, and HL made substantial contributions to the conception or design of the work. QG, WZ, CZ, JC, and YL made substantial contributions to the acquisition, analysis, or interpretation of data for the work. JM and HL wrote the manuscript. All authors contributed to revising the manuscript critically for important intellectual content and final approval of the version to be published. All authors have participated sufficiently in the work and agreed to be accountable for all aspects of the work.
Written informed consent was obtained from the individual for the publication of any potentially identifiable images or data included in this article. The studies involving human participants were reviewed and approved by the ethics committee of the Changzhou Tumor Hospital (2017-SY-012). The participants provided their written informed consent to participate in this study.
We would extend our most sincere gratitude to Ang Li from the School of Life Science and Technology, Tongji University, Shanghai, for his valuable suggestions and help in experimental design and technology.
This research was funded by Changzhou Sci&Tech Program, China, with grant number CJ20160049.
The authors declare no conflict of interest.
References
Publisher’s Note: IMR Press stays neutral with regard to jurisdictional claims in published maps and institutional affiliations.