
- Academic Editor
Background: Prostate cancer (PCa) is a prevalent form of malignant tumors affecting the prostate gland and is frequently diagnosed in males in Western countries. Identifying diagnostic and prognostic biomarkers is not only important for screening drug targets but also for understanding their pathways and reducing the cost of experimental verification of PCa. The objective of this study was to identify and validate promising diagnostic and prognostic biomarkers for PCa. Methods: This study implemented a machine learning technique to evaluate the diagnostic and prognostic biomarkers of PCa using protein-protein interaction (PPI) networks. In addition, multi-database validation and literature review were performed to verify the diagnostic biomarkers. To optimize the prognosis of our results, univariate Cox regression analysis was utilized to screen survival-related genes. This study employed stepwise multivariate Cox regression analysis to develop a prognostic risk model. Finally, receiver operating characteristic analysis confirmed that these predictive biomarkers demonstrated a substantial level of sensitivity and specificity when predicting the prognostic survival of patients. Results: The hub genes were UBE2C (Ubiquitin Conjugating Enzyme E2 C), CCNB1 (Cyclin B1), TOP2A (DNA Topoisomerase II Alpha), TPX2 (TPX2 Microtubule Nucleation Factor), CENPM (Centromere Protein M), F5 (Coagulation Factor V), APOE (Apolipoprotein E), NPY (Neuropeptide Y), and TRIM36 (Tripartite Motif Containing 36). All of these hub genes were validated by multiple databases. By validation in these databases, these 10 hub genes were significantly involved in significant pathways. The risk model was constructed by a four-gene-based prognostic factor that included TOP2A, UBE2C, MYL9, and FLNA. Conclusions: The machine learning algorithm combined with PPI networks identified hub genes that can serve as diagnostic and prognostic biomarkers for PCa. This risk model will enable patients with PCa to be more accurately diagnosed and predict new drugs in clinical trials.
Prostate cancer (PCa), the leading cause of cancer-related death in Western countries, predominantly affects men between the ages of 40 and 60 [1, 2]. Early detection of the disease relies greatly on clinical indicators (biomarkers) and drug targets, which are crucial for monitoring disease development and successful therapy. Urinary liquid biopsy is attractive and promising for PCa detection. Apart from the specific biomarkers from urine, potential serum biomarkers that may allow the precision medicine revolution to take place include androgen receptor (AR) variants, bone metabolism, and neuroendocrine and metabolite biomarkers. In the subset of patients with bone metastases, bone sialoprotein (BSP) and osteopontin (OPN) have prognostic value. Higher BSP levels are related to a shorter time to develop bone metastases in patients with PCa. OPN may be useful for assessing the treatment response after chemotherapy in patients with castration-resistant PCa [3]. Older men over age of 50 are most likely to develop PCa. The rate of PCa diagnosis has been increasingly growing, and certain patients may experience extended survival even following the metastasis of cancer to distant locations.
PCa is a heterogeneous disease of the male reproductive system associated with gene aberrations, cellular context, and the environment [4, 5]. Lack of understanding pertaining to the exact molecular mechanisms that drive PCa advancement hampers the potential to effectively manage advanced conditions. Hence, a comprehensive understanding of the PCa biomarkers implicated in the proliferation, apoptosis, and invasion of PCa holds utmost significance for enhancing the efficacy of diagnostic and therapeutic approaches.
Advances in molecular biological, high-throughput platforms, and machine learning techniques have enhanced the identification of novel biomarkers and the screening of potential drug targets for PCa. Germline or somatic aberrations in the DNA damage repair genes are found in 19% of primary PCa and almost 23% of metastatic castration-resistant PCa, and compromise genomic integrity. Patients with breast cancer 2 (BRCA2) pathogenic sequence variants have increased levels of serum prostate-serum albumin (PSA) at diagnosis, an increased proportion of tumors with high Gleason score (GS), elevated rates of nodal and distant metastases, and high recurrence rates. Therapeutically, several poly (ADP-ribose) polymerase inhibitors have been investigated in patients with metastatic castration-resistant PCa and are effective against germline BRCA2-mutant tumors [6]. This study assessed the potential of PCa biomarkers to both diagnose and predict disease status, and evaluated their effectiveness in predicting the response to drugs and the occurrence of treatment-related toxicities. The scope of this research ranged from molecular diagnosis to the classification of cancers at a molecular level. It also encompassed patient stratification, prognosis prediction, and the identification of novel targets for drug development as well as predicting the tumor response [7, 8, 9]. Consequently, high-throughput technologies, such as RNA sequencing (RNA-Seq) and microarray, have made it possible to identify PCa biomarkers for tumor prognosis in the development and progression of PCa. The integration of a machine learning approach with RNA-Seq data for PCa analysis is proving to be significant in unraveling the intricacy of the transcriptome [10, 11]. RNA-Seq technology possesses numerous distinctive benefits including elevated sensitivity. However, it also has several novel challenges, the most notable of which involves the management of voluminous data. Despite the potential of machine learning technology to diminish superfluous and unrelated information, it necessitates substantial computational resources. Following years of advancement, microarrays have established a comprehensive framework, approach, and utilities. Consequently, microarray data can now be analyzed utilizing a personal computer, instead of relying on a workstation.
In this study, two types of microarray datasets, GSE6919 (public on Jan. 30, 2007) and GSE30174 (public on Dec. 21, 2012), were obtained from Gene Expression Omnibus (http://www.ncbi.nlm.nih.gov/geo/). Then differentially expressed genes (DEGs) associated with PCa were calculated. Subsequently, the results of hub genes were generated by a machine learning algorithm and visualized by Cytoscape software (version 3.5.1, University of California San Diego, 9500 GilmanDrive, LaJolla, CA, USA). Finally, 10 candidate hub genes were found to be associated with PCa. Gene Ontology (GO) and pathway enrichment analyses were performed by Gene Set Enrichment Analysis (GSEA). By examining the biological functions and pathways, potential biomarkers that could be used for diagnosis, prognosis, and as drug targets can be identified and explored. Finally, all of these target genes and drug targets were validated by different types of bioinformatics database.
Graphs such as molecules, atoms, and proteins are considered chemical bonds and nodes are treated as edges. Numerous strategies have been suggested to carry out the classification of nodes, classification of graphs, and generation of graphs with the aim of focusing on molecular/protein graphs to anticipate molecular characteristics [12] and deduce protein interfaces [13]. In this short review, we discuss graph application on biological function prediction. There are three primary categories of graph embedding methods: factorization-based, random walks-based, and deep learning-based methods [14, 15, 16].
Analyzing key biomarkers in disease progression can benefit from the utilization of various algorithms that carry out intricate graph mining tasks. Some algorithms are semi-supervised learning for node-level classification [17], supervised learning for graph-level classification [18], and unsupervised learning for graph embedding [19]. We identified the diagnostic and prognostic biomarkers associated with PCa using the graph autoencoder (GAE) algorithm. Then prognostic biomarkers were verified in The Cancer Genome Atlas (TCGA) and Gene Expression Omnibus (GEO) dataset. TCGA, a landmark cancer genomics program, molecularly characterized over 20000 primary cancer and matched normal samples spanning 33 cancer types. The methodology employed in this study is presented in Fig. 1.
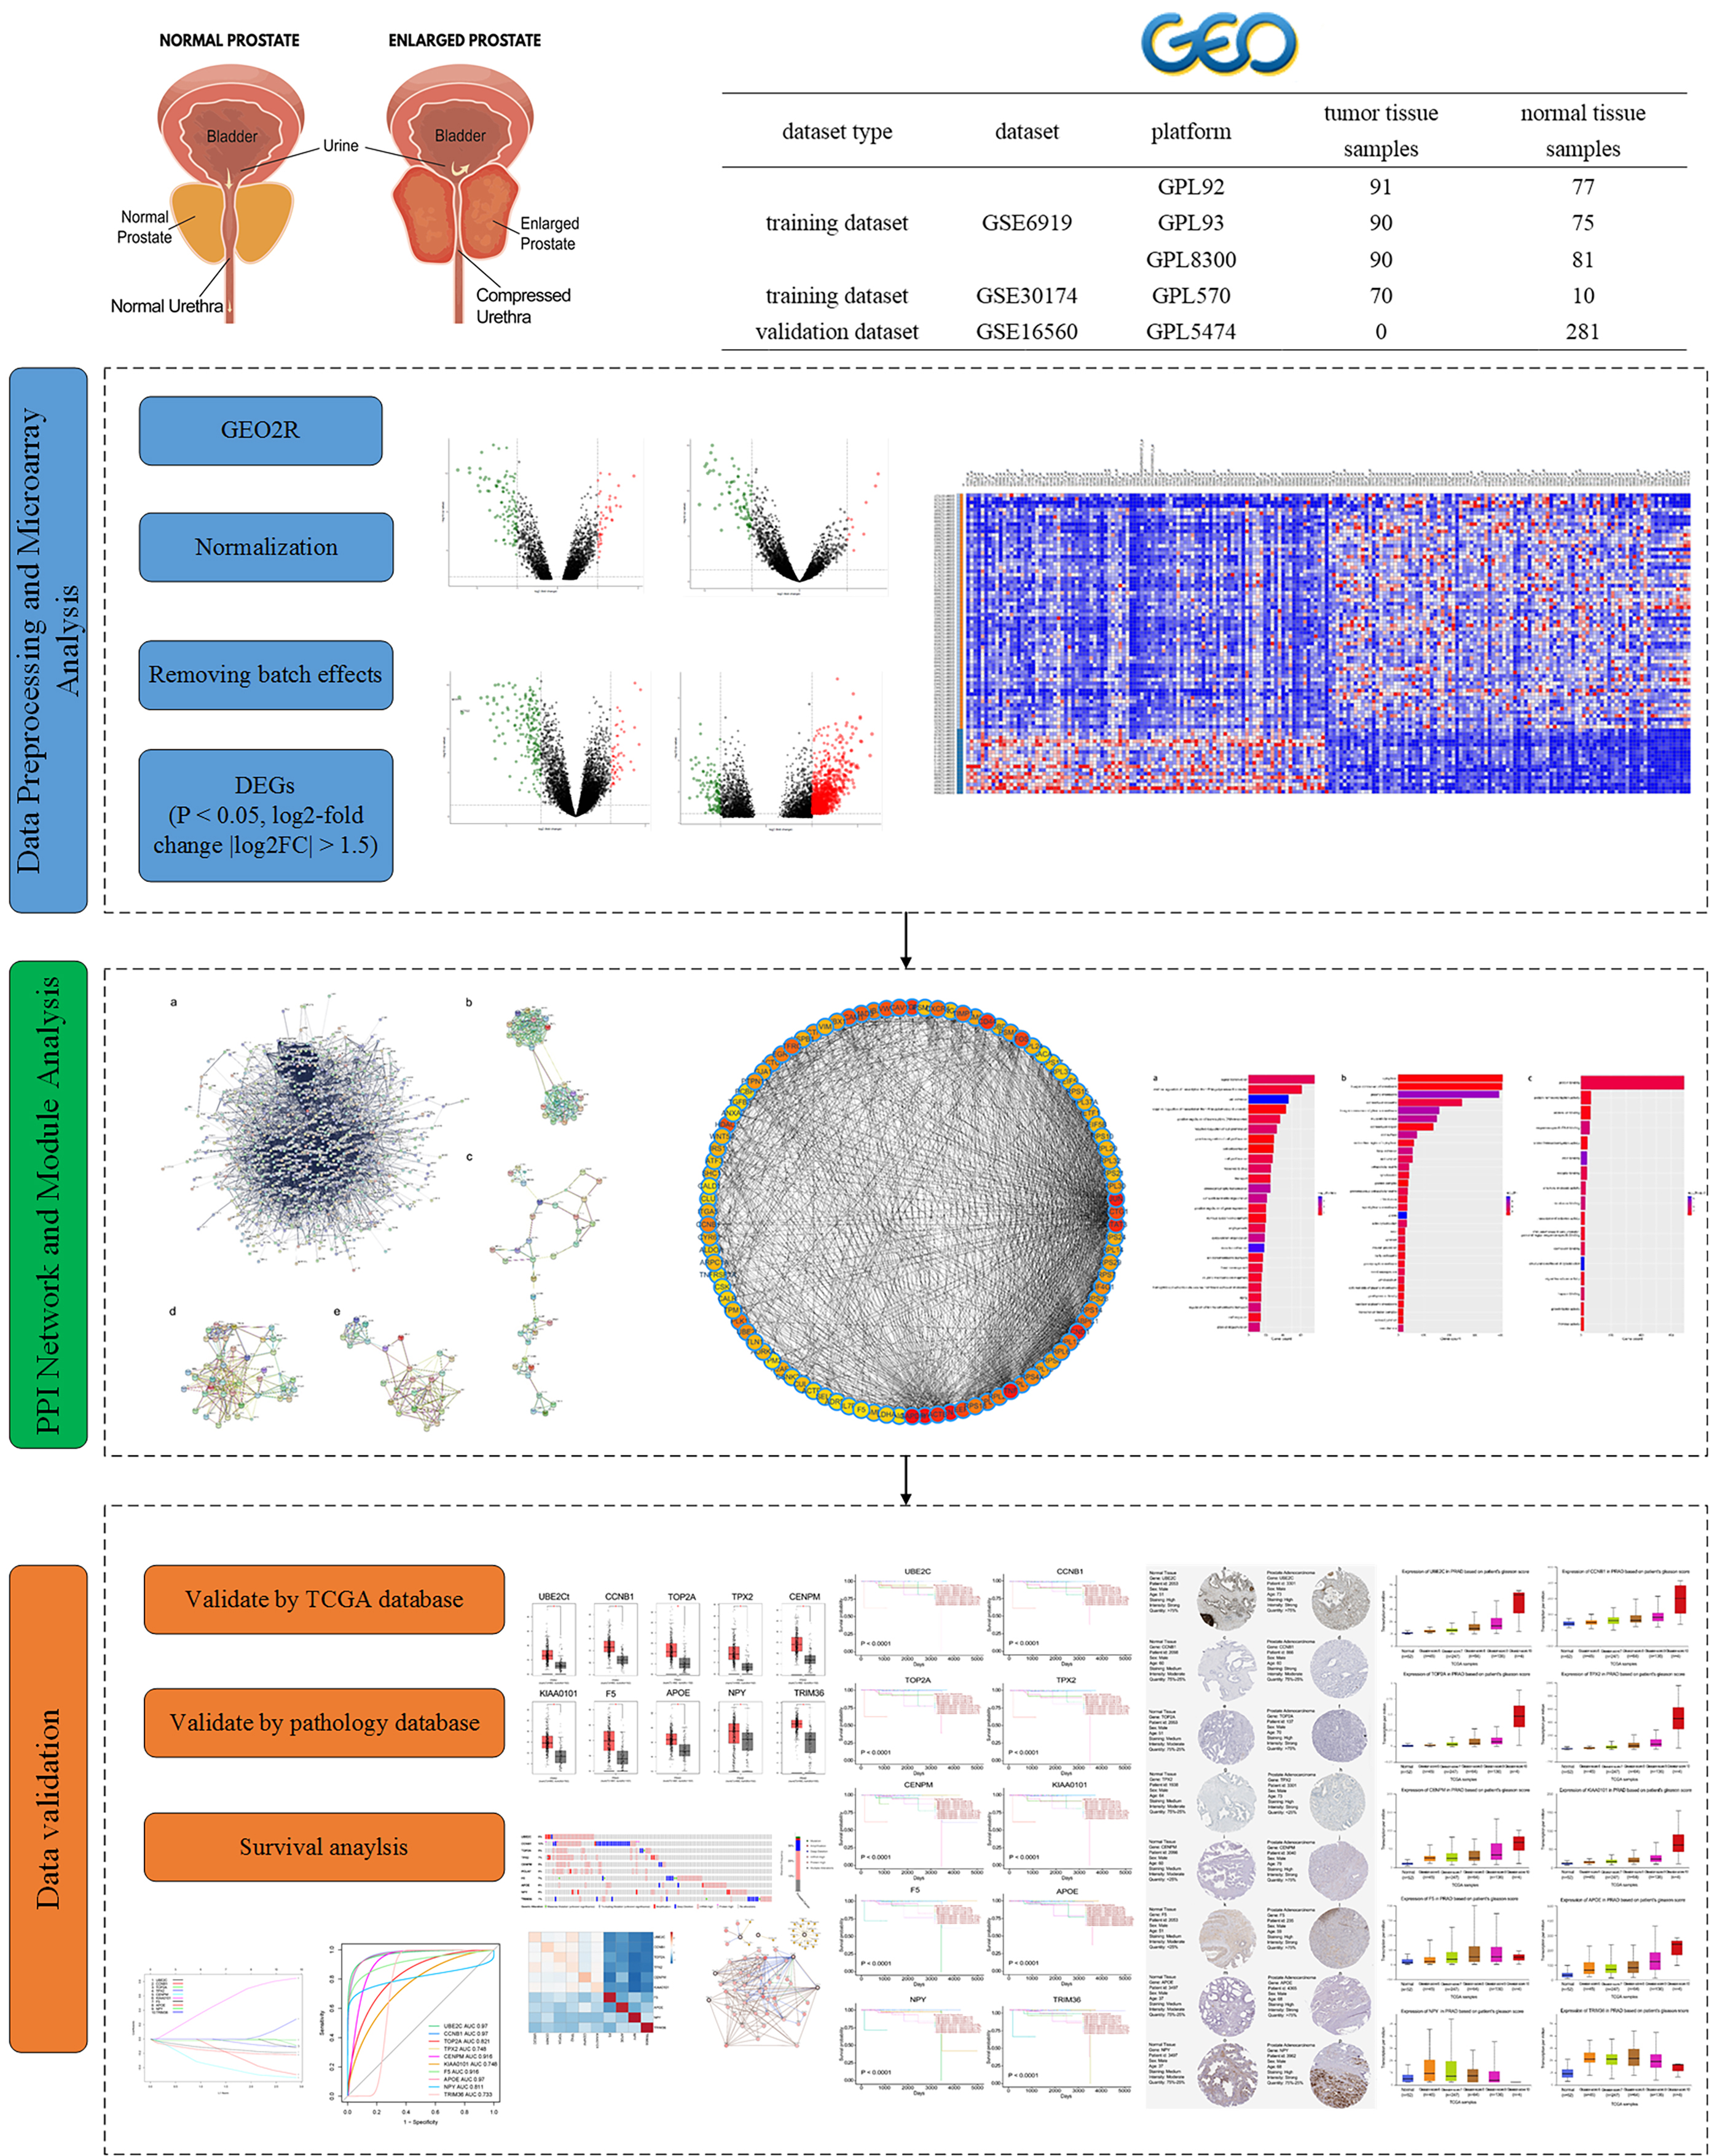 Fig. 1.
Workflow for identifying hub genes and drug targets in prostate cancer. TCGA, The Cancer Genome Atlas; DEGs, differentially expressed genes; PPI, protein–protein interaction.
Definition 1. Let graph G
(V, E) denote a graph with a collection of protein nodes, where
Definition 2. Given graph G (V, E), graph embedding is a mapping
Each node in the graph embedding could be mapped to a low-dimensional feature vector.
Three cohorts were utilized in our study; the descriptions of these cohorts are as follows. GSE6919 and GSE30174 were obtained from the GEO database as training datasets. GSE6919 was based on the Agilent GPL92, GPL93, and GPL8300 platforms (Affymetrix Human Genome U95 Version 2 Array), submitted by Federico Alberto Monzon (2018). The GSE6919 dataset contained 504 samples, including 233 normal prostate tissues and 271 metastatic prostate tumors. GSE30174 was based on the GPL570 platform (Affymetrix Human Genome U133 Plus 2.0 Array), submitted by Jennifer Barb (2019). The GSE30174 dataset contained 80 samples, including 10 healthy peripheral blood and 70 non-metastatic prostate tumors. GSE16560 as a validation dataset was based on the GPL5474 platform (Human 6k Transcriptionally Informative Gene Panel for DASL), submitted by Andrea Sboner (2013), contained 281 samples including primary prostate tumors ordered by different GS. Dataset information is summarized in Table 1.
| Dataset type | Dataset | Platform | Tumor samples | Normal samples |
| Training | GSE6919 | GPL92 | 91 | 77 |
| GPL93 | 90 | 75 | ||
| GPL8300 | 90 | 81 | ||
| GSE30174 | GPL570 | 70 | 10 | |
| Validation | GSE16560 | GPL5474 | 0 | 281 |
PCa, Prostate cancer.
All of the training datasets were analyzed using the online tool GEO2R. Then the
DEGs were calculated using the limma R package (version 3.36.5, WEHI
Bioinformatics, Bundoora, Victoria, Australia) between normal and tumor samples
[20]. Multiple testing was corrected by the
Benjamini and Hochberg (BH) [21] method to obtain the adjusted p value.
The cutoff values for screening DEGs were set at an adjusted p
GO analysis is a widely used technique for annotating genes and gene products to identify the biological process (BP), cellular component (CC), and molecular function (MF) [22]. The Kyoto Encyclopedia of Genes and Genomes (KEGG) database serves as a valuable resource for systematically analyzing gene functions and connecting genomic information with higher level functional information [23]. To ensure the success of any high-throughput gene functional analysis, it is crucial to map the user’s genes to the appropriate biological annotations within the Database for Annotation, Visualization, and Integrated Discovery (DAVID) database [24]. This serves as a foundational step for the analysis process.
To construct a graph-embedding network based on the PPI network extracted from
gene expression profile data, the Search Tool for the Retrieval of Interacting
Genes (STRING) database was utilized to transform gene expression data into
vector input. To assess the interactive associations among DEGs, we carried out
mapping of the DEGs onto STRING database, exclusively considering experimentally
confirmed interactions with a combined score
In this paper, we employed an unsupervised learning framework known as GAEs (graph autoencoders) to encode graphs or nodes into a latent vector space, and subsequently reconstructed the graph data based on the encoded information. GAEs can encode the node features and graph construction into the latent representations and decode the graph construction. So GAEs are suitable to acquire knowledge on network embedding and graph generative distributions from PPI nodes. Regarding network embedding, GAEs primarily focus on learning representations of protein nodes through the PPI graph’s structural characteristics such as the graph adjacency matrix. Regarding graph generation, diverse approaches exist, including step-by-step generation of nodes and edges or the simultaneous generation of an entire graph. Finally, the GAE results were visualized by Cytoscape software.
To assess the validity of the hub genes and drug targets identified in the training dataset, cross-validation was conducted utilizing the merged databases. The databases utilized in this study are listed in Table 2 (Ref. [27, 28, 29, 30, 31, 32, 33, 34, 35, 36, 37, 38, 39]).
| Dataset name | Data link | References |
| GEPIA | http://gepia.cancer-pku.cn/ | [27] |
| Human Protein Atlas | https://www.proteinatlas.org/ | [28, 29, 30] |
| cBioProtal | https://www.cbioportal.org/ | [31, 32] |
| GTEx | https://www.gtexportal.org/home/ | [33] |
| Ualcan | http://ualcan.path.uab.edu/ | [34] |
| Oncomine | https://www.oncomine.org/ | [35] |
| DrugBank | https://www.drugbank.ca/ | [36] |
| systemsDock | http://systemsdock.unit.oist.jp/ (accessed November 2022) | [37, 38] |
| GTEx | https://gtexportal.org/home/ | [39] |
GEPIA, Gene Expression Profiling Interactive Analysis; GTEx, Genotype-Tissue Expression.
Evaluation of the performance of GAEs for 10 hub genes was performed by receiver operating characteristic (ROC) analysis (Supplementary Material 1).
To further investigate
the relationship between patient overall survival (OS) and the expression levels
of individual hub genes, univariate Cox analysis [40, 41] was carried out to
construct a prognostic model of PCa. The survival and survminer R package [42]
were utilized for this analysis. The screened genes with p
ROC analysis was performed to assess the prognostic risk model, and the area under the curve (AUC) was calculated. The performance of the prognostic risk model was then validated using the GEO dataset GSE16560.
After data preprocessing, 6269 of 26,696 DEGs were identified; the top 200 DEGs included 153 upregulated genes and 47 downregulated genes (Supplementary Fig. 1). The DEGs are shown in Supplementary Fig. 2.
To identify overrepresented GO categories and KEGG pathways, the obtained DEGs were subjected to analysis using the online software DAVID. The GO analysis results (Supplementary Material 2) revealed the significant enrichment of DEGs in various BPs such as signal transduction, positive regulation of transcription from RNA polymerase II promoter, and cell adhesion (Fig. 2a). Furthermore, GO analysis demonstrated the significant enrichment of DEGs in cellular compartments such as the cytoplasmic vesicle membrane, integral component of membrane, and plasma membrane (Fig. 2b). Regarding the MF, the DEGs showed enrichment in protein binding, protein homodimerization, and calcium ion binding (Fig. 2c). The overall distribution of the GO results are shown in Supplementary Fig. 3.
 Fig. 2.
Significant enriched genes. (a) Biological process. (b) Cellular component. (c) Molecular function.
Table 3 presents the enriched pathways of the upregulated and downregulated DEGs. These pathways were analyzed using KEGG analysis. The upregulated DEGs demonstrated enrichment in pathways such as the cell cycle, DNA replication, progesterone-mediated oocyte maturation, p53 signaling pathway, and extracellular matrix (ECM)–receptor interaction. Conversely, the downregulated DEGs exhibited enrichment in pathways including drug metabolism, metabolism of xenobiotics by cytochrome P450, retinol metabolism, hematopoietic cell lineage, and calcium signaling. The results of KEGG enrichment analysis conducted by GSEA [44] is shown in Supplementary Fig. 4. All of the upregulated genes were significantly enriched in dilated cardiomyopathy, hypertrophic cardiomyopathy, ECM–receptor interaction, arrhythmogenic right ventricular cardiomyopathy, focal adhesion, and the transforming growth factor beta signaling pathway.
| Pathway | Count | p-value |
| Dilated cardiomyopathy | 23 | 1.28 |
| Hypertrophic cardiomyopathy | 19 | 1.25 |
| ECM-receptor interaction | 19 | 6.00 |
| Proteoglycans in cancer | 31 | 1.72 |
| Arrhythmogenic right ventricular cardiomyopathy | 15 | 3.51 |
| Morphine addiction | 18 | 3.52 |
| Adrenergic signaling in cardiomyocytes | 23 | 5.37 |
| Amoebiasis | 19 | 7.92 |
| Insulin secretion | 16 | 0.001420903 |
| GABAergic synapse | 16 | 0.001420903 |
| Pathways in cancer | 46 | 0.002427201 |
| Retrograde endocannabinoid signaling | 17 | 0.003179689 |
| Tyrosine metabolism | 9 | 0.003610174 |
| Focal adhesion | 27 | 0.005655205 |
| Vascular smooth muscle contraction | 18 | 0.00596106 |
| Phenylalanine metabolism | 6 | 0.006699088 |
| Transforming growth factor beta signaling pathway | 14 | 0.009099806 |
KEGG, Kyoto Encyclopedia of Genes and Genomes; ECM, Ecm-receptor-interaction.
All DEGs were uploaded to the STRING database, with the analysis results shown in Supplementary Fig. 5. Based on the information available in the STRING database, a total of 6475 nodes were identified in topological form. In this paper, we present the illustrated GAEs, which utilize an encoder for extracting network embeddings and employ a decoder to ensure the preservation of nodes’ topological information through the adjacency matrix [45] as:
Where
The top 100 genes generated by GAEs are visualized in Supplementary Fig.
6. The significantly upregulated genes were ubiquitin-conjugating enzyme E2C
(UBE2C), cyclin B1 (CCNB1), topoisomerase II
| Expression | Gene | Score | Expression | Protein-protein interaction (PPI) module |
| Upregulated | UBE2C | 207 | up | module 1 |
| CCNB1 | 138 | up | module 1 | |
| TOP2A | 138 | up | module 1 | |
| TPX2 | 121 | up | module 1 | |
| CENPM | 103 | up | module 1 | |
| F5 | 97 | up | module 3 | |
| APOE | 96 | up | module 3 | |
| NPY | 85 | up | module 2 | |
| TRIM36 | 78 | up | module 4 | |
| Downregulated | MYH11 | 31 | down | module 1 |
| FLNA | 31 | down | module 1 | |
| ACTA2 | 31 | down | module 2 | |
| MYL9 | 27 | down | module 2 | |
| TAGLN | 22 | down | module 3 | |
| ACTG2 | 22 | down | module 4 |
UBE2C, Ubiquitin Conjugating Enzyme E2 C; CCNB1, Cyclin B1; TOP2A, DNA Topoisomerase II Alpha; TPX2, TPX2 Microtubule Nucleation Factor; CENPM, Centromere Protein M; F5, Coagulation Factor V; APOE, Apolipoprotein E; NPY, Neuropeptide Y; TRIM6, Tripartite Motif Containing 36; MYH11, Myosin Heavy Chain 11; FLNA, Filamin A; ACTA2, Actin Alpha 2, Smooth Muscle; MYL9, Myosin Light Chain 9; TAGLN, Transgelin; ACTG2, Actin Gamma 2, Smooth Muscle.
To conduct deeper exploration of the potential hub genes, validation of these findings was carried out using the Gene Expression Profiling Interactive Analysis database. The results obtained from this analysis are illustrated in Fig. 3. Notably, the hub genes demonstrated distinct significance in both the tumor and normal groups.
 Fig. 3.
Validation of hub genes by Gene Expression Profiling Interactive Analysis (red: tumor sample; grey: normal sample). PRAD, Prostate adenocarcinoma.
To confirm the hub gene expression among various cancers, the Oncomine database
was employed to evaluate the expression of hub genes in tumor and normal tissues.
By employing the criteria of p
 Fig. 4.
Validation of hub genes in the Oncomine database.
Some of the downregulated hub genes were enriched in ACTG2, MYH11, MYL9, FLNA, TAGLN, and ACTA2, which were validated by the Genotype-Tissue Expression database (Fig. 5). Genotype-Tissue Expression (GTEx) Program established a data resource and tissue bank to study the relationship between genetic variants and gene expression in multiple human tissues.
 Fig. 5.
Significant downregulated genes in the Genotype-Tissue Expression (GTEx) database.
The Human Protein Atlas database was utilized for the validation of hub genes (Fig. 6). However, there was no pathology results for TRIM36 in this database.
 Fig. 6.
Validation of the hub genes was performed using the Human Protein Atlas database.
Given the crucial role of hub genes in PCa, we analyzed the role of hub genes in predicting OS in PCa using univariate Cox regression analysis. Our findings revealed that nine genes exhibited a significant association with OS in patients with PCa (Table 5).
| Gene | Coef | (Hazard Ratio) HR | (Confidence Interval) CI | p-value | Regulation |
| TPX2 | 0.5047 | 1.656432 | 1.023110–2.681788 | 0.0040816 | up |
| CENPM | 0.2255 | 1.252922 | 0.7103220–2.210004 | 0.4361504 | up |
| NPY | –0.1172 | 0.889405 | 0.7681821–1.029757 | 0.1169458 | up |
| APOE | 0.0829 | 1.086374 | 0.663267–1.779384 | 0.7420967 | up |
| TOP2A | 0.3193 | 1.376153 | 0.903891–2.095159 | 0.1365386 | up |
| CCNB1 | 0.422 | 1.524966 | 0.7778998–2.989488 | 0.2191977 | up |
| TRIM36 | 0.2853 | 1.330103 | 0.5813955–3.042977 | 0.4993109 | up |
| UBE2C | 0.4762 | 1.610022 | 1.052690–2.462424 | 0.0080329 | up |
| F5 | 0.1178 | 1.125063 | 0.8306933–1.523748 | 0.4464131 | up |
| MYL9 | –0.386 | 0.679401 | 0.4523929–1.020319 | 0.0624607 | down |
| ACTA2 | –0.3975 | 0.671972 | 0.425578–1.061018 | 0.0880427 | down |
| MYH11 | –0.301 | 0.740083 | 0.5300268–1.033387 | 0.0772040 | down |
| TAGLN | –0.3541 | 0.701817 | 0.4527059–1.088007 | 0.0034455 | down |
| ACTG2 | –0.3208 | 0.725560 | 0.5270065–0.9989209 | 0.0492314 | down |
| FLNA | –0.3015 | 0.739676 | 0.4698100–1.164557 | 0.1928742 | down |
TPX2, TPX2 Microtubule Nucleation Factor; CENPM, Centromere Protein M; NPY, Neuropeptide Y; APOE, Apolipoprotein E; TOP2A, DNA Topoisomerase II Alpha; CCNB1, Cyclin B1; TRIM6, Tripartite Motif Containing 36; UBE2C, Ubiquitin Conjugating Enzyme E2 C; F5, Coagulation Factor V; MYL9, Myosin Light Chain 9; ACTG2, Actin Gamma 2, Smooth Muscle; MYH11, Myosin Heavy Chain 11; TAGLN, Transgelin; ACTA2, Actin Alpha 2, Smooth Muscle; FLNA, Filamin A.
Finally, a stepwise multivariate Cox proportional hazards model was constructed (Table 6), and four genes were selected to build the following risk model:
| Gene | Coef | (Hazard Ratio) HR | (Confidence Interval) CI | p-value |
| TOP2A | –0.5663 | 0.567603 | 0.547639–0.867957 | 0.00276814 |
| UBE2C | –1.2489 | 0.28680 | 0.181526–0.318121 | 0.00694469 |
| MYL9 | –1.4976 | 0.22372 | 0.201772–0.499484 | 0.00732035 |
| FLNA | –0.9500 | 0.38651 | 0. 203403–0.479835 | 0.00419485 |
TPX2, TPX2 Microtubule Nucleation Factor; UBE2C, Ubiquitin Conjugating Enzyme E2 C; MYL9, Myosin Light Chain 9; FLNA, Filamin A.
Risk scores were computed for every patient in the training group, and subsequently, the patients were categorized into high- and low-risk groups. Fig. 7 illustrates the Kaplan–Meier OS curves, which clearly demonstrated that patients with high-risk scores exhibited markedly distinct survival outcomes compared to those with low-risk scores. The AUC values of the four-gene biomarker prognostic model at 1, 3, and 5 years were 0.973, 0.793, and 0.66, respectively (Fig. 8).
 Fig. 7.
Kaplan–Meier plots for biomarkers in the high- and low risk groups.
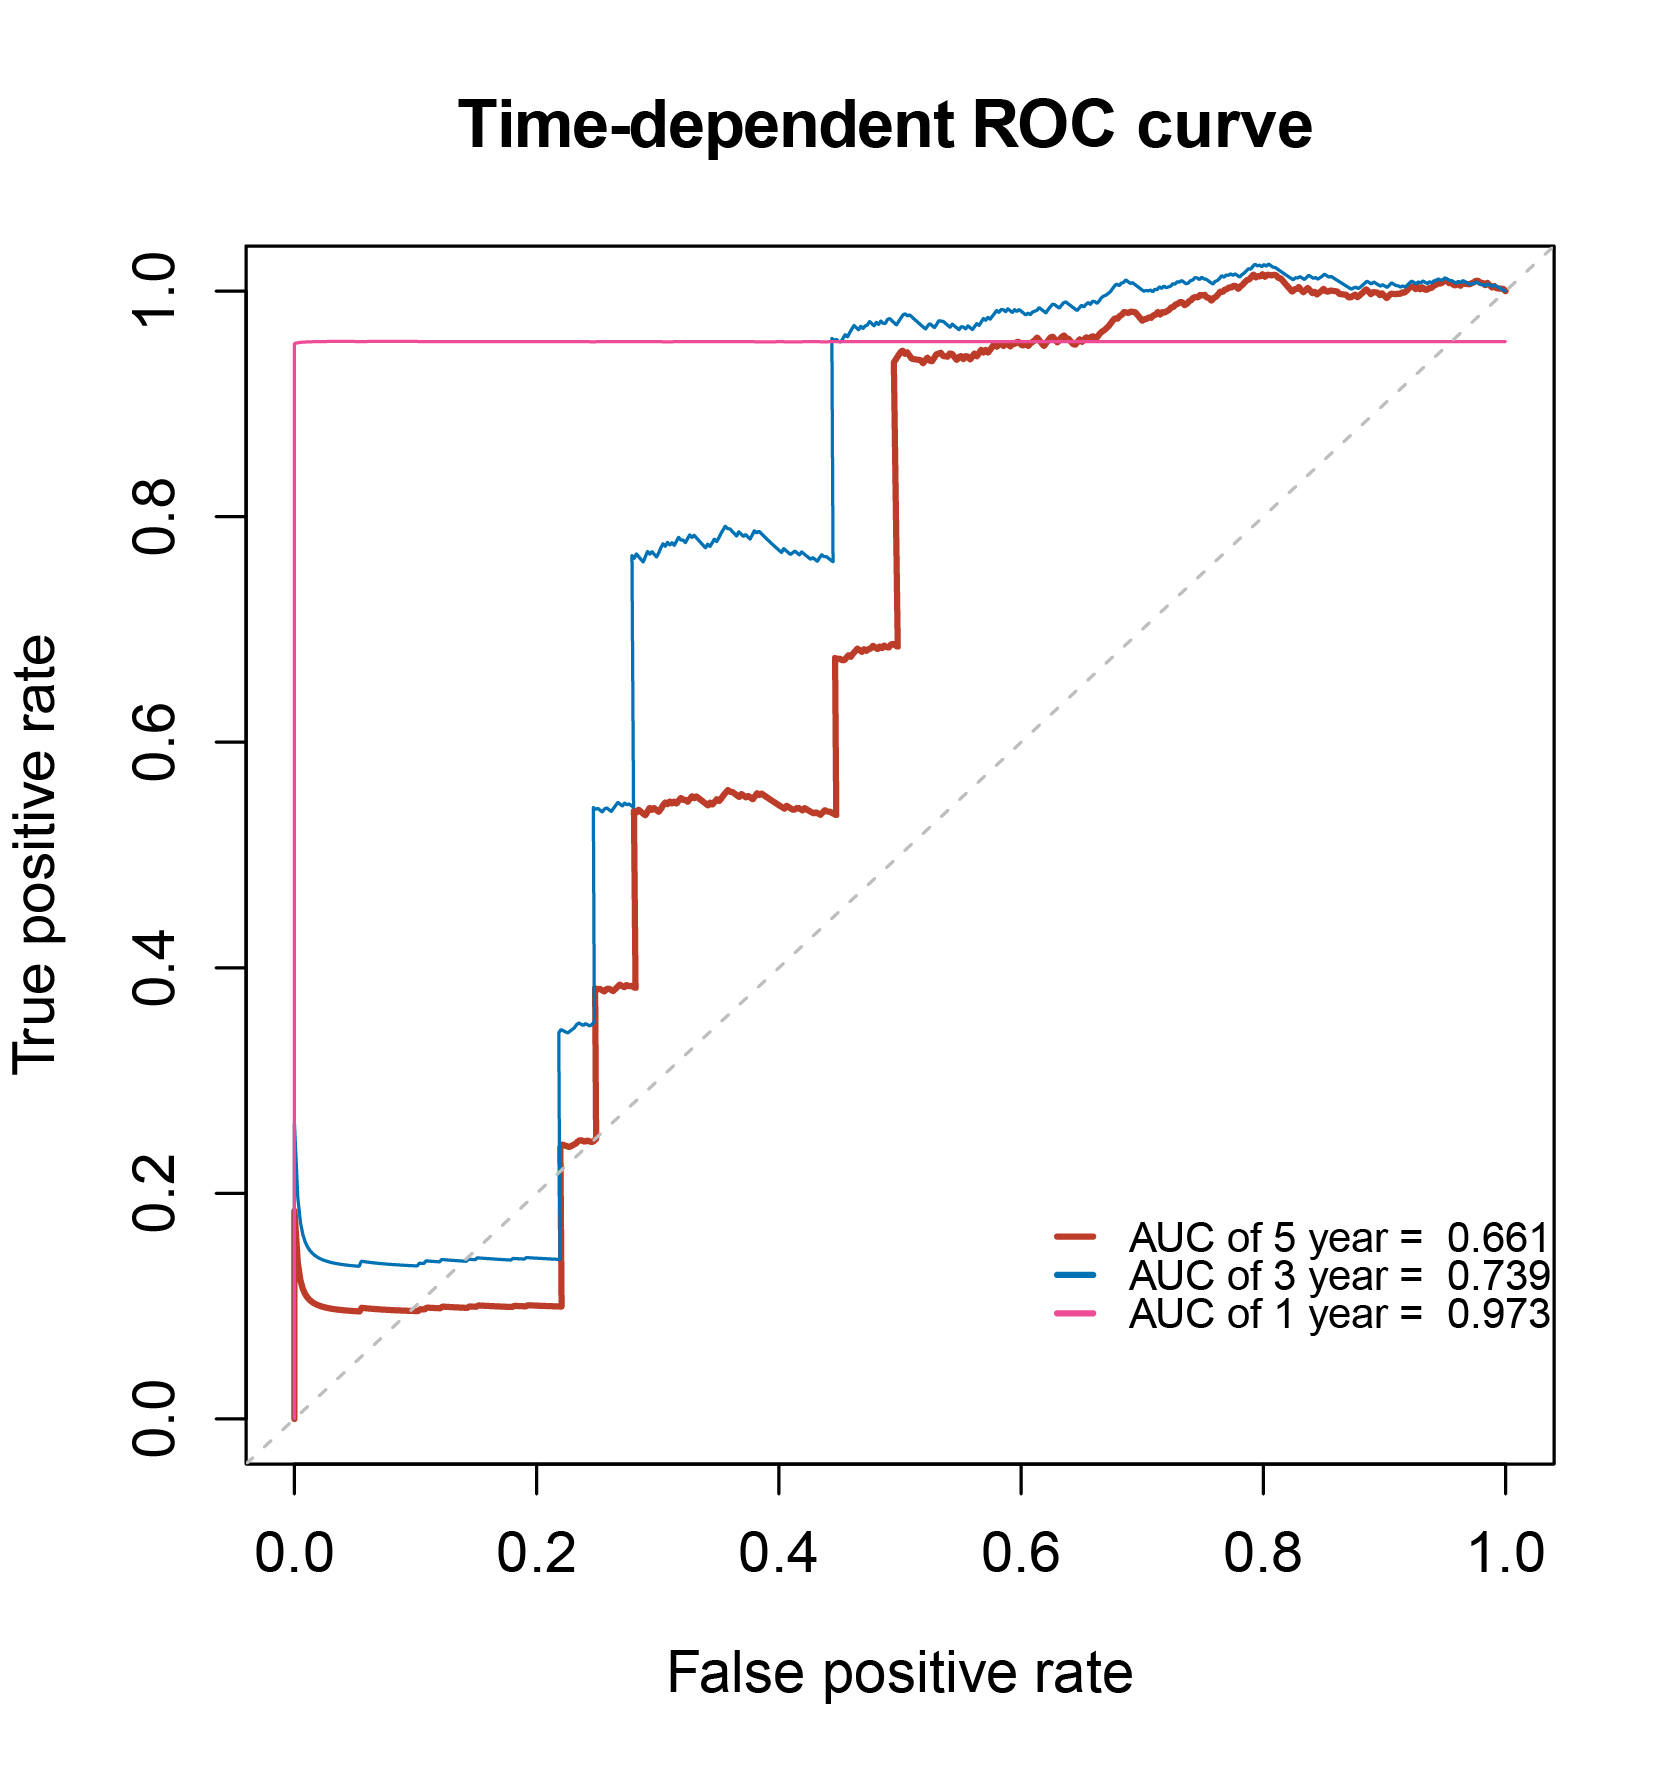 Fig. 8.
Time-dependent (receiver operating characteristic, ROC) biomarker curves of 1-, 3- and 5-year overall survival.
To assess the autonomous predictive significance of a prognostic model composed of four genes, univariate and multivariate Cox regression analyses were implemented using both TCGA prostate adenocarcinoma (PRAD) cohort and GSE 16560 cohort. Univariate Cox regression analysis demonstrated that the prognostic model incorporating clinical information such as GS and pathologic stage exhibited some prognostic value (Fig. 9). The statistical significance of age and GS was nearly achieved, which prompted us to include age, GS, and the prognostic model in the multivariate Cox regression analysis (Fig. 10). The results of the multivariate Cox regression analysis showed that the prognostic model was independently associated with OS.
 Fig. 9.
Forest plot of risk scores and clinical factors based on univariate Cox regression analysis.
 Fig. 10.
Forest plot of risk scores and clinical factors based on multivariate Cox regression analysis.
In addition, the prognostic model’s predictive value was evaluated using the GSE16560 dataset. The dataset consisted of 280 patients, who were divided into a high-risk group (n = 190) and low-risk group (n = 90) based on the optimal cut-off value (Fig. 11). Fig. 12 illustrates the time-dependent ROC analysis results for the prognostic model’s survival prediction, which showed AUC values of 0.69, 0.58, and 0.61 at 1, 3, and 5 years, respectively.
 Fig. 11.
Kaplan–Meier plots for biomarkers in the GSE16560 dataset.
 Fig. 12.
Time-dependent (ROC) curve of biomarkers in the GSE16560 dataset.
All of the hub genes were uploaded to the cBioPortal to make pan-cancer analysis by TCGA PRAD dataset. The results showed that most of the hub genes had significant mutations (Supplementary Fig. 7). Furthermore, network analysis showed that the hub genes of NYP, TOP2A, and TPX2 could also serve as drug targets (Fig. 13).
 Fig. 13.
Integration analysis for drug target. (a) Expression of hub genes in TCGA pan-cancer dataset. (b) Alteration frequency of hub genes in PCa. (c) Clustering of multivariate data. (d) Network of hub genes and drug targets.
In the DrugBank database, the drugs amsacrine, bicalutamide, dexrazoxane, doxorubicin, daunorubicin, enzalutamide, epirubicin, fleroxacin, mitoxantrone, teniposide, and valrubicin were PCa target drugs (Supplementary Material 3). The drug targets calculated by systemsDock showed that NY, TOP2A, and TPX2 had significant docking scores with drug targets (Fig. 14).
 Fig. 14.
Molecule docking prediction for drug target genes (NY, TOP2A, and TPX2).
PCa is usually classified by the GS system. The analysis of PCa tissue is done
through the GS grading system, which characterizes the tissue based on its
microscopic growth pattern. This evaluation method, known as the GS system,
encompasses various levels of stratification. These include GS
| Hub gene | Gleason Score (GS) | ||||
| GS = 6 | GS = 7 | GS = 8 | GS = 9 | GS = 10 | |
| UBE2C | NO | NO | H | H | H |
| CCNB1 | H | H | H | H | H |
| TOP2A | NO | NO | H | H | H |
| TPX2 | NO | NO | H | H | H |
| CENPM | H | H | H | H | H |
| F5 | NO | H | H | H | H |
| APOE | H | H | H | H | H |
| NPY | H | H | H | H | NO |
| TRIM36 | H | H | H | H | H |
UBE2C, Ubiquitin Conjugating Enzyme E2 C; CCNB1, Cyclin B1; TOP2A, DNA Topoisomerase II Alpha; TPX2, TPX2 Microtubule Nucleation Factor; CENPM, Centromere Protein M; F5, Coagulation Factor V; APOE, Apolipoprotein E; NPY, europeptide Y; TRIM6, Tripartite Motif Containing 36.
 Fig. 15.
Expression of hub genes according to the Gleason Score system.
PCa exhibited PSA dependence on AR signaling [47]. The relationship between PSA and the AR pathway is shown in Supplementary Fig. 9. PSA is a significant biomarker that is currently used for PCa screening and diagnosis [48]. AR splice variants may contribute to the progression of PCa. Several therapeutic drugs, including bicalutamide and enzalutamide, specifically target AR signaling in the treatment of PCa [49].
PCa is a prevalent and highly malignant tumor that is known for its complex molecular heterogeneity, making it a worldwide health concern. Therefore, uncovering its biological process may provide insights into the diagnosis and treatment for this disease. In this study, we used GSE6919 and GSE30174 as training datasets, and GSE16560 as the validation dataset. Univariate Cox regression analysis showed that 10 hub genes were related to the survival of patients with PCa. The four-gene risk model was established by multivariate Cox regression analysis.
The AR plays a crucial role in the development and progression of PCa. From the therapeutic perspective, abiraterone with prednisolone combined with androgen deprivation therapy (ADT) should be considered a new standard treatment for patients with high-risk non-metastatic PCa. In the metastatic setting, enzalutamide and abiraterone should not be combined for those starting long-term ADT. Clinically important improvements in survival from the addition of abiraterone to ADT are maintained for longer than 7 years [50]. By conducting genome-wide mapping of AR-binding sites, researchers identified AR-binding regions that regulate the expression of UBE2C, a gene targeted by AR [51]. UBE2C has been shown to specifically regulate AR splice variant 7 (AR-V7) through the UBE2C promoter [52]. The expression of UBE2C is tightly controlled by the cell cycle, which makes it a highly relevant target for AR regulation, even under conditions of androgen independence. Chromatin immunoprecipitation sequencing analysis using an antibody that recognizes the N-terminal section of the AR [53] led to the identification of AR-binding sites. Previous studies have also confirmed a significant correlation between UBE2C and AR-V7/AR3 [54]. CCNB1 is crucial for controlling the cell cycle at the G2/M (mitosis) transition [55, 56]. The upregulation of CCNB1 can occur through Akt phosphorylation when there is overexpression of Jagged1 and AR in PCa [57]. Li and colleagues [58] found androgen and the AR can increase the transactivation of CCNB1 in LNCaP cells. Moreover, the co-overexpression of Jagged1 and AR in PCa leads to the high expression of CCNB1 [52]. The AR signaling pathway interacts with several other cell signaling pathways in PCa [59]. Forkhead box M1 serves as a common central transcriptional regulator that may play an important role in cell cycle-related targets such as CCNB1 [60]. Upregulated CCNB1 may affect proliferation and contribute to tumorigenesis [61, 62, 63, 64]. Compounds of small-molecule drugs that can inhibit PCa growth and block CCNB1-related pathways [58, 60]. TOP2A has the function of controlling DNA topological structure, cell cycle progression, tumor development [65]. Numerous studies have shown that aberrantly expressed TOP2A is associated with tumor progression in PCa [66]. Expression of the TOP2A protein is associated with increased GSs and elevated levels of preoperative PSA [67]. Modulation of DNA topological states and replication mainly account for the expression of TOP2A [68, 69, 70]. During mitosis, TPX2 performs a crucial function in the process of chromosome segregation [71]. In mitosis, TPX2 activates Aurora kinase A and directs its activity towards the mitotic spindle, thus playing a significant role [72]. Analysis using microarray techniques revealed a positive correlation between TPX2 and the GS. The overexpression of TPX2 is associated with the aggressiveness of PCa [73, 74]. Inhibiting TPX2 leads to the inhibition of PCa cell growth, increased apoptosis, and a reduction in tumorigenesis. Numerous studies have confirmed the potential therapeutic value of targeting TPX2 in the treatment of PCa [73, 74]. CENPM is a complex protein that plays a pivotal role in the assembly of kinetochore proteins, the progression of mitosis, and the segregation of chromosomes. CENPM is reportedly a signature PCa-related gene [75]. F5 is a central regulator of hemostasis. It serves as a critical cofactor linked to cancer progression [76]. APOE is a crucial protein involved in regulating cholesterol levels. It also has the potential to inhibit cell proliferation, modulate immune regulation, and regulate cell growth and differentiation [77]. APOE has a potential role in PCa progression [78]. NPY has been implicated in the regulation of tumor advancement, including neuroendocrine tumors, as well as breast cancer and PCa [79]. The presence of reduced NPY expression levels is significantly linked to a more aggressive clinical phenotype in PCa. In TCGA pan-cancer cohort, PCa exhibits elevated NPY expression [80, 81]. TRIM36, a member of the B-box family of zinc-finger proteins, plays a crucial role in cell cycle progression and cell growth attenuation [82]. Numerous studies have established a significant association between TRIM36 and the GS, as well as its upregulation in the majority of PCa. Moreover, TRIM36 delays the progression of the PCa cell cycle and prevents excessive cell proliferation. Intriguingly, restoring TRIM36 expression during anti-androgen therapy has been shown to enhance the effectiveness of the drug [83].
In this study, a genome-wide analysis approach was utilized to indicate hub genes and drug targets in PCa. The findings hold promise in terms of offering a valuable collection of biomarkers for further exploration into the underlying molecular mechanisms of PCa. The identified biomarkers were found to be significantly associated with the OS of patients by employing multiple databases and multivariate analysis for validation. The AUC curve was used to verify the classification of these biomarkers and risk model. All of the biomarkers and pathways were based on a mathematical algorithm and bioinformatics tools. These potentially prognostic biomarkers may be used to predict the molecular mechanisms and drug targets associated with PCa. Further experimental validation and clinical studies on these biomarkers should be conducted.
All datasets (GSE6919, GSE30174 and GSE16560) in this article can be obtained through the GEO database at https://www.ncbi.nlm.nih.gov.
YT and XG conceived the study; ZT and PW retrieved the literature; YT and ZT collected the data; YT wrote the R code; YT and ZT polished the manuscript; YT and XG wrote the paper. All the authors read and approve the final manuscript. All authors have participated sufficiently in the work and agreed to be accountable for all aspects of the work. All authors contributed to editorial changes in the manuscript.
Not applicable.
Not applicable.
This work was funded by Chongqing Language and Writing Research Project (yyk21213), Chongqing Natural Science Foundation General Project(cstc2021jcyj-msxmX0485), Humanities & social sciences of the Ministry of Education of the People’s Republic of China (19YJA860022) and Basic science and frontier project of Chongqing Municipal Science and Technology Commission (cstc2016jcyjA0582).
The authors declare no conflict of interest.
Publisher’s Note: IMR Press stays neutral with regard to jurisdictional claims in published maps and institutional affiliations.