
- Academic Editors
†These authors contributed equally.
Background: Internal N7-methylguanosine (m7G) methylation in mammalian messenger RNAs (mRNAs) is essential in disease development. However, the status of internally m7G-modified mRNAs in oral squamous cell carcinoma (OSCC) remains poorly understood. Methods: Methylated RNA immunoprecipitation sequencing (MeRIP-seq) was used to identify the m7G modification level of mRNAs and the expression of mRNAs between OSCC and normal tissues. These differentially methylated and expressed genes were subjected to Gene Ontology (GO) enrichment, Kyoto Encyclopedia of Genes and Genomes (KEGG) pathway analysis and construction of protein-protein interaction (PPI) networks. Quantitative real-time PCR (qPCR) assay was performed to detect the expression of Baculoviral IAP Repeat Containing 3 (BIRC3) in vitro. The biological function of BIRC3 in OSCC was clarified using CCK-8, Transwell migration and Western blot assays. Results: The m7G-mRNA profile showed 9514 unique m7G peaks within 7455 genes in OSCC tissues. In addition, the most conserved m7G motif within mRNAs in OSCC was GGARG (R = G/A). The identified m7G peaks were mainly distributed in the coding sequence region within mRNAs in OSCC. GO enrichment and KEGG pathway analyses showed that m7G-modified genes were closely related to cancer progression. m7G-modified hub genes were screened from the constructed PPI networks. Furthermore, BIRC3 with high m7G methylation showed high expression in OSCC cell lines, as confirmed by qPCR assay. Functionally, the knockdown of BIRC3 significantly inhibited the proliferation and migration ability of CAL-27 cells in vitro functional assays. In addition, the relative expression of E-cadherin expression was elevated, while Vimentin and N-cadherin protein expression was decreased in CAL-27 cells transfected with si-BIRC3. This study suggests that BIRC3 could promote OSCC proliferation and migration, which may be associated with involvement in epithelial-mesenchymal transition (EMT) progression. Conclusions: This paper constructed a transcriptome map of internal m7G in mRNAs, which provides potential research value to study the role of m7G methylation in OSCC.
Oral squamous cell carcinoma (OSCC) is one of the most common malignant tumors worldwide [1]. Recent studies have confirmed that the incidence and mortality rate of OSCC are increasing annually due to the high local recurrence rate and susceptibility to metastasis [2, 3]. Although technological advances in surgery, radiotherapy, and chemotherapy have improved the local control of OSCC, the 5-year survival rate of OSCC patients has remained at less than 60% [2, 4]. Therefore, exploring the pathogenesis of OSCC and identifying effective therapeutic targets are crucial to improving OSCC patients’ prognoses.
RNA methylation is an essential epigenetic modification in post-transcriptional
regulation [5]. N7-methylguanosine (m7G), one of the most common types of RNA
methylation, adds a methyl group to the 7th N of RNA guanine in the presence of
methyltransferase [6]. Many previous studies have confirmed that m7G methylation
is found in ribosomal RNA (rRNA) [7], transfer RNA (tRNA) [8], microRNA (miRNA)
[9] and long noncoding RNA (lncRNA) [10] structures. Recently, Zhang et
al. [11] discovered internal m7G sites within mammalian mRNAs using advanced
m7G-methylated RNA immunoprecipitation sequencing (m7G-MeRIP-seq) technology.
Furthermore, m7G methylation within mRNAs can affect disease development [12, 13]. Specifically, m7G-modified mRNAs can promote angiogenesis in peripheral
arterial disease [12]. Internal m7G methylation within mRNAs is identified in
acute myeloid leukemia (AML) using m7G-MeRIP-seq, and hyper m7G-modified genes
are associated with multidrug resistance in AML [13]. Moreover, it has been
confirmed that m7G-modified tRNAs can participate in tumor progression in head
and neck squamous cell carcinoma (HNSCC) [14, 15]. For example, m7G-modified
tRNAs can regulate critical signaling pathways (PI3K/AKT/mTOR and
WNT/
Therefore, to study the role of m7G methylation in OSCC, we aimed to construct and analyze the transcriptome mapping of internal m7G in mRNAs. The comprehensive bioinformatics analysis showed the difference in mRNA m7G methylation and the expression of mRNAs between OSCC and normal tissues. Moreover, Gene Ontology (GO) enrichment, Kyoto Encyclopedia of Genes and Genomes (KEGG) analysis and construction of protein-protein interaction (PPI) networks for m7G-modified genes were performed. Ultimately, the biological functions of the screened m7G-modified Baculoviral IAP Repeat Containing 3 (BIRC3) gene in OSCC were clarified in vitro. In conclusion, our study analyzed the characteristics and potential functions of these m7G-modified genes, which can provide potential research value to study the role of m7G methylation in OSCC.
Six tissue samples (C1/N1, C2/N2, and C2/N3) from three OSCC patients were collected from the First Affiliated Hospital of Weifang Medical University. This study was approved by the Ethics Committee of Weifang Medical University [17], and informed consent was obtained from all patients. Library construction and sequencing were performed by CloudSeq Inc. (Shanghai, China), and concrete details about that sequencing procedure have been described in the study [17]. In brief, by using m7G-specific antibodies to enrich the m7G-methylated RNA fragments and combined with high-throughput sequencing technology, m7G methylation on RNA was located and quantified.
The raw reads generated were first subjected to Q30 quality control. Then,
high-quality clean reads were obtained using cutadapt software (Version: 1.9.3,
Berlin, Germany) [18]. The high-quality reads were compared with the reference
genome using Hisat2 software (Version: 2.0.4, Baltimore, MD, USA) [19]. Raw
counts at the gene level were obtained as mRNA expression profiles using HTSeq
software (Version: 0.9.1, Barcelona, Spain). Finally, fold change
The RCircos package was used to show the distribution of m7G on chromosomes in OSCC and normal tissues [23]. The motif of methylation peaks was identified using Dreme software (Brisbane, QLD, Australia); the motif with the smallest E value was selected to be the most significant [24].
GO and KEGG analyses were performed using the Database for Annotation,
Visualization, and Integrated Discovery (DAVID; https://david.ncifcrf.gov/) for
differentially expressed genes and differentially m7G-modified genes [25]. GO and
KEGG terms with p
PPI networks were constructed for differentially m7G-modified mRNAs using Search Tool for Retrieval of Interacting Genes/Proteins software (STRING; https://cn.string-db.org/) [26]; an interaction score of 0.7 (median confidence) was the standard. In addition, the CytoNCA plugin of Cytoscape software (Version: 3.8.0, Palo Alto, CA, USA) was used to screen hub genes based on betweenness centrality scores [27].
Tumor Immune Estimation Resource (TIMER; https://cistrome.shinyapps.io/timer/), the University of Alabama at Birmingham Cancer Data Analysis Portal (UALCAN; https://ualcan.path.uab.edu/) and Gene Expression Profiling Interactive Analysis (GEPIA; http://gepia.cancer-pku.cn/) were used to analyze the expression of the BIRC3 in tumor tissues [28, 29, 30].
Five human OSCC cell lines (SCC-9, SCC-25, HN6, HN30, CAL-27) used in this study
were obtained from the Shanghai Jiao Tong University School of Medicine, and the
Research Resource Identifiers (RRIDs) were listed in previous studies [31, 32, 33].
The HN6, HN30, CAL-27 cell lines were cultured in Dulbecco’s modified Eagle’s
medium (DMEM, GIBCO, NY, USA) with 10% fetal bovine serum (FBS, GIBCO, NY, USA)
and 1% penicillin and streptomycin (GIBCO, NY, USA), while the SCC-9 and SCC-25
cell lines were cultured in DMEM/F12 (GiBCO, NY, USA) with 10% FBS and 1%
penicillin and streptomycin. Normal control cells were obtained from primary
cultures of oral mucosal epithelial cells. Oral mucosal epithelial cells were
cultured in keratinocyte serum-free medium (GIBCO, NY, USA) with 0.2 ng/mL of
recombinant epidermal growth factor (Thermo Fisher Scientific, Waltham, MA, USA).
All cells were maintained at 37 °C in a 5% CO
Total RNA was extracted from cultured cells using TRIzol reagent. Total RNA was
reverse transcribed to cDNA using the PrimeScript RT kit (TaKaRa, Tokyo, Japan).
Target genes were amplified using a real-time fluorescent quantitative PCR kit
(Life Technologies, Carlsbad, CA, USA). Gene expression was normalized for all
samples using
Small interfering RNA (siRNA) was designed and synthesized (Sangon Biotech,
Shanghai, China). The targeted sequence of si-BIRC3 was
5
CAL-27 cells (1.5
CAL-27 cells (2.5
Western blot analysis was performed as previously described [31]. The primary
antibodies included anti-E cadherin (Cat# GB11868; 1:1000; Servicebio, Wuhan ,
China), anti-N cadherin (Cat# GB11135; 1:1000; Servicebio, Wuhan, China),
anti-Vimentin (Cat# GB11192; 1:1000; Servicebio, Wuhan, China) and
anti-
SPSS 16.0 (IBM Corp., Armonk, NY, USA) was used for statistical analysis, and
GraphPad Prism 7.0 (La Jolla, CA, USA) was used to graph the data. An independent
samples t-test (two groups) was used to compare the significant
differences between the two groups; one-way ANOVA was used to compare multiple
groups. The results (p
To clarify the overview of internal m7G methylation within mRNAs in OSCC and normal tissues, we took the intersection of C1, C2, and C3 (Supplementary Fig. 1A,C). Meanwhile, we took the intersection of N1, N2, and N3 (Supplementary Fig. 1B,D). The analysis showed 9514 unique m7G peaks within 7455 genes in OSCC tissues (Fig. 1A,B). Internal m7G methylation features within mRNAs in two groups were further analyzed. The internal m7G peaks within mRNAs in both groups were mainly distributed on chromosome 1 (chr1), followed by chromosome 19 (chr19) (Fig. 1C). Furthermore, the distribution of m7G methylation on all chromosomes in two groups was shown using the RCircos package (Fig. 1D). In addition, the percentage of genes with more than four m7G peaks within mRNAs was found to be 34.54% in OSCC tissues, indicating that internal m7G methylation sites are not unique (Fig. 1E).
 Fig. 1.
Overview of internal m7G methylation within mRNAs in oral squamous cell carcinoma (OSCC). (A) Venn diagram showed the unique m7G peaks in OSCC and normal tissues. (B) Venn diagram showed the specific m7G-modified genes in OSCC and normal tissues. (C) Chromosome distribution characteristics of m7G peaks in OSCC and normal tissues. (D) The distribution of m7G at the chromosome was displayed using the Rcircos package in OSCC and normal tissues. (Red: cancer; Blue: normal). (E) The percentage of genes with different m7G peaks in OSCC and normal tissues. (F) Regional distribution of internal m7G methylation sites within mRNAs in OSCC and normal tissues. (CDS, coding sequence; UTR, untranslated region). (G) The bar plot showed the distribution percentage of m7G methylation sites in the mRNA region in the samples (C1, C2, C3, N1, N2, N3). (H) m7G peaks density analysis of m7G methylation in OSCC and normal tissues. (C, cancer; N, normal). (I) The most conserved m7G motifs in OSCC and normal tissues, respectively.
Identification of the regional distribution of m7G methylation showed that m7G
methylation occurred in all regions within mRNAs, including coding sequence
(CDS), 3
The motif sequences were analyzed using Dreme software in OSCC and normal
tissues. Notably, GGARG (R = G/A) sequences were highly clustered at the m7G sites
(E value of cancer: 7.0
Differentially methylated genes (fold change
| Gene name | txStart | txEnd | Chrom | Regulation | log (FC) | p |
| PPP1R26 | 138380721 | 138380739 | chr9 | Hyper | 3.227 | 3.57 |
| BIRC3 | 102208521 | 102208840 | chr11 | Hyper | 3.062 | 3.96 |
| C11orf70 | 101953801 | 101953820 | chr11 | Hyper | 3.022 | 4.05 |
| SCUBE3 | 35218901 | 35219240 | chr6 | Hyper | 2.966 | 3.45 |
| KCNA6 | 4921301 | 4921720 | chr12 | Hyper | 2.946 | 3.6 |
| MLNR | 49796321 | 49796513 | chr13 | Hyper | 2.913 | 1.25 |
| CDC42SE2 | 130727061 | 130727460 | chr5 | Hyper | 2.903 | 7.3 |
| ABCG4 | 119027581 | 119027724 | chr11 | Hyper | 2.894 | 1.32 |
| ACACB | 109666641 | 109666666 | chr12 | Hyper | 2.884 | 3.72 |
| MYH3 | 10531842 | 10531940 | chr17 | Hyper | 2.882 | 1.06 |
To clarify the biological functions of differentially methylated genes in OSCC, GO analysis based on biological processes (BP), cellular components (CC), molecular functions (MF) and KEGG enrichment analysis for these genes were performed. Hyper m7G-modified genes in OSCC were associated with ion transport, multicellular organismal process and transmembrane transport (GO term: BP); an integral component of the plasma membrane, an intrinsic component of the membrane, and cell projection (GO term: CC); transmembrane transporter activity, and ion transmembrane transporter activity (GO term: MF) (Fig. 2A). In contrast, hypo m7G-modified genes in OSCC were related to localization, regulation of signaling and cell communication (GO term: BP); the cytoplasm, intracellular organelle, and the cytosol (GO term: CC); protein binding, enzyme binding, and cytoskeletal protein binding (GO term: MF) (Fig. 2C). Moreover, KEGG pathway analysis showed that hyper m7G-modified in OSCC were enriched in the calcium signaling pathway and ATP-binding cassette (ABC) transporters (Fig. 2B). In contrast, hypo m7G-modified genes in OSCC were associated with the Hippo and adenosine 5 monophosphate (AMP)-activated protein kinase (AMPK) signaling pathway (Fig. 2D).
 Fig. 2.
The bioinformatic function of differentially methylated genes in
OSCC. The top 10 Gene Ontology (GO) terms (A) and Kyoto Encyclopedia of
Genes and Genomes (KEGG) pathways (B) of hyper m7G-modified genes genes in OSCC.
GO enrichment included biological process (BP), cellular component (CC) and
molecular function (MF). The top 10 GO terms (C) and KEGG pathways (D) of hypo
m7G-modified genes in OSCC. Enrichment score: –log
The heatmap showed gene expression profiles identified by transcriptome
sequencing (Supplementary Fig. 2). Volcano and scatter plots showed 2185
upregulated genes and 2022 downregulated genes in OSCC tissues (fold change
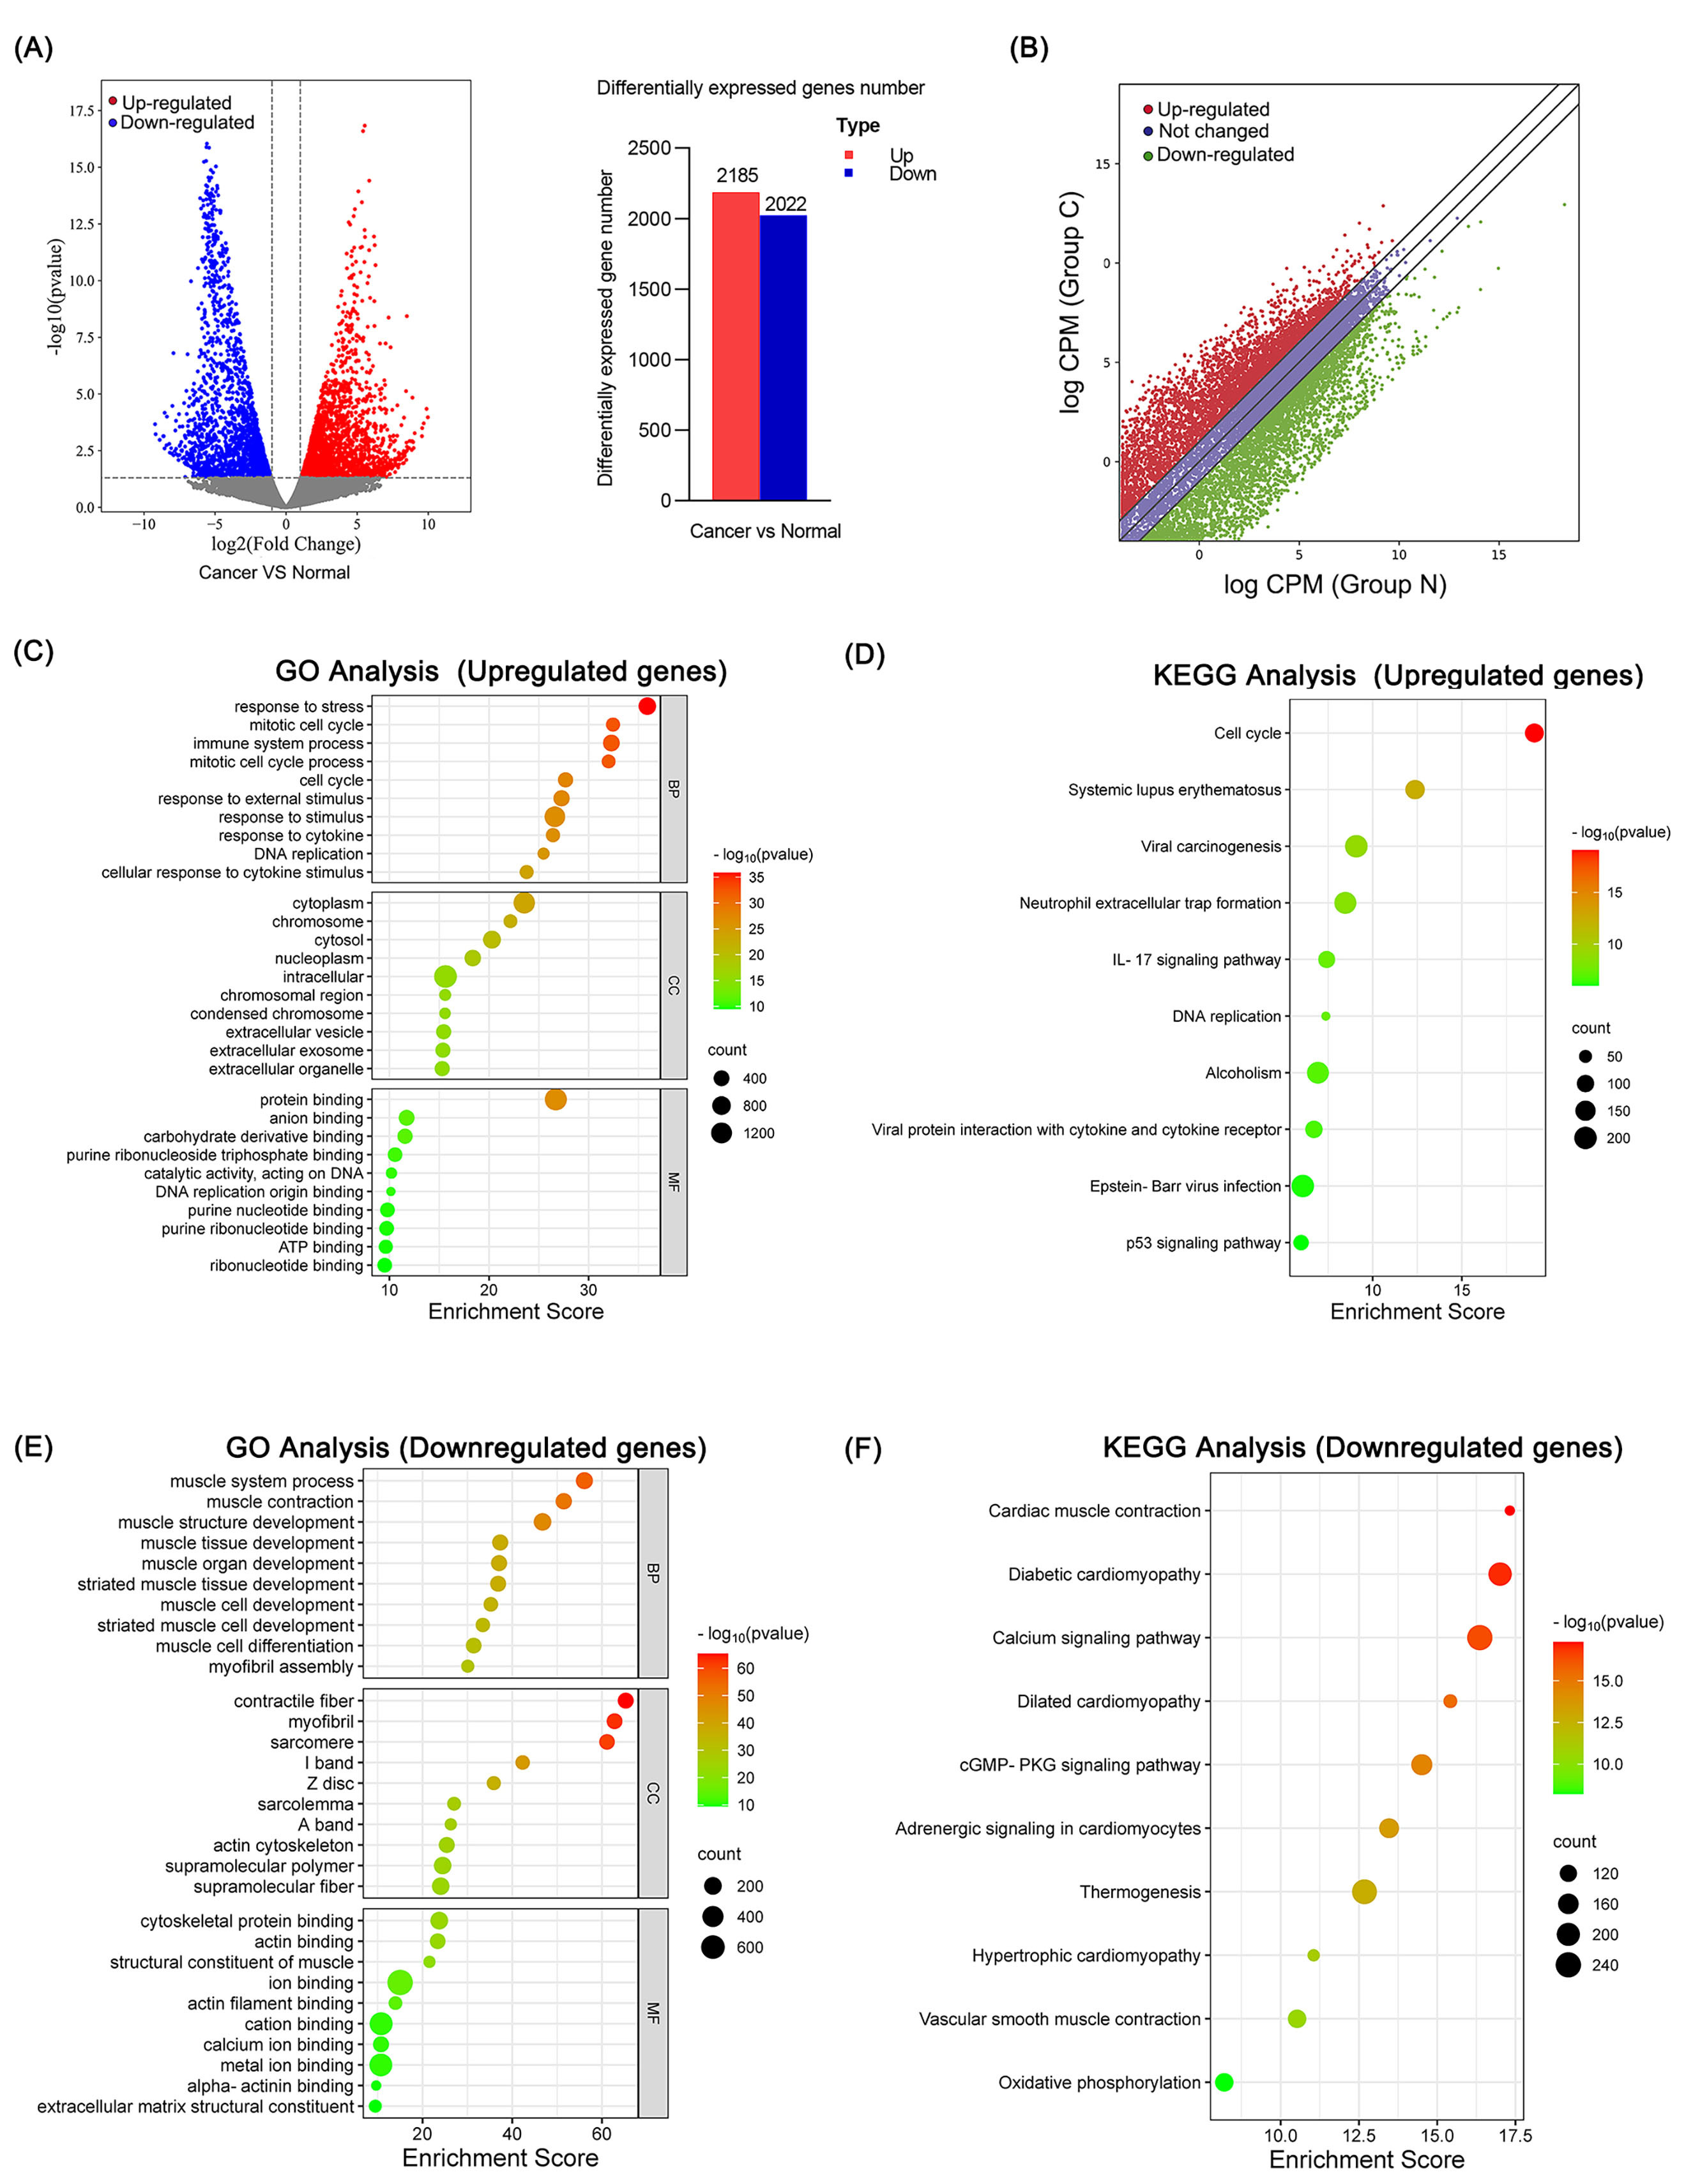 Fig. 3.
The bioinformatic function was analyzed for
differentially expressed genes identified in OSCC. (A) The volcano map showed
differentially expressed genes in OSCC. The bar chart showed statistic of
differential expressed genes between OSCC and normal tissues. (red: upregulated,
grey: not changed, blue: downregulated). (B) Scatter plot showed differentially
expressed genes. (Red: upregulated, Blue: not changed, Green: downregulated; C:
cancer; N: normal). The top 10 GO terms (C) and KEGG pathways (D) of upregulated
genes in OSCC. The top 10 GO terms (E) and KEGG pathway (F) on downregulated
genes in OSCC. Enrichment score: –log
To investigate the biological role of differentially expressed genes affected by
m7G methylation in OSCC, the combined analysis were completed. The result showed
1221 genes with upregulated mRNA expression with m7G hypermethylation sites
(referred to as hyper-upregulated genes) and 1645 genes of downregulated mRNA
levels with m7G hypomethylation sites (referred to as hypo-downregulated genes;
fold change
| Gene Name | chrom | txStart | txEnd | Pattern | m7G change | mRNA change | ||
| log (FC) | p | log (FC) | p | |||||
| BIRC3 | chr11 | 102208521 | 102208840 | Hyper-up | 3.062 | 3.96 |
2.066 | 6.49 |
| FER1L6 | chr8 | 125035683 | 125035836 | Hyper-up | 2.858 | 3.52 |
3.817 | 3.81 |
| ARHGAP23 | chr17 | 36635676 | 36635738 | Hyper-up | 2.786 | 4.61 |
1.137 | 3.90 |
| FBXO39 | chr17 | 6690761 | 6690965 | Hyper-up | 2.78 | 3.98 |
4.806 | 3.86 |
| ECT2 | chr3 | 24582476 | 24582574 | Hyper-up | 2.782 | 8.02 |
3.354 | 1.22 |
| KIAA0319 | chr6 | 179071101 | 179071480 | Hyper-up | 2.747 | 3.21 |
4.404 | 7.56 |
| ABL2 | chr1 | 50616781 | 50616831 | Hyper-up | 2.744 | 7.34 |
1.433 | 1.29 |
| PANX2 | chr22 | 11302081 | 11302395 | Hyper-up | 2.742 | 1.86 |
4.93 | 7.39 |
| FAM167A | chr8 | 172534480 | 172534500 | Hyper-up | 2.737 | 5.99 |
5.948 | 1.09 |
| MMP10 | chr11 | 102641232 | 102641240 | Hyper-up | 2.721 | 3.78 |
5.555 | 1.20 |
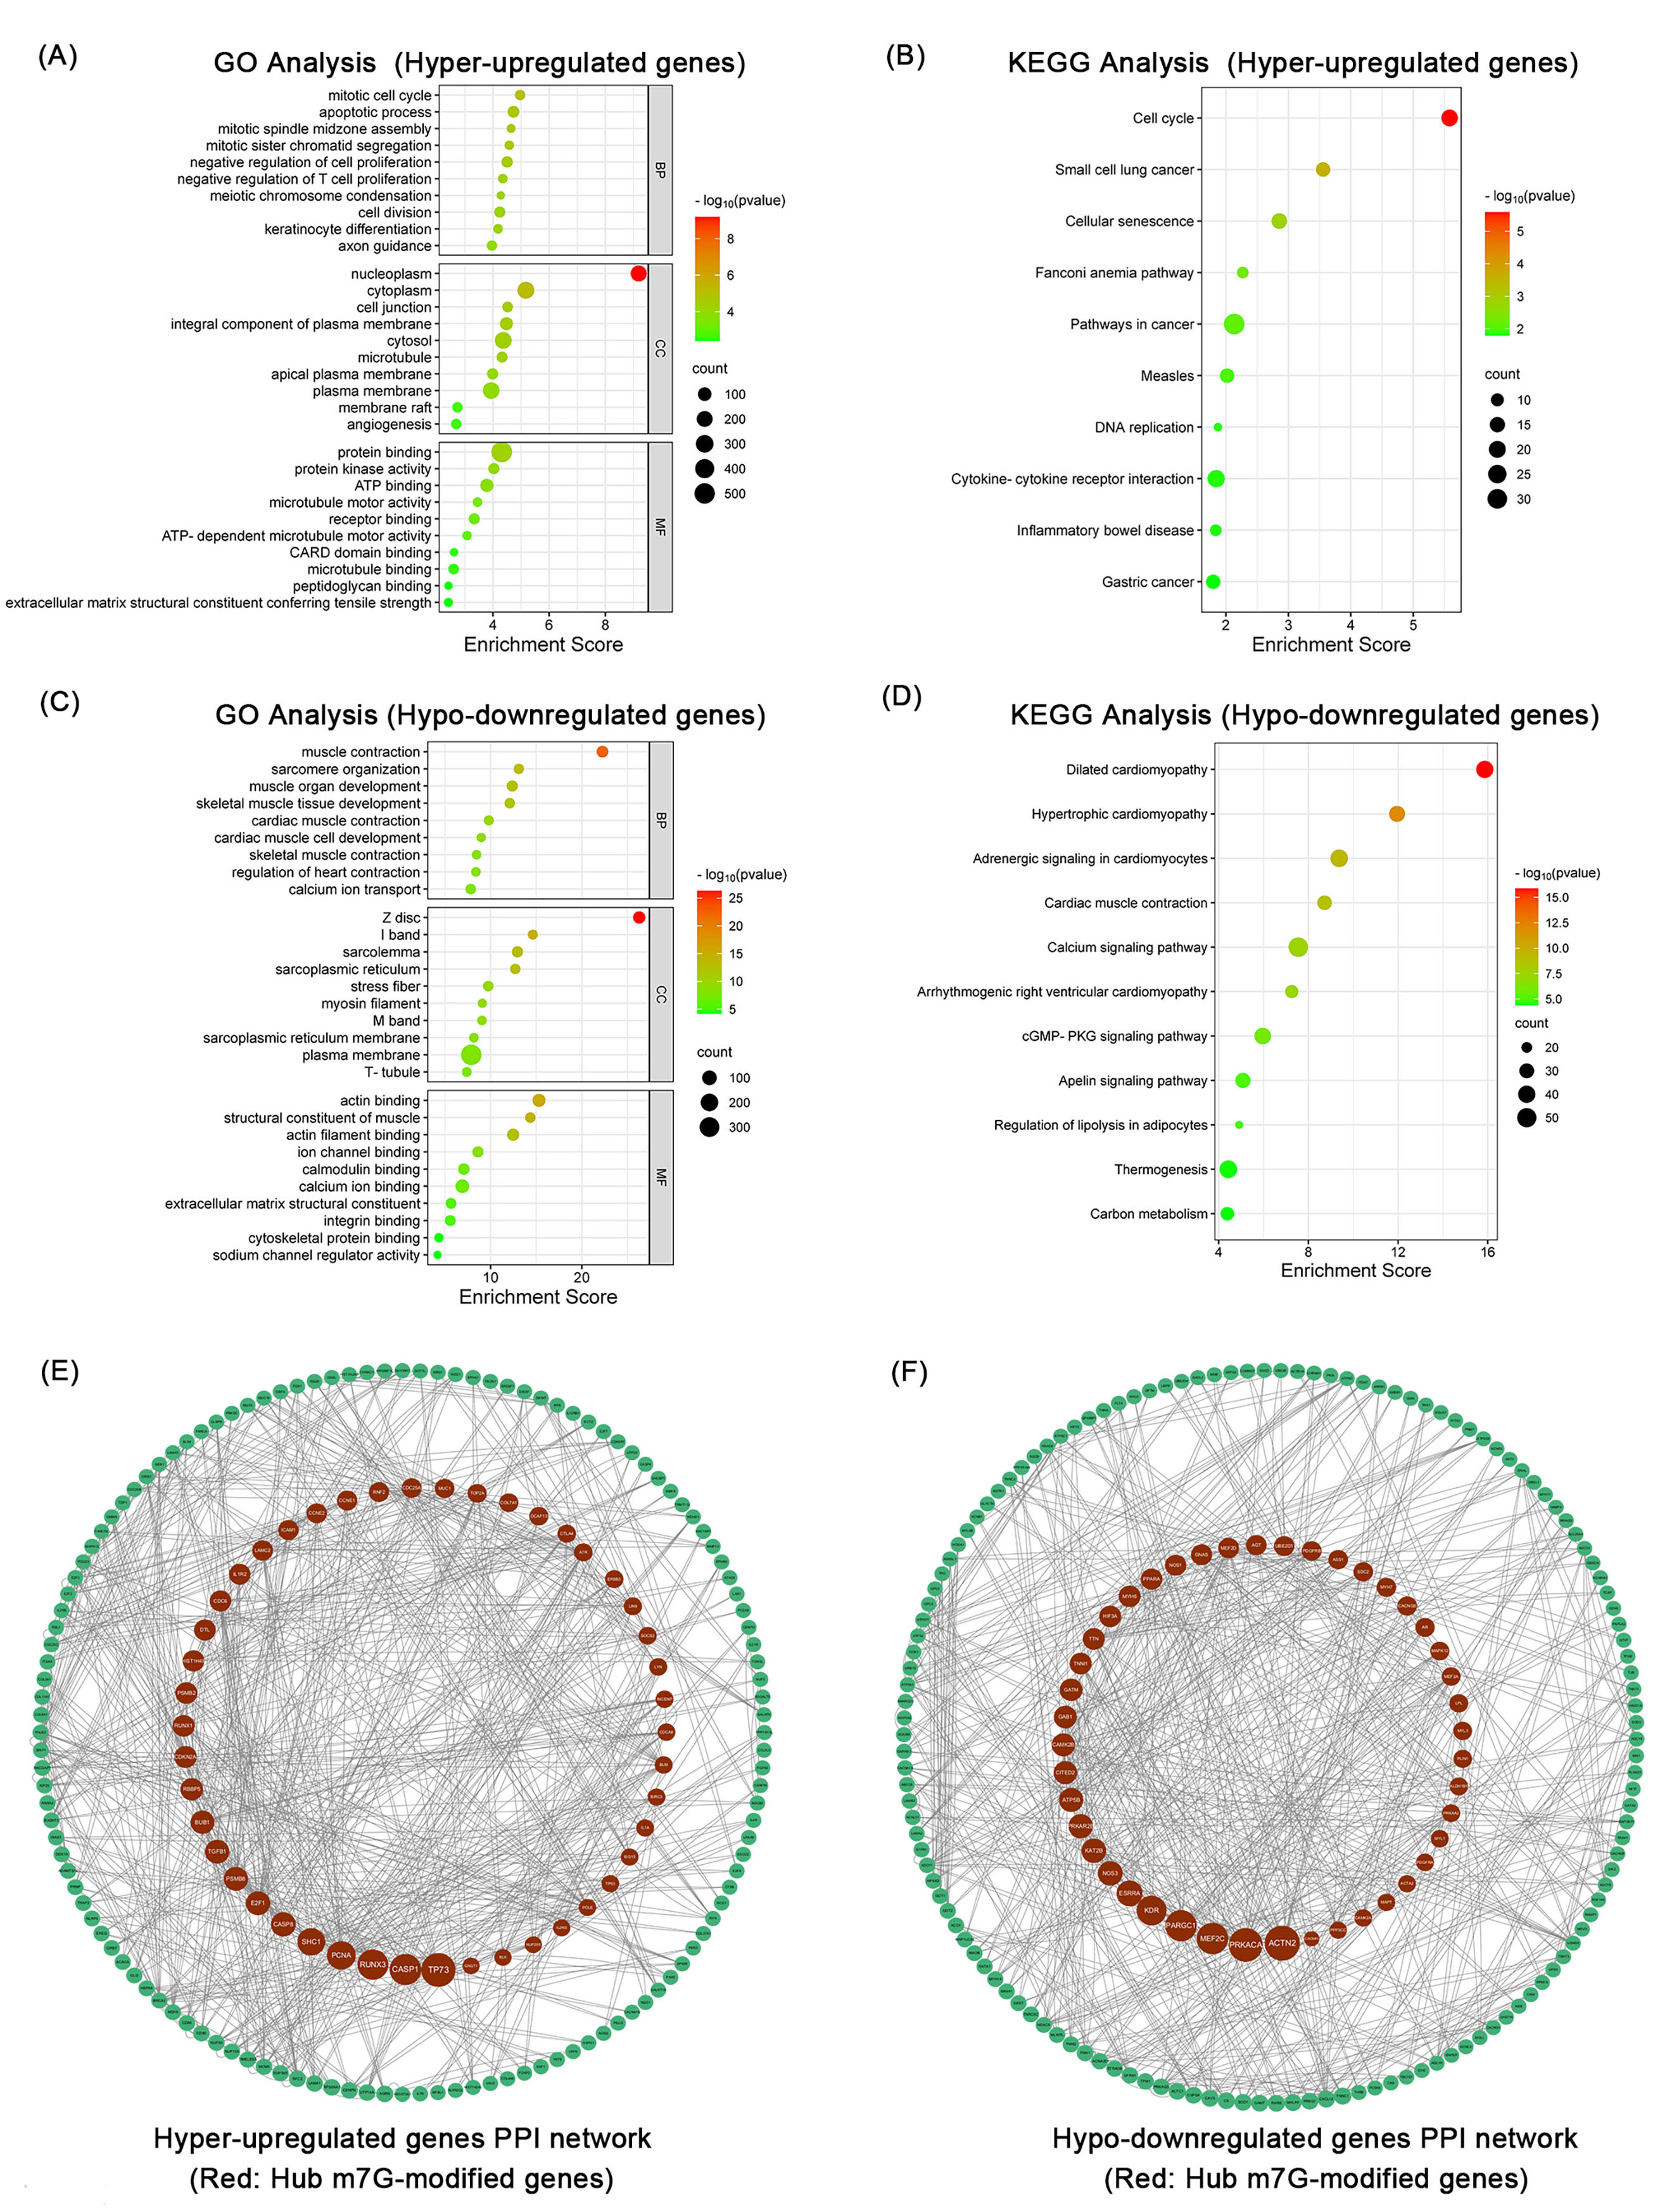 Fig. 4.
Bioinformatics analysis of differentially expressed methylation
genes identified by co-analysis. The top 10 GO terms. (A) and KEGG pathways (B)
of hyper-upregulated genes in OSCC. The top 10 GO terms (C) and KEGG pathways (D)
of hypo-downregulated genes in OSCC. Enrichment score: –log
To explore the protein interactions of differentially expressed methylation
genes, PPI networks of these genes were generated using the STRING software.
Among these 1221 hyper-upregulated genes, 792 nodes and 440 edges (p:
1.0
By the co-analysis, the heatmap showed the top 10 upregulated genes with high m7G methylation based on fold change (Fig. 5A). The result showed that the highly expressed BIRC3 gene had the highest m7G methylated peaks (logFC: 3.062) among the top 10 screened genes. The m7G peaks were visualized by Integrative Genomics Viewer software (IGV, Version: 2.14.1, Cambridge, MA, USA), and the BIRC3 transcript has higher m7G methylation peaks at the sites (chr11: 102208521-102208840) in OSCC tissues than in normal tissues (Fig. 5B). The STRING software showed that the BIRC3 protein could interact with TNF receptor-associated factor (Fig. 5C).
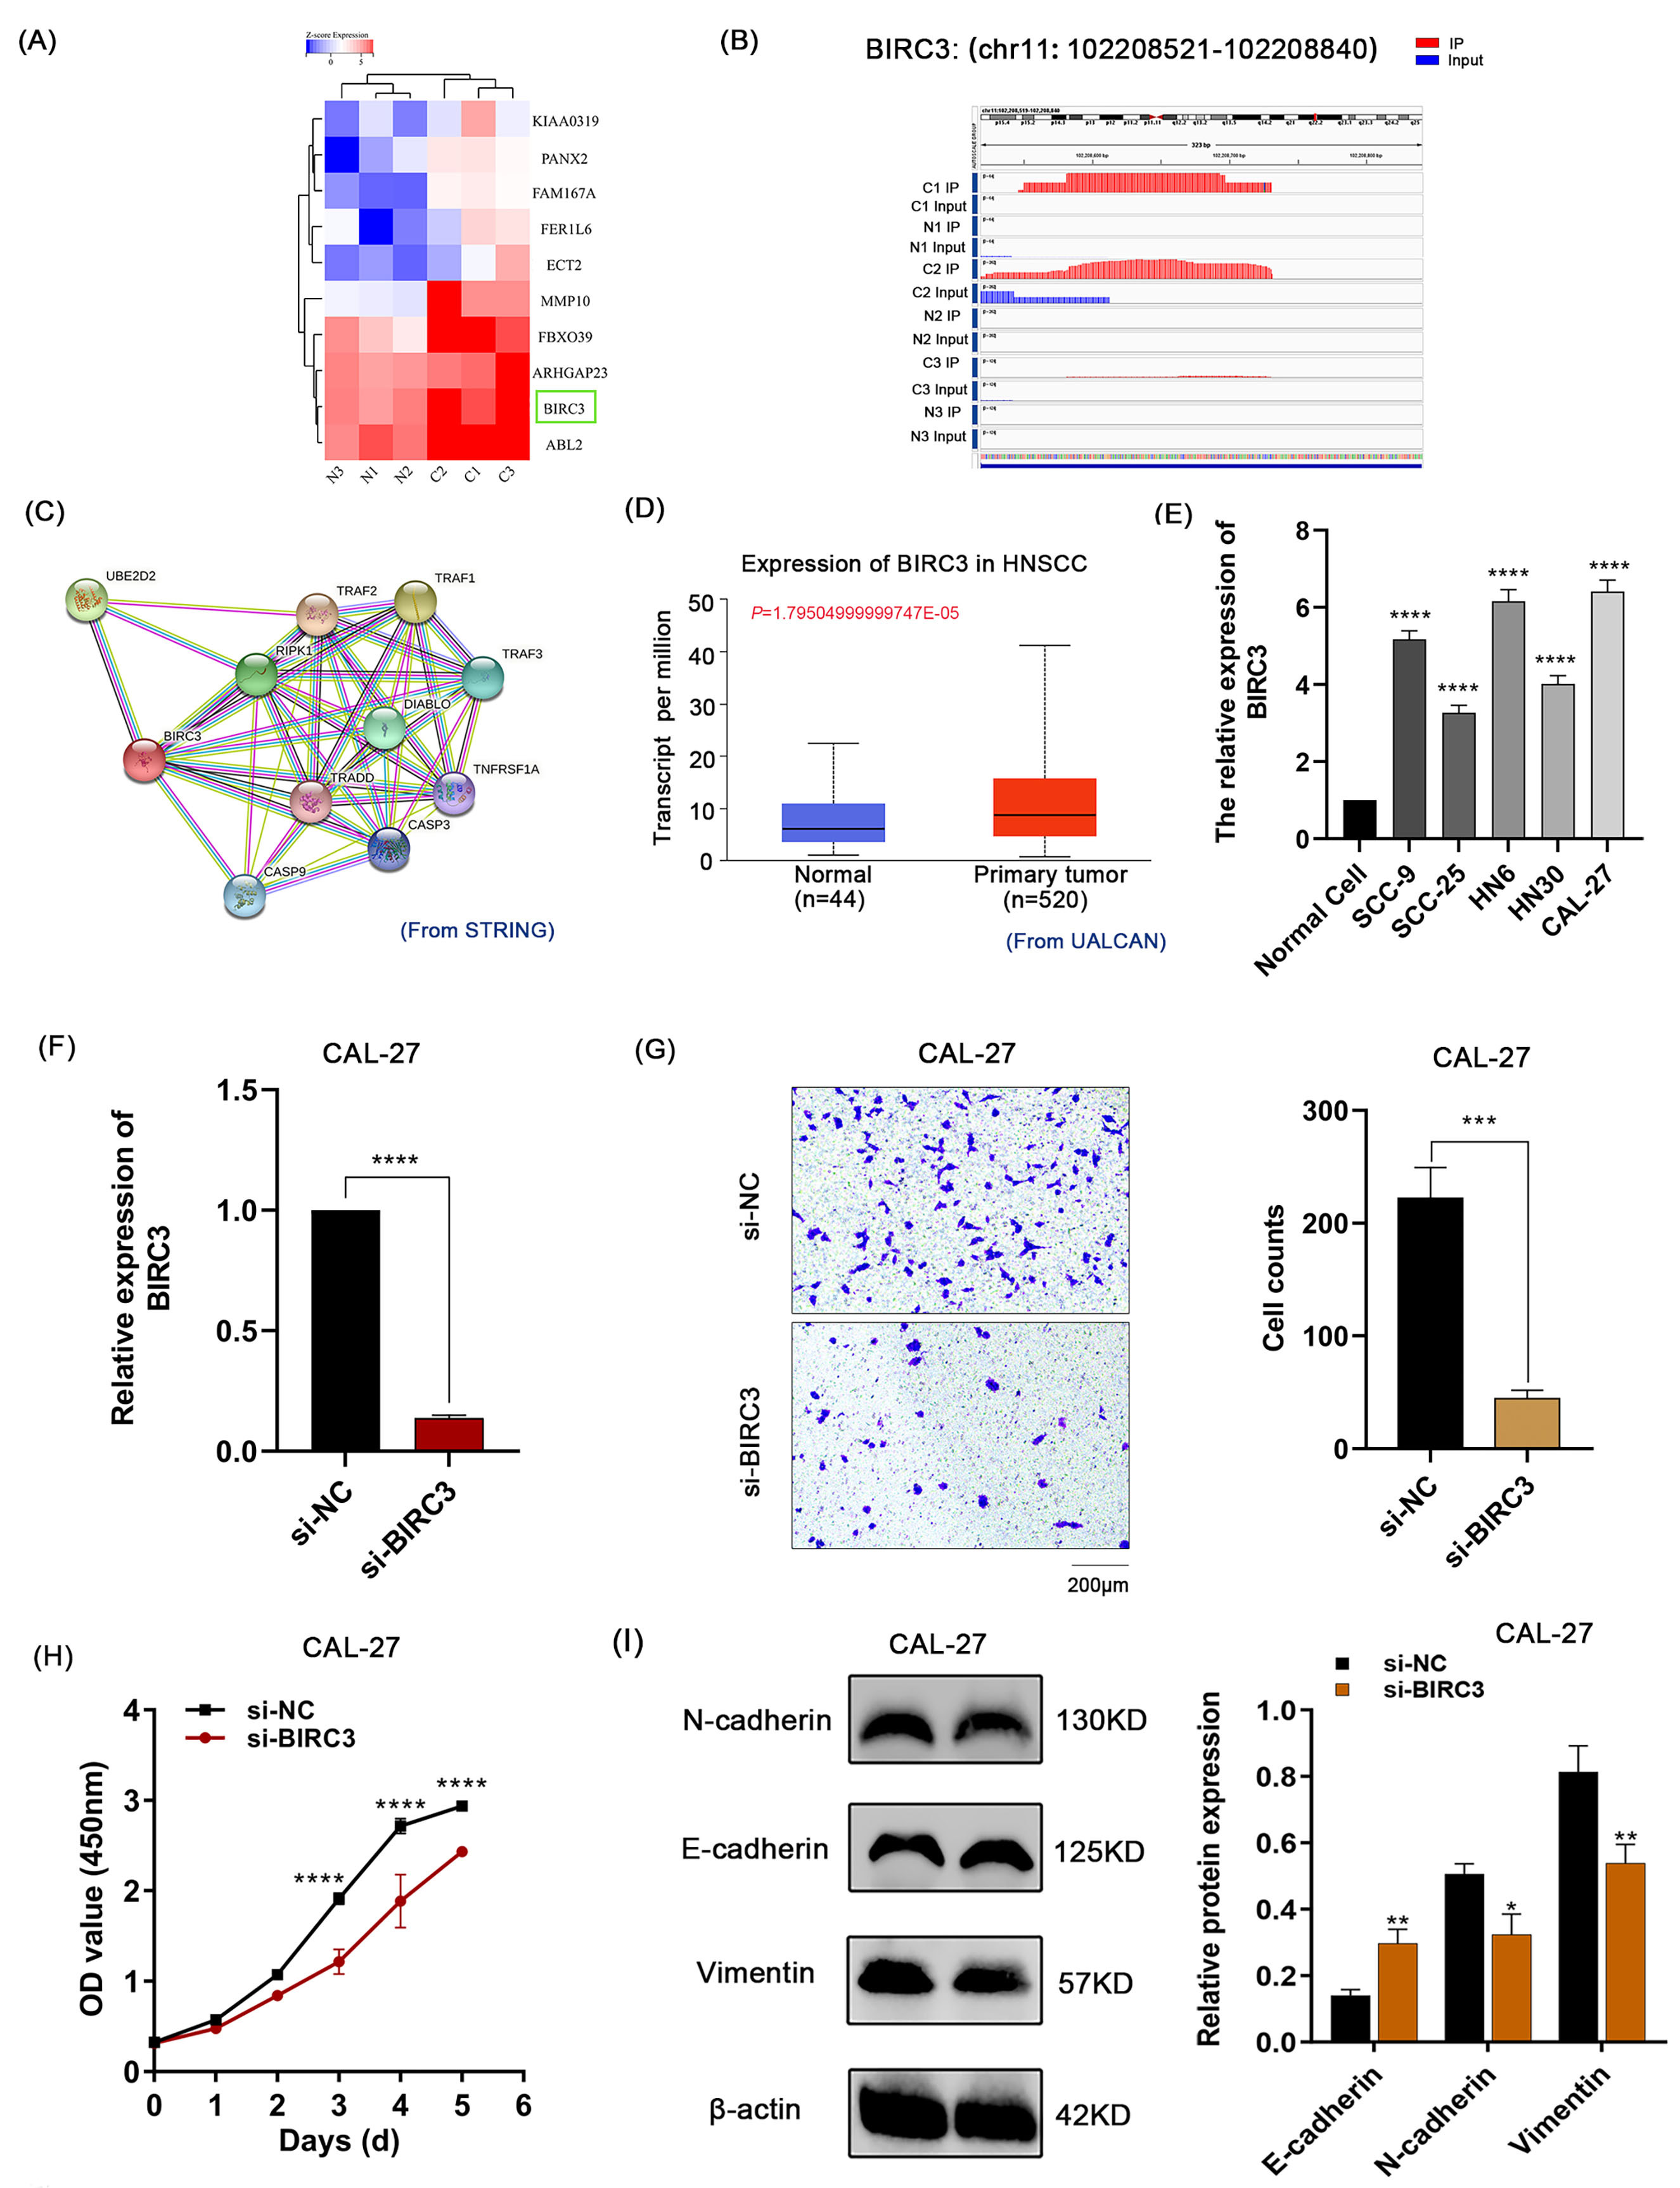 Fig. 5.
The Bioinformatic characterization and biological functions of
the BIRC3 gene in OSCC. (A) The heatmap showed the top 10 upregulated
genes with hypermethylation sites. (B) Visualization of the m7G peak site
(chr11:102208521-102208840) in the BIRC3 gene in OSCC tissues. (IP:
immunoprecipitation; Red: IP; Blue: Input). (C) The PPI network of BIRC3
was constructed by the STRING software. (D) Gene differential expression analysis
from UALCAN showed that the mRNA expression of BIRC3 was significantly
upregulated in HNSCC tissues. (E) The high expression of BIRC3 in OSCC
cell lines was verified by qPCR assay. (F) The knockdown of BIRC3 at the
mRNA level in CAL-27 cells was confirmed by qPCR assay. (G) The Transwell
migration assay showed the migration of CAL-27 cells transfected with si-BIRC3
was significantly inhibited. (H) The proliferation ability of CAL-27 transfected
with si-BIRC3 was significantly reduced in the CCK-8 assay. OD, optical density.
(I) The relative expression of EMT marker protein E-cadherin was significantly
increased in the CAL-27 cells transfected with si-BIRC3, while the N-cadherin and
Vimentin proteins were significantly decreased using Western blot assay. (*:
p
Furthermore, UALCAN (Fig. 5D), TIMER and GEPIA (Supplementary Fig. 3A,B) showed that BIRC3 was highly expressed in HNSCC tissues. Then, the expression of BIRC3 was upregulated in OSCC cell lines (SCC-9, SCC-25, HN6, HN30, and CAL-27), as confirmed by qPCR assay (Fig. 5E). To further investigate the biological function of BIRC3 in OSCC, CAL-27 cells transfected with si-BIRC3 were constructed. The BIRC3 expression in CAL-27 cells was knocked down by the qPCR assay (Fig. 5F). Functionally, the migration of CAL-27 cells transfected with si-BIRC3 was significantly inhibited in the Transwell migration assay (Fig. 5G). The proliferation of CAL-27 cells transfected with si-BIRC3 was significantly decreased, as determined by the CCK-8 assay (Fig. 5H). The relative expression of (epithelial-mesenchymal transition, EMT)-related marker protein E-cadherin was significantly increased in the CAL-27 cells transfected with si-BIRC3. In contrast, the expression of N-cadherin and Vimentin proteins was significantly decreased in the Western blot assay (Fig. 5I). These results suggests that the knockdown of BIRC3 could inhibit the biological behavior of OSCC in vitro, which may be related to the process of EMT.
m7G methylation is a common RNA modification that can affect tumor progression, recurrence, and metastasis [35]. Additionally, previous studies have found that m7G methylation usually acts through methyltransferases, and the methyltransferases that have been identified and studied include methyltransferase-like1 (METTL1), WD repeat domain 4 (WDR4), Williams Beuren syndrome chromosome region 22 (WBSCR22) and RNA guanine-7 methyltransferase (RNMT) [35, 36]. The METTL1/WDR4 complex, identified as an m7G methyltransferase of tRNAs, may influence the metabolic process of RNA, which affects the progression of tumors [14]. A recent study reported that m7G-modified tRNA catalyzed by the METTL1/WDR4 complex could stabilize tRNAs, enhancing the translation of oncogenic genes in HNSCC [14]. Importantly, METTL1 has been revealed to be a methyltransferase that installs a subset of m7G into mRNAs [11]. Whether the METTL1/WDR4 complex in OSCC can affect the gene expression by mediating their internal m7G methylation levels needs to be further explored.
To explore the role of m7G methylation in diseases progession, researchers
developed the MeRIP-seq technology based on specific m7G antibodies for
transcriptional profiling of m7G methylation in human cells or tissues [11, 13, 37]. Likewise, to understand the status of m7G methylation in OSCC, the m7G
MeRIP-seq method was used to measure the internal m7G methylated levels of mRNAs
in OSCC and normal tissue in this study. However, m7G MeRIP-seq method still has
limitations in detecting the internal mRNAs, which might result in the minor
overlap in m7G peaks [11, 38]. This result revealed the difference in m7G
methylation between OSCC and normal tissue, suggesting that m7G methylation might
be associated with the progress of OSCC. Importantly, the mechanism by which m7G
regulates gene expression was closely related to the distribution region of m7G
methylation within mRNAs [39]. It was found that gene expression was closely
associated with elevated levels of m7G methylation in the CDS region, which might
promote mRNA translation efficiency and protein expression [40]. Interestingly,
it showed that m7G methylation was mainly enriched in the CDS region in OSCC
tissues. Notably, the results also showed that there were more m7G peaks in the
5
The Bioinformatics function analysis showed that differentially methylated genes were associated with ABC transporters and the AMPK signaling pathway in OSCC tissues. Significantly, these cellular biological functions are associated with cancer progression. OSCC patients often develop multidrug resistance during clinical treatment, which significantly reduces the efficacy [42]. Previous studies have shown that high expression of ABC transporter (ABCC1 and ABCG2) promotes multidrug resistance in OSCC [42]. Moreover, the AMPK signaling pathway could participate in the proliferation migration in OSCC [43] and is critical in tumor metabolism [44]. We hypothesize that hypo m7G-modified genes in OSCC tissues might lead to abnormalities in tumor metabolism, which would be related to cancer progression. Thus, many cellular biological functions of these differentially methylated genes may provide clues to further clarify further the specific role of m7G methylation in OSCC.
This study showed the correlation between mRNA expression and m7G methylation, and 1221 hyper-upregulated genes and 1645 hypo-downregulated genes were identified. The hub genes TP73, CASP1, RUNX3, ACTN2, PPKACA and MEF2C were screened from the PPI network constructed for these genes. Previous studies demonstrated these hub genes could affect tumor development [45, 46, 47]. For example, TP73 is highly expressed in OSCC and can influence cell biological processes of tumorigenesis, such as apoptosis, autophagy and metabolism in tumors [45, 46]. The downregulated expression of ACTN2 in OSCC is associated with increased survival [47]. However, these genes’ RNA methylation and regulatory roles have been poorly studied. Therefore, the m7G-modified hub genes provides significant value for studying the specific regulatory mechanisms of m7G methylation in OSCC. Notably, we screened the essential m7G-modified gene BIRC3 by co-analysis.
BIRC3 is a member of the inhibitors of apoptosis proteins (IAPs) family, which can be involved in cellular bioprocesses through the regulation of cysteine asparaginase and the signaling of mitotic kinases [48]. Notably, the highly expressed BIRC3 is significantly correlated with poor prognosis and chemotherapy resistance among multiple cancers, including non-small cell lung cancer [49], esophageal squamous cell carcinoma [50], HNSCC [51], and colorectal cancer [52]. Previous studies have reported that the BIRC3 gene can act as an oncogenic factor in HNSCC [51]. Our sequencing results showed that the highly expressed BIRC3 gene had high m7G methylation, and it was identified that the expression of BIRC3 was higher in OSCC cell lines than in normal cells, consistent with the sequencing results. Furthermore, high-expressed BIRC3 in OSCC was associated with poor prognosis, lymph node metastasis, and radiotherapy resistance [53, 54]. The expression of BIRC3 up-regulated by circDOCK1 was found to inhibit OSCC cell apoptosis [55]. In this study, the function of BIRC3 with high m7G methylation in OSCC was also explored. BIRC3 could promote the ability of proliferation and migration and the progress of EMT. Previous studies found that the Snail transcription factor could interact with BIRC3, thus promoting ovarian carcinogenesis [56]. The mechanisms by which BIRC3 affects EMT progression need further investigation.
The m7G methylation difference in internal mRNAs between OSCC and normal tissues were analyzed. GO and KEGG pathway analyses revealed that m7G-modified genes were closely associated with cancer progression. Furthermore, BIRC3 could promote the biological behavior of OSCC in vitro, which may be related to the process of EMT. This article identified critical m7G-modified genes and investigated their potential functions, providing a foundation for further research on the role of m7G methylation in OSCC.
OSCC, Oral squamous cell carcinoma; MeRIP, Methylated RNA immunoprecipitation; m7G, N7-methylguanosine; rRNA, Ribosomal RNA; tRNA, Transfer RNA; miRNA, MicroRNA; CDS, Coding Sequence; GO, Gene Ontology; KEGG, Kyoto Encyclopedia of Genes and Genomes; DAVID, Database for Annotation, Visualization and Integrated Discovery; TIMER, Tumor Immune Estimation Resource; UALCAN, University of Alabama at Birmingham Cancer Data Analysis Portal; GEPIA, Gene Expression Profiling Interactive Analysis; PPI, protein-protein interaction; STRING, Search Tool for Retrieval of Interacting Genes/Proteins software; DMEM, Dulbecco’s Modified Eagle’s Medium; FBS, fetal bovine serum; siRNA, Small interfering RNA; qPCR, quantitative real-time PCR; CCK-8, Cell Counting Kit-8; OD, optical density; IP, Immunoprecipitation; BP, biological processes; CC, cellular component; MF, molecular function; ABC transporters, ATP-binding cassette transporters; BIRC3, Baculoviral IAP Repeat Containing 3; AML, Acute Myeloid Leukemia; HNSCC, Head and neck squamous Cell carcinoma; METTL1, Methyltransferase-like 1; WDR4, WD repeat domain 4; RNMT, RNA guanine-7 methyltransferase; WBSCR22, Williams Beuren syndrome chromosome region 22; UTR, Untranslated Region; AMPK, Adenosine 5 monophosphate (AMP)-activated protein kinase; EMT, epithelial-mesenchymal transition; m6A, N6-methyladenosine; Igv, Integrative Genomics Viewer; lncRNA, long noncoding RNA.
Data supporting the findings of this study are available within the paper and its Supplemental informationfiles. The datasets presented in this study have been deposited in the NCBI GEO database [17].
YJ designed the research. ML, NS and DS contributed to acquisition and analysis of data and drafting the manuscript. YY and WZ performed the data analysis. XZ and MX performed the statistical analysis. JY and RS participated in image organization and data analysis. TG contributed to the writing and cellular ex periments. All authors contributed to editorial changes in the manuscript. All authors read and approved the final manuscript. All authors have participated sufficiently in the work and agreed to be accountable for all aspects of the work.
Tissue samples for research were collected in accordance with the Declaration of Helsinki and was approved by the Ethics Committee of Weifang Medical University (ethics number: 2022YX007). The informed consent was obtained from all patients.
We thank all subjects who participated in this study. We thank Cloud-Seq Biotech Ltd. Co. (Shanghai, China) for the MeRIP-Seq service.
This study was supported by grants from the National Natural Science Foundation of China (82103008), Shandong Provincial Natural Science Foundation (ZR2023LSW019, ZR2020MH192, ZR2022QH122), 2021 Youth Innovation Talent Introduction and Education Program of Shandong Province Universities (for YYJ), National College Students Innovation and Entrepreneurship Training Program (202310438050), Shandong Provincial College Students Innovation and Entrepreneurship Training Program (S202310438051), the College students Innovation and Entrepreneurship Training program of Weifang Medical University (X2023050, X2023051, X2023376), and the National Facility for Translational Medicine (Shanghai) (TMSF-2021-2-003).
The authors declare no conflict of interest.
Publisher’s Note: IMR Press stays neutral with regard to jurisdictional claims in published maps and institutional affiliations.