


 , Yunfeng Li 1,*
1 Department of Colorectal Surgery, Yunnan Cancer Hospital, The Third Affiliated Hospital of Kunming Medical University, 650118 Kunming, Yunnan, China
2 Department of Head and Neck Tumor Surgery, Yunnan Cancer Hospital, The Third Affiliated Hospital of Kunming Medical University, 650118 Kunming, Yunnan, China
3 Laboratory of Molecular Diagnosis Center, Yunnan Cancer Hospital, The Third Affiliated Hospital of Kunming Medical University, 650118 Kunming, Yunnan, China
4 Department of Hospital Affairs, Yunnan Cancer Hospital, The Third Affiliated Hospital of Kunming Medical University, 650118 Kunming, Yunnan, China
5 Department of Oncology, Yunnan Cancer Hospital, The Third Affiliated Hospital of Kunming Medical University, 650118 Kunming, Yunnan, China
6 Department of Minimally Invasive Intervention, Yunnan Cancer Hospital, The Third Affiliated Hospital of Kunming Medical University, 650118 Kunming, Yunnan, China
†These authors contributed equally.
Abstract
Background: Colorectal cancer (CRC) is the third most
common cancer and one of the leading causes of death worldwide. Seriously
threatens human life and health. Previous studies have identified that inhibin
Keywords
- colorectal cancer
- HNF1A-AS1
- miR-214
- INHBA
- TGF-β/Smad
Colorectal cancer (CRC) is one of the most common gastrointestinal malignancies. In 2020, the incidence of CRC ranked third and the mortality rate ranked second [1]. In addition, CRC is the third most common cancer in males and the second most common in females, with approximately 1.9 million new cases and 0.9 million deaths in 2020 worldwide [2]. CRC is a heterogeneous disease, regulated by numerous factors and intricate biological process, and its occurrence and developmental mechanism remains to be elucidated [3]. In recent years, epigenetic and transcriptome changes have attracted the attention of researchers due to their significant role in tumor development [4, 5].
MiRNA is a noncoding single-stranded RNA (19–25 nt) derived from endogenous hairpin structure transcripts, and is a noncoding small molecular RNA. MiRNAs can induce target gene mRNA degradation or target gene translation inhibition through the 3 ‘UTR region or coding region specific base pairing combination, thus regulating target gene expression at the post-transcriptional level [6, 7]. Studies have shown that miRNAs play a crucial role in tumor growth, apoptosis, invasion and metastasis [8]. They restrain the expression of target genes by combining with the translation of target genes, and then participate in the regulation of 30% human protein expression, tumorigenesis, development and metastasis [9]. Long noncoding RNA (LncRNA) also has an important role in the research of human tumors. As a competitive endogenous RNA (ceRNA), LncRNA performs a vital role in tumorgenesis by binding miRNAs to regulate the expression of target genes [10, 11].
Inhibin is a homodimer or heterodimer consisting of
Based on the transcriptome data of 473 colon cancer tissues and 41 adjacent
tissues collected in the cancer genome atlas (TCGA) database
(https://www.cancer.gov/about-nci/organization/ccg/research/structural-genomics/tcga),
our research team found that INHBA was highly expressed in cancer
tissues, and the expression of INHBA significantly positively correlated
with the T stage of tumor, that is, the higher the expression level of
INHBA, the later the T stage of patients. The survival curve analysis
of gene expression profiling the interactive analysis (GEPIA) database
(http://gepia.cancer-pku.cn/) demonstrated that the expression level of
INHBA was negatively correlated with the survival rate of colon cancer
patients, that is, the higher the expression level of INHBA, the lower
the survival rate of colon cancer patients. RT-qPCR and western blot tests were
performed on 17 clinical tumor tissues and para-cancerous tissues. The results
showed that the mRNA and protein levels of INHBA were highly expressed
in tumors. In addition, immunohistochemical (IHC) staining also demonstrated that
INHBA protein was brownish yellow, was principally located in the
cytoplasm, and had high expression of INHBA in cancer tissue. LncRNA
HNF1A antisense RNA 1 (HNF1A-AS1) is a 2.455 kb lncRNA located
on chromosome 12q24.31. It is transcribed from the opposite strand of the
HNF1A gene
[15]. Previous
studies showed that HNF1A-AS1 and miR-214 were
closely related to the progression of CRC, and bioinformatics confirmed that
miR-214 specifically targets the 3’UTR of the INHBA gene.
Further analysis indicated that the expression of HNF1A-AS1 and
miR-214 was consistent in the TCGA database and experiments. In
addition, previous studies have shown that the INHBA gene can regulate
the TGF-
We collected 60 pairs of CRC tumor and para-cancer tissues from the Yunnan Cancer Hospital/The Third Affiliated Hospital of Kunming Medical University. The age of the CRC patients ranged from 46 to 69 years, including 31 males and 29 females. Baseline demographic and clinical characteristics of all 60 CRC patients were collected. All tumors and adjacent tissues removed from the patient were immediately placed in liquid nitrogen and transported to the laboratory within 2 hours for storage in a –80 °C degree refrigerator. Written informed consent was obtained from all participants prior to their enrollment in the study. The protocols for the present study were approved by the Medical Institutional and Clinical Research Ethics Committee of the Yunnan Cancer Hospital, the Third Affiliated Hospital of Kunming Medical University (refers to the same entity) in accordance with the “Declaration of Helsinki” on the ethical principles for medical research involving human subjects.
Previous studies have demonstrated that HNF1A-AS1 is a potential long noncoding RNA which regulates tumor progression. Using the TCGA database, we analyzed the expression of HNF1A-AS1 in 33 different tumors and adjacent tissues. In addition, we analyzed the expression of HNF1A-AS1 in colon cancer and rectal cancer tissues and corresponding para-cancer tissues and its association with overall survival (OS). We further verified differences in HNF1A-AS1 expression in colon cancer and rectal cancer in relative para-cancer tissues in the two databases.
First, we used the “limma 2.11” R package to analyze the differences in
HNF1A-AS1 expression in 477 tumors and 41 neighboring tissues in the
TCGA database. Then, we analyzed HNF1A-AS1 in 125 immune related genes
related to the distribution in the tumor and nearby tissue. Differential
screening was set at a threshold for
To explore the potential functions of 125 immune-related genes associated with
HNF1A-AS1, GO (is an internationally standardized classification system
of gene functions that provides a dynamically updated and controlled vocabulary
to comprehensively describe the properties of genes and gene products in an
organism) function and Kyoto Encyclopedia of Genes and Genomes (KEGG) pathway
enrichment analyses were performed using the R package ‘clusterprofiler’ R
package. In the analysis results, pathways or functions with a p value
The human normal colon epithelial cell lines (NCM460) and the human colon cancer cell lines (HCT116, HT29, SW480, SW620, and LOVO) were purchased from the
Cell Bank of the Chinese Academy of Sciences (Shanghai, China). The NCM460 and HCT116
cells were cultured in the Roswell Park Memorial Institute-1640 (RPMI-1640;
MeilunBio, Dalian, China) and Dulbecco’s modified Eagle’s medium (DMEM; Procell,
Wuhan, China). The HT29 and SW480 cells were cultured in L15 media (Leibovitz’s L-15;
Procell), the SW620 and LOVO cells were cultured in F12K media (Ham’s F-12K; Procell).
Media were supplemented with 10% fetal bovine serum (FBS; Procell) and
100 µg/mL penicillin-streptomycin solution (Procell).
Cells were grown at 37 °C incubator with 5% CO
Using Lenti-Pac™ HIV Expression Packaging Kit (GeneCopoeia, Guangzhou, China), the interference plasmid and over-expression plasmid were transfected into 293T cells with DNA-lipofectamine 2000 reagent (Invitrogen; Carlsbad, CA, USA) The complete medium was changed 8 h after transfection. After 48 h of incubation, the culture supernatant rich in lentivirus particles was collected and stored at –80 °C. Following polybrene™ (Merck KGaA, Darmstadt, Germany)-assisted HNF1A-AS1 interference of lentivirus for 72 h, 1 µg/mL puromycin was used to screen the transfected positive cells. The medium was changed every 2 days and screening with complete medium was continued for 2 weeks to expand the cell culture. All cell lines were genotyped for identity by Shanghai Biowing Applied Biotechnology Co., Ltd. Mycoplasma Removal Agent (0.02ug /ml,C0288M, Biyuntian, Shanghai, China) was added during the experiment. The cell morphology was observed under the microscope, which was similar to that of the ATCC cell bank. STR identification was performed on the experimental cells.
Cell viability was demonstrated by a MTT kit (Solarbio, Beijing, China). After performing various treatments, HT29 and SW-480 cells and their transfection with HNF1A-AS1 shRNA and INHBA shRNA were cultured in 96-well plates for 24, 48, 72 and 96 h, respectively. Fresh media were mixed with MTT solution and serially added into culture plates. 4 h later, dimethyl sulfoxide (Sigma, St. Louis, MO, USA) was added into wells to dissolve formazan. Samples were assessed by microplate reader (Thermo Fisher, New York, NY, USA), and results were obtained by analyzing the output of the wavelength at 490 nm.
Cell apoptosis was determined by an Annexin V-fluorescein isothiocyanate (Annexin V-PE; Procell) detection kit (Solarbio). Briefly, cultured cells were digested with trypsin (Thermo Fisher), and suspended in binding buffer (Solarbio). Annexin V-PE (Solarbio) and 7-aminoactinomycin D (7-AAD; Solarbio) were then serially incubated with cells in the dark. Finally, samples were analyzed with a flow cytometer (Thermo Fisher).
In preparation of cell suspension, the cells were digested with 0.25% trypsin
and collected, and the cells were resuspended and counted with culture
supernatant. The cells were seeded into 96-well plates by 4
The invasion of HT29 and SW480 cells and their transfection with
HNF1A-AS1 shRNA and INHBA shRNA, respectively, was investigated
with transwell chambers with Matrigel (Corning, Madison, NY, USA). Cells were
seeded in the upper chambers with FBS-free DMEM or L15 media (Procell). DMEM or
L15 media containing 15% FBS (Procell) were added into the lower chambers. After
24 h of culture, the cell supernatant was discarded and cells were singly
incubated with methanol (Sigma) as well as crystal violet (Sigma). Results were
analyzed by counting the cell numbers in the lower chambers under a microscope
(Nikon, Tokyo, Japan) at a 100
The relative expression of miRNAs, which is tightly linked with HNF1A-AS1, was detected by RT-qPCR in clinical CRC and para-cancer tissues. Subsequently, the association between differentially expressed miRNAs and HNF1A-AS1 was analyzed.
The miRDB, miRWalk, and TargetScan databases were utilized to predict the target genes of hsa-miR-214. RT-qPCR was used to detect the relative expression level of target genes located in the overlapping region. The relative expression levels of INHBA in CRC and para-cancer tissues were analyzed from the TCGA database. In addition, the expression of INHBA at different stages of CRC and its association with disease-free survival (DFS) and OS were analyzed.
Samples were homogenized with Trizol reagent (Takara, Kyoto, Japan), and total RNA was extracted according to the Trizol kit (Takara) instructions. After quantification by NanoDrop 2000 (Takara), 200 ng total RNA was utilized by the ReverTra Ace qPCR RT Kit (Takara) for reverse transcription according to the instructions. THUNDERBIRD SYBR® qPCR Mix (Takara) was used for quantitative Reverse Transcription Polymerase Chain Reaction (qRT-PCR) analysis. CFX96 Touch Real-Time PCR Detection System (Bio-RAD, Hercules, CA, USA) was used for RT-qPCR. GAPDH was used as an internal reference when determining the contents. Corresponding primer sequences are listed in Table 1.
| Name | Sequence (5′-3′) |
| H-mir-214-3p | ACAGCAGGCACAGACAGGCAGT |
| H-mir-1252-3P | CAAATGAGCTTAATTTCCTTTT |
| H-mir-7151-3P | CTACAGGCTGGAATGGGCTCA |
| H-mir-3907 | AGGTGCTCCAGGCTGGCTCACA |
| H-mir-3934-3P | TGCTCAGGTTGCACAGCTGGGA |
| H-mir-4306 | TGGAGAGAAAGGCAGTA |
| H-mir-3665 | AGCAGGTGCGGGGCGGCG |
| H-mir-1303 | TTTAGAGACGGGGTCTTGCTCT |
| H-mir-4668-5P | GAAAATCCTTTTTGTTTTTCCAG |
| H-mir-10527-5P | AAAGCAAATGTTGGGTGAACGGC |
| miR-Reverse primer | GTCGTATCCAGTGCAGGGT |
| U6 F | CTCGCTTCGGCAGCACA |
| U6 R | AACGCTTCACGAATTTGCGT |
| HNF1A-AS1 F | TGATGCTGTTCCTTCTACC |
| HNF1A-AS1 R | GAGTTTCGTTCTTGTTCCC |
| GAPDH F | CCCATCACCATCTTCCAGG |
| GAPDH R | CATCACGCCACAGTTTCCC |
qRT-PCR, quantitative Reverse Transcription Polymerase Chain Reaction.
Cell lysis buffer solution was added to the sample, and total protein extract was obtained after repeated suspension and centrifugation at 4 degrees. Protein concentration in the extract was detected by the Bradford method. Sodium dodecyl sulfate polyacrylamide gel electropheresis (SDS-PAGE) was used for protein electrophoresis, followed by 300 mA constant current for 1 h to transfer the protein onto the PVDF membrane. After sealing, the primary antibody was added and shaken overnight at 4 °C. After washing the membrane, a secondary antibody was added and incubated at 37 °C for 2 h. Then luminous solution was and tablet pressing, exposure and fixing were performed. ImageJ (version 1.8.0, LOCI, University of Wisconsin, Madison, WI, USA) analysis was used to obtain the images and determine the integral optical density of protein bands. GAPDH protein was selected as the internal reference.
IHC assay was performed according to the previous process. Briefly, paraffin sections were placed at 60 °C for 2 h, then washed with dimethylbenzene solution, ethanol, and TBS in sequence. After the antigen was retrieved with citrate buffer solution, endogenous peroxidase was blocked by 1% hydrogen peroxide. Tissues were incubated with primary antibody overnight at 4 °C. Subsequently, the sections were incubated with HRP-labeled goat anti-rabbit immunoglobulin G (1:100; Abcam). Sections were visualized by diaminobenzidine. The sections were then counterstained with hematoxylin and washed by dimethylbenzene solution and ethanol. Finally, the sections were sealed with neutral balsam. The results of the immunohistochemical staining were analyzed with an optical microscope.
SPSS 23.0 software (IBM Corp., Armonk, NY, USA) was used for data analysis, and
graph pad prism 8.0 software (GraphPad Software, Inc., San Diego, CA, USA) was
used for statistical mapping. The measured data was represented by mean
GEPIA production plot analysis of LncRNA HNF1A-AS1
gene expression in multiple cancer types and paired normal samples was performed,
with each dot representing a different tumor or normal sample (Fig. 1A). It can
be seen from the TCGA database that HNF1A-AS1 is highly expressed in
Colon adenocarcinoma (COAD) and Rectum adenocarcinoma (READ)
Fig. 1). The expression level of HNF1A-AS1 in colon
and rectal cancer is correlated with OS (Fig. 1C,D). In addition, we found that
in the database of colon cancer and rectal cancer, HNF1A-AS1 was highly
expressed in cancer tissues compared with para-cancer tissues, and the difference
was statistically significant (p
 Fig. 1.
LncRNA HNF1A-AS1 is up-regulated and associated with
OS. (A,B) The expression of HNF1A-AS1 in disparate types of cancers
were exhibited with red dots and in para-cancer is shown with green dots. Data
derived from TCGA database portal in GEPIA. (B) The horizontal axis shows the
type of tumor and the height of the bar represents the median expression of
certain tumor types or normal tissue. (C) Kaplan-Meier analysis of colon cancer
patients with high (n = 134) or low (n = 135) HNF1A-AS1 levels.
Statistical analysis was performed by log-rank test. (D) Kaplan-Meier analysis of
rectal cancer patients with high (n = 45) or low (n = 45) HNF1A-AS1
levels. Statistical analysis was performed by log-rank test. (E) The expression
of HNF1A-AS1 is up-regulated in colon cancer compared with para-cancer
tissues (*p
The hierarchical cluster analysis showed
that the expression of hnf1a-as1 target genes was different in 477 tumors and 41
neighboring tissues (Fig. 2A). Similarly, there were differences in the
expression of 125 immune-related genes associated with HNF1A-AS1 (Fig. 2B). With the cut-off
 Fig. 2.
The differential expression of HNF1A-AS1 in tumor and adjacent tissues and its correlation with differential expression of miRNAs. (A) Hierarchical cluster analysis of HNF1A-AS1 expression in 477 CRC and 41 adjacent tissues; The horizontal axis represents groups, and a black line represents a sample; The vertical axis represents the target gene of HNF1A-AS1. (B) Hierarchical cluster of 125 immune related gene expression differences associated with HNF1A-AS1; The e horizontal axis represents the grouping, and a black line represents a sample; The vertical axis shows 125 immune-related genes associated with HNF1A-AS1. (C) Volcano plot of differentially expressed miRNAs (DEMs). (D) Combined with TargetScan data, HNF1A-AS1 potential associated with DEMs. CRC, colorectal cancer; DEMs, differentially expressed miRNAs
 Fig. 3.
GO annotation and KEGG pathway enrichment analysis. (A) A biological process rich in 125 genes related to immunity. (B) KEGG pathway enriched by 125 immune-related genes. GO, gene ontology; KEGG, Kyoto Encyclopedia of Genes and Genomes.
RT-qPCR results demonstrated that compared with para-cancer tissues,
hsa-miR-1252-3p, hsa-miR-214, hsa-miR-3907,
hsa-miR-4688-5p, hsa-miR-10527-5p were less expressed
(p
 Fig. 4.
Expression and correlation of HNF1A-AS1 and related
miRNAs. (A) mRNA expression of HNF1A-AS1 and related miRNAs in tumor
and normal tissues. (B) The correlation analysis between hsa-miR-1252-3p
and HNF1A-AS1 expression in CRC tissues. (C) The correlation analysis
between hsa-miR-214 and HNF1A-AS1 expression
in CRC tissues. (D) The correlation analysis between hsa-miR-3907 and
HNF1A-AS1 expression in CRC tissues. (E) The correlation analysis
between hsa-miR-4668-5p and HNF1A-AS1 expression in CRC
tissues. (F) The correlation analysis between hsa-miR-10527-5p and
HNF1A-AS1 expression in CRC tissues (*p
The miRDB, miRWalk, and TargetScan databases predicted four overlapping genes of
miR-214 target genes, namely CXCR5, GFRA1,
SNAP25 and INHBA (Fig. 5A). RT-qPCR
results showed that compared with adjacent tissues, CXCR5, GFRA1, and
SNAP25 genes were less expressed in CRC, while INHBA gene was
highly expressed in CRC (p
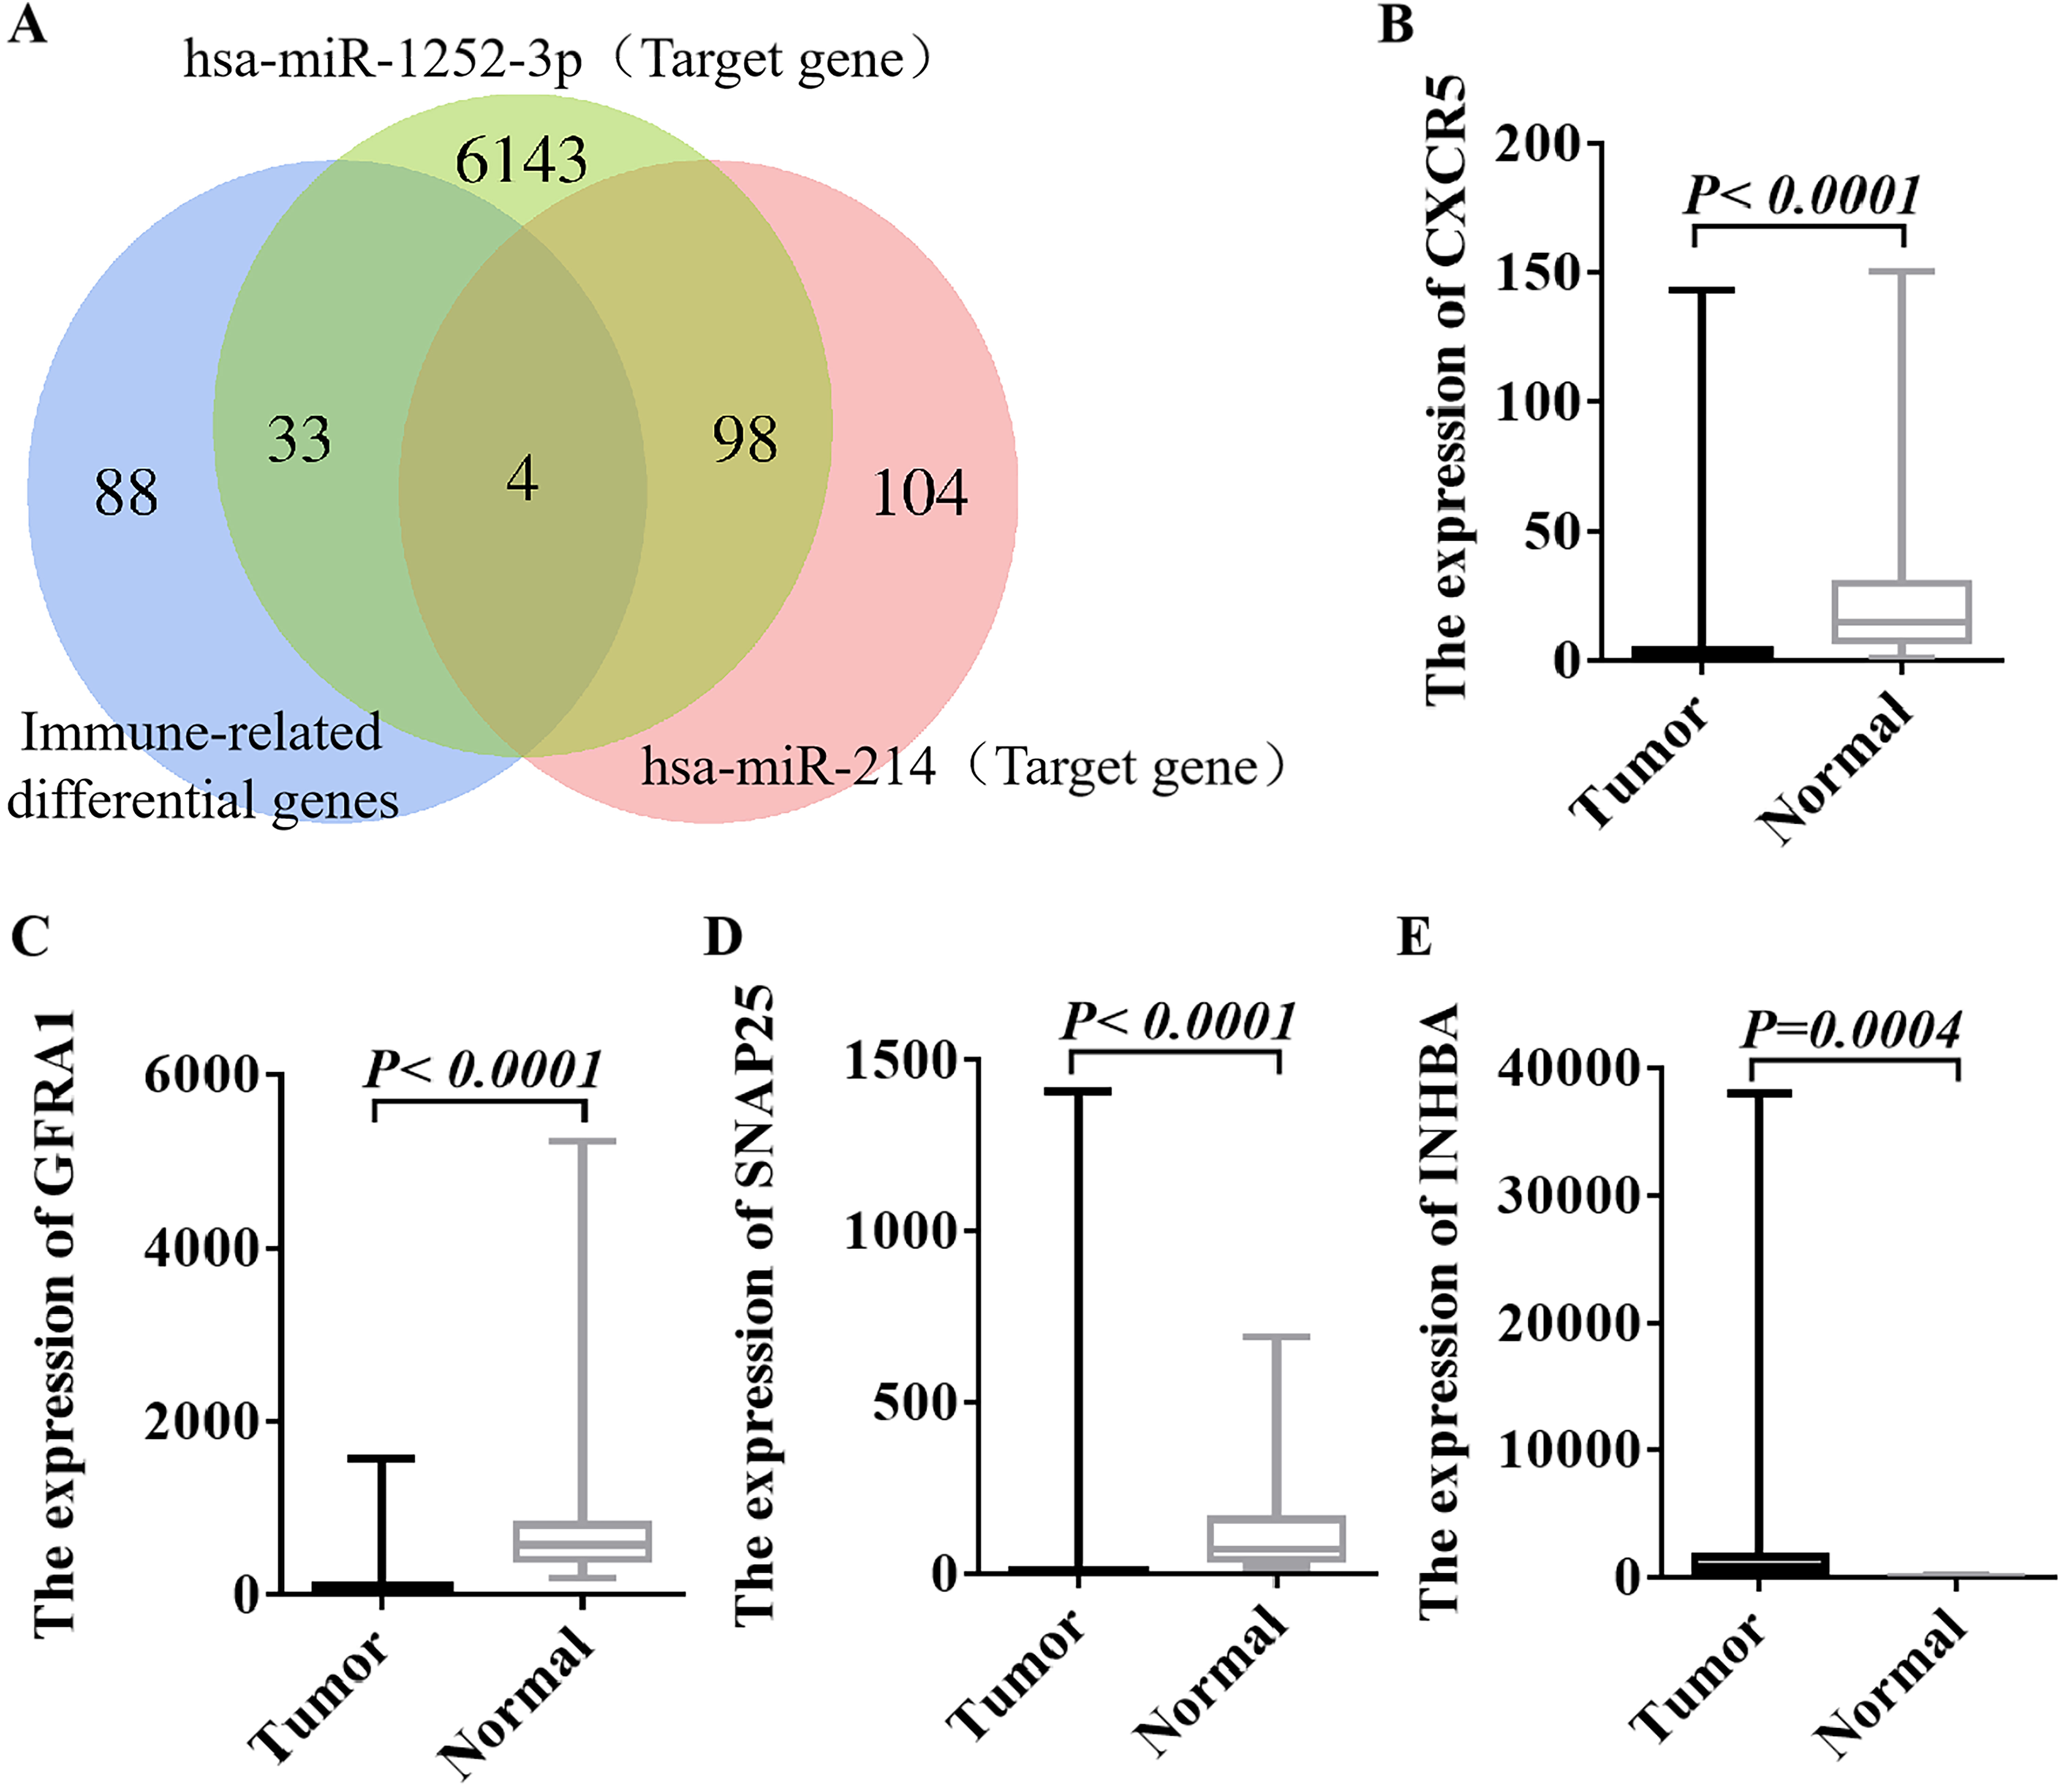 Fig. 5.
Expression levels of target genes of hsa-miR-214 in CRC
(n = 10) and normal tissues (n = 10). (A)
The miRDB, miRWalk, and TargetScan databases were utilized to predict the target
genes of hsa-miR-214. (B) Expression of CXCR5 gene in CRC and
normal tissues. (C) Expression of GFRA1 gene in CRC and normal tissues.
(D) Expression of SNAP25 gene in CRC and normal tissues. (E) Expression
of INHBA gene in CRC and normal tissues. CXCR5, CXC ligand 5; GFRA1,GDNF family receptor α1; SNAP25
, synaptosome associated protein 25; INHBA, inhibin βA; p
The specific binding sites of INHBA-3’UTR and
miR-214-5p were identified by starBase. The results indicated that
INHBA might be the target gene of miR-214-5p, that is,
miR-214-5p might regulate the expression of the INHBA gene
through a post-transcriptional mode (Fig. 6A). Through enrichment analysis of the
INHBA gene, it was found that miR-214-5p may be one of the key
miRNAs regulated upstream from INHBA (Fig. 6B). Analysis of 450 colon
cancer samples by TCGA database indicated that miR-214-5p is positively
correlated with INHBA (Fig. 6C). The TCGA database was used to analyze
the miRNAs data of 261 CRC tissues and normal control tissues. The results
demonstrated that miR-214-5p was less expressed in tumor tissues
compared with the adjacent tissues (p
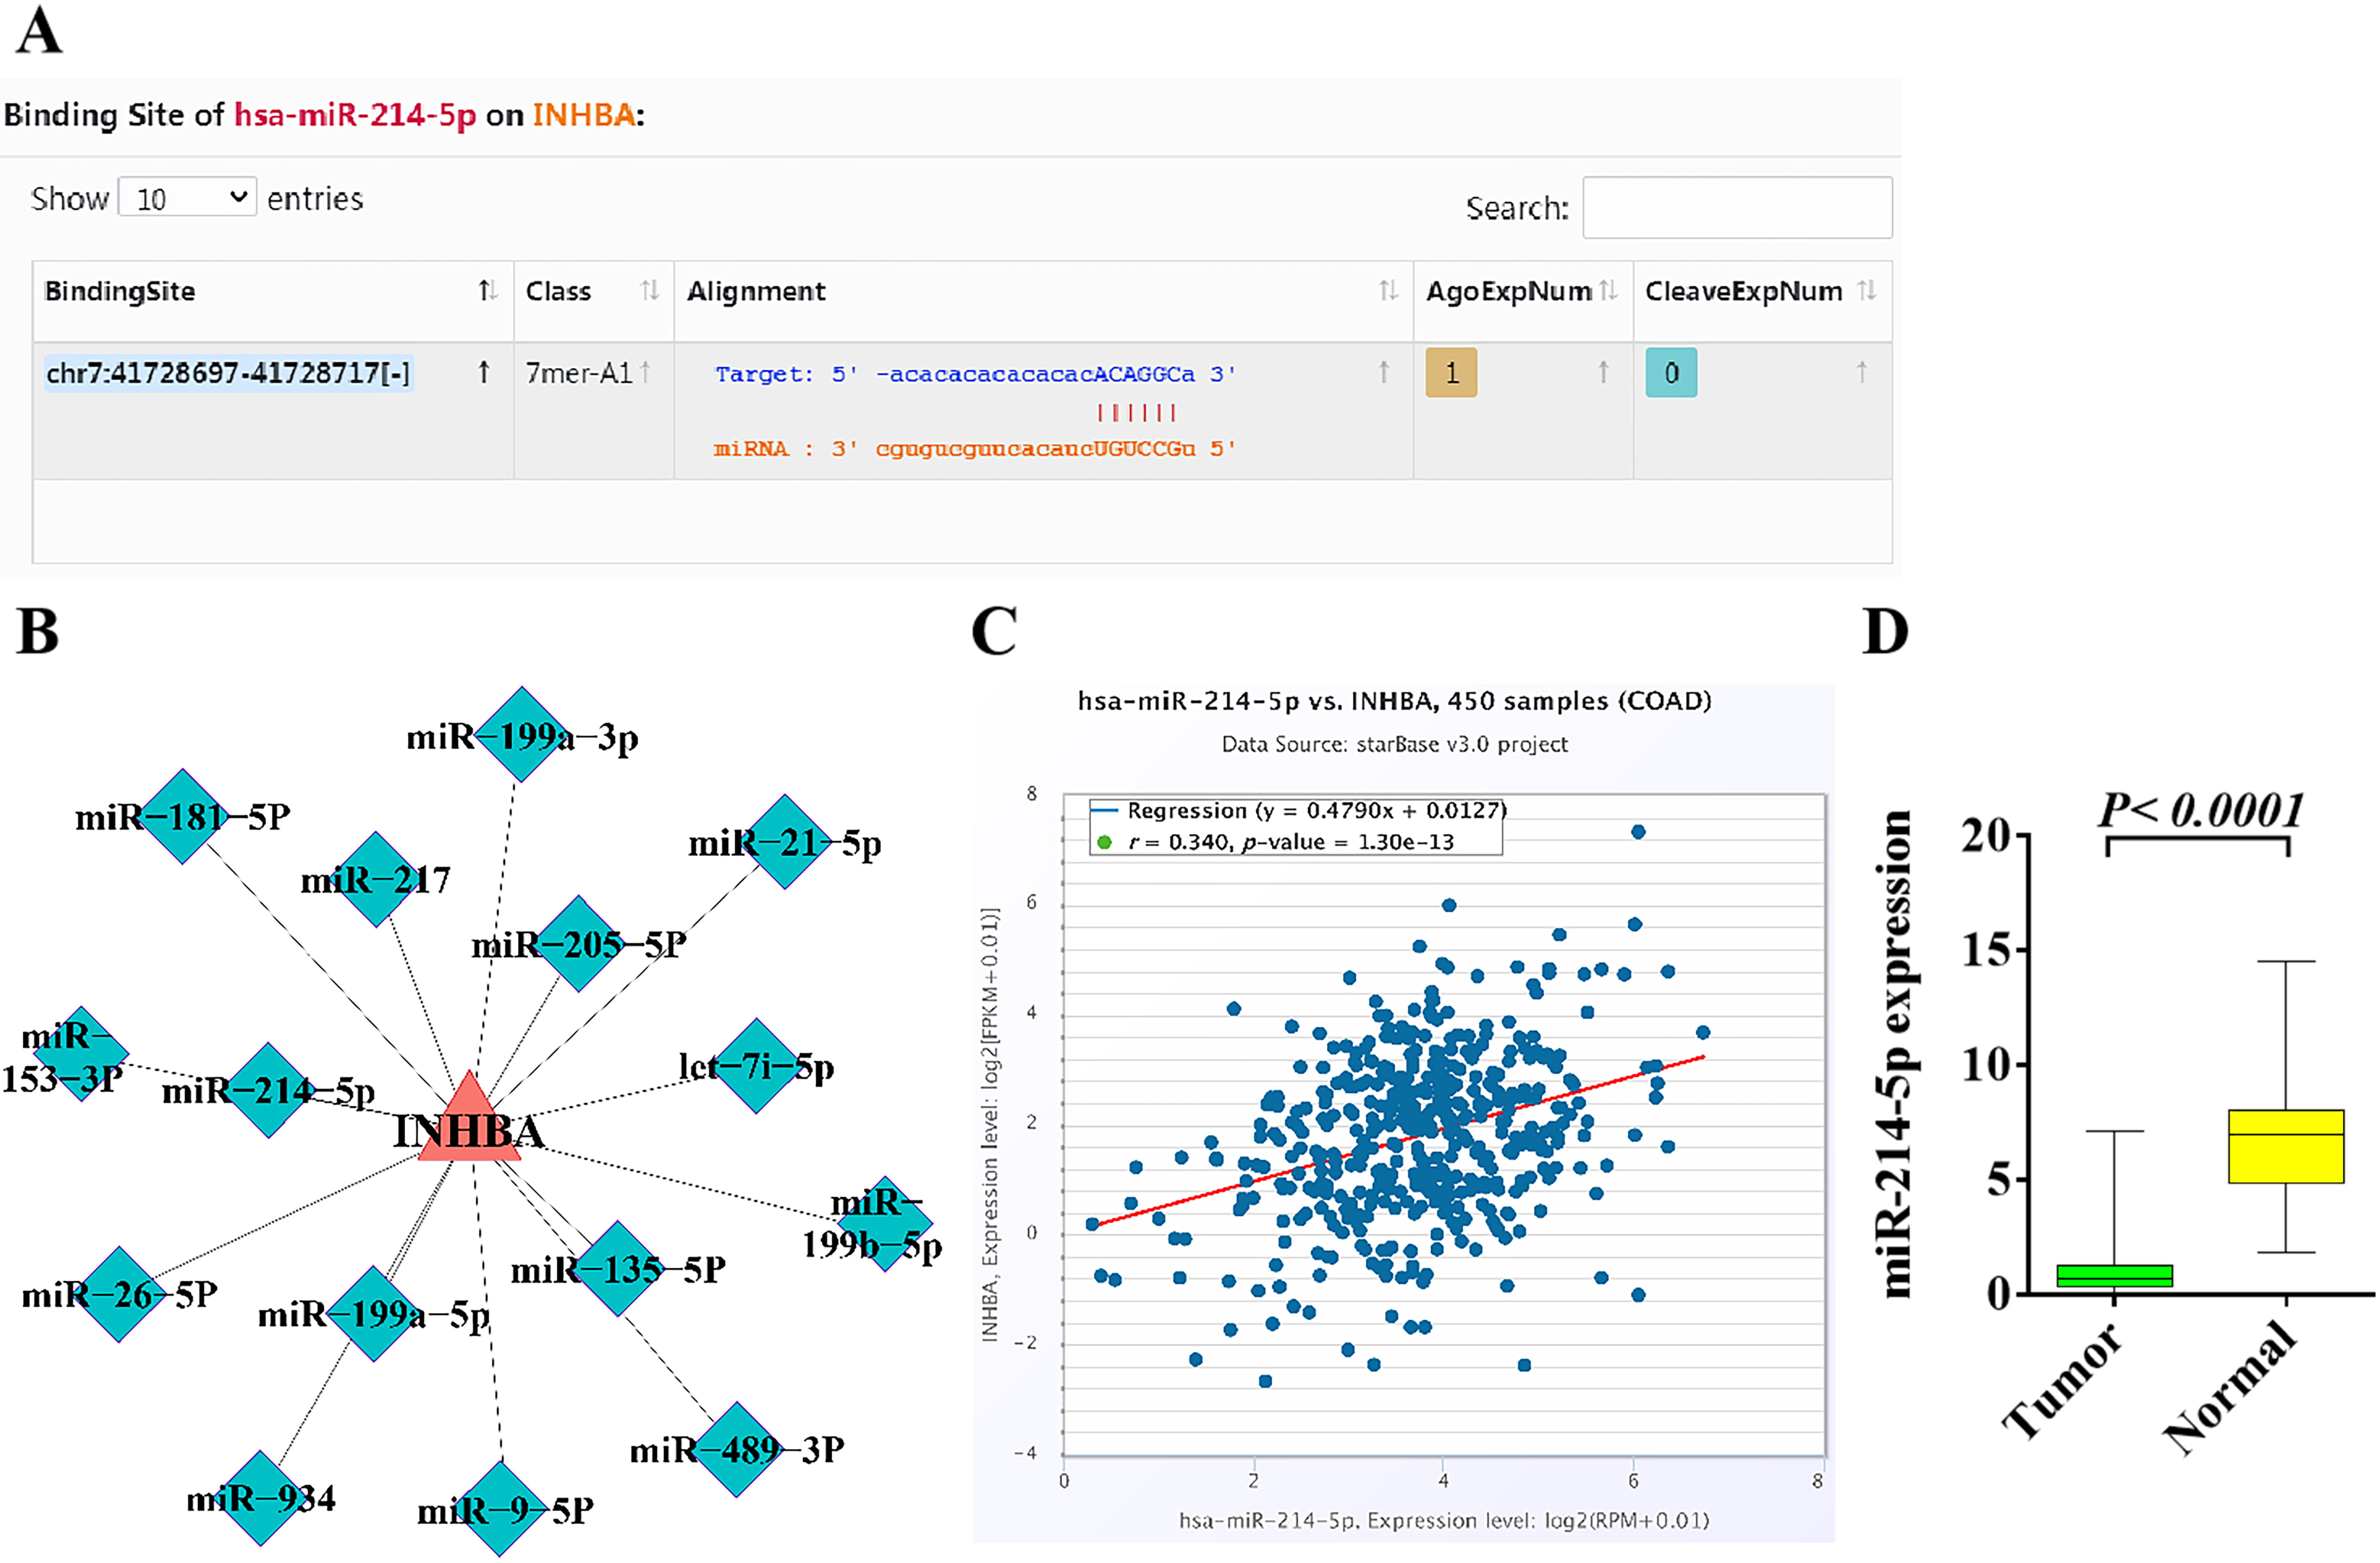 Fig. 6.
Bioinformatics analysis of the upstream and downstream
regulatory relationship between miR-214-5p and INHBA and their
expression in CRC. (A) The binding site of miRNA-214-5p in
INHBA was identified in the starBase. (B) The upstream and downstream
regulatory relationship between miRNA-214-5p and INHBA was
analyzed by enrichment. (C) miRNA-214-5p is positively correlated with
INHBA in colon cancer patients based on TCGA database. (D) The
expression of miRNA-214-5p in CRC and adjacent tissues was analyzed by
TCGA database. p
According to the transcriptome data of 473 CRC and 41 adjacent tissues gathered
in the TCGA database, it was found that INHBA was highly expressed in
cancer tissues (Fig. 7A,B), and the expression level of INHBA was
positively correlated with the T stage of tumor, that is, the higher the
expression level of INHBA, the later the T stage of patients (p
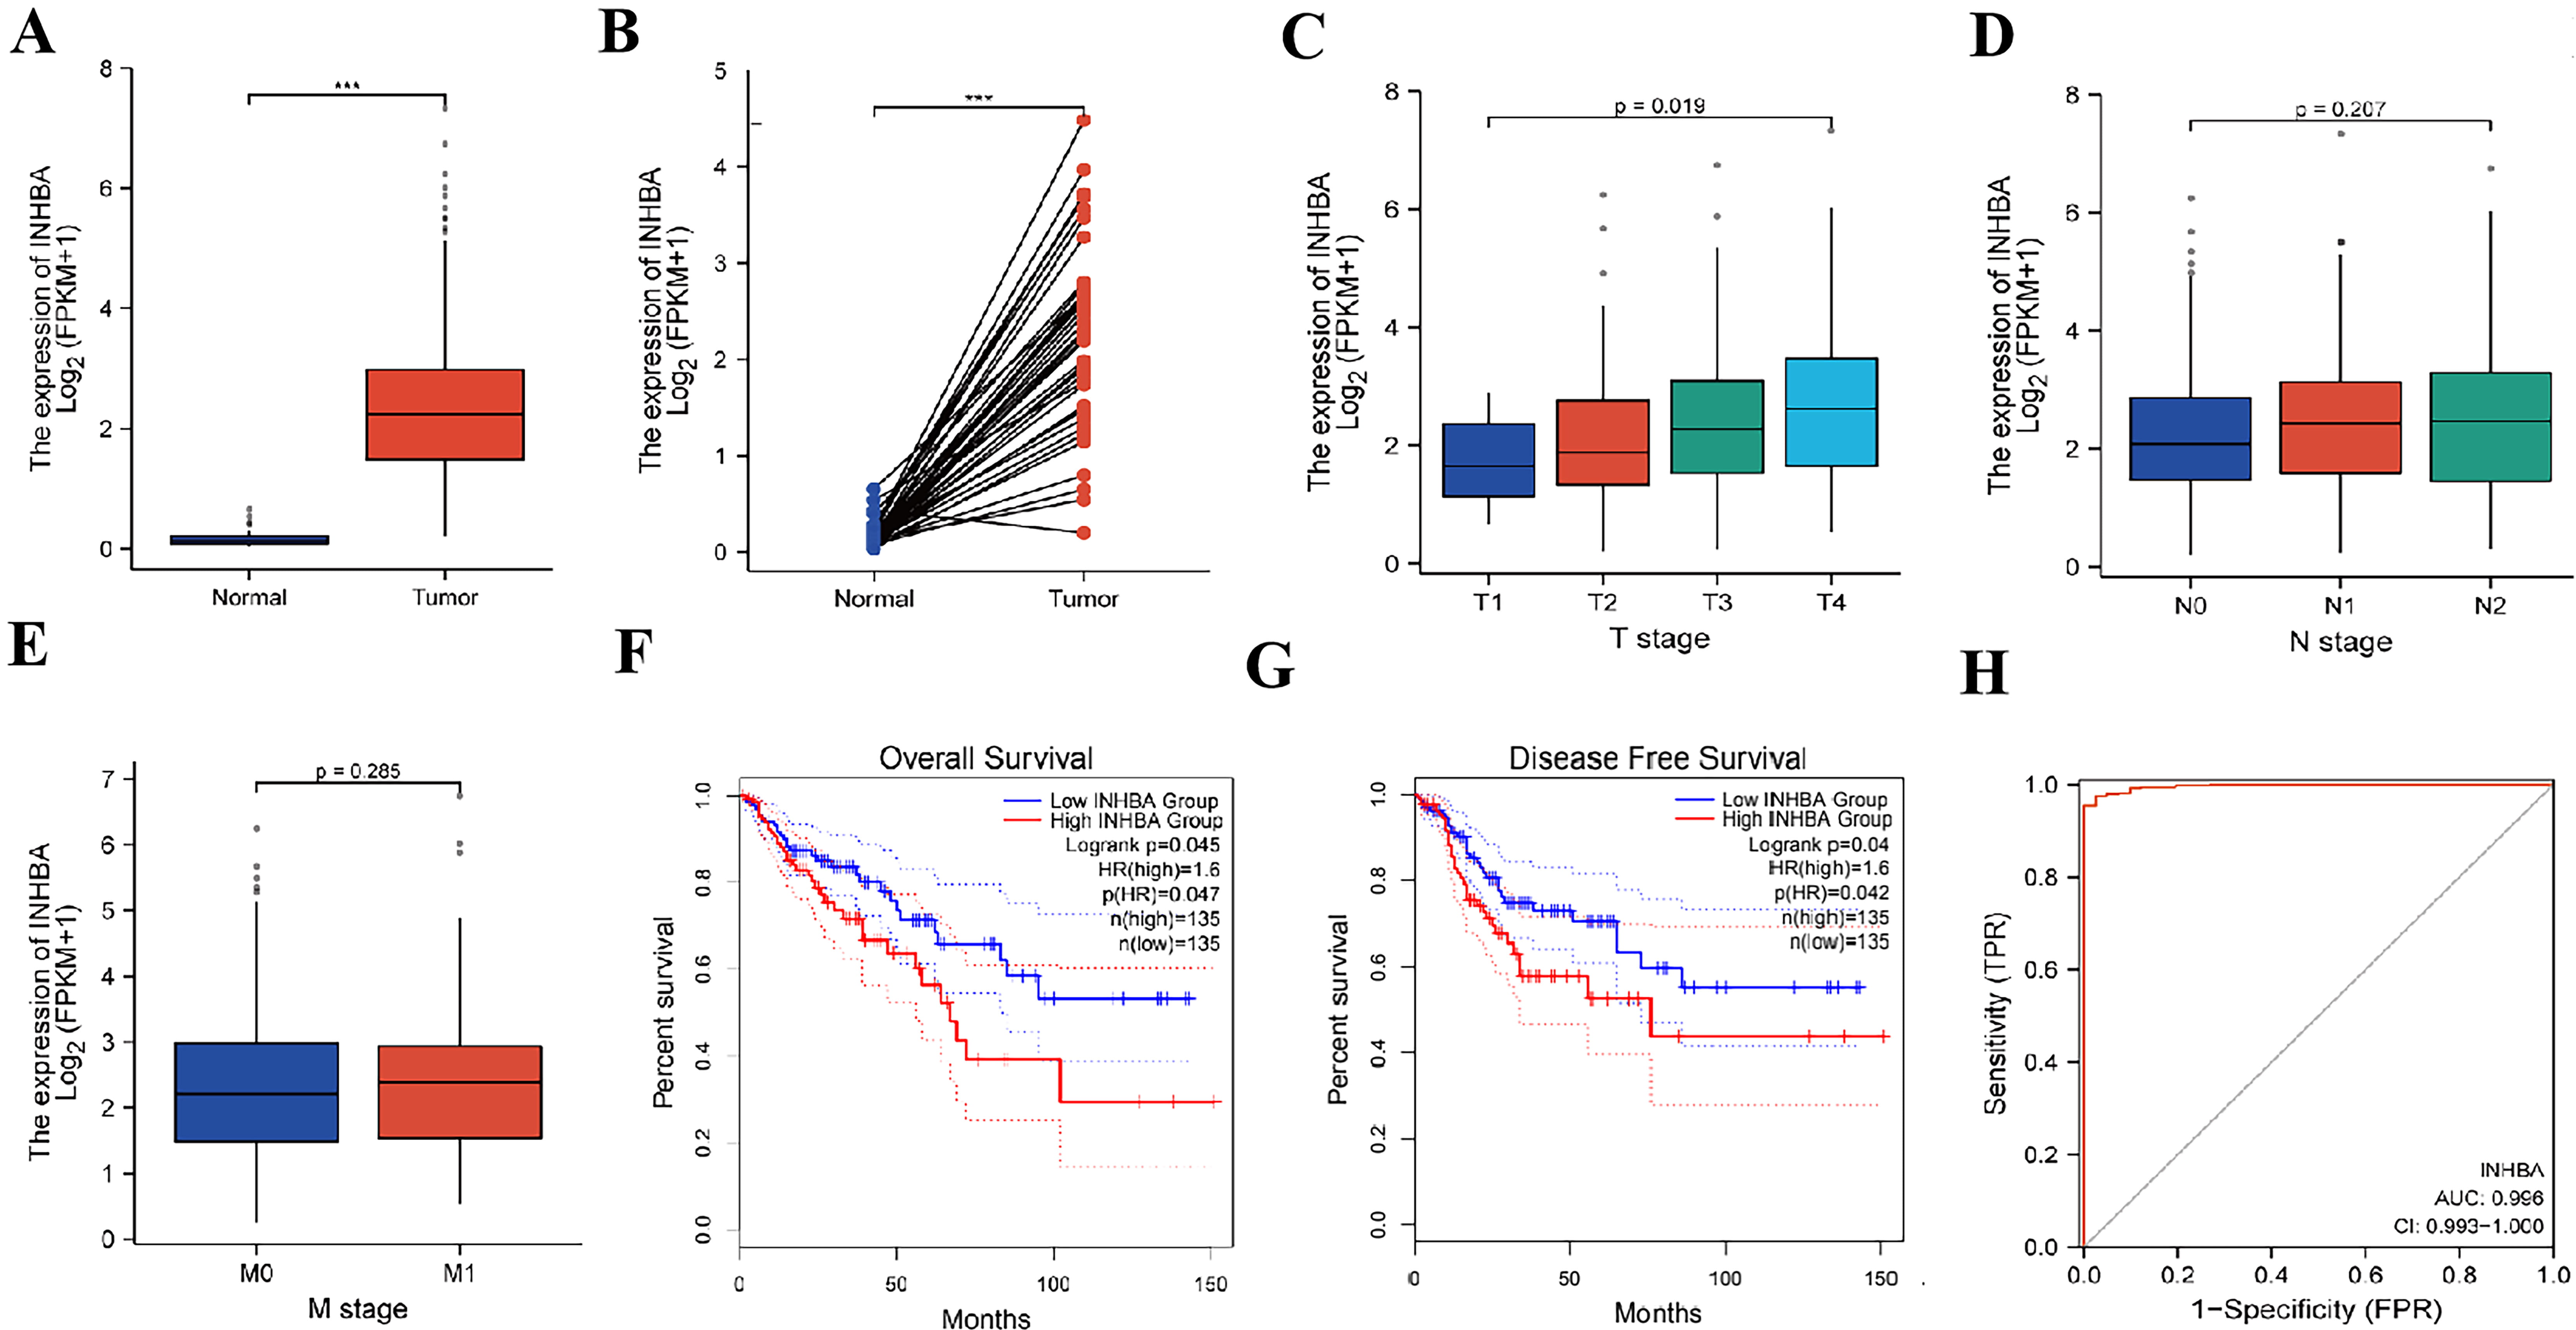 Fig. 7.
Bioinformatics analysis of the expression of INHBA in
CRC and its correlation with the prognosis. (A,B) The expression of INHBA in CRC and adjacent tissues was analyzed by TCGA database. (C) The
expression of INHBA in different T stages of CRC was analyzed by TCGA
database. (D) The expression of INHBA in different N stages of CRC was
analyzed by TCGA database. (E) The expression of INHBA in different M
stages of CRC was analyzed by TCGA database. (F) OS analysis corresponding
to INHBA expression in CRC patients in GEPIA database. (G) DFS analysis
corresponding to INHBA expression in CRC patients in GEPIA database. (H)
Prognostic risk scoring model of CRC based on INHBA gene (***p
The expression level of INHBA was detected by the immunohistochemical
method in 60 pairs of CRC tissues and adjacent tissues, and the positive rate was
analyzed by Image-Pro Plus scanning software. Compared with para-cancer tissues,
the expression level of INHBA in CRC tissues was significantly
up-regulated, with statistical significance (p
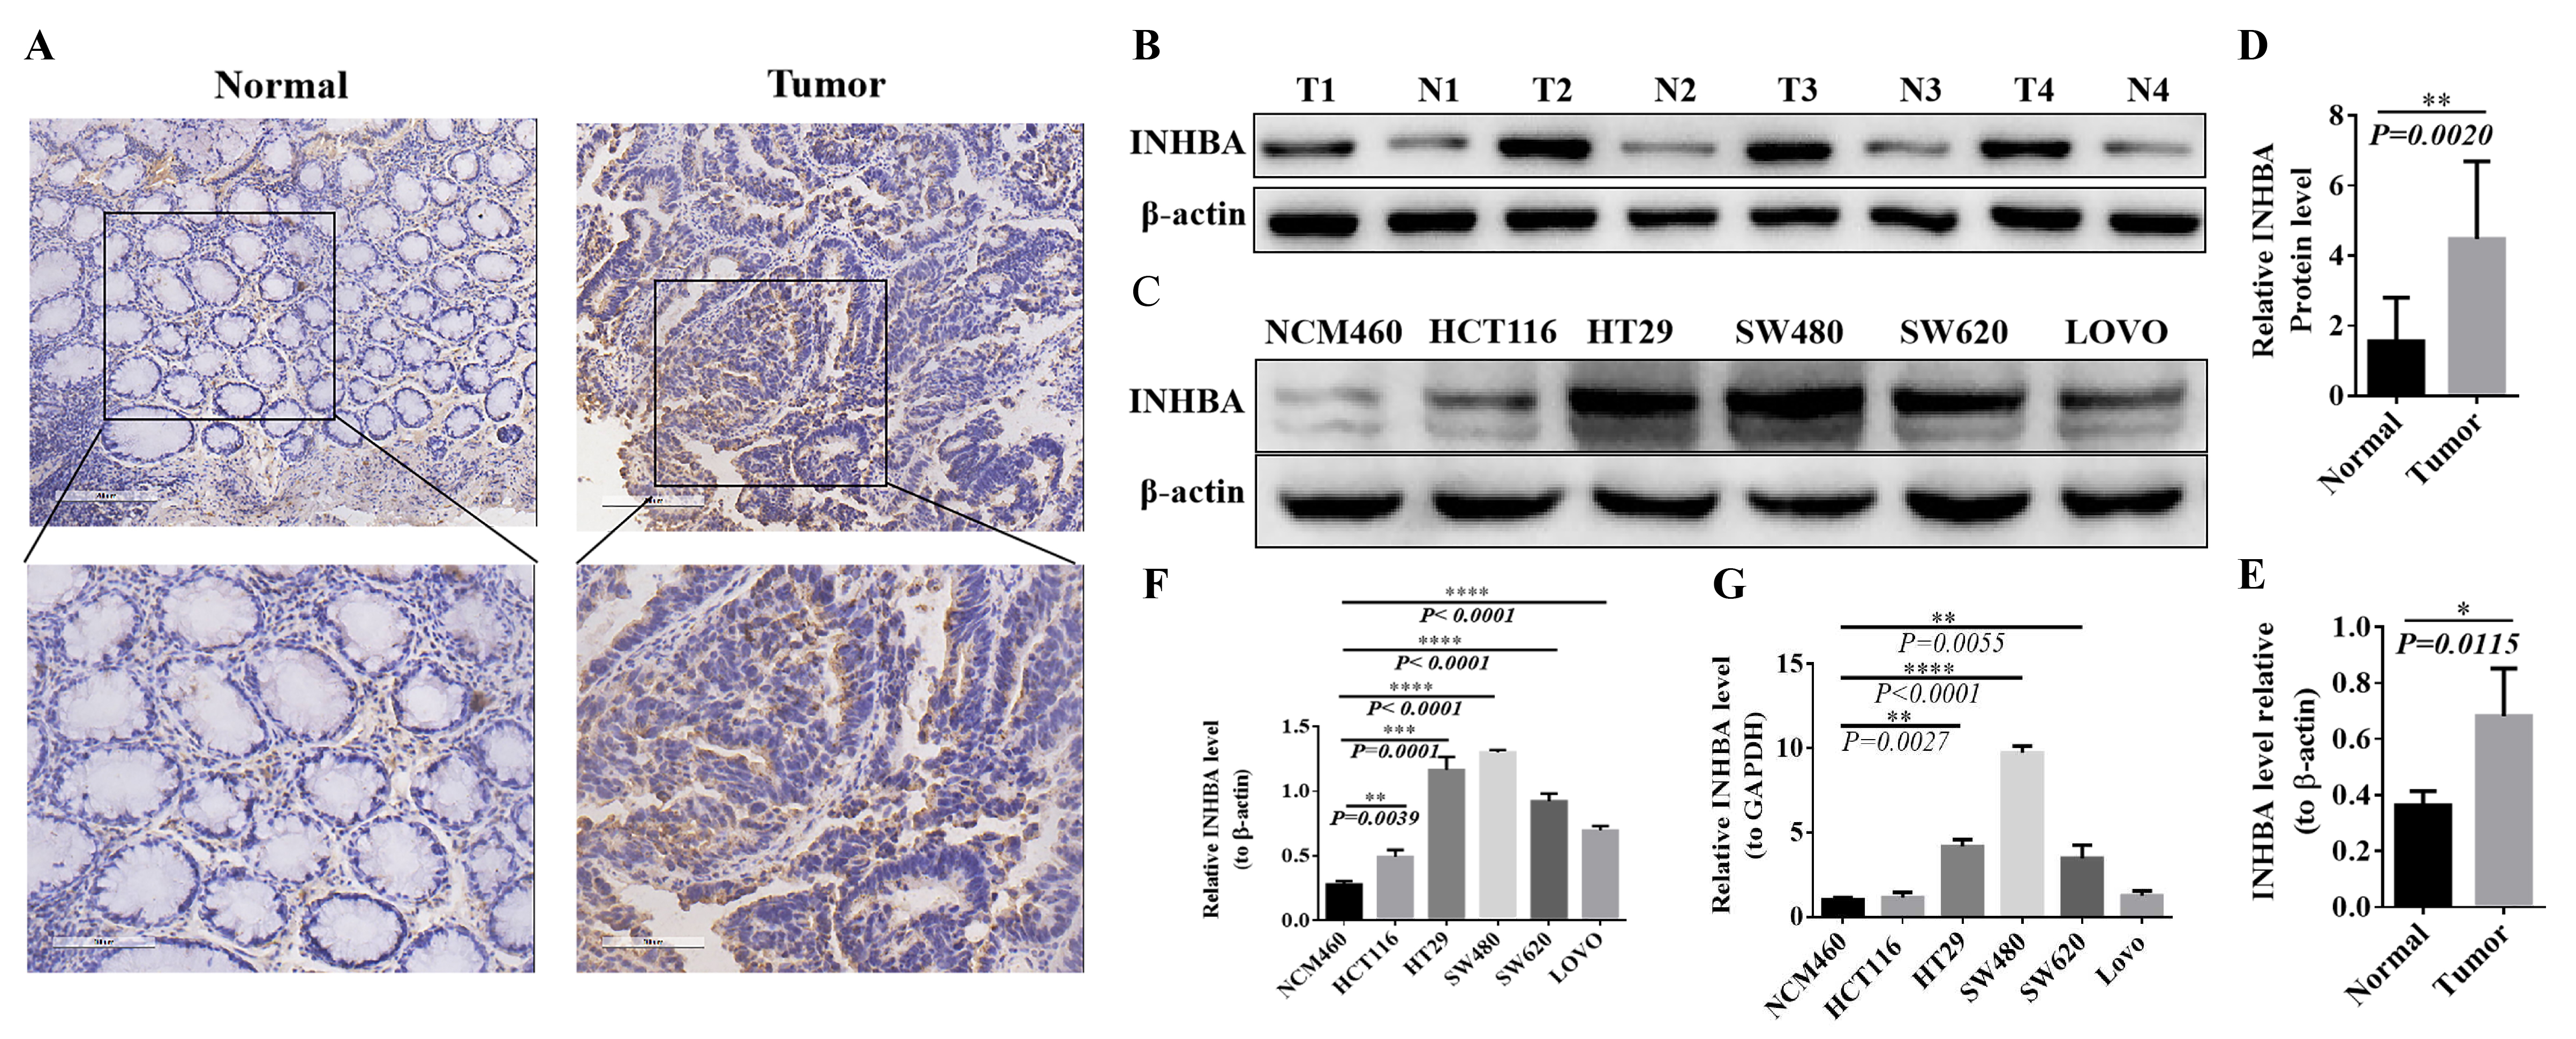 Fig. 8.
Expression of INHBA in CRC tissues and cell lines. (A,B) Positive rate in normal and tumor tissues
detection by IHC. (C,D) Expression levels in normal and tumor tissues detected by western blot. (E,F)
Expression levels in CRC cell lines NCM460, HCT116, HT29, SW480, SW620 and LOVO detected by
western blot. (G) mRNA expression levels in CRC cell lines NCM460, HCT116, HT29, SW480, SW620 and
LOVO detected by qRT-PCR.The protein expression was normalized against β-actin, and mRNA expression
was normalized for GAPDH. Expressed as relative expression ratio. (*p
The proliferation and invasion abilities of HT29 cells in
HNF1A-AS1 shRNA (p
 Fig. 9.
Biological function of HNF1A-AS1 and INHBA in
human CRC cell lines. (A,B) HT29 and SW480 cells and their transfection with
HNF1A-AS1 shRNA and INHBA shRNA, respectively HT29 and SW480
cells and their transfection with HNF1A-AS1 shRNA and INHBA
shRNA, respectively proliferation at 24, 48, 72 and 96 h. (C,D) Apoptosis
detection by flow cytometry. (E,F) Transwell invasion assay detects cell
invasion ability (**p
A total of 60 pairs of tumor tissue samples from CRC patients meeting the inclusion and exclusion criteria were collected. The general baseline demographic and clinical data of patients are demonstrated in Table 2.
| Clinical features | Sample size (n = 60) | |
| Gender | Male | 31 |
| female | 29 | |
| Age (years) | 50 | |
| 10 | ||
| Tumor size | 53 | |
| 7 | ||
| Tumor differentiation | High | 5 |
| Medium | 28 | |
| Low | 27 | |
| Depth of invasion (T stage) | T1 + T2 | 18 |
| T3 + T4 | 42 | |
| Lymph node metastasis (N stage) | Yes | 30 |
| No | 30 | |
| Distant metastasis (M stage) | Yes | 3 |
| No | 57 | |
| TNM staging | I + II | 28 |
| III + IV | 32 | |
| Vascular infiltration | Yes | 12 |
| No | 48 | |
| Nerve invasion | Yes | 6 |
| No | 54 | |
| Tumor location | Right semicolon | 21 |
| Left semicolon + rectum | 39 | |
| Mismatch repair protein (MMR) status | dMMR | 6 |
| pMMR | 54 | |
TNM, tumor node metastasis; dMMR, deficient mismatch repair; pMMR , proficient mismatch repair.
| Clinical features | Sample size (n = 60) | Expression level of INHBA | χ |
p | ||
| High expression | Lower expression | |||||
| Gender | Male | 31 | 11 | 20 | 0.4746 | 0.6351 |
| Female | 29 | 13 | 16 | |||
| Age (years) | 50 | 20 | 30 | 0.3536 | 0.7237 | |
| <50 | 10 | 4 | 6 | |||
| Tumor size | 53 | 21 | 32 | 0.2463 | 0.8055 | |
| <3 cm | 7 | 3 | 4 | |||
| Tumor differentiation | High | 5 | 1 | 4 | 7.585 | 0.0225 |
| Medium | 28 | 5 | 23 | |||
| Low | 27 | 14 | 13 | |||
| Depth of invasion (T stage) | T1 + T2 | 18 | 14 | 4 | 2.039 | 0.0415 |
| T3 + T4 | 42 | 19 | 23 | |||
| Lymph node metastasis (N stage) | Yes | 30 | 7 | 23 | 2.635 | 0.0084 |
| No | 30 | 17 | 13 | |||
| Distant metastasis (M stage) | Yes | 3 | 0 | 3 | 1.965 | 0.0495 |
| No | 57 | 33 | 24 | |||
| TNM staging | I + II | 28 | 6 | 22 | 2.747 | 0.006 |
| III + IV | 32 | 18 | 14 | |||
| Vascular infiltration | Yes | 12 | 3 | 9 | 2.475 | 0.0133 |
| No | 48 | 31 | 17 | |||
| Nerve invasion | Yes | 6 | 1 | 5 | 1.151 | 0.2499 |
| No | 54 | 22 | 32 | |||
| Tumor location | Right semicolon | 21 | 9 | 12 | 1.115 | 0.2647 |
| Left semicolon + rectum | 39 | 24 | 15 | |||
| Mismatch repair protein (MMR) status | dMMR | 6 | 5 | 1 | 2.054 | 0.0400 |
| pMMR | 54 | 20 | 34 | |||
Previous studies have shown that the INHBA gene can participate in the
occurrence and development of gastric cancer by regulating the TGF-
However, the role of the INHBA-mediated
TGF-
Previous studies have confirmed that miR-214 can play a tumor
suppressive role in endometrial cancer, breast cancer and other tumors through
diverse molecular mechanisms [22, 23]. Studies also suggested that
miR-214 can be used as a crucial tumor suppressor in CRC [24]. For
example, miR-214 can inhibit the proliferation and metastasis of CRC by
targeting the PLAGL2-MYH9 axis [25], while miR-214 can also inhibit
LIVIN and the NF-
LncRNA has been proven to regulate various biological processes such as cell
proliferation, apoptosis, invasion and metastasis, which provides a new
perspective for the diagnosis and treatment of cancer [27]. HNF1A-AS1 is
highly expressed in diverse tumors, promoting the proliferation of
triple-negative breast cancer [28], hepatocellular carcinoma [29] and glioma
[30]; proliferation, migration and invasion of osteosarcoma [31]; proliferation,
apoptosis, chemoresistance of non-small-cell cancer (NSCLC) [32]; proliferation,
migration, EMT of oral squamous cell carcinoma [33]; invasion, metastasis,
angiogenesis and lymphangiogenesis of gastric cancer [34]; metastasis and
invasion of bladder cancer [35]; and proliferation, migration and invasion of
esophageal adenocarcinoma [36]. Our results from TCGA database and clinical
samples showed that HNF1A-AS1 was highly expressed in CRC. In addition,
there was a negative correlation between the expression of HNF1A-AS1 and
miR-214 (p
In conclusion, our preliminary results suggest that the
HNF1A-AS1/miR-214/INHBA axis regulates the TGF-
Publicly available datasets were analyzed in this study. The datasets generated for this study can be found here: The Cancer Genome Atlas (TCGA) (https://portal.gdc.cancer.gov/), Gene Expression Profiling Anteractive Analysis (GEPIA) (http://gepia.cancer-pku.cn), miRDB(http://mirdb.org), miRWalk (http://mirwalk.umm.uni-heidelberg.de/), targetscan (http://www.targetscan.org/vert_80/), and starBase (https://ngdc.cncb.ac.cn/databasecommons/database/id/169#) databases.
XZ, YL, TW, and RD were responsible for study design, data acquisition, and analysis and were major contributors to writing the manuscript. RQ, GL, YZ, XW, ZS, and RY helped to perform the mining of biological information and the data analysis. XC, YR, CD, and JL helped to perform the collection of specimens and experimental verification. All authors contributed to the article and approved the submitted version. All authors contributed to editorial changes in the manuscript. All authors read and approved the final manuscript. All authors have participated sufficiently in the work and agreed to be accountable for all aspects of the work.
The study protocols were approved by the Medical Institutional and Clinical Research Ethics Committee of Yunnan Cancer Hospital, the Third Affiliated Hospital of Kunming Medical University (Approval number: KYCS2022033). All experiments were carried out in accordance with the “Declaration of Helsinki” on the ethical principles for medical research involving human subjects. Written informed consent was obtained from all participants prior to their enrollment of the study.
Not applicable.
This study was supported by the National Natural Science Foundation of China (82060542), the Scientific Research Fund of Yunnan Provincial Education Department (2022J0227), the Joint Special Funds for the Department of Science and Technology of Yunnan Province-Kunming Medical University (202201AY070001-149), and the Innovation Fund for Doctoral Students of Kunming Medical University (2022B13).
The authors declare no conflict of interest.
References
Publisher’s Note: IMR Press stays neutral with regard to jurisdictional claims in published maps and institutional affiliations.