


 , Rinku Polachirakkal Varghese 1, V. Anu Preethi 2, C. George Priya Doss 1,*
 , Hatem Zayed 3,*
1 Laboratory of Integrative Genomics, Department of Integrative Biology, School of Bio Sciences and Technology, Vellore Institute of Technology, 632014 Vellore, Tamil Nadu, India
2 School of Computer Science and Engineering, Vellore Institute of Technology, 632014 Vellore, Tamil Nadu, India
3 Department of Biomedical Sciences, College of Health and Sciences, Qatar University, 2713 QU Health, Doha, Qatar
Abstract
Background: Mutations in the K-Ras gene are among the most frequent genetic alterations in various cancers, and inhibiting RAS signaling has shown promising results in treating solid tumors. However, finding effective drugs that can bind to the RAS protein remains challenging. This drove us to explore new compounds that could inhibit tumor growth, particularly in cancers that harbor K-Ras mutations. Methods: Our study used bioinformatic techniques such as E-pharmacophore virtual screening, molecular simulation, principal component analysis (PCA), extra precision (XP) docking, and ADMET analyses to identify potential inhibitors for K-Ras mutants G12C and G12D. Results: In our study, we discovered that inhibitors such as afatinib, osimertinib, and hydroxychloroquine strongly inhibit the G12C mutant. Similarly, hydroxyzine, zuclopenthixol, fluphenazine, and doxapram were potent inhibitors for the G12D mutant. Notably, all six of these molecules exhibit a high binding affinity for the H95 cryptic groove present in the mutant structure. These molecules exhibited a unique affinity mechanism at the molecular level, which was further enhanced by hydrophobic interactions. Molecular simulations and PCA revealed the formation of stable complexes within switch regions I and II. This was particularly evident in three complexes: G12C-osimertinib, G12D-fluphenazine, and G12D-zuclopenthixol. Despite the dynamic nature of switches I and II in K-Ras, the interaction of inhibitors remained stable. According to QikProp results, the properties and descriptors of the selected molecules fell within an acceptable range compared to sotorasib. Conclusions: We have successfully identified potential inhibitors of the K-Ras protein, laying the groundwork for the development of targeted therapies for cancers driven by K-Ras mutations.
Keywords
- GLIDE
- QikProp
- molecular dynamics simulation
- E-pharmacophore modeling
- K-Ras
The K-Ras gene is a proto-oncogene that can contain various mutations, resulting in the disruption of cell signaling and uncontrolled proliferation in cancer cells. It is the most frequently mutated proto-oncogene in the RAS-MAPK pathway [1, 2]. K-Ras is identified in approximately 25% of all cancer cases, including the pancreas, colon, and lung. K-Ras mutations contribute to the initiation and progression of cancer, increasing the risk of resistance and predicting a worse prognosis, resulting in more than a million deaths annually [3, 4]. The K-Ras protein is a molecular switch that regulates cellular functions such as cell proliferation, differentiation, and survival. It does this by switching between an inactivated GDP-bound state and an activated GTP-bound state, utilizing guanine nucleotide exchange factors (GEFs) and GTPase-activating proteins (GAPs) [5, 6]. In typical quiescent cells, K-Ras is primarily in its inactivated GDP-bound form. However, when an extracellular stimulus activates receptor tyrosine kinases (RTKs) and other cell-surface receptors, K-Ras switches to its activated GTP-bound state. This further activates effector proteins (RAF-kinases, PI3K, and RalGDS) that regulate the MAPK and PI3K/mTOR pathways, thus controlling cellular processes [7, 8]. K-Ras mutations most commonly occur at the Glycine-12 (G12), Glycine-13 (G13), and Glutamine-61 (Q61) amino acid positions. These mutations cause K-Ras to remain in its GTP-bound form and remain active without extracellular stimuli, leading to overstimulation of downstream signaling pathways and promoting tumorigenesis [3, 9, 10]. The G12C mutation, where glycine is replaced by cysteine at codon 12, is one of the most commonly found K-Ras mutations in NSCLC, with a prevalence of over 13% in lung adenocarcinomas and 3% in colorectal cancer patients [11, 12]. The G12D mutation, where glycine is substituted by aspartic acid at position 12, is prevalent in several types of cancer, including colorectal cancer, non-small cell lung cancer (NSCLC), uterine corpus neoplasm, pancreatic exocrine neoplasm, and ovarian neoplasm [13].
Despite four decades of research aimed at developing drugs to treat K-Ras mutations, only sotorasib has been successful in treating the G12C K-Ras mutant. The challenge in targeting K-Ras arises from its inherent characteristics, including its high nucleotide affinity and the limited number of accessible binding sites for inhibitor molecules [5, 14]. As a result, several unconventional strategies are being used to target K-Ras, including targeting downstream effector proteins [15], using epigenetic strategies such as telomerase inhibition [16], RNA interference [17], and synthetic lethality approaches like CDK inhibitors [18]. However, these approaches have failed due to a lack of selectivity. Furthermore, patients with K-Ras mutations respond poorly to current therapeutics [19]. Hence, there is an unmet and urgent need to develop immunotherapeutics targeting K-Ras-driven mutations. Our recent study also found the dynamic changes upon K-Ras mutation and FDA drugs that target mutant K-Ras [20, 21, 22].
The gaol of this study aims to discover new small molecule inhibitors for G12C and G12D mutants using an E-pharmacophore model-based virtual screening method. The top-performing molecules from this evaluation were then analyzed using docking energy and in silico QikProp ADME analysis. The best-hit molecules obtained were subjected to molecular dynamics simulation, which could be developed into potent, therapeutically active inhibitors.
The high-resolution K-Ras G12C mutant protein structure (PDB ID: 6P8Y) that was inhibitor co-crystallized was retrieved from Protein Data Bank [23, 24]. The retrieved protein structure was in the inactive GDP form with 2.31 Å and an Rfree value of 0.269. The mutations found in the PDB structure of G12C were reverted to the actual amino acids (AA) (C51S; C80L; C118S) with the help of the residue mutate module within the Schrödinger. The G12C residue of the K-Ras protein was mutated to G12D using the module mentioned above, and the protein model was engaged for the K-Ras G12D mutation-based module. The Schrödinger suite’s protein preparation wizard was employed to prepare the protein structure [25]. The proteins were subjected to tautomerization and ionization state adjustments, as well as the inclusion of missing residues, hydrogens, formal charge correction, and bond order correction at pH 7. The protein structure was further processed where the water molecules were removed; the structural integrity was mended using the protein preparation module and OPLS3e FF, respectively. While retaining the heteroatoms, the zero-order states were assigned to the metal, and the conformations of the AA side chains were evaluated. In K-Ras, the amino acids of histidine have a different shape. The K-Ras structure was optimized, the protonation states and tautomers were also predicted. The structure was also refined by improving the H-bond and eliminating the steric impediments by utilizing constrained heavy atom minimizations with a root mean square deviation (RMSD) value of 0.3.
For the E-pharmacophore modeling investigation, seven inhibitors were identified
from the literature survey and used as templates. The 3D structures of sotorasib
(AMG510), ARS1620, Indole lead 1
The initial docking of ligands to the G12C and G12D proteins is crucial for E-pharmacophore-based modeling, which combines ligand- and structure-based approaches. The Grid Ligand Docking and Energetics (GLIDE) module from the Schrödinger interface performed docking studies on the optimized protein structure. A 3D grid of 20 Å was created around the active sites of the protein structures to accommodate the binding residues before starting the docking process [35, 36, 37, 38]. The seven ligands were docked into the active site of the protein structure using GLIDE XP mode. The PHASE module of the Schrödinger suite was used with the docked files to create an E-pharmacophore model. This module uses six built-in pharmacophore features for model generation: hydrogen bond acceptor (A), hydrogen bond donor (D), hydrophobic (H), negative ionizable (N), positive ionizable (P), and aromatic ring (R). Pharmacophoric sites are created around atoms contributing to GLIDE XP energies during hypothesis development. These sites are ranked by calculating the energy terms of atoms. The hypothesis is used as a query to search for hits in the phase database that are more potent than the reference ligand.
A three-step virtual screening method was performed on the phase database using GLIDE software v12.5, New York, NY, USA, a conventional molecular docking tool that has successfully screened large databases during drug development [39]. The virtual screening process includes High Throughput Virtual Screening (HTVS), Standard Precision (SP), and XP docking. This approach is the first step in the docking process to reduce the number of compounds used for precision docking investigations, as HTVS helps in rapid screening. The G12C and G12D hypotheses were used to screen the phase database for suitable compounds. These compounds were then subjected to HTVS, followed by SP and rigorous XP docking to obtain better binding affinities and eliminate false positives [36, 40]. Based on their binding energies, the docking results were compared to those of the reference compound (sotorasib) [41]. Additionally, the pharmacokinetic properties of the compounds that passed the filtering procedures were evaluated.
One way to decrease the failure rates during drug development is to focus on molecular characteristics such as absorption, distribution, metabolism, excretion, and toxicity (ADMET) [42]. The current study employed the QikProp module to forecast the ADME properties and drug-likeness (DL) [43]. QikProp evaluates molecular properties using a pharmacokinetic descriptor range that covers 95% of existing drugs. To better understand the molecule’s potential as an inhibitor, sotorasib was compared to the predictions generated for other hit compounds.
MDS of nine K-Ras mutant complexes were performed using GROMACS software for 1800 ns [44]. The complexes were prepared with drugs such as sotorasib, afatinib, osimertinib, hydroxychloroquine, sotorasib, doxapram for G12C and fluphenazine, hydroxyzine, and zuclopenthixol for G12D. The force field parameters for the hit molecules were calculated using Charmm27 [45, 46], and the variables and topological files were generated using SwissParam [47]. A dodecahedral box with simple point-charge (SPC) waters was positioned at 1.0 nm from the box’s edge for the mutants complexed with hit molecules, and sotorasib and counterions were added to neutralize the system. Energy minimization was performed using the steepest descent method for 5000 steps to remove steric conflicts. The volume and pressure ensembles were set to default values. The molecular dynamics (MD) trajectories of each complex were analyzed using GROMACS and visualized using ggplot2 in R studio [48]. Principal component analysis (PCA) was used to obtain the spatial structure of the mutant K-Ras inhibitor complexes and sotorasib [49]. The PC1 and PC2 projections and eigenvectors were calculated using the default approach in GROMACS and our previous simulation protocol [50, 51, 52, 53]. The covariance matrices of all complexes were evaluated, and the conformational space was computed using the atom positions from the MD trajectories. The 3D free energy landscape (FEL) was plotted using OriginPro 2022 SR1 software, Northampton, MA, USA, and its projections on eigenvectors 1 and 2 were evaluated and plotted using R studio.
The PHASE module in the Maestro workspace generated an E-pharmacophore
hypothesis based on seven pre-existing inhibitor compounds: sotorasib (AMG510),
ARS1620, ARS1323, ARS853, bortezomib, MRTX849, and ARS1630. The pharmacophore
model was developed using docked poses of these inhibitors and incorporates
structural and energy information between G12C, G12D, and the ligands. The model
generation aims to identify new active sites for developing novel inhibitors. The
seven ligands were docked using XP, and their descriptor files served as input
for generating the model. The “E-pharmacophore” option was defined using the
docking post-processing module in the Maestro interface. To map the ligands and
pharmacophoric sites into the ligand’s atoms, the fragment mode option was used
during model building. The pharmacophoric sites retrieved were fixed to two at
the start, and a pharmacophore hypothesis was generated in which the features
were prioritized according to their energy contributions to binding. For G12C,
the top five attributes were selected for the hypothesis, while for G12D, the top
three attributes were taken based on an energy score of
| S.No | Types of features of E-pharmacophore | XP scores |
| G12C | ||
| 1. | A4 | –0.67 kcal/mol |
| 2. | R15 | –0.45 kcal/mol |
| 3. | R16 | –0.45 kcal/mol |
| 4. | R17 | –1.01 kcal/mol |
| 5. | D7 | –0.33 kcal/mol |
| G12D | ||
| 6. | A4 | –0.27 kcal/mol |
| 7. | R14 | –0.32 kcal/mol |
| 8. | R16 | –0.16 kcal/mol |
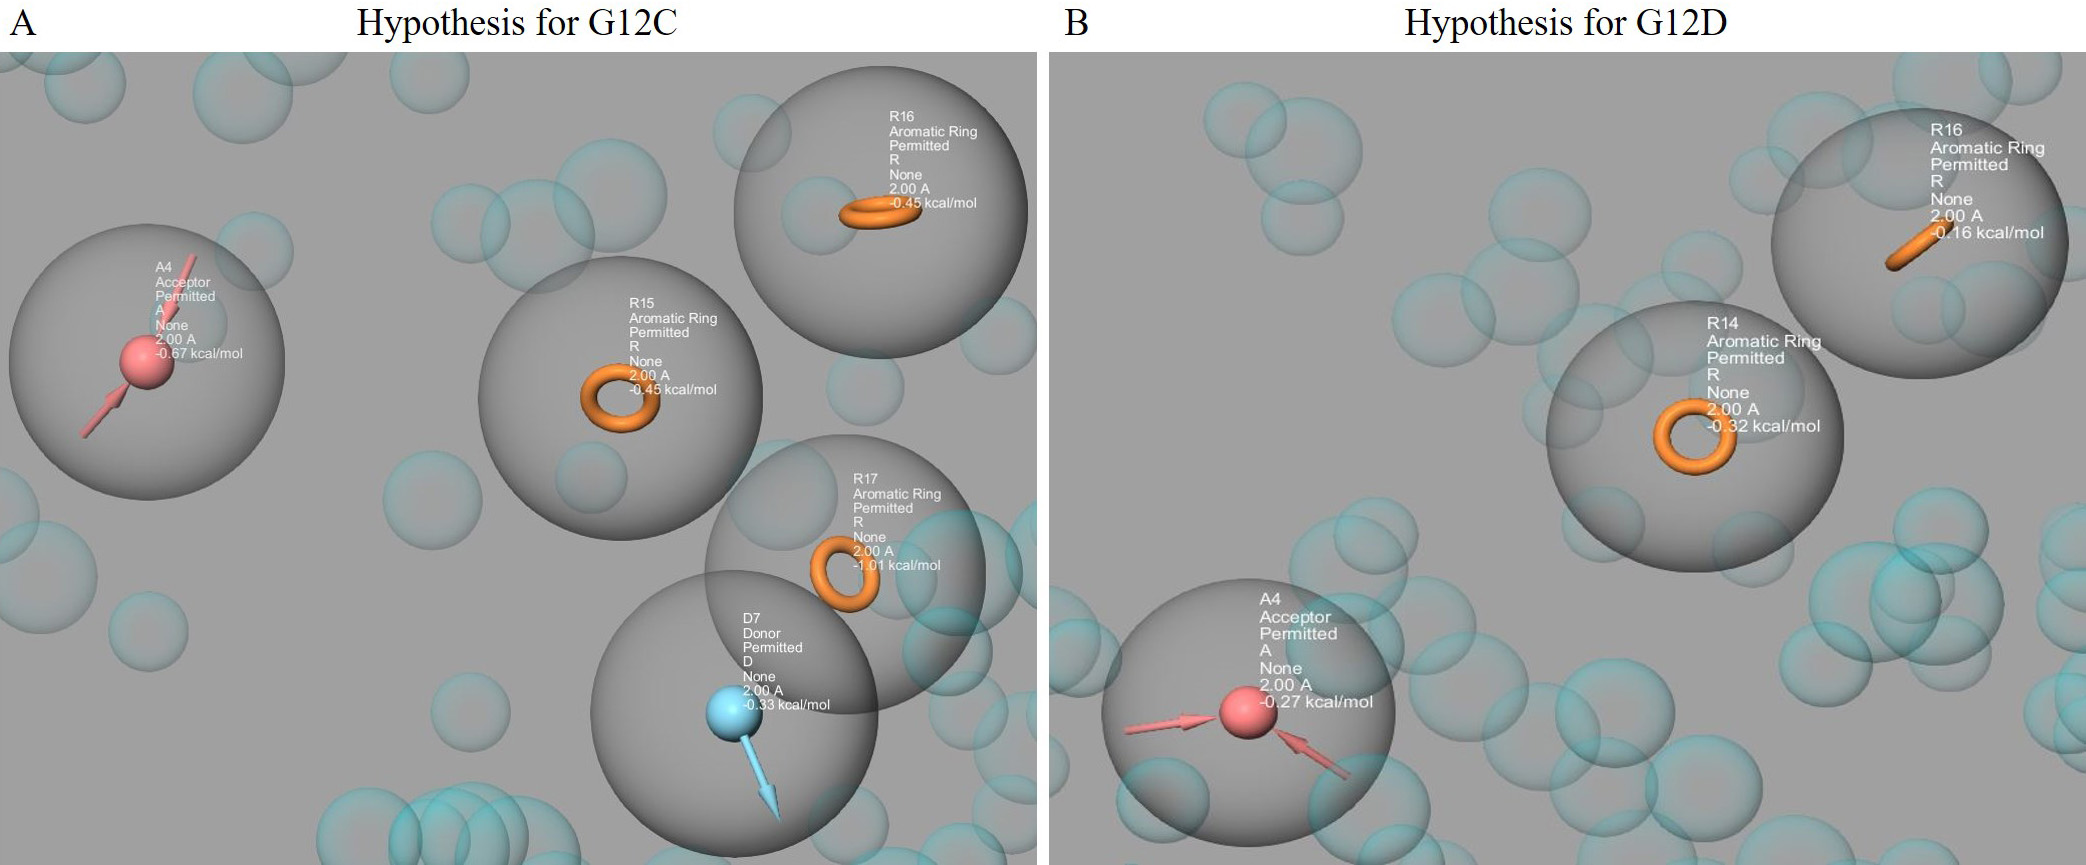 Fig. 1.
The pharmacophore hypotheses were represented using the PHASE module, which included features from Sotorasib (AMG510), MRTX849, ARS1620, Bortezomib, ARS853, ARS1630, and ARS1323. The hypothesis for G12C (with A4, D7, R15, R16, R17) is shown in (A), while the hypothesis for G12D (with A4, R14, R16) is shown in (B). The acceptor groups are represented in blue with arrows indicating h-bond acceptors. The donor groups are represented in pink with arrows indicating h-bond donors. The aromatic rings are represented in orange.
The E-pharmacophore model (DDRRR) was used to screen the phase database and identify a large group of potential inhibitors for G12C and G12D. During phase database construction, Ligand conformers were generated using the ConfGen option, so on-the-fly conformer generation was unnecessary. The ligand conformers were then compared to the E-pharmacophore model to identify those that matched its features. Reorienting the ligand conformers also helped to determine if they matched the pharmacophoric sites. The basic criteria for ligand site matching with the E-pharmacophore model were set to 4 out of 5 sites to ensure no potential molecule was missed. During database screening, the “hit treatment” option was set to “Return at most 1000 hit molecules”. PHASE identified 110 hit molecules for G12C and 189 for G12D that could superimpose the hypothesis when the process was completed. All 299 hit compounds were then subjected to virtual screening processes.
In the first screening, 299 hit compounds were identified out of 2672
FDA-approved compounds. These compounds were expected to have properties from the
implied E-pharmacophore and were labeled as possible hit compounds if all the
properties were satisfied. After the initial PHASE filtering, docking with the
Glide module was used. The molecules with higher glide scores and energies than
the reference inhibitor Sotorasib (G12C: –4.648 kcal/mol, G12D: –3.449
kcal/mol) were screened. The FDA-approved inhibitors (sotorasib-AMG510) were used
as a reference drug for both mutants. In HTVS, 110 and 189 compounds were docked
with the mutant models (G12C and G12D). After HTVS docking, the compounds were
subjected to SP docking, based on the Glide G-score (
| S.No | Hit Molecules | XP Gscore (kcal/mol) | MM-GBSA (kcal/mol) |
| G12C | |||
| 1. | * Sotorasib (reference compound) | –4.648 | –31.70 |
| 2. | Afatinib | –7.375 | –52.65 |
| 3. | Osimertinib | –5.884 | –32.77 |
| 4. | Hydroxychloroquine | –4.676 | –46.34 |
| G12D | |||
| 5. | ** Sotorasib (reference compound) | –3.449 | –30.66 |
| 6. | Hydroxyzine | –5.631 | –44.35 |
| 7. | Zuclopenthixol | –4.789 | –48.18 |
| 8. | Fluphenazine | –4.508 | –36.96 |
| 9. | Doxapram | –3.826 | –39.84 |
* G12C-K-Ras-Sotorasib complex.
** G12D-K-Ras-Sotorasib complex.
The Schrodinger’s (v12.5, New York, NY, USA) QikProp module was used to evaluate the ADME properties of hit compounds for the G12C (Afatinib, Osimertinib, Hydroxychloroquine) (Supplementary Fig. 1A–C) and G12D (Hydroxyzine, Zuclopenthixol, Fluphenazine, Doxapram) (Supplementary Fig. 2A–D) models. The CNS descriptors were a key focus of the study, as they can determine a molecule’s ability to cross the blood-brain barrier. The QikProp results for all hits and their characteristics for the K-Ras mutations are listed in Supplementary Tables 1,2. Compounds that met the description while remaining within acceptable bounds were selected as potential inhibitors. The pharmacokinetic properties of the hit compounds were evaluated for drug-like behavior and found to be within acceptable limits (Table 3). The screened compounds with favorable predicted properties were examined as a group, and the results indicate that the hit compounds satisfied all the ADME descriptors.
| S.No | Drugbank ID | Hit Molecules | MW |
Stars | CNS |
SASA |
FOSA |
FISA |
PISA |
donorHB |
accptHB |
QPlogPoct |
QPlogPw |
QPlogPo/w |
QPlogS |
QPlogBB |
QPPCaco |
QPlogKhsa |
HOA |
HOA |
| 1. | DB15569 | Sotorasib (reference compound) | 560.602 | 1 | –1 | 852.93 | 396.232 | 120.595 | 273.864 | 1 | 9.75 | 27.719 | 14.663 | 5.201 | –7.636 | –0.814 | 711.704 | 0.923 | 1 | 82.532 |
| Molecules for G12C K-Ras | ||||||||||||||||||||
| 2. | DB08916 | Afatinib | 434.519 | 0 | 1 | 795.193 | 379.494 | 93.837 | 221.546 | 2 | 9.45 | 24.448 | 14.286 | 3.697 | –5.13 | –0.314 | 318.378 | 0.289 | 3 | 93.39 |
| 3. | DB01611 | Hydroxychloroquine | 408.881 | 0 | 1 | 644.022 | 312.637 | 80.714 | 179.07 | 2 | 5.7 | 17.688 | 9.399 | 3.321 | –3.349 | –0.265 | 424.024 | 0.157 | 3 | 93.416 |
| 4. | DB09330 | Osimertinib | 318.338 | 1 | 1 | 836.883 | 450.985 | 69.724 | 316.175 | 2 | 8.75 | 25.996 | 13.921 | 4.807 | –5.485 | –0.332 | 539.027 | 0.775 | 3 | 100 |
| Molecules for G12D K-Ras | ||||||||||||||||||||
| 5. | DB00557 | Hydroxyzine | 374.909 | 0 | 2 | 678.051 | 272.227 | 48.222 | 285.953 | 1 | 7.4 | 18.59 | 10.417 | 3.043 | –2.289 | 0.508 | 214.987 | 0.081 | 3 | 86.507 |
| 6. | DB01624 | Zuclopenthixol | 400.965 | 0 | 2 | 709.126 | 275.596 | 52.801 | 272.366 | 1 | 5.7 | 18.591 | 9.21 | 4.132 | –4.055 | 0.646 | 194.532 | 0.608 | 3 | 92.107 |
| 7. | DB00623 | Fluphenazine | 437.522 | 0 | 2 | 721.765 | 271.696 | 64.259 | 235.536 | 1 | 6.2 | 19.718 | 9.575 | 4.358 | –4.151 | 0.637 | 151.473 | 0.634 | 3 | 91.484 |
| 8. | DB00561 | Doxapram | 378.513 | 0 | 2 | 678.183 | 355.696 | 24.932 | 297.555 | 0 | 6.7 | 18.022 | 10.694 | 3.22 | –3.049 | 0.479 | 1005.387 | –0.033 | 3 | 100 |
The interaction of the compounds with mutant models was visualized using Schrödinger’s LID and Discovery Studio to gain further insights into the binding patterns. Figs. 2,3 show the hit molecules for mutant models in 3D, highlighting their interactions. The grey surface model for G12C (Fig. 2A–D) depicts the binding pocket, while the hit molecules are represented as sotorasib (violet), afatinib (green), osimertinib (blue), and hydroxychloroquine (red). In G12D (Fig. 3A–E), the hit molecules are represented as sotorasib (violet), hydroxyzine (green), zuclopenthixol (yellow), fluphenazine (red), and doxapram (blue) in a ball and stick model. The interaction mechanism of the G12C-sotorasib complex in 2D revealed three H-bonds with carbon atoms C12, E62, and R68, Pi-alkyl with V9, and Pi-Pi stacking at Y96 (Supplementary Fig. 3A,B). The G12D-sotorasib complex had one H-bond with R68, a Pi-cation with K88, and two Pi-Pi stacks at Y96 (Supplementary Fig. 3C,D). The binding patterns of top compounds were compared with the G12C-sotorasib model. The G12C-afatinib complex had two H-bonds with G10 and D69, a Pi-Pi stack with Y96, and a Pi-alkyl with V9, M72, and Y96 (Fig. 4A,B). For G12C-osimertinib, it was observed that five H-bonds were formed with G10, C12, T58, R68, and Y96, with two Pi-Pi stacking with H95 and Y96 (Fig. 4C,D). For G12C-hydroxychloroquine, it was observed that two H-bonds formed with T58 and D92, two Pi-Pi stacking at V9 and H95, and a halogen bond with T58 (Fig. 4E,F). Finally, the binding patterns of top-hit molecules were compared with the reference compound for G12D. For the G12D-hydroxyzine complex, two H-bonds formed with A59 and Q61 and Pi-alkyl with V7, V9, and M72 (Fig. 5A,B). Three H-bonds were formed for G12D-zuclopenthixol with K16, D12, and D69; a Pi-cation with R68; and three Pi-alkyls with R68, H95, and Y96 (Fig. 5C,D). For the G12D-fluphenazine complex, it was observed that a single H-bond formed with G10 and a Pi-PI stacked with Y96 (Fig. 5E,F). A single H-bond formation was observed for the G12D-doxapram complex with K16, a single Pi-Pi stacking at Y96 (Fig. 5G,H).
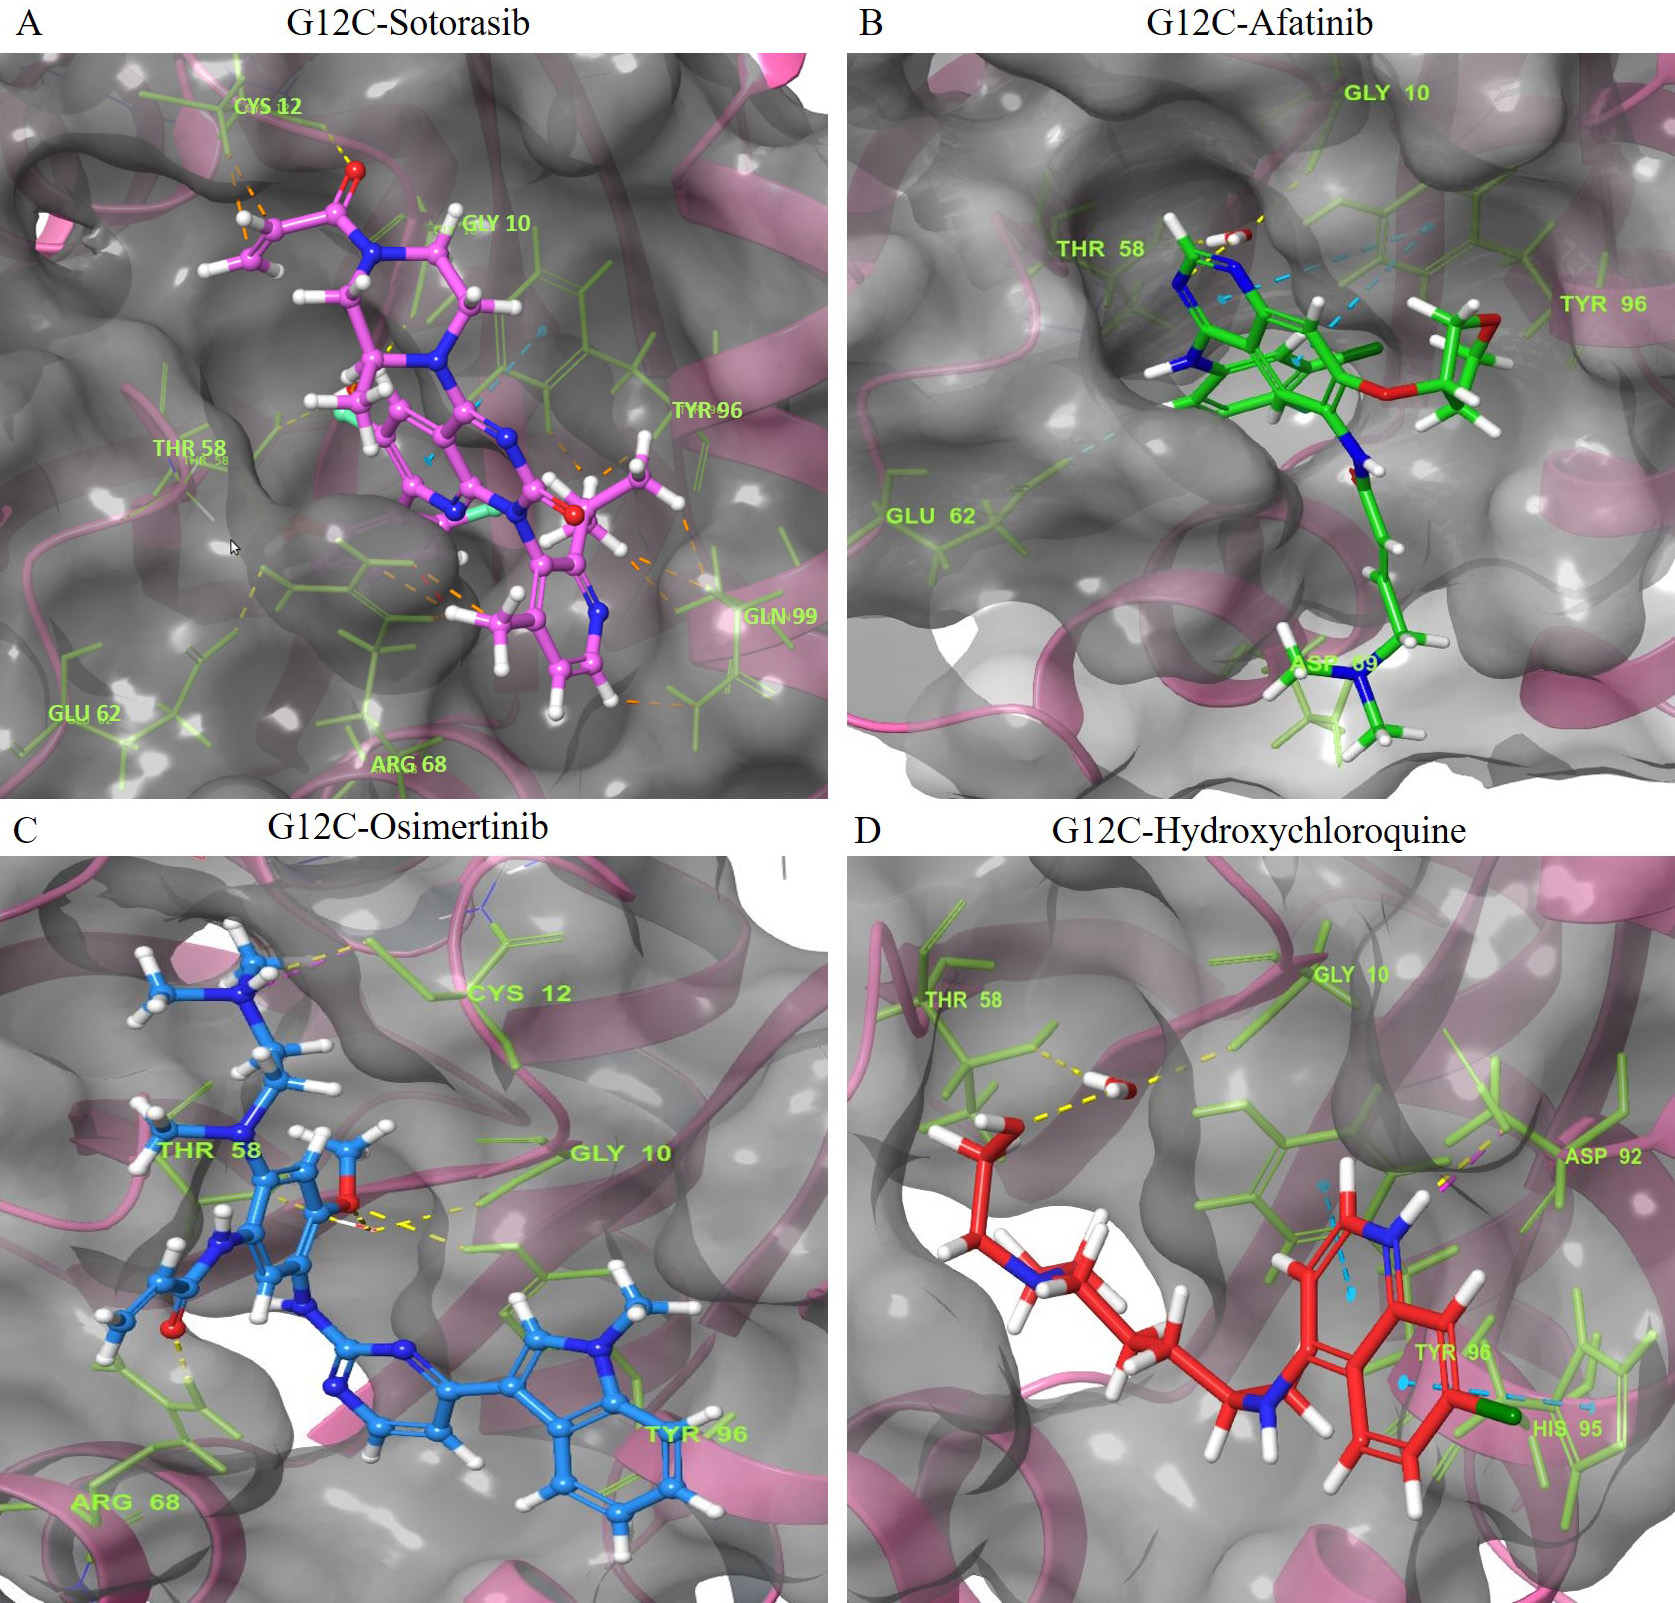 Fig. 2.
The 3D representation of the G12C K-Ras mutant complexes’ docked poses with hit compounds. The complexes include: (A) G12C-Sotorasib (Purple). (B) G12C-Afatinib (Green). (C) G12C-Osimertinib (Blue). (D) G12C-Hydroxychloroquine (Red). The hit compounds are represented using a ball and stick model, with Sotorasib in purple, Afatinib in green, Osimertinib in blue, and Hydroxychloroquine in red. The oxygen and nitrogen atoms of the hit compounds are shown as red and blue balls, respectively, while the chloride and fluoride ions within the hit compounds are depicted as green and light green balls. The interacting amino acid residues are shown as green sticks, with blue, yellow, pink, and green dashes indicating Pi-Pi stacked hydrogen bonds, attractive charges, and Pi-Cation interactions. The names of the interacting residues are written in light green fonts. The binding pocket is shown as a grey surface model.
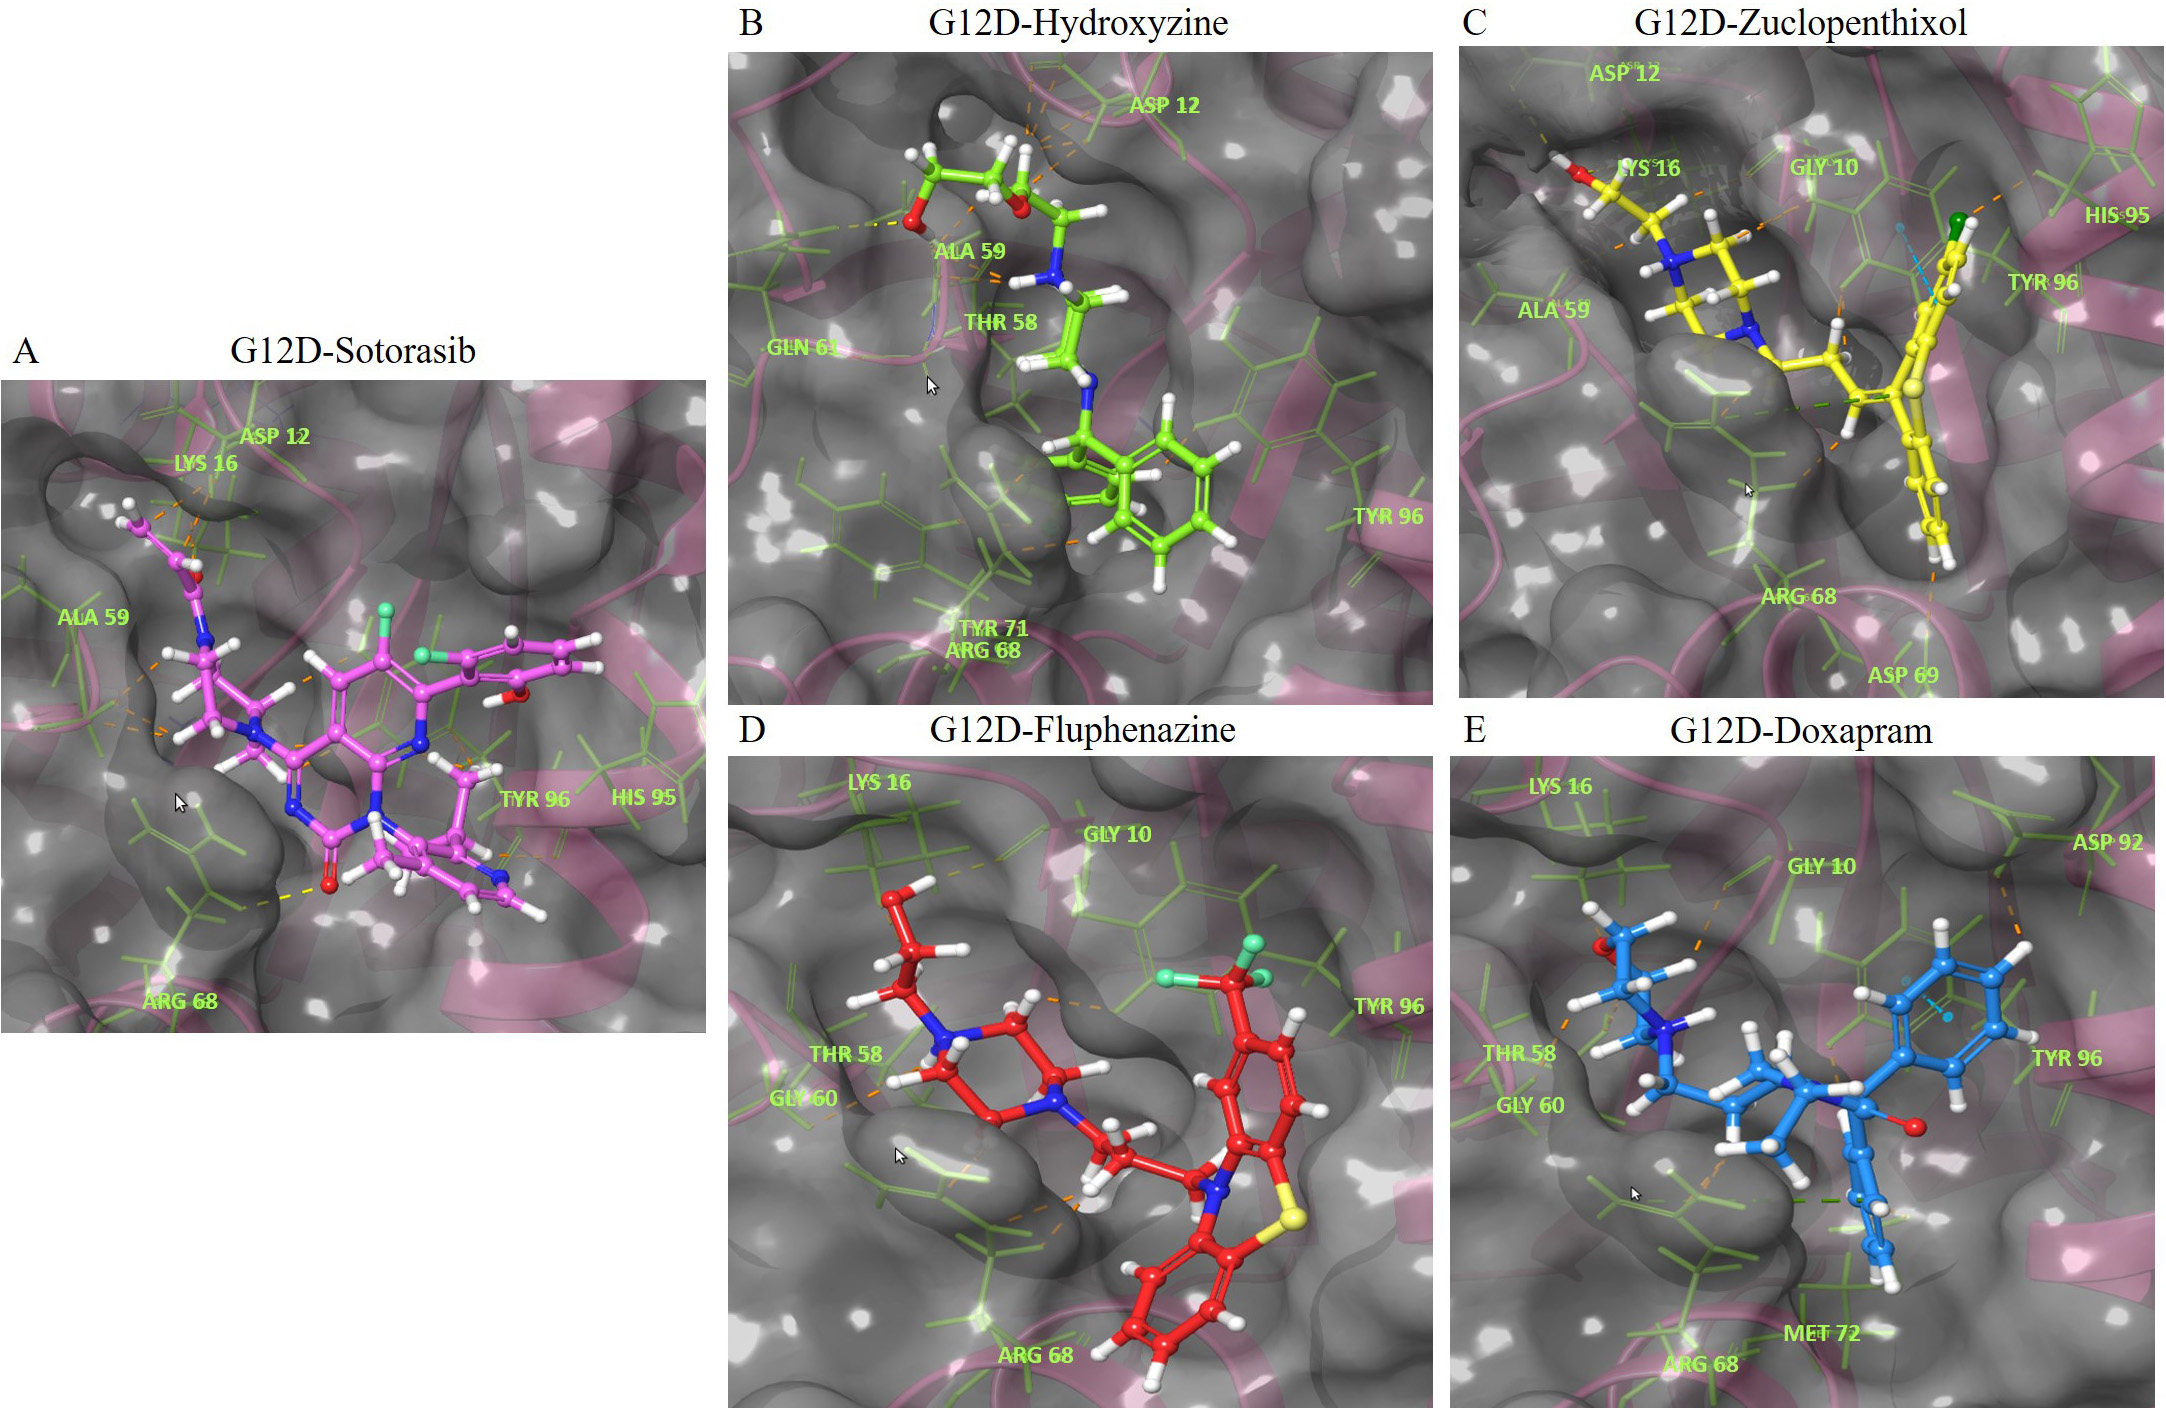 Fig. 3.
The 3D representation of the G12D K-Ras mutant complexes’ docked poses with hit compounds. The complexes include: (A) G12D-Sotorasib. (B) G12D-Hydroxyzine. (C) G12D-Zuclopenthixol. (D) G12D-Fluphenazine. (E) G12D-Doxapram. The hit compounds are displayed in a ball and stick model, with Sotorasib in violet, Hydroxyzine in green, Zuclopenthixol in yellow, Fluphenazine in red, and Doxapram in blue. The oxygen and nitrogen atoms are shown in red and blue ball models. The chloride and fluoride ions are depicted in green and light green ball models. The sulfur atom is shown in a yellow ball model. The interacting amino acid residues are displayed in a green stick model. The blue, yellow, pink, and green dashes represent Pi-Pi stacked hydrogen bonds, attractive charges, and Pi-Cation interactions. The names of the interacting residues are written in light green. The binding pocket is shown as a grey surface model.
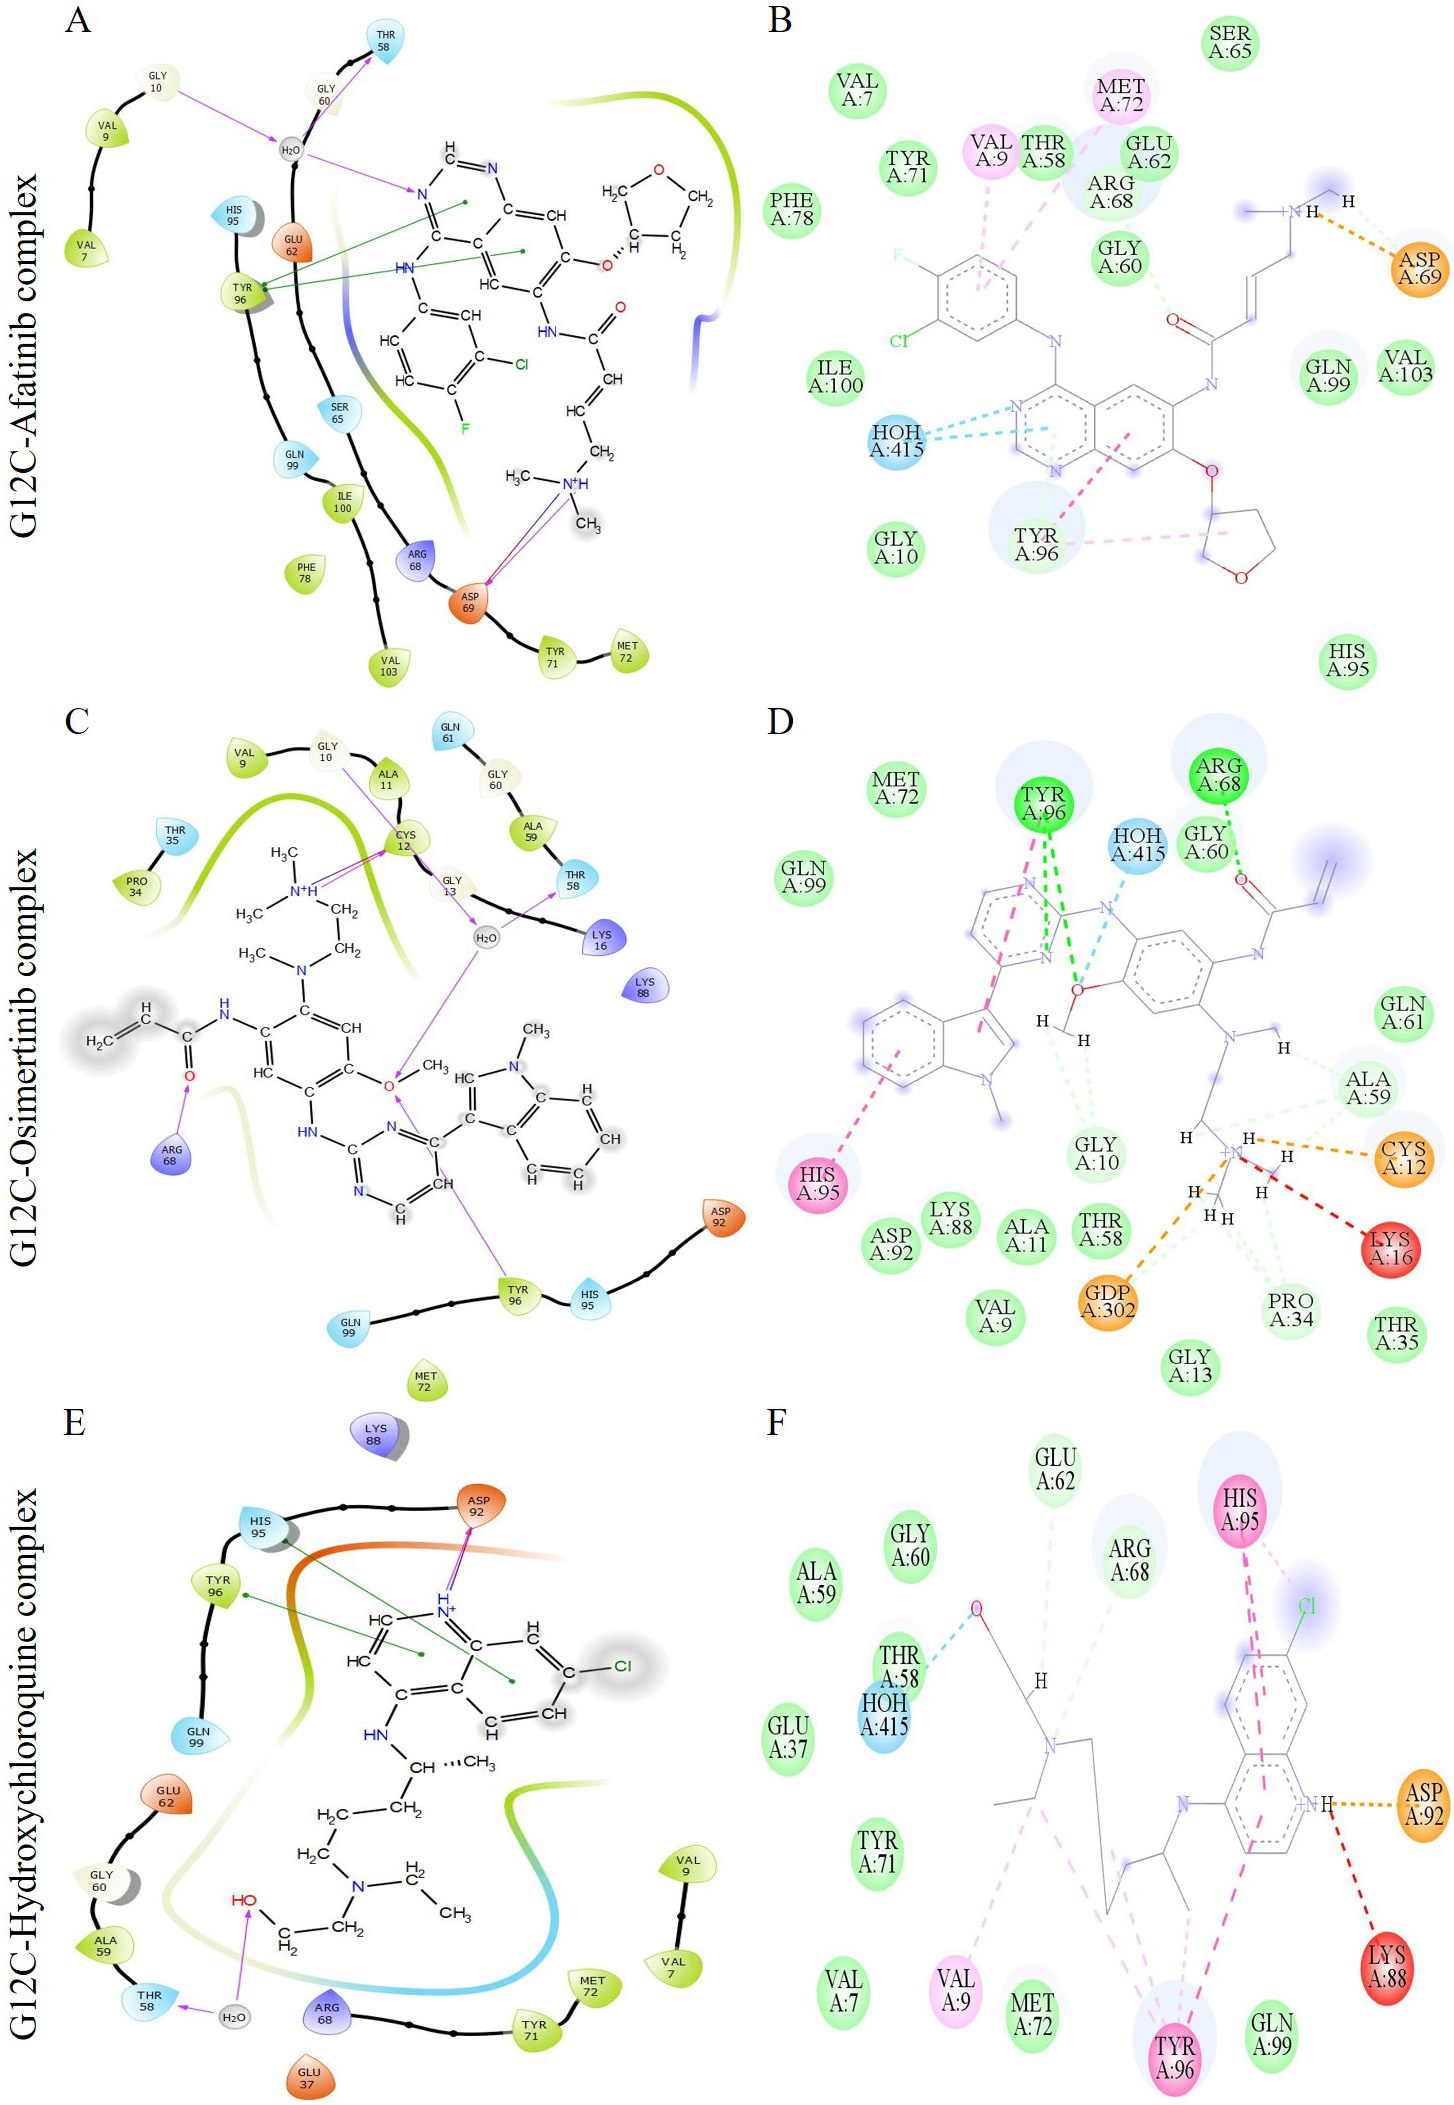 Fig. 4.
The image depicts multiple interactions between the ligand and the G12C K-Ras protein. The diagrams (A), (C), and (E) show the ligand interactions as visualized by the Maestro suite, while (B), (D), and (F) show the 2D ligand interactions as visualized by Discovery Studio. The complexes shown in (A) and (B) are G12C-Afatinib, those in (C) and (D) are G12C-Osimertinib, and those in (E) and (F) are G12C-Hydroxychloroquine. In the Maestro suite’s ligand interaction diagrams, the red, green, and purple residue interactions represent Pi-Cation, Pi-Pi stacked/T-shaped, and hydrogen bonds, respectively.
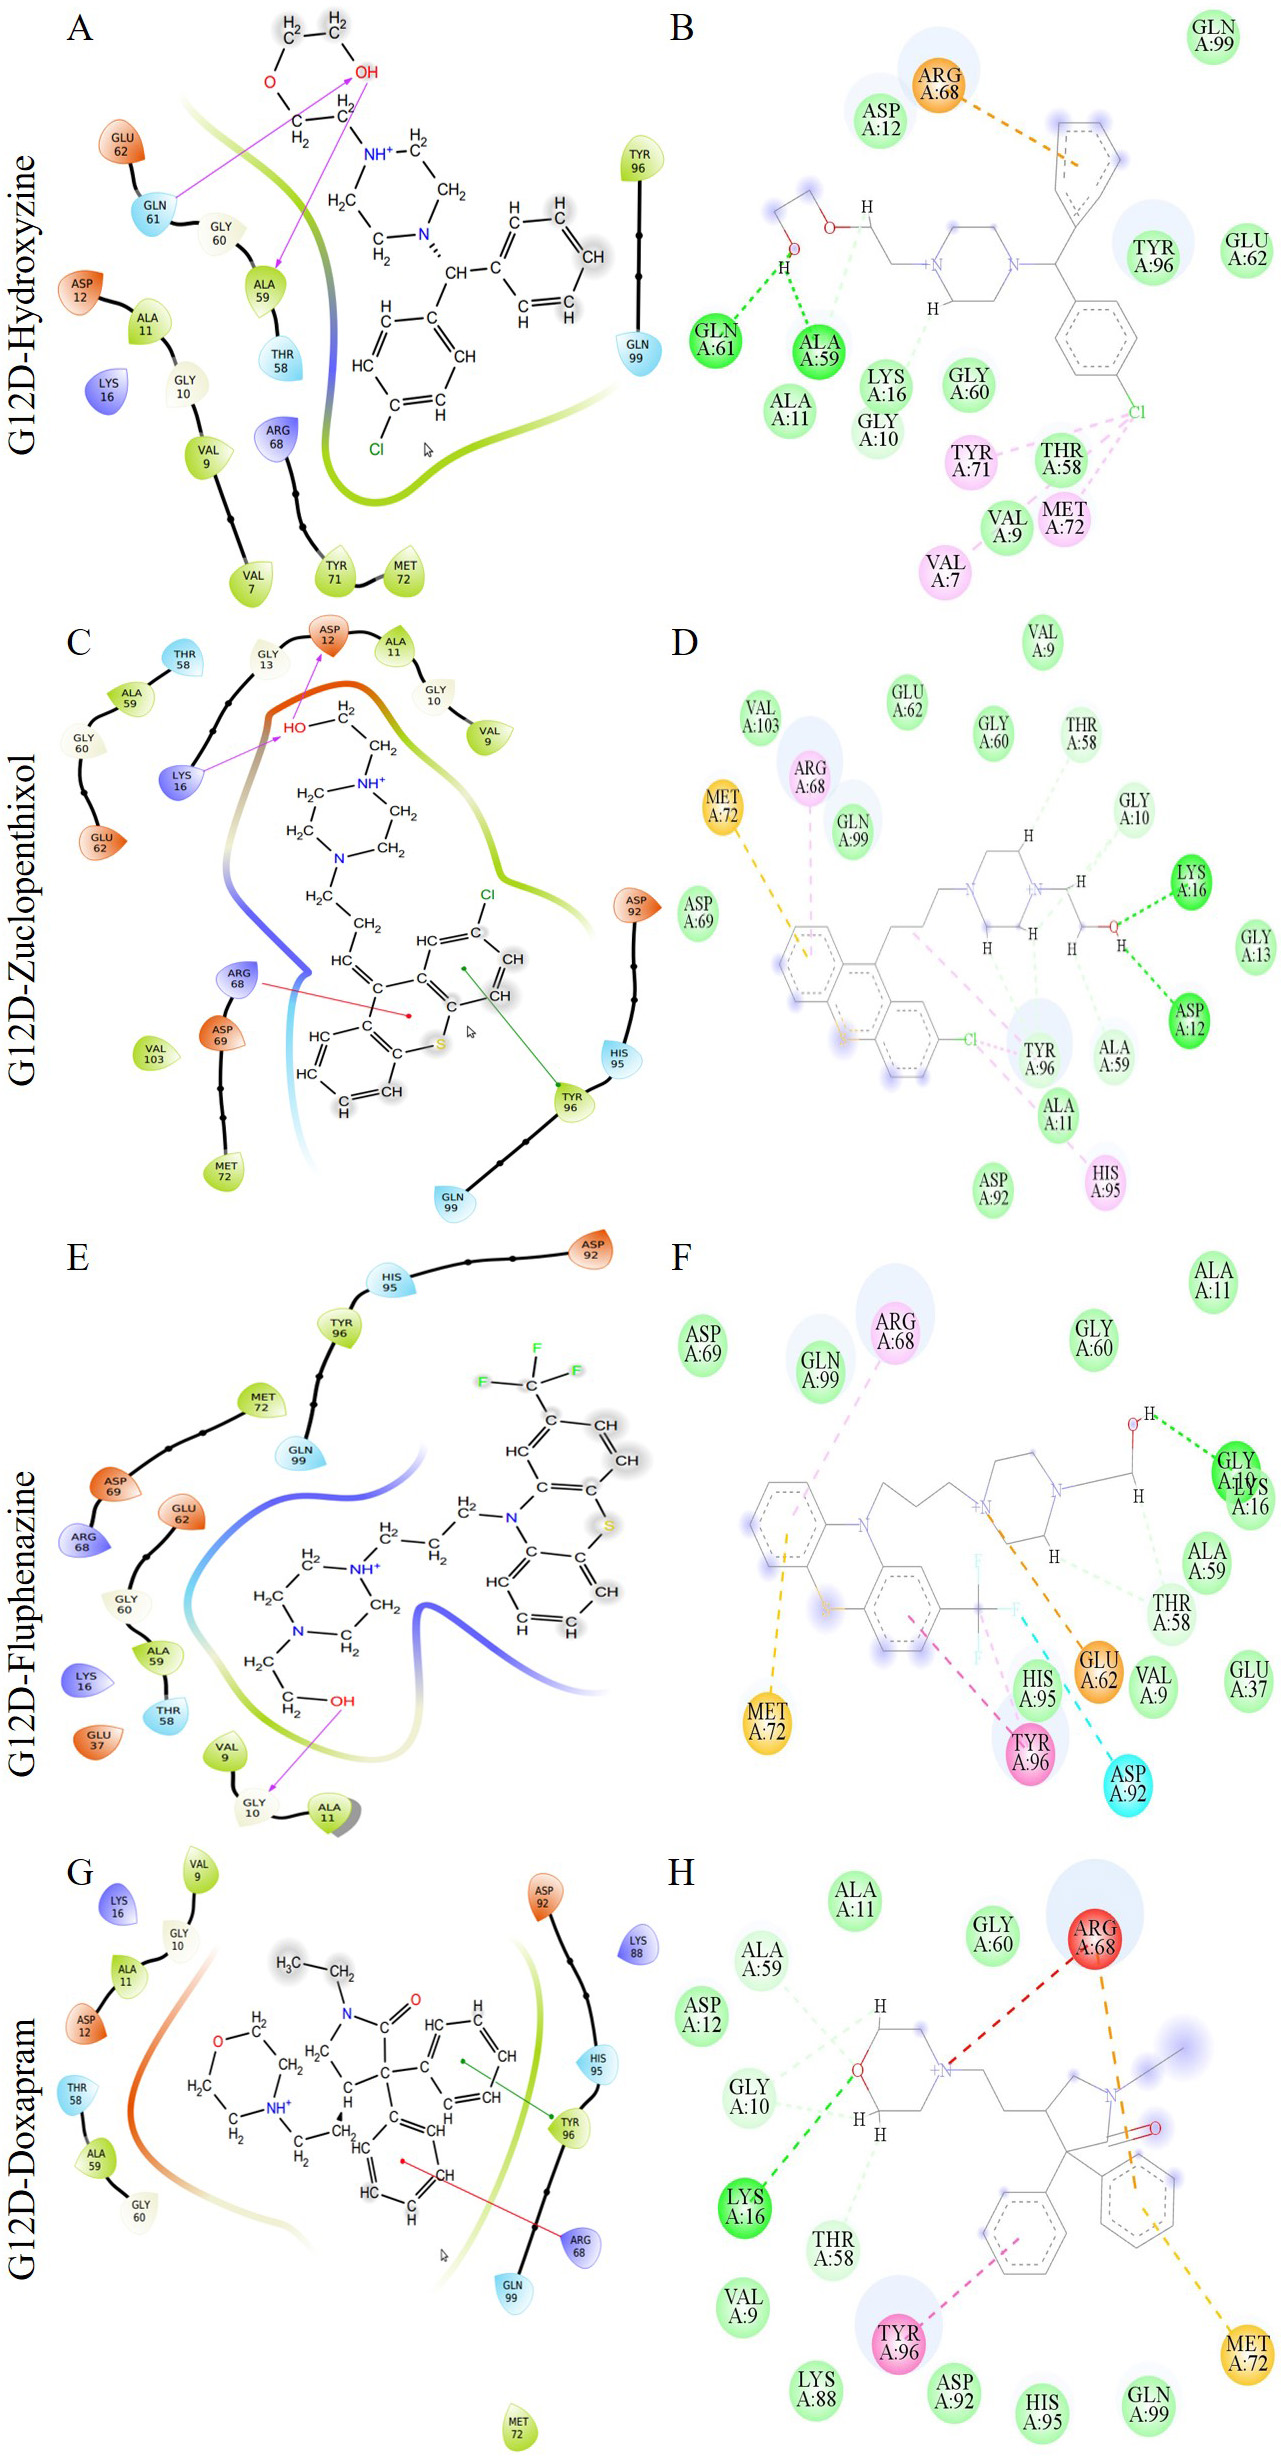 Fig. 5.
The image depicts multiple interactions between a ligand and the G12D K-Ras protein. The diagrams (A), (C), (E), and (G) are from the Maestro suite, while (B), (D), (F), and (H) are 2D ligand interactions from Discovery Studio. The G12D-Hydroxyzine, G12D-Zuclopenthixol, G12D-Fluphenazine, and G12D-Doxapram complexes are represented by (A) and (B), (C) and (D), (E) and (F), and (G) and (H) respectively. In the Maestro’s ligand interaction graphs, the red, green, and purple residue interactions represent Pi-Cation, Pi-Pi stacked/T-shaped, and hydrogen bonds, respectively.
The MDS of 200 ns were performed on each complex to examine the stability of the docked hit molecules compared to sotorasib. The Charmm27 force field was used for the simulations. The structural stability of the nine complexes was assessed using the RMSD. The G12C-afatinib and G12C-hydroxychloroquine complexes showed more deviations (more than 0.2 nm) (Supplementary Fig. 4A), while the G12D-zuclopenthixol complex showed the most fluctuations (0.25 nm) (Supplementary Fig. 4B). The G12C-osimertinib and G12D-hydroxyzine complexes exhibited the least deviations compared to the G12C and G12D-sotorasib complexes. The intermolecular hydrogen bonds were calculated for all nine complexes to determine which bonds contribute to stable complex formation. All three inhibitors in G12C had a greater number of hydrogen bonds than sotorasib (1–2), with a total of 5–6 bonds in each case (Supplementary Fig. 4C). In G12D, all four inhibitors showed a moderate number of hydrogen bonds (1–4) in comparison to sotorasib (Supplementary Fig. 4D). The root mean square fluctuations (RMSFs) values were calculated for each of the complexes using ggplot2. In G12C, the highest fluctuations were observed in G12C-hydroxychloroquine (0.38 nm), followed by G12C-afatinib (~0.35 nm) (Fig. 6A). In contrast, in G12D, the highest fluctuations were seen in G12D-doxapram (~0.34 nm), followed by G12D-fluphenazine (~0.29 nm) in comparison to sotorasib and other inhibitors (Fig. 6B). The compact nature of protein was assessed by visualizing the radius of gyration (Rg) from the MD trajectory. The osimertinib complex showed a steady graph in comparison to the sotorasib complex (Fig. 6C), while the G12D-doxapram, zuclopenthixol, and hydroxyzine complexes all displayed a consistent Rg trend in comparison to the sotorasib complex (Fig. 6D). Across the simulation process, the mean Rg for all nine complexes was 1.53–1.59 nm.
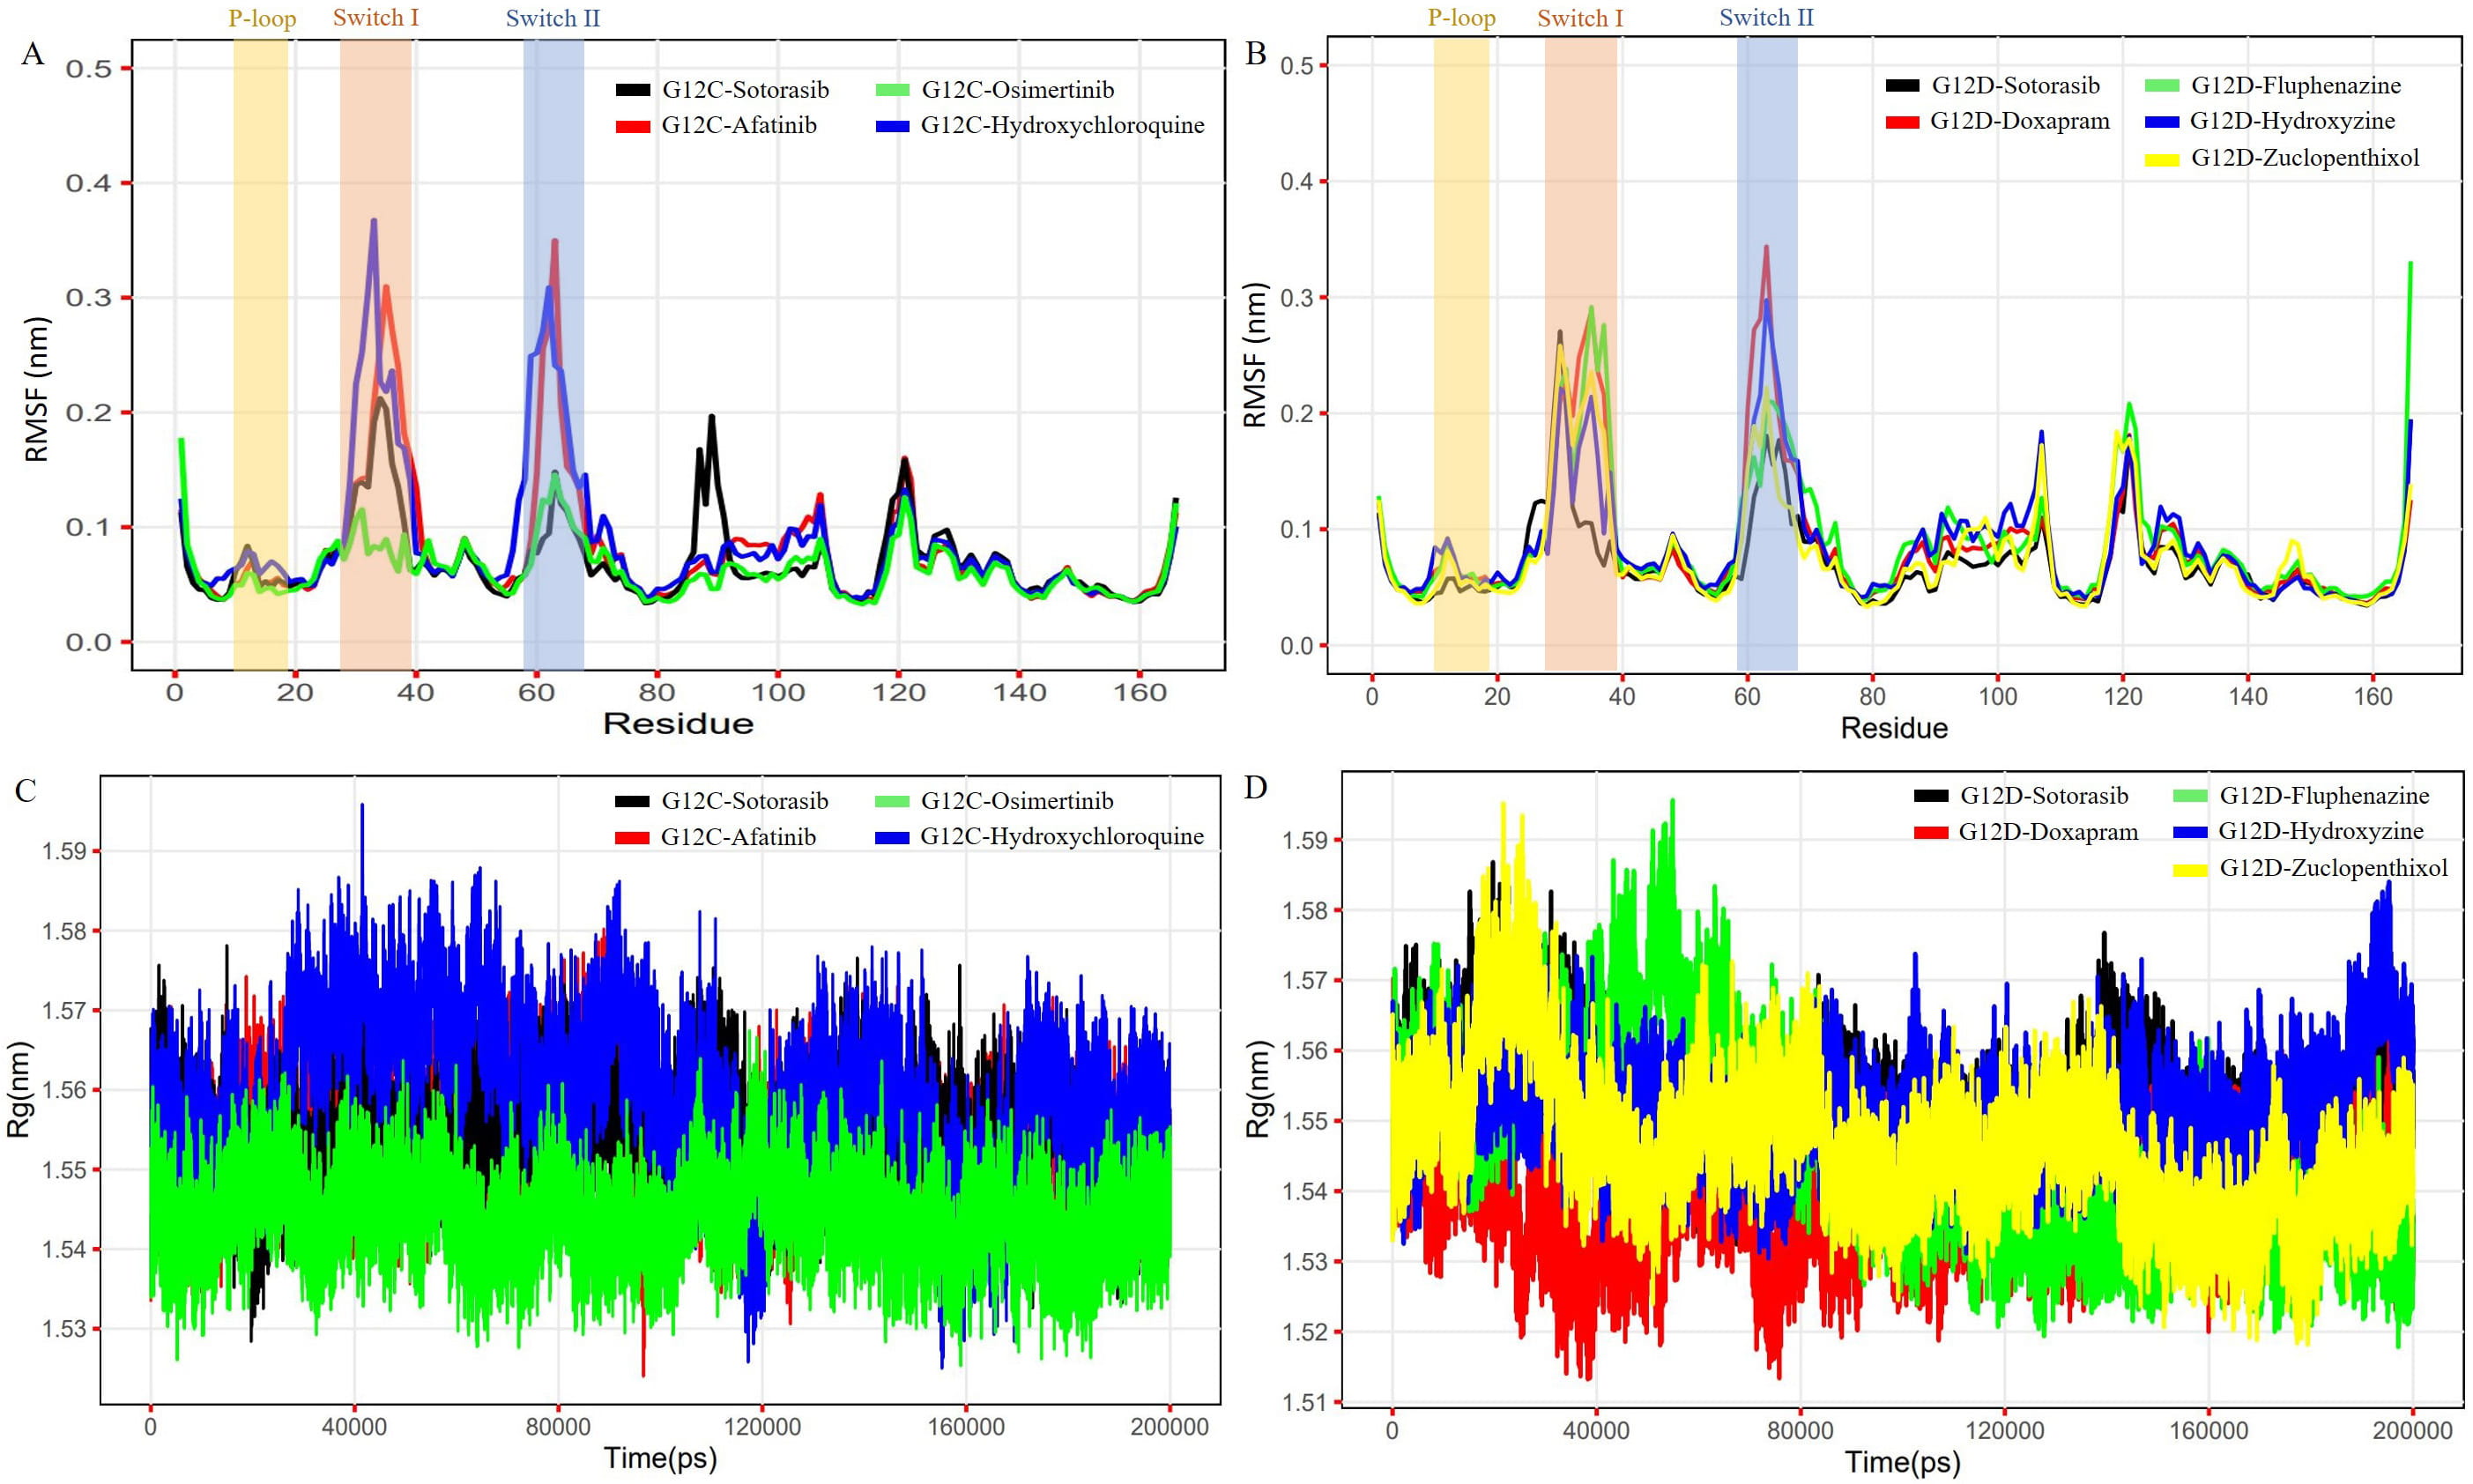 Fig. 6.
The plots represent the RMSF and Rg of the G12C and G12D models complexed with reference (Sotorasib) and shortlisted inhibitor compounds. The first plot (A) shows the RMSF of the G12C model complexed with Sotorasib, Osimertinib, Afatinib, and Hydroxychloroquine. The second plot (B) shows the RMSF of the G12D model complexed with Sotorasib, Doxapram, Fluphenazine, Hydroxyzine, and Zuclopenthixol. The third plot (C) shows the Rg of the G12C model complexed with Sotorasib, Afatinib, Osimertinib, and Hydroxychloroquine. The fourth plot (D) shows the Rg of the G12D model complexed with Sotorasib, Doxapram, Fluphenazine, Hydroxyzine, and Zuclopenthixol.
The movements of the C atoms in each of the nine complexes were analyzed using PCA, as the atomic dynamics of the macromolecule are collective. The PCA plot was created using the first and last PCs, representing the models’ basic aggregate motion. When compared to sotorasib, osimertinib showed less separation of motion in the G12C mutant (Fig. 7A), while hydroxyzine and zuclopenthixol showed less separation of motion in G12D (Fig. 7B). The 3D Gibbs FEL plots show a lower dimensionality in the G12C-osimertinib complex and G12D-zuclopenthixol compared to other inhibitors and reference compounds (Supplementary Figs. 5,6). The stability of the complexes is represented by the volume and shape of the lowest energy region, shown in blue.
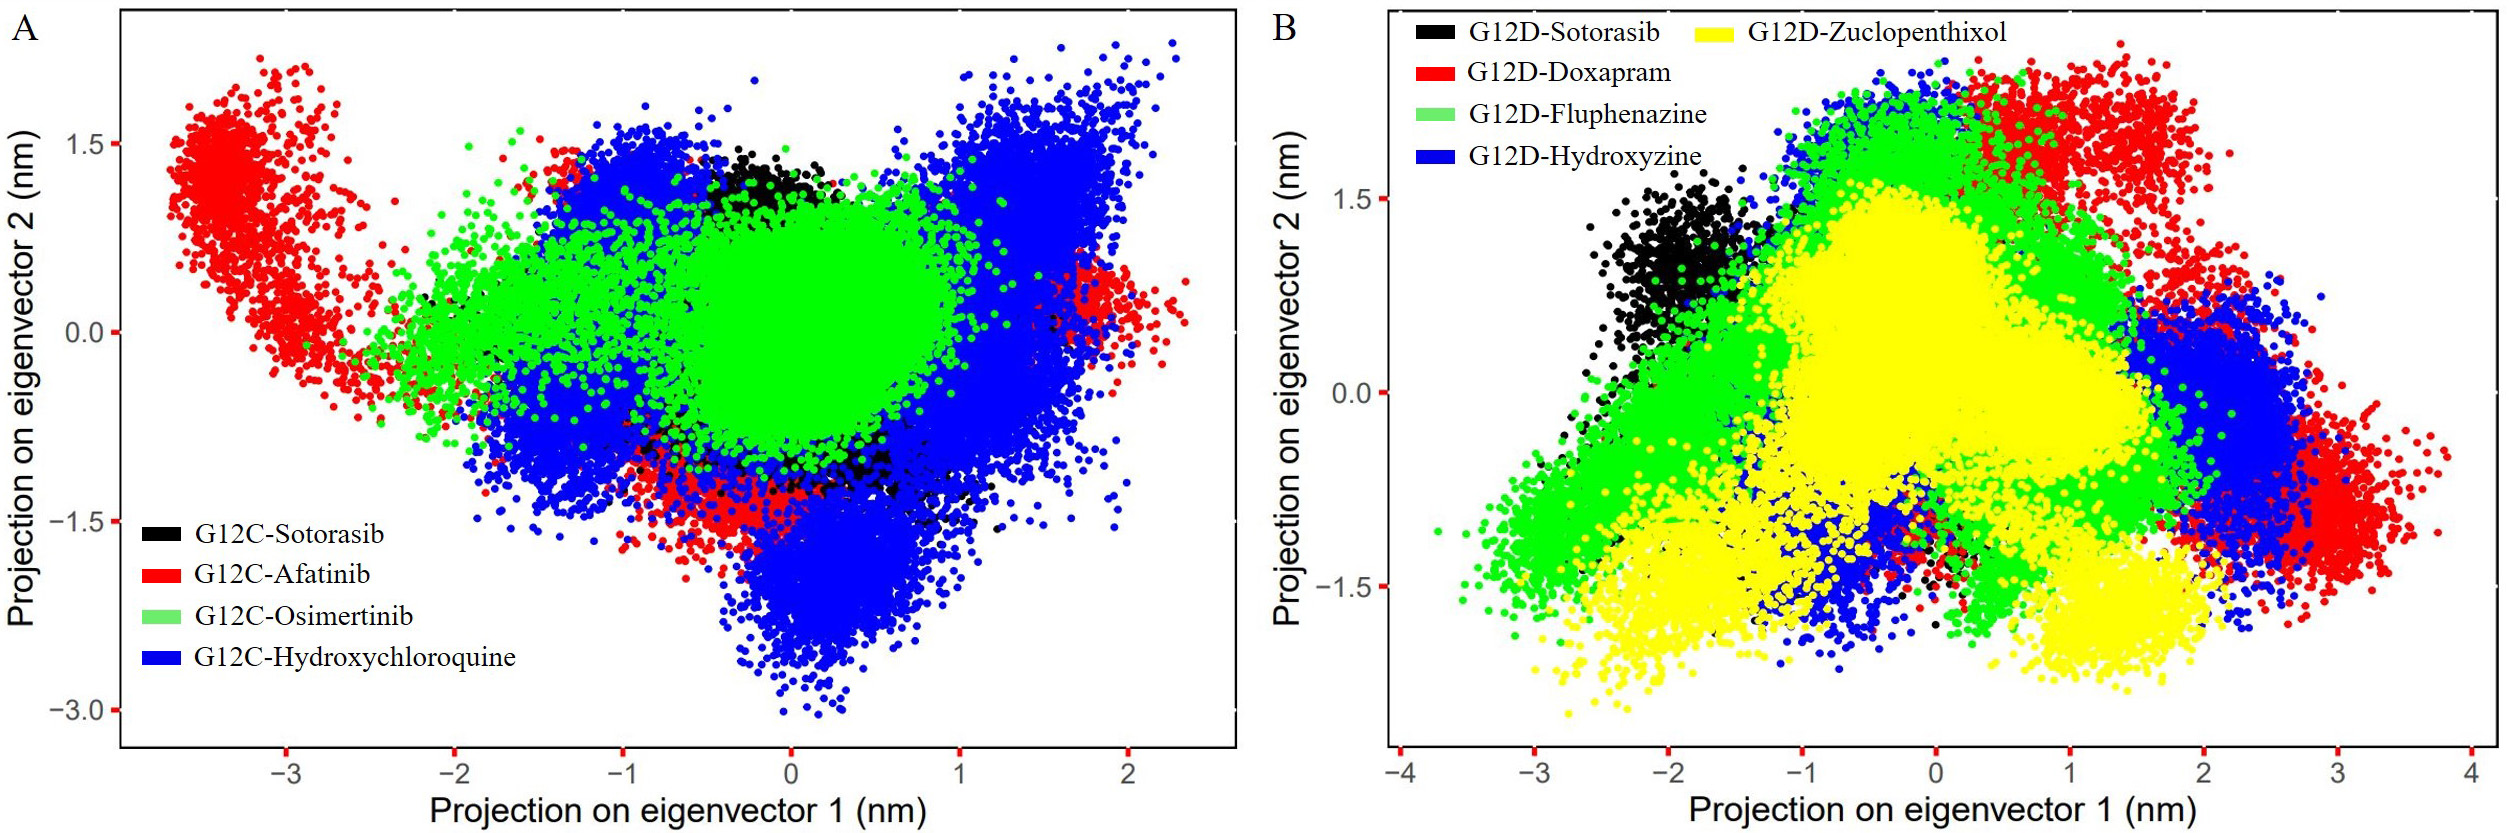 Fig. 7.
The figure shows the PC1 and PC2 contact maps of the G12C and
G12D models complexed with inhibitor molecules, illustrating the C
K-Ras mutations are among the most common oncogenic mutations and play a crucial role in tumor initiation and development, making them a high-priority drug target [7, 10, 54]. According to Lu et al. (2016) [55], K-Ras-G12 mutations account for 89% of all human malignancies, while G13 and Q61 mutations account for 9% and 1%, respectively. However, because of smooth surface and unique binding crater, K-Ras is still difficult for small molecule inhibitors to target precisely [56, 57]. To address this challenge, we used a virtual screening technique based on pharmacophores to identify key inhibitors with anticancer efficacy against K-Ras mutants. Two different pharmacophore hypotheses were constructed based on seven existing inhibitor compounds, accommodating five features (three aromatic groups, one hydrogen bond donor, and acceptor group) (Fig. 1A) and three features (two aromatic groups and a hydrogen bond acceptor group) (Fig. 1B) for G12C and G12D respectively. These hypotheses were used to create a phase database to find hit molecules that might superimpose with the hypotheses. After filtering, we found 299 hit compounds from 2672 FDA-approved compounds. These compounds were then submitted to docking using the three Glide modules, and we identified 3 and 4 hit compounds with higher XP Gscores against K-Ras mutant models compared to the reference compound (sotorasib). These hit compounds were then subjected to an ADMET study using QikProp.
Our study selected three and four hit molecules for G12C and G12D, respectively, based on the XP Gscore and QikProp assessments. All of these hit compounds exhibited substantial descriptor scores compared to sotorasib. Many studies have linked K-Ras mutations to brain tumor progression and distant brain failure (DBF) in advanced NSCLC and lung adenocarcinomas. Compared to sotorasib, all of our hits had substantial descriptor scores. Recent studies have shown that mutant K-Ras is involved in metastatic brain development and DBF in lung adenocarcinomas and NSCLC. Our selected molecules have descriptors within a substantial range and were observed to be more efficient than sotorasib in satisfying the ADME criteria. The hit compounds demonstrated CNS action and could penetrate the BBB in severe forms of cancer, particularly when brain metastases develop, which was considered as the primary criteria for the ADME evaluation stated in Supplementary Tables 1,2.
Sotorasib, a commercialized drug, was generated with improved potency and relatively good developmental properties through H95 groove binding [58]. H95 is a distinctive aspect of AMG510 binding to the P2 pocket of K-Ras [58]. AMG510 strengthens its conjunction from the backbone of helix 2 to switch II by pervading the interaction of Y96 by hydrophobic and H95 grooves. The interactions between our G12C-sotorasib complex were retained due to this singular occurrence. G12C-osimertinib (Fig. 4C,D) and hydroxychloroquine (Fig. 4E,F) exhibited novel H95 groove binding through Pi-Pi stacking interactions, while G12D-zuclopenthixol utilized groove binding (H95) to improve chemical selectivity and potency through a Pi-alkyl interaction (Fig. 5C,D). As previously stated, these interactions boosted the effectiveness and potency of sotorasib. With our study, we anticipate that our estimated hit compounds will functionally and efficiently inhibit K-Ras mutants.
Recent studies have discovered cavities in the K-Ras protein that drugs can target, specifically the switch I/II pocket between switches I and II [59, 60, 61, 62]. Our study found that the G12C-osimertinib (R68) complex interacts with residues in the switch I/II pocket, and when the G12D mutant was complexed with zuclopenthixol (R68), a similar interaction was observed. This unique interaction may enhance the drug’s ability to inhibit mutant K-Ras by increasing its binding affinity and efficacy. Molecular dynamics simulations were used to study the behavior and motion of K-Ras mutants when combined with hit molecules. We analyzed a simulation trajectory of 1800 ns for both mutant models. The Afatinib and hydroxychloroquine complexes caused more significant changes in backbone RMSD than the Osimertinib complex in G12C (Supplementary Fig. 4A), while in G12D, zuclopenthixol, doxapram, and fluphenazine complexes caused more significant changes than the hydroxyzine complex (Supplementary Fig. 4B). We also calculated the RMSF of C atoms to understand how the binding of hit molecules affects the flexibility and fluctuation of mutant complex residues. Our findings showed that the G12C-osimertinib complex had the least structural variation (Fig. 6A), while the zuclopenthixol complex had the least variation in G12D. In the switch I/II regions, significant variations were observed for the complexes of hydroxychloroquine and afatinib with G12C and doxapram and hydroxyzine with G12D. The binding of a solid substance in the cryptic groove of K-Ras could lead to structural inactivation, which may be linked to reduced fluctuations. This could favor the inhibition of the G12 mutant when hit chemicals are bound to the mutant structure. Conversely, hydroxyzine and fluphenazine showed comparable results, ensuring improved binding of the hit compounds (Fig. 6B).
The computation of protein compactness was visualized by analyzing the Rg for the complexes, which is a critical factor in predicting the compaction of a protein in a solvent [63, 64]. The G12C and G12D complexes with osimertinib and doxapram exhibited lower Rg values (1.3–1.5 nm) throughout the simulation compared to sotorasib and other hit compounds (Fig. 6C,D), indicating that the mutant complexes were more tightly condensed and had higher binding efficiency. The stability of a complex depends on the hydrogen bonds formed between the protein and ligands [65, 66, 67]. Detailed information about receptor-ligand interactions can be obtained by evaluating intermediate intermolecular H-bonds. The G12C complex revealed that all three inhibitors had more H-bonds (5–6) than sotorasib (1–2) (Supplementary Fig. 4C), while the G12D complex with four inhibitors demonstrated an average number of H-bonds (~1–4) (Supplementary Fig. 4D). Trajectories were used to examine the PCA of all nine complexes to better understand collective structural movements. G12C’s osimertinib exhibited less motion separation than other complexes (Fig. 7A), while in G12D, fluphenazine, hydroxyzine, and zuclopenthixol had a lower conformation subspace compared to other complexes (Fig. 7B). The Gibbs FEL 3D maps revealed that the G12C-osimertinib complex had the smallest basin compared to other inhibitors (Supplementary Fig. 5) and sotorasib, while the FEL plot of G12D-Fluphenazine and zuclopenthixol revealed a minimum basin compared to other inhibitors and sotorasib (Supplementary Fig. 6).
We identified potential drugs for mutant K-Ras models (G12C and G12D) using E-pharmacophore-based virtual screening. We have developed two E-pharmacophore models for the mutants, with five attributes for G12C and three for G12D. Our computational approaches, including QiKProp, XP docking, and simulations, have led to the discovery of hits for G12C (afatinib, osimertinib, and hydroxychloroquine) and G12D (hydroxyzine, fluphenazine, zuclopenthixol, and doxapram) models. The ADME descriptors from QikProp showed an adequate range for the selected inhibitor molecules. By examining how the hit compounds interact with the mutants, we demonstrated their effective binding to the H95 groove of G12 mutants, inhibiting their function. The simulation trajectories showed that the mutants formed stable complexes with the inhibitors. These complexes could be used in in vivo and in vitro studies to develop a promising drug that could be an alternative to sotorasib. Additionally, experimental studies on the G12C-osimertinib, G12D-fluphenazine, and G12D-zuclopenthixol complexes might be a good first step toward creating an inhibitor molecule with high activity and low toxicity.
All data generated or analyzed during this study are included in this published article.
The study was designed, and data was acquired, analyzed, and interpreted by UKS and CGPD. UKS performed the experiments to obtain, examine, and comprehend the results. UKS, RPV, VAP, and HZ participated in the analysis, computational verification, and manuscript drafting. CGPD and HZ oversaw the entire study and contributed to the comprehension of the data and revision of the manuscript. All authors contributed to editorial changes in the manuscript. All authors read and approved the final manuscript. All authors have participated sufficiently in the work and agreed to be accountable for all aspects of the work.
Not applicable.
Udhaya Kumar. S, one of the authors, gratefully acknowledges the Indian Council of Medical Research (ICMR), India, for providing him a Senior Research Fellowship [ISRM/11(93)/2019]. In addition, the authors would like to thank the Vellore Institute of Technology, Vellore, India, and Qatar University, Doha, Qatar for providing the necessary research facilities and encouragement to carry out this work. Open Access funding provided by the Qatar National Library.
This research received no external funding.
The authors declare no conflict of interest. As C. George Priya Doss was one of guest editors of the journal, we declare that he had no involvement in the peer-review of this article and has no access to information regarding its peer-review. Full responsibility for the editorial process for this article was delegated to Milena Georgieva.
References
Publisher’s Note: IMR Press stays neutral with regard to jurisdictional claims in published maps and institutional affiliations.