
- Academic Editors
†These authors contributed equally.
Background: Colon adenocarcinoma (COAD) is a major cause of cancer mortality worldwide. The occurrence and development of colon cancer is regulated by complex mechanisms that require further exploration. Recently, long non-coding RNAs (lncRNAs) were found to be related to the mortality of colon cancer patients through their participation in competing endogenous RNA (ceRNA) networks. Therefore, screening the lncRNAs involved in colon cancer may contribute to clarifying the complex mechanisms. Methods: In this study, we explored the potential lncRNAs associated with colon cancer by establishing a ceRNA network using bioinformatics, followed by biological verification. Results: RP11-197K6.1 and RP11-400N13.3 were screened out owing to their involvement in the expression of CDK2NA, a gene that potentially prevents colon cancer cells from high oxygen levels. Conclusions: Our work explored the mechanisms of recurrence and metastasis in colon cancer and provided potential targets for drug development.
Colon cancer is one of the most prevalent cancers worldwide, with characteristics involving a high incidence rate and high mortality [1]. Presently, surgery is used as the main treatment option, supplemented by radiotherapy and chemotherapy to achieve the therapeutic effect of killing and reducing the number of tumor cells as much as possible [2]. However, the 5-year survival rate for colon cancer remains alarmingly low because of the high recurrence and metastasis rates [3]. Thus, a better understanding of the underlying mechanisms and contributing factors involved in the metastasis development of colorectal carcinoma (CRC) is hugely important to provide the foundation for identifying specific targets in the treatment of CRC. The function of microRNA (miRNA) was reported to play an important role in the recurrence and metastasis of colon cancer by regulating the epithelial–mesenchymal transition (EMT) at both the post-transcriptional and post-translational levels. However, it seems that all major signaling pathways modulated by miRNA are involved in the CRC EMT program and contribute differently to the progression of CRC, thereby exhibiting the complexity of the metastatic cascade [4].
Recent research has focused on long non-coding RNAs (lncRNAs) owing to their regulatory relationship with miRNAs. They are a group of non-coding RNA molecules with a length greater than 200 nucleotides. Human genome sequencing results have shown that less than 2% of the whole genome encodes proteins and that most of the non-coding sequences were transcribed into lncRNAs. The interaction between lncRNA and miRNA is closely related to the occurrence and development of tumors [5]. The lncRNAs that regulate miRNAs through “sponge” absorption are also known as competitive endogenous RNA (competing endogenous RNA, ceRNA). Numerous research studies have indicated that lncRNAs possess high potential as novel biomarkers and therapeutic targets in cancer treatment [6]. Compared to defined lncRNAs, the functions and mechanisms of most lncRNAs remain unknown. Moreover, the current lncRNA mining works adopt bioinformatical methods that lack any systematic approach and verification.
The present study aimed to discover lncRNAs that influence the overall survival (OS) and disease-free survival (DFS) of colon patients and identify the underlying mechanisms involved in the recurrence of colorectal cancer in patients through the interaction between lncRNA and miRNA; thus, multiple bioinformatics databases were employed to establish a ceRNA network for colon cancer via a regulatory mechanism. The prediction of cellular localization indicated that lncRNA may regulate the expression of messenger RNA (mRNA) through a competitive endogenous network. Then, according to the differential expression of lncRNA-related miRNAs in colon cancer tissues, the downstream mRNA target regulated by miRNA was screened out, and a regulatory network of lncRNA was constructed (Fig. 1).
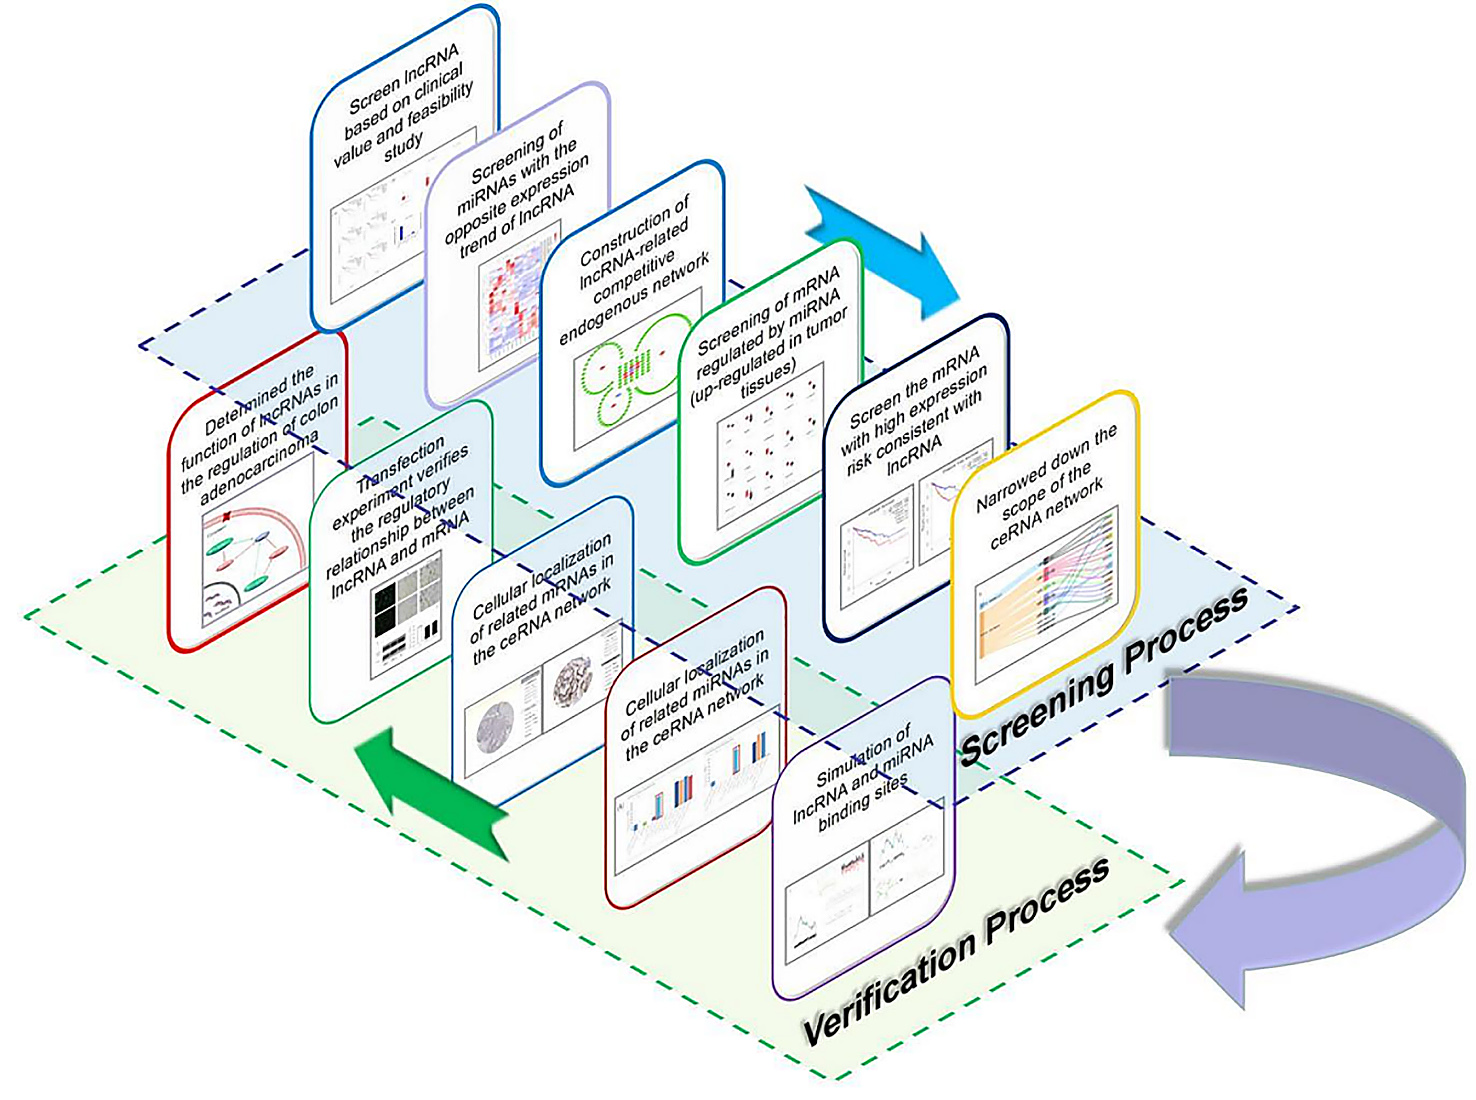 Fig. 1.
Graphical summary of the screening and verification process. LncRNA, long non-coding RNA; mRNA, messenger RNA; miRNA, microRNA; ceRNA, messenger RNA.
LncRNA expression levels in colon adenocarcinoma from The Cancer Genome Atlas
Program (TCGA) were visualized using circlncRNAnet [7]. Differentially expressed
lncRNAs were identified according to the criterion:
The miRNA datasets were obtained from the Gene Expression Omnibus (GEO). ‘Colon cancer’ and ‘miRNA’ were selected as keywords, and the GSE125961 dataset was produced [12]. This dataset included 6 colon cancer tissues and 6 normal tissues, which contained a total of 1540 miRNAs. All miRNAs related to lncRNA in the dataset were screened and displayed with Heatmap. The lncRNA-binding miRNAs were predicted using miRcode [13].
The miRNA target genes were acquired using miRTarBase [14]. The genes that were validated using at least one strong experimental technique i.e., reporter gene assay, Western blotting, or quantitative reverse transcription polymerase chain reaction (PCR), were regarded as miRNA targets. The lncRNA–miRNA–mRNA network was generated using Cytoscape 3.8.0 [15].
Gene Ontology (GO) and Kyoto Encyclopedia of Genes and Genomes (KEGG) enrichment analyses were performed for the mRNAs in the ceRNA networks, considering the various biological processes associated with Gene Ontology. GO and KEGG pathway analyses of lncRNA-related genes were performed using Metascape v3.5 (https://metascape.org/gp/index.html) [16]. After submitting a gene list in Metascape, ‘Input species’ and ‘Analysis as species’ was set alongside ‘H. sapiens’, and ‘Custom Analysis’ was selected for the next step. When using Metascape for pathway and process enrichment analysis, the minimum overlap was set to 3, with a p-value cutoff of 0.01, and a minimum enrichment of 1.5. ‘KEGG Pathway’, ‘GO Biological Processes’, and ‘Reactome Gene Sets’ were selected as the pathway options. All other options were set to default.
STRING was used to collect data from the protein–protein interaction (PPI) network construction of lncRNA-related target genes, and Cytoscape 3.8.0 (Institute for Systems Biology, Seattle, WA, USA) was used for network visualization. The hub genes were selected using the CytoNCA network analyzer plug-in based on three different centrality measures, including ‘betweenness centrality (BC)’, ‘closeness centrality (CC)’, and ‘subgraph centrality (SC)’ [17].
In the enrichment analysis data, the genes related to colon cancer and the genes with the top 20% centrality in the PPI network were both selected for subsequent analyses since they are hub genes related to lncRNA.
The gene expression data were obtained from the Human Protein Atlas (HPA),
selected by using ‘colon’, and a subset of colon cancer in PATHOLOGY [18]. All
patient data related to gene expression used in this study were obtained from
TCGA (Table 1). R packages ‘survival’ and ‘plyr’ were used to perform cox
regression analysis of the selected genes. Multivariate regression modeling was
performed by univariate regression (p
| Term ID | Description | Log P | Gene |
| hsa05200 | Pathways in cancer | –36.353 | CDK4, CCND1, CDKN1A, RB1, E2F1, E2F2, E2F3, TP53, AKT2, AKT1, CDKN2A, CDK2, CCND2, RAF1, EGFR, ERBB2, PTEN, BAK1, STAT3, MAPK9, BCL2, SMAD4, TGFBR2, CASP3, FAS, VEGFA, ETS1, ESR1, BBC3, FGFR2, HIF1A, EPO, RUNX1, IGF2, IL6R, BCL2L11, BMP2, SMO, GLI1, CASP7 |
| hsa05206 | MicroRNAs in cancer | –28.345 | HDAC4, CDKN1A, BCL2L11, BMPR2, TP53, RAF1, EGFR, STAT3, CCDN2, E2F1, PTEN, CCND1, CDKN2A, BMI1, CASP3, BMF, MCL1, ERBB3, E2F2, ERBB2, BCL2, E2F3, ATM, BAK1, SOX4, CYP24A1, VEGFA, HMGA2 |
| GO: 0070482 | Response to oxygen levels | –20.009 | EIF4, EBP1, TP53, BCL2, AKT1, EPO, HIF1A, E2F1, PTEN, CD34, VEGFA, HK2, SMAD4, CASP3, BMP2, ADAM15, RAF1, ATM, NR4A2, TGFBR2, ETS1, FAS, CDK4, CDKN1A, PDPN |
The selected genes from the HPA database were verified by antibody staining
after multivariate regression modeling, to determine the location of the mRNA
expression. ‘Colon cancer’ was selected in ‘protein expression’ from ‘pathology
atlas’, while ‘staining’ was selected as ‘high’, and ‘intensity’ and ‘quantity’
were selected as ‘strong’ and ‘
The Extracellular Vesicles miRNA (EVmiRNA) database analyzed 462 small RNA sequencing datasets containing extracellular vesicles from 17 tissues/diseases, which provided the expression of specific miRNAs in different types of cancer [21]. Therefore, EVmiRNA was used to identify the selected miRNAs in colon cancer.
The RNAfold Web Server was used to predict secondary structures of
single-stranded RNA and RNA–RNA interaction. ‘Minimum free energy (MFE) and
partition function’ was selected in ‘fold algorithms and basic options’ to
calculate the partition function (1) and base pairing probability matrix in
addition to the MFE structure (2).
Human colon adenocarcinoma cells (CACO-2) were purchased from the American Type
Culture Collection (ATCC). The cell line was authenticated by short tandem
repeats, and mycoplasma testing was conducted. Cells were cultured routinely in
high glucose Dulbecco’s Modified Eagle’s Medium (DMEM-basic, Gibco, Waltham, MA,
America), containing 20% fetal bovine serum (Biological Industries, Kibbutz Beit
Haemek, Israel). When the cells reached 90% confluency, they were passaged using
a 0.25% trypsin–EDTA solution (Solarbio, Beijing, China). The cells were
cultured in a humidified incubator at 37 °C under an atmosphere of 5%
CO
Using the lncRNA RP11-197K6.1 sequences in the UCSC Genome Browser (http://genome.ucsc.edu/), small interfering RNA expressing negative control (NC) RNA and lncRNA were designed and developed by HippoBio in China. All of these sequences were transfected into cells in the logarithmic growth phase using RNA TransMate transfection reagent (Sangon, Shanghai, China), in accordance with the manufacturer’s protocol. When transfection and verification were complete, the cells were used in subsequent experiments.
For WB analysis, cells were lysed in radioimmunoprecipitation assay (RIPA)
buffer (Keygen Biotechnology, Nanjing, China), supplemented with
1
Total RNA was extracted from cells using TRIzol reagent (R1100, Solarbio,
China). The purity and concentration of RNA were calculated by optical density
(OD) at wavelengths of 260 and 280 nm. The synthesis of complementary DNA (cDNA)
was performed using FastKing RT Kit (KR116, Tiangen, Beijing, China) in PCR
Thermal Cycler Dice (TP600, TaKaRa, Kusatsu, Japan). Real-time PCR analyses were
performed using SuperReal PreMix Plus (FP205, Tiangen, China) in the Applied
Biosystems 7300 Real-Time PCR System (Applied Biosystems, Foster, CA, USA). The
expression level of RP11-197K6.1 was calculated using the
2
All data are presented as mean
Through data collection in circlncRNAnet, it was found that 59 lncRNAs are
differentially expressed in colon cancer (Supplementary Table 1). The
results identified that most of the differentially expressed lncRNAs were
upregulated in colon cancer, with extremely high statistical significance
(p-adjust
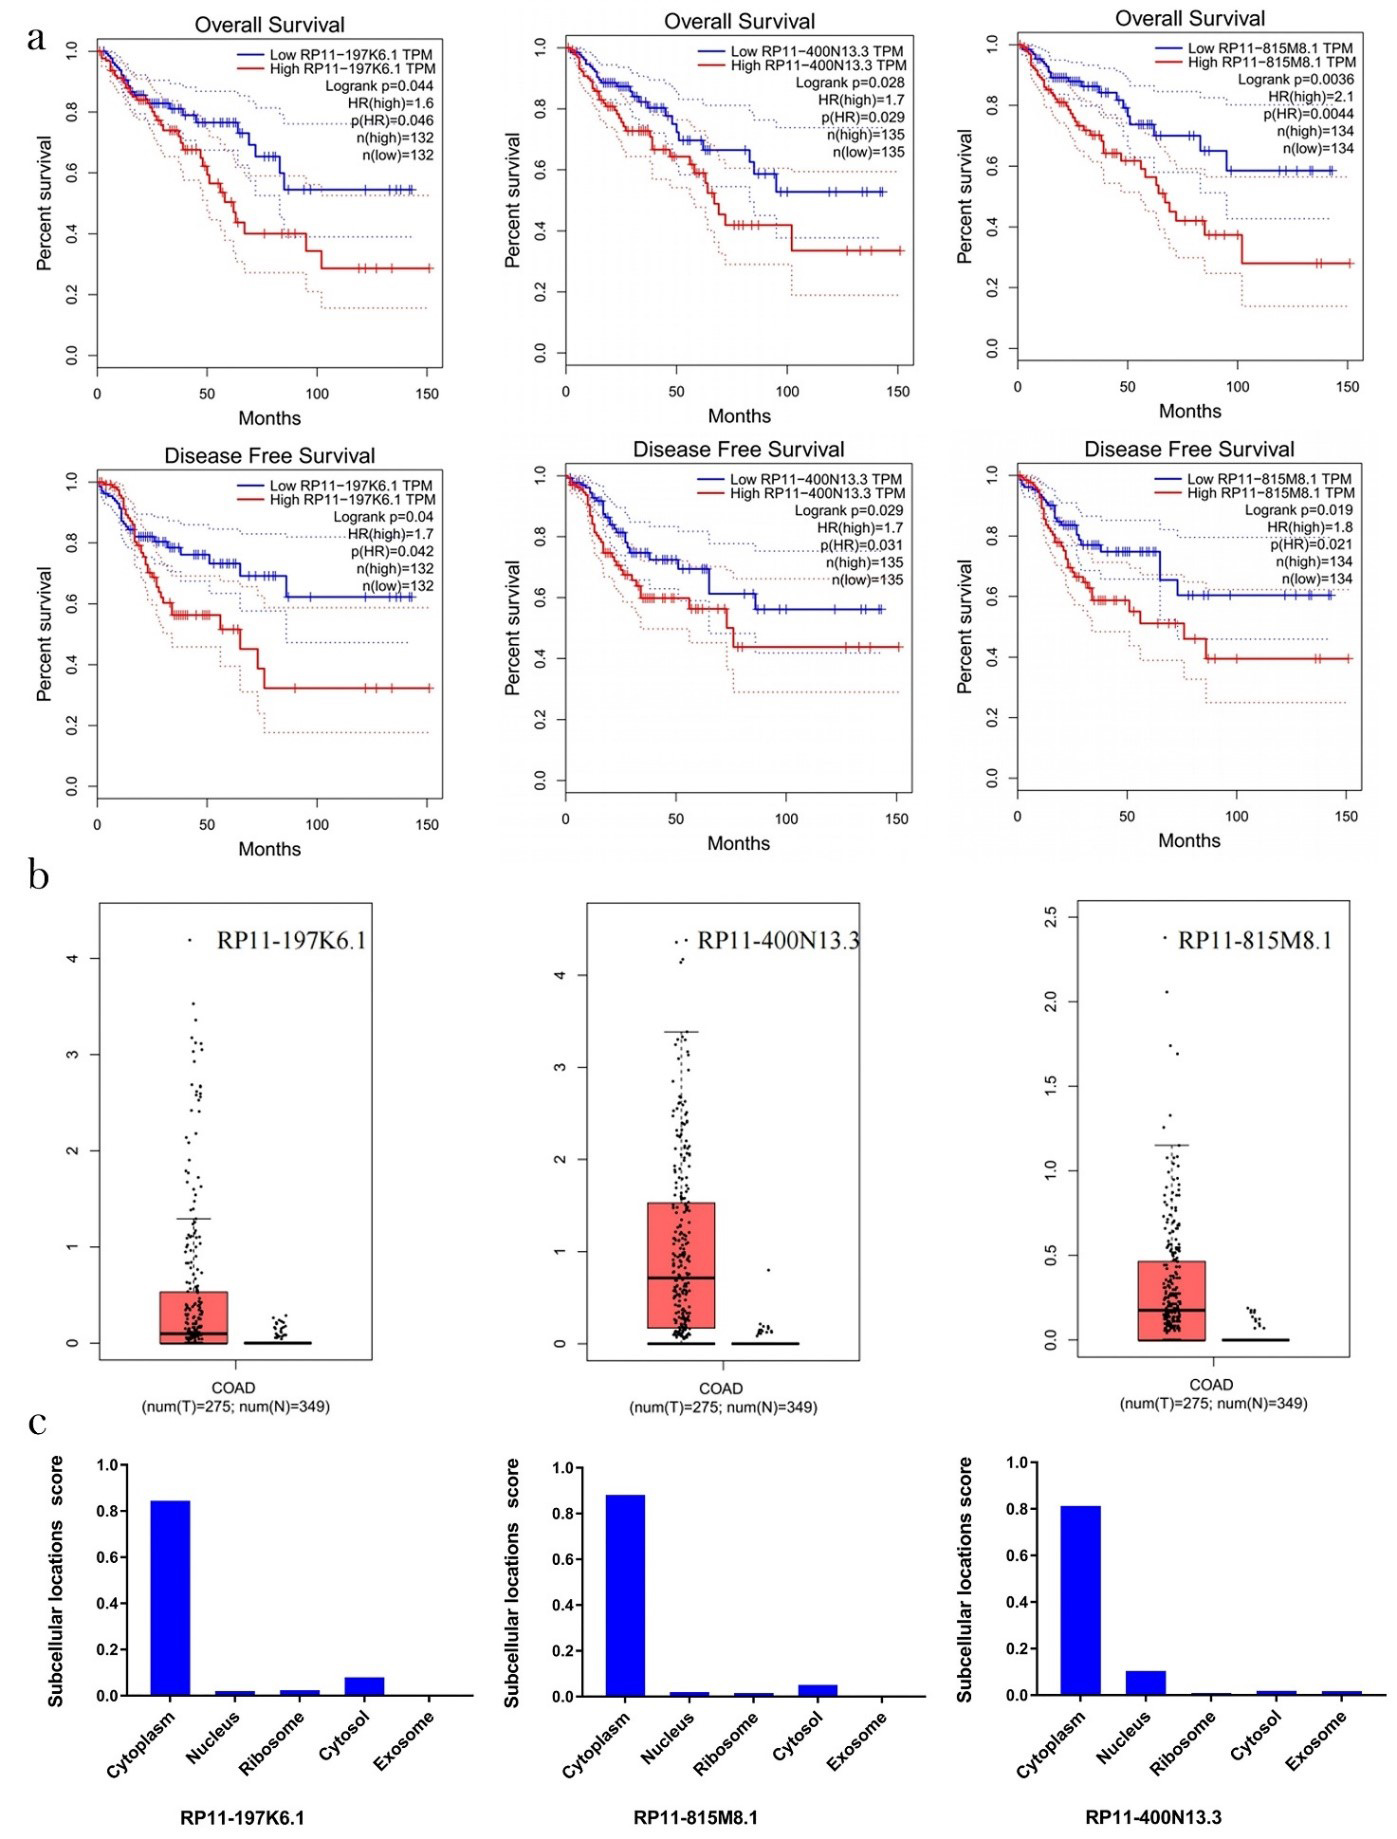 Fig. 2.
The correlation between the expression of the three lncRNAs and OS and DFS in colon cancer patients: (a) Overall survival and prognostic values of lncRNA in colon cancer from TCGA were analyzed using GEPIA. The overall survival curve and prognostic survival curve of three lncRNAs. (b) The expression of lncRNA in colon adenocarcinoma patients was extensively upregulated compared to normal tissues. (c) Subcellular localization of RP11-815M8.1, RP11-400N13.3, and RP11-197K6.1 predicted by lncLocator. TCGA, The Cancer Genome Atlas; GEPIA, Gene Expression Profiling Interactive Analysis; OS, overall survival; DFS, disease-free survival; lncRNA, long non-coding RNAs; COAD, colon adenocarcinoma.
The research shows that the lncRNAs in the cytoplasm rather than in the other
cell components interfere with the inhibitory effect of miRNA on mRNA. Thus, we
screened for the lncRNAs that participate in the ceRNA network, according to
their location. The result predicted that RP11-400N13.3, RP11-197K6.1, and
RP11-815M8.1 were all located in the cytoplasm (Fig. 2c; score: 0.82, 0.85, and
0.89, respectively). Therefore, the three lncRNAs can potentially regulate
cellular functions through the ceRNA network. To construct the downstream lncRNA
regulatory network, the target miRNAs of the lncRNAs were predicted.
Subsequently, 37 miRNA families were found to be downstream and under the
regulation of the three lncRNAs (Supplementary Table 2). Differentially
expressed gene (DEG) analysis indicated that 12 miRNAs were significantly
downregulated in colon cancer patients according to the GSE125961 dataset (Fig. 3a;
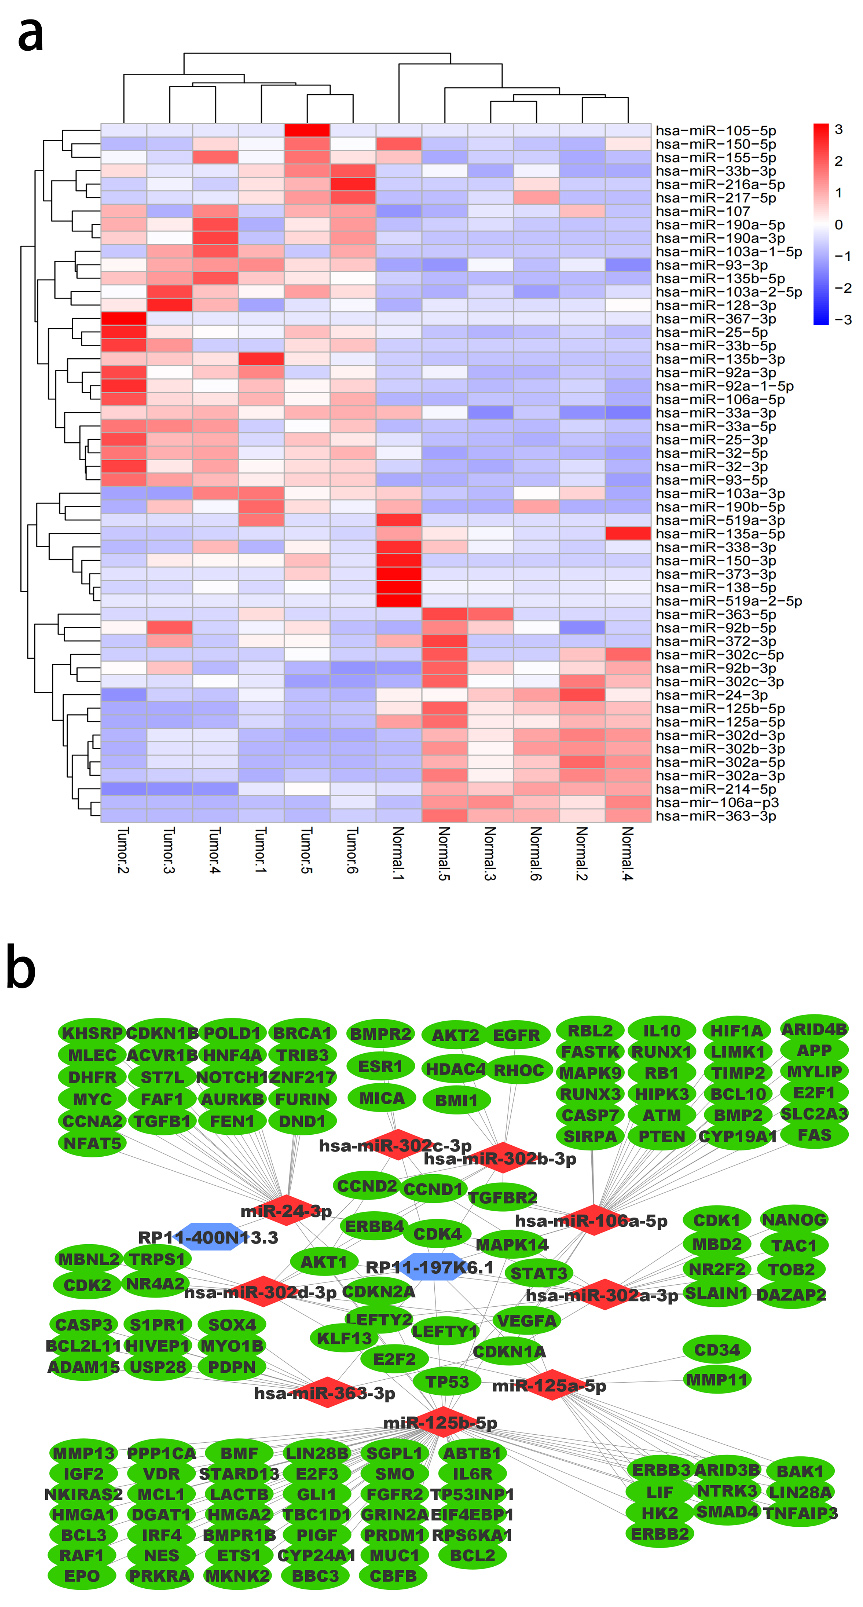 Fig. 3.
DEG analysis and ceRNAnet construction: (a) Differentially
expressed miRNAs in colorectal cancer. Heatmap of differentially expressed miRNAs
in colorectal cancer obtained from GSE125961 dataset using GEO2R (
Function and pathway enrichment analysis was performed based on the online bioinformatics portal Metascape. The result of gene enrichment analysis showed that RP11-197K6.1-targeted mRNAs were enriched in cancer pathways, especially the “pathways in cancer (hsa05200)”, “microRNAs in cancer (ko05206)”, and “response to oxygen levels (GO: 0070482)” with a -log10(P) score of 37, 28, and 20, respectively (Fig. 4a). Moreover, the pathway “microRNAs in cancer (ko05206)” and “response to oxygen levels (GO: 0070482)” were reportedly associated with colon cancer development. Oxygen level is an intracellular factor that has been reported to prevent colon cancer cells from apoptosis by promoting DNA damage repair [22, 23, 24]. Therefore, the “response to oxygen levels” identification is of great value in the current research. In order to explore the specific relationship between oxygen levels and the development of colon cancer, three datasets were selected to identify an overlap between them: two biological pathways with the highest enrichment degree of colon cancer and one pathway involving the cellular response to oxygen levels. The protein interaction network for all the ceRNA targets was constructed, and the top 20% of the centrality targets were selected for further study (Supplementary Fig. 1). Finally, according to whether there were significant differences in the expression of these target genes between colon cancer tissues and normal tissues, all target genes highly expressed in colon cancer tissues were excluded. For RP11-400N13.3, its target mRNAs were clustered into “negative regulation of growth (GO: 0045926)”, “cell cycle (R-HAS-1640170)”, and “PID E2F PATHWAY (M40)” (Fig. 4c). However, there was an inadequate number of genes required for enrichment analysis to identify a clear relationship between RP11-400N13.3 and colon cancer. Nevertheless, there were some potential biological pathways related to cancer, including “DNA replication (GO: 0006260)”, “AMP-activated protein kinase (AMPK) signaling pathway (hsa04152)”, and “negative regulation of translation (GO: 0017148)”. Significantly, similar to RP11-400N13.3, the non-cancer-related pathways predicted to be involved in the functions of RP11-197K6.1 were “cell cycle-related” and “regulation of metabolic process”, suggesting a potential common mechanism between RP11-400N13.3 and RP11-197K6.1.
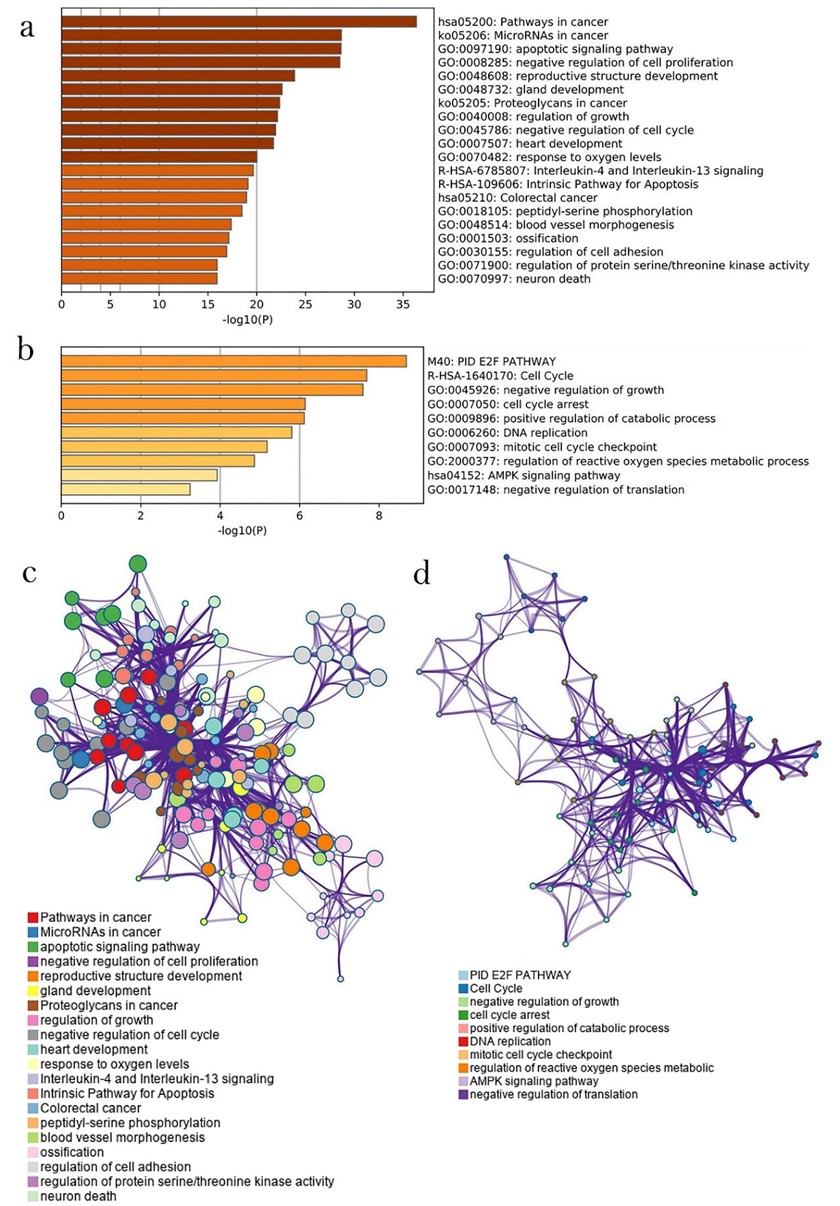 Fig. 4.
GO and KEGG enrichment analyses. (a) GO and KEGG enrichment analyses of genes associated with RP11-197K6.1. (b) Interaction network illustrating the top 20 enrichment terms for RP11-197K6.1-related genes, larger nodes indicate the enrichment of more genes in the pathway. (c) GO and KEGG enrichment analyses of genes associated with RP11-400N13.3. (d) Interaction network illustrating the top 10 enrichment terms for RP11-400N13.3-related genes. It shows that compared to RP11-400N13.3, more enrichment pathways are related to cancer for RP11-197K6.1.
According to the enrichment analyses, it is suggested that the expression of mRNA regulated by RP11-400N13.3 and RP11-197K6.1 is closely related to colon cancer. The RP11-197K6.1-related genes enriched in the three biological pathways are shown in Table 1. To ensure the diversity and statistical significance of the samples included in the study, three different levels of p-value cancer-related pathways were selected from the results of the enrichment analyses. In Fig. 5a, the Venn diagram demonstrates that 27 targets overlap in two or more datasets. It was observed that the mRNA expression levels of nine RP11-197K6.1–related targets (CDKN2A, E2F1, TP53, CASP3, VEGFA, CDK4, CCND1, E2F3, and BAK1) were significantly upregulated in colon tumor compared to normal tissues. Based on the network topology analysis of the lncRNA-related target genes, the top 20% of genes with the highest importance were obtained (Supplementary Fig. 1). It was found that in addition to the 27 genes described in the Venn diagram, there were another 5 genes (BRCA1, CDK1, RUNX3, APP, and PPP1CA) highly expressed in colon cancer tissues (Supplementary Fig. 2). Thus, the total 14 crucial targets were further considered to investigate the relationship to the two lncRNAs (Fig. 5b).
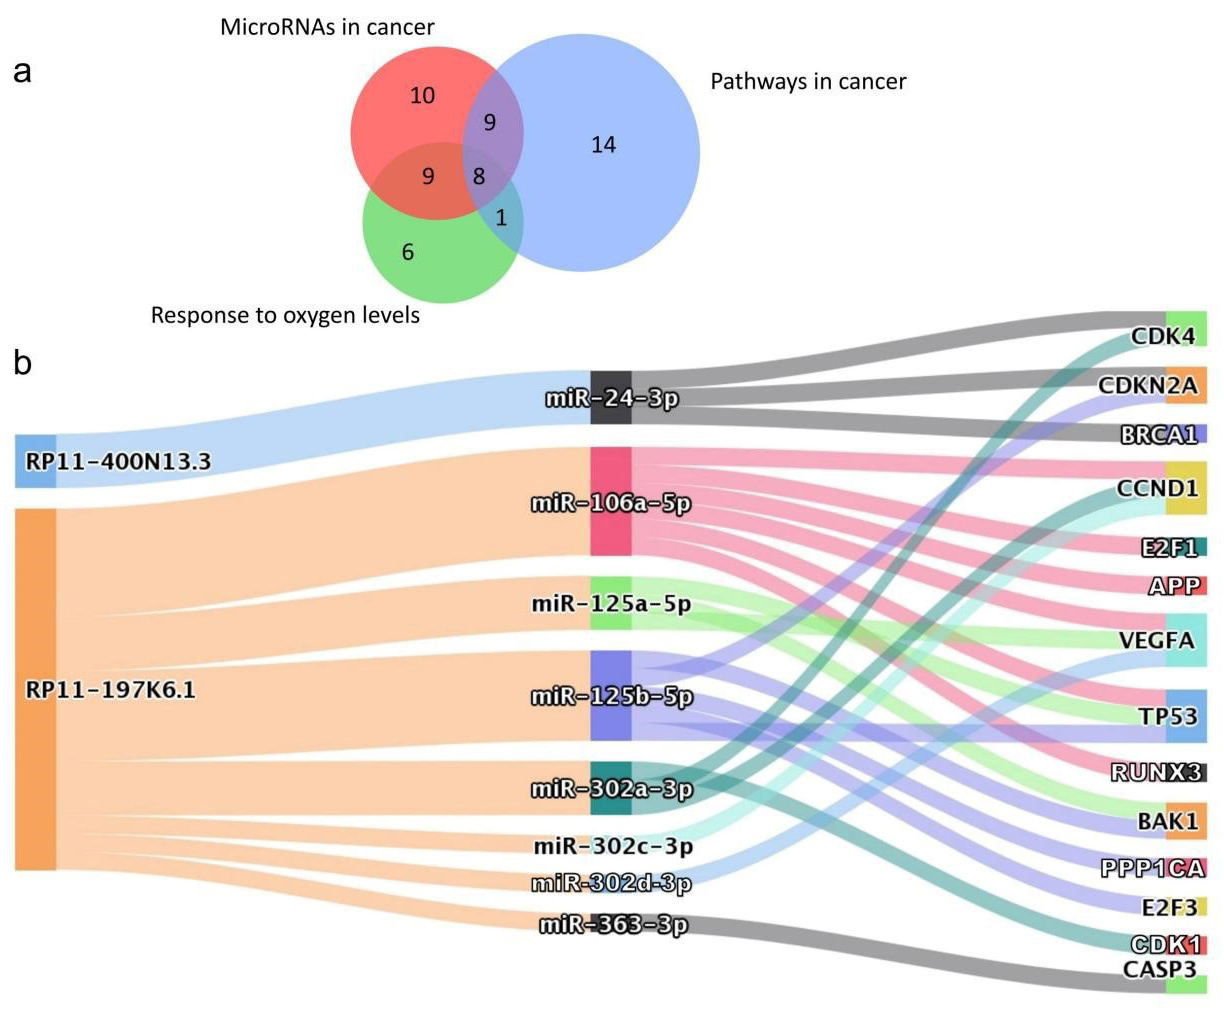 Fig. 5.
Identification of RP11-400N13.3 and RP11-197K6.1–related crucial genes in colon cancer. (a) Venn diagram of the overlapping genes related to “microRNAs in cancer (ko05206)”, “response to oxygen levels (GO: 0070482), and “pathway in cancer (hsa05200)”. (b) Crucial genes upregulated in colon cancer by RP11-400N13.3 and RP11-197K6.1, via several miRNAs.
In order to screen out the genes whose expression significantly affected the
patient’s survival, the sample data from 438 colon adenocarcinoma patients in the
TCGA database were employed to analyze the expression of 14 genes highly
expressed in colon cancer tissues. After COX univariate regression analysis of
the genes using patient survival curves, VEGFA, E2F3,
RUNX3, and CDKN2A were identified since their expression
significantly reduced the patient’s overall survival (p
| Genes | Univariate analysis | Multivariate analysis | ||
| HR (95% CI) | p-value | HR (95% CI) | p-value | |
| BRCA1 | 0.613 (0.398–0.943) | 0.026 | 0.428 (0.265–0.691) | 0.001 |
| RUNX3 | 2.172 (1.445–3.263) | 0.602 (0.366–0.992) | 0.047 | |
| PPP1CA | 0.535 (0.292–0.979) | 0.043 | 0.889 (0.521–1.517) | 0.666 |
| VEGFA | 1.766 (1.183–2.634) | 0.005 | 1.215 (0.763–1.936) | 0.412 |
| TP53 | 0.568 (0.365–0.886) | 0.013 | 0.766 (0.489–1.201) | 0.245 |
| E2F3 | 1.652 (1.110–2.457) | 0.013 | 1.602 (1.024–2.507) | 0.039 |
| CDKN2A | 1.762 (1.178–2.635) | 0.006 | 1.990 (1.314–3.014) | 0.001 |
| CDK4 | 0.649 (0.437–0.966) | 0.006 | 0.632 (0.415–0.964) | 0.033 |
| CASP3 | 0.613 (0.410–0.916) | 0.017 | 0.609 (0.402–0.923) | 0.020 |
| CDK1 | 0.688 (0.461–1.027) | 0.067 | ||
| APP | 0.737 (0.467–1.161) | 0.188 | ||
| E2F1 | 0.697 (0.466–1.041) | 0.078 | ||
| CCND1 | 1.502 (0.987–2.285) | 0.057 | ||
| BAK1 | 0.719 (0.458–1.129) | 0.152 | ||
HR, hazard ratio.
As previously mentioned, the cytoplasm is where RP11-400N13.3 and RP11-197K6.1 inhibit miRNA. Therefore, the expression of E2F3 and CDKN2A in colon cancer tissues was searched for in the HPA database. The result showed that miR-125b-5p and miR-24-3p regulate CDKN2A in the microvesicles in colon cancer tissues, indicating that the two miRNAs may be affected by upstream factors in the cytoplasm (Fig. 6a,b). Analysis of clinical data for CDKN2A and the subcellular locations of two further miRNAs are also shown in Fig. 6c. The HPA database lacks E2F3 staining data in colon cancer tissues. Therefore, follow-up verification only discusses CDKN2A-related regulatory pathways.
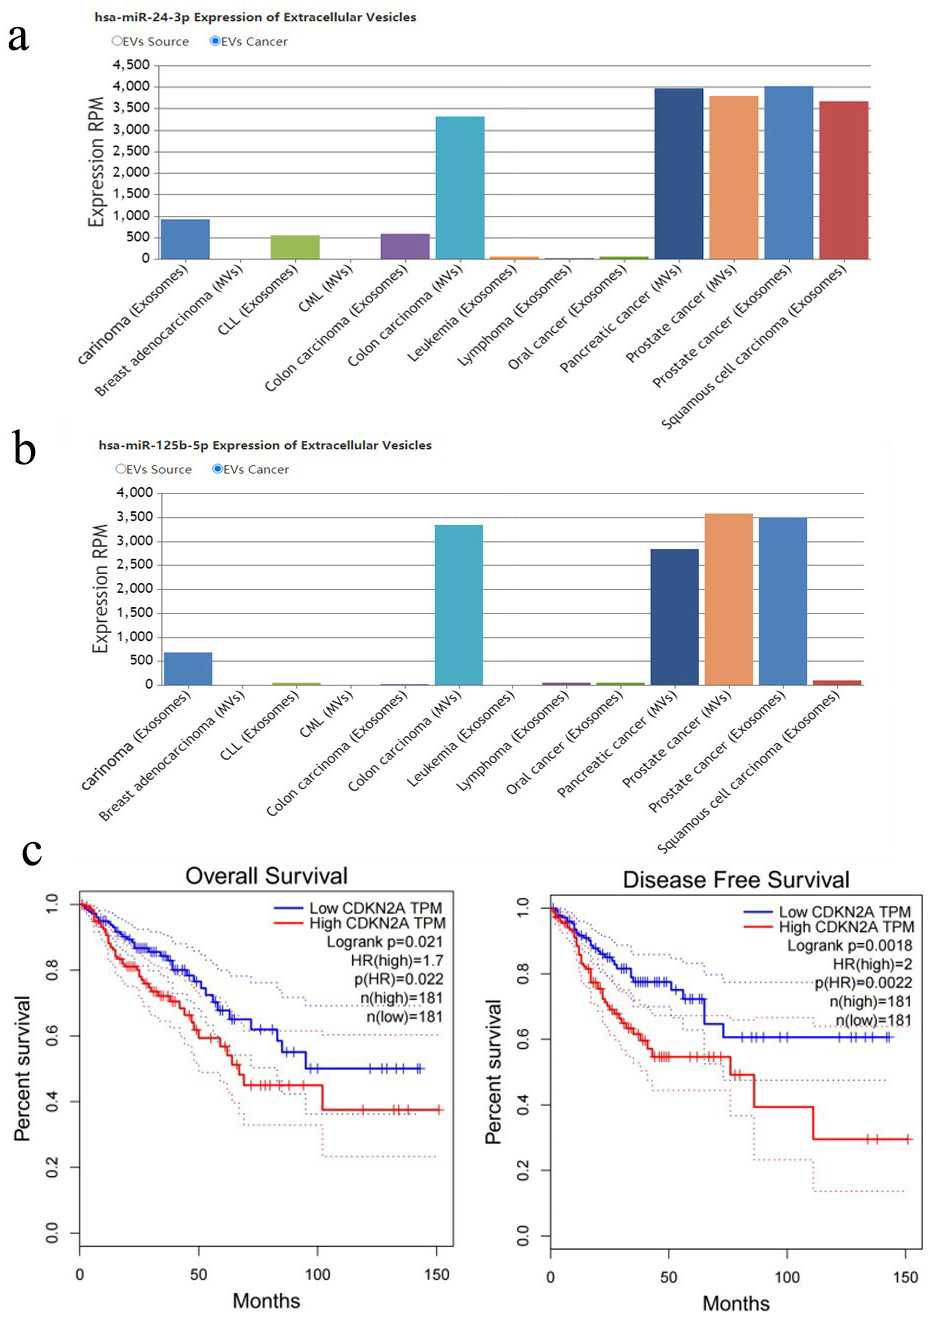 Fig. 6.
The correlation between the expression of the expression of miR-125b-5p and miR-24-3p and OS and DFS in colon cancer patients: (a) MiR-24-3p is highly expressed in cytoplasmic microvesicles in colon carcinoma. (b) MiR-125b-5p is highly expressed in cytoplasmic microvesicles in colon carcinoma. (c) Upregulated CDKN2A is associated with poor overall survival and prognostic survival of COAD patients. COAD, colon adenocarcinoma.
After submitting RP11-400N13.3 and RP11-197K6.1 sequences to RNAfold Web Server, results for MFE and thermodynamic ensemble prediction were obtained. The calculation results for RP11-197K6.1 illustrated that the thermodynamic ensemble free energy was –519.83 kcal/mol, the optimal secondary structure had MFE of –483.90 kcal/mol and the centroid secondary structure had MFE of –407.28 kcal/mol (Fig. 7b). The calculation results for RP11-400N13.3 highlighted that the free energy of the thermodynamic ensemble was –189.54 kcal/mol, the optimal secondary structure had a MFE of –179.10 kcal/mol and the centroid secondary structure had MFE of –134.90 kcal/mol (Fig. 7c). A high similarity between the centroid and MFE structure indicated a reliable prediction. Therefore, the centroid secondary structure was the optimal secondary structure for both RP11-197K6.1 and RP11-400N13.3. Then, we calculated the binding sites based on the optimal secondary structure of the two lncRNAs.
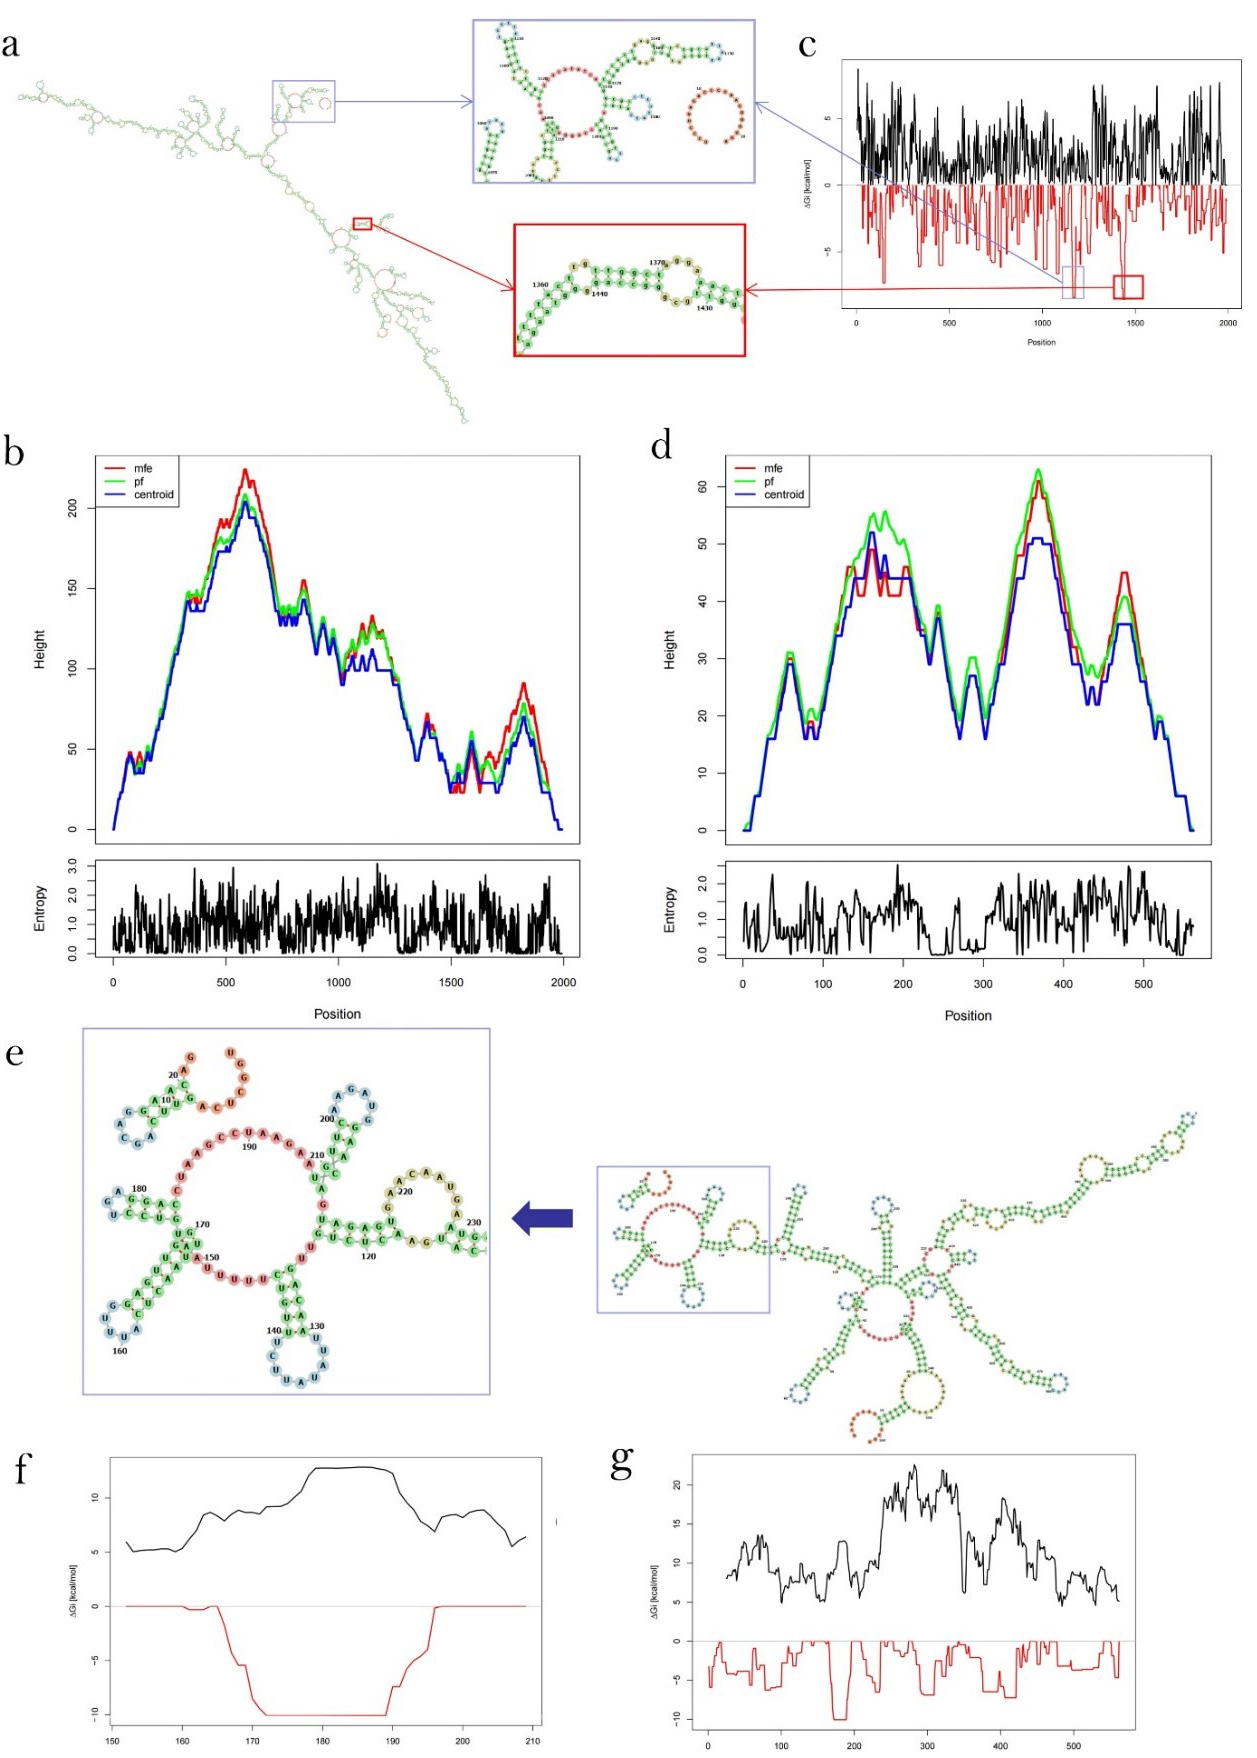 Fig. 7.
The formula representing the interaction free energy was computed and combined with the opening energy to determine the total blinding energies. (a) The optimal secondary structure for RP11-197K6.1 binding to miR-125b-5p; (b) Mountain plot representation of the MFE structure, the thermodynamic ensemble of RNA structures, and the centroid structure; (c) The plot shows the interaction free energy (RED) Gi, and the energy needed to open existing structures in the lncRNA sequence (BLACK); (d) Mountain plot representation of the MFE structure, the thermodynamic ensemble of RP11-400N13.3, and the centroid structure; (e) The optimal secondary structure for RP11-400N13.3 binding to miR-24-3p; (f) The target region of RP11-400N13.3 binding to miR-24-3p; (g) The plot shows the interaction free energy (RED) Gi, and the energy needed to open existing structures in RP11-400N13.3 sequence (BLACK).
The optimal secondary structure upon hybridization ranged from positions 1434 to 1442 in the RP11-197K6.1 sequence and from positions 2 to 12 in miR-125b-5p, while the total free energy of binding was –8.55 kcal/mol and the energy from duplex formation was –13.90 kcal/mol. The opening energy for RP11-197K6.1 and the miR-125b-5p sequence was 5.14 kcal/mol and 0.21 kcal/mol, respectively. It should be noted that positions 1434 to 1442 in the RP11-197K6.1 sequence did not contain hairpin loops and stems as the functional area of RNA binding, although positions 1161 to 1180 in the RP11-197K6.1 sequence had similarities with 1434 to 1442 in the interaction free energy and the energy needed to open the existing structure in the RP11-197K6.1 sequence. Positions 1161 to 1180 in the RP11-197K6.1 sequence had hairpin loops as the functional area for RNA binding and stable stems (Fig. 7a).
The optimal secondary structure upon hybridization ranged from positions 172 to 189 in the RP11-400N13.3 sequence and from positions 2 to 20 in miR-24-3p, while the total free energy of binding was –10.26 kcal/mol and the energy from duplex formation was –18.35 kcal/mol. The opening energy for the RP11-400N13.3 and miR-24-3p sequences was 5.23 kcal/mol and 2.85 kcal/mol, respectively (Fig. 7d–f). The positions 172 to 189 in the RP11-400N13.3 sequence contained hairpin loops and stems, which performed the specific function of RNA binding.
Screening of key lncRNAs in colon cancer and the functional prediction of RP11-400N13.3 and RP11-197K6.1 has been completed. In order to further verify our prediction results, a target gene silencing experiment was conducted by siRNA transfection. The fluorescence localization of the transfection experiment showed that the transfection efficiency exceeded 70% (Fig. 8a). Western blot analysis showed that after silencing RP11-197K6.1, the expression of CDKN2A was significantly lower than in the control group, indicating that the upregulation of lncRNA promoted CDKN2A expression in the colon cancer tissues (Fig. 8d).
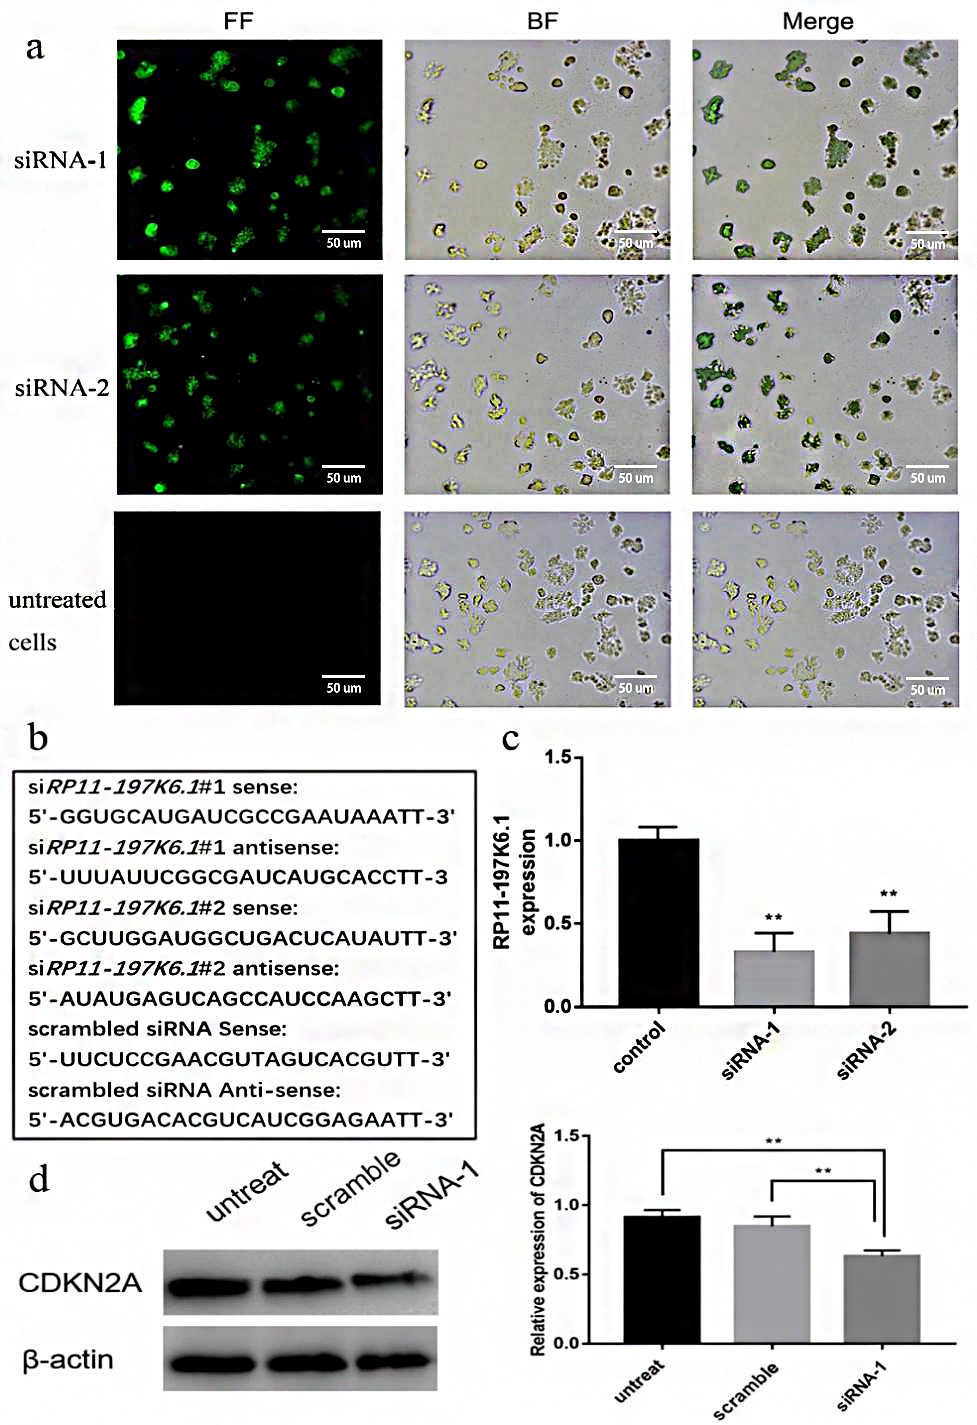 Fig. 8.
Experimental verification of RP11-197K6.1 regulation of
CDKN2A expression. (a) The overlap of the fluorescent field and the
blank field showed that most colon cancer cells were transfected by siRNA. (b)
The designed siRNA sequences. (c) The expression of lncRNA RP11-197K6.1 after
cell transfection. The data are presented as the mean
Previous studies demonstrated that cytoplasmic lncRNAs regulate cellular processes by modulating mRNA stability or translation [25]. In this study, two lncRNAs were identified: RP11-400N13.3 and RP11-197K6.1. They were differentially expressed in colon adenocarcinoma, and significantly associated with a poor survival rate in colon cancer patients. It was indicated that RP11-400N13.3 and RP11-197K6.1 acted as a sponge of miRNAs, and competitively regulate mRNA expression in colon cancer, according to the ceRNA hypothesis [26].
Based on the GEO dataset, we found that eight miRNA families were downregulated in colon cancer cells, which were probably responsible for the lncRNA functions. Among them, a reduction in miR-302a-3p, miR-302c-3p, miR-302d-3p, miR-125a-5p, and miR-363-3p was associated with poor overall survival of patients more than colon cancer [27, 28, 29, 30]. In addition, recent research suggests that changes in miR-125b-5p levels play an important role in the development of drug resistance in colon cancer cells. Overexpression of miR-125b-5p significantly sensitized cisplatin-resistant cells [31]. Increased expression of miR-24-3p predicts poor DFS and OS for colon adenocarcinoma patients, independently of currently used clinical pathological parameters for the prognosis of this human malignancy. Downregulation of miR-24-3p contributed to the development and progression of colon cancer and probably possesses a potential role in prognosis and therapy [11]. The above-mentioned studies indicate that these candidate miRNAs may be involved in colon cancer as tumor suppressors.
COX univariate regression and multivariate regression of the Kaplan–Meier curve
showed that some target genes significantly correlate to the survival of colon
cancer patients. However, the high expression of these genes did not relate to
all the risk factors connected to their death, given that some expressed genes
were protective factors for patients (hazard ratio
The miRcode web server identifies putative target sites based on seed complementarity and evolutionary conservation; however, the prediction results lacked specific elaboration on RNA structure and binding sites, whereby the functional characteristics of lncRNA compete with miRNA to bind to mRNA. Therefore, predicting the secondary structure of lncRNA is of great significance to verify its function. RNAfold Web Server was used to predict the optimal secondary structure of RNA and obtain the predicted RNA binding sites after submitting the predicted secondary structure. The binding energy was employed to evaluate the predicted interaction results. The results showed that the two lncRNAs were predicted to possess hairpins and stem-loop structures for binding with mRNA. Moreover, the predicted secondary structures both conform to the stability of the energy system and meet the theoretical requirements of RNA secondary functional structures. The characteristic areas of lncRNAs that act as miRNA sponges were predicted for further exploration of the functions of RP11-400N13.3 and RP11-197K6.1.
Thus, the verification process consisted of two parts. The first was regarding the cellular localization of the overall regulatory network, given that most of the lncRNAs in the cytoplasm play a role in the combination of competitive regulatory networks and microRNAs. The microRNAs inhibited by lncRNA binding and thereby indirectly affecting the mRNAs should be detected in the cytoplasm; the second relates to the verification of lncRNA and microRNA binding sites. The binding position of microRNA and lncRNA should meet the secondary structure of the lncRNA. The results of the biological experiments further prove that inhibiting the expression of RP11-197K6.1 resulted in the downregulation of the CDKN2A protein in colon cancer cells. It indicated that our screening methods for lncRNAs were highly accurate. However, whether the RP11-197K6.1/miR-125b-5p/CDKN2A axis has clinical value in the treatment of colon cancer still requires more in vivo experiments and further mechanism research.
Through our screening process, using colon adenocarcinoma as an example, we found that RP11-197K6.1 significantly reduced the overall survival rate of colon cancer patients by indirectly regulating the expression of the CDKN2A protein. Our work established a ceRNA network using bioinformatics followed by biological verification, to explore the potential mechanisms involved in recurrence and metastasis in colon cancer, and provided potential targets for drug development.
The datasets used and analyzed during the current study are available from the corresponding author on reasonable request.
XZ, JL and FM designed the research study. SX and YW performed the research. EX and LY provided help and advice acquired the data for the work. XZ and YW analyzed the data, and YW and XZ drafted the work wrote the manuscript. FM provided the project funding, accounted for all aspects of the work in ensuring that questions related to the accuracy or integrity of any part of the work, and final approved the version to be published. All authors contributed to editorial changes in the manuscript. All authors read and approved the final manuscript.
Not applicable.
We thank all members of the laboratory for useful discussions.
This research was funded by the National Natural Science Foundation of China for Young Scholars (No. 82103998); the Key Research and Development project of Liaoning (Liaoning R&D [2019]26).
The authors declare no conflict of interest.
Publisher’s Note: IMR Press stays neutral with regard to jurisdictional claims in published maps and institutional affiliations.