
- Academic Editor
†These authors contributed equally.
Objective: Heme oxygenase-1 (HO-1) is a protein involved in the
inflammatory response following ischemia-reperfusion injury (IRI). Evidence
suggests that pyroptosis plays an important role in IRI. However, the underlying
mechanism between HO-1 and pyroptosis in IRI requires further investigation.
Methods: Using the “two-cuff” method, a Sprague Dawley rat model of
liver transplantation (LT) was established using livers from donors after
circulatory death. An automatic biochemical analyzer was used to detect serum
alanine transaminase (ALT) and aspartate aminotransferase (AST) levels and
evaluate liver function. Paraffin sections of the rat liver were stained with
hematoxylin-eosin (HE) to observe the degree of pathological damage. An
enzyme-linked immunosorbent assay was used to detect serum levels of
interleukin (IL)-1
Liver diseases are often associated with multi-factorial liver insufficiency and
irreversible damage to organs, owing to which such diseases are often associated
with a high risk of mortality. Often, liver transplantation (LT) is the only
curative treatment for these diseases [1]. Donors after circulatory death (DCD)
have recently been the main source of organs. However, DCD livers are frequently
exposed to a long ischemic period [2]. This often results in hepatic
ischemia-reperfusion injury (IRI), which is the main risk factor for early
allograft dysfunction and acute or chronic rejection. Additionally, IRI is an
important factor in the shortage of donor organs [3]. Since the
mechanism underlying liver IRI is not well understood, it is necessary to study
the mechanism of graft IRI to improve the clinical outcomes of LT. A variety of
damage-associated molecular patterns (DAMPs) upregulate Kupffer cells (KCs) to
form several inflammatory complexes through different pattern recognition
receptors (PRRs) [4]. NLRP3 is one such PRR that induces the autohydrolysis of
two adjacent pro-caspase-1 molecules to produce caspase-1, an enzyme that cleaves
the precursors of interleukin (IL)-1
Heme oxygenase-1 (HO-1) is the stress-inducing, rate-limiting enzyme that catalyzes the oxidation degradation of heme into carbon monoxide, iron, and biliverdin [12]. Moreover, HO-1 has been demonstrated to have antioxidant and cytoprotective activity in various models of organ damage and diseases of the lung, kidneys, heart, and liver [13]. In addition, previous studies have shown that HO-1 plays a vital role in the pathogenesis of IRI by enhancing the ability of liver cells to resist oxidative stress and by stabilizing mitochondrial function. In patients undergoing orthotopic LT, pretreatment with adenovirus, which interferes with HO-1 expression, significantly improves IRI in Sprague Dawley (SD) rats and promotes the recovery of liver function [10, 14, 15].
Based on this evidence, the present study aims to determine whether HO-1 could alleviate hepatic IRI in DCD rats and improve liver function by inhibiting hepatocyte pyroptosis.
This study purchased 208 male SD rats (150–180 g; 5–6 weeks old; SPF grade) from Beijing HuaFuKang Bioscience Company (Beijing, China). The animal protocol was approved by the Institutional Animal Care and Use Committee of Kunming Medical University (Kunming, China; KMMU2020189). All animal experiments were performed in compliance with the National Institute of Health guidelines for animal experimentation.
The SD rat LT model was established using the “two-cuff” technique reported by Kamada et al. [16], which has been detailed in the Supplementary Materials. The study has been reported per the ARRIVE guidelines [17].
To explore the transfection efficiency of adeno-associated virus (AAV), 25 SD
rats were randomly allocated into five groups: shRNA-NC, shRNA-HO-1, AAV-NC,
AAV-HO-1, or normal groups. Rats in all groups were injected with 200 µL of
AAV titer (2.5
Of the 208 rats, 88 were injected with AAV via the tail vein and were randomly divided into the following six groups: sham (n = 8, only laparotomy); DCD (n = 16, donors were injected with normal saline); DCD + shRNA-NC (n = 16, donors underwent transduction with HO-1-shRNA empty-loaded virus); DCD + shRNA-HO-1 (n = 16, donors underwent transduction with HO-1-shRNA-AAV); DCD + AAV-NC (n = 16, donors underwent transduction with HO-1-overexpressing empty-loaded virus); or DCD + AAV-HO-1 (n = 16, donors underwent transduction with HO-1-overexpressing AAV).
In addition, to explore whether HO-1 induces pyroptosis in hepatic IRI and whether this effect is observed in a time-dependent manner, 54 rats were randomly allocated into five groups: normal group (n = 6) and hepatic ischemia-reperfusion (IR) groups with reperfusion for 6 h (DCD + IR6h), 24 h (DCD + IR24h), 72 h (DCD + IR72h), or 168 h (DCD + IR168h) (each, n = 12).
Furthermore, 66 SD rats were randomly divided into the following six groups for assessing HO-1-related cell pyroptosis at 6 h (n = 12, i.e., 6 pairs). The groups were as follows: sham (n = 6, only underwent laparotomy), DCD (n = 12, the donor was injected with normal saline via the tail vein), DCD + shRNA-NC (n = 12, donor underwent transduction with HO-1 shRNA AAV via the tail vein); DCD + shRNA-HO-1 (n = 12, donor underwent transduction with HO-1 shRNA AAV via the tail vein); DCD + AAV-NC (n = 12, donor underwent transduction with HO-1-overexpressing AAV empty virus via the tail vein); and DCD + AAV-HO-1 (n = 12, donor underwent transduction with HO-1-overexpressing AAV via the tail vein).
The serum alanine transaminase (ALT) and aspartate aminotransferase (AST) levels
in SD rats were measured using a fully automatic biochemical analyzer (BIO-RAD,
Hercules, CA, USA), expressed in U/L. In addition, serum IL-1
Initially, 50 µg of fresh SD rat liver tissue was weighed and then homogenized and filtered into a cell suspension. This suspension was centrifuged, and then the obtained pellet was mixed with an appropriate volume of DCFH-DA (S0033S, Beyotime Biotechnology, Shanghai, China), which was diluted with serum-free culture medium (1:1000) to make a final concentration of 10 µmol/L. Subsequently, the medium was incubated at 37 °C for 20 min. The cells were then washed thrice with a serum-free cell culture medium to remove the DCFH-DA that had not entered the cells. The ROS-positive control group was treated with Rosup for 20–30 min. Then, flow cytometry (excitation wavelength: 488 nm, emission wavelength: 525 nm) was used to detect the fluorescence intensity before and after stimulation.
For histological analyses, the liver tissues of rats were fixed with 4%
paraformaldehyde for 48 h. The fixed liver samples were then dehydrated, embedded
in paraffin, and cut into
In addition, fresh liver tissues were embedded in optimum cutting temperature compound, frozen, sectioned, and observed under an inverted fluorescence microscope.
For immunohistochemical analyses, liver tissues were embedded in paraffin and sliced, as mentioned above. The sections obtained were incubated at 65 ℃ for 20 min and were deparaffinized using a gradient of xylene and ethanol solution, followed by treatment with 0.01 mol/L (pH 6.0) citrate buffer for antigenic repair. Subsequently, the sections were treated with 3% hydrogen peroxide to quench endogenous peroxidase activity and, after 15 min, were blocked with 5% bovine serum albumin for 30 min. The sections were then incubated with NLRP3 antibody (dilution ratio: 1:200; 19771-1-AP, ProteinTech, Wuhan, Hubei, China) overnight at 4 °C. Following this, the sections were treated with secondary antibody for 50 min and incubated with DAB. The sections obtained were observed under an optical microscope (Olympus, cymml-3ptxcj-004, Hamburg, Germany). All images shown in the results represent at least three images of each liver. The Liver Suzuki scoring standard was used [18, 19]. ImageJ software (Rasband WS, ImageJ, V 1.8.0, National Institutes of Health, Bethesda, MD, USA) was used to quantify the stained areas in sections.
As reported previously [20], the membrane was blocked with 5% skim milk for 2 h and then incubated with rabbit anti-HO-1 (dilution ratio 1:1000; E6Z5G, Cell Signaling Technology, Danvers, MA, USA), anti-caspase-1 (dilution ratio 1:1000; EPR19672, Abcam, Cambridge, UK), anti-GSDMD (dilution ratio 1:1000; EPR20859, Abcam), and NLRP3 (dilution ratio 1:1000; 19771-1-AP, Proteintech) overnight at 4 °C. After washing thrice with Tris-Buffered Salineand Tween 20 (TBST), the membrane was incubated with IgG antibody at room temperature for 2 h. The membrane was completely covered with the developing liquid and observed using the gel imaging system (Monad, GD50202, Suzhou, China).
RT-qPCR was performed as described previously using the SuperReal PreMix Plus
(SYBR Green, Roche, Mannheim, Germany) kit and the Mx3005 P Real-Time PCR System
(Agilent, Santa Clara, CA, USA) [21]. Briefly, total RNA from liver tissues was
extracted using TRIzol (Invitrogen, Waltham, MA, USA). cDNA was extracted using
SureScript™ First-Strand cDNA Synthesis Kit (GeneCopoeia,
Guangzhou, China). mRNAs amplification was performed using the following specific
primers: HO-1 (102 bp) forward 5
Quantitative data are presented as mean
The fluorescence intensity in the liver tissue was assessed 21 days after AAV transduction (Fig. 1A–D). HO-1 transcription levels were significantly lower in the shRNA-HO-1 group than in the shRNA-NC group. The gene transcription level was higher in the AAV-HO-1 group than in the AAV-NC (normal control), shRNA-HO-1, shRNA-NC, and normal groups (Fig. 1E). The fluorescence intensity and HO-1 mRNA transcription levels in the four DCD groups are shown in Table 1 and at four-time points are shown in Table 2.
 Fig. 1.
Efficiency of AAV transfection and HO-1 mRNA transcription level
in rat liver tissue. (A) AAV2/9-EGFP interference control. 400
| Characteristic | DCD + shRNA-NC | DCD + shRNA-HO-1 | DCD + AAV-NC | DCD + AAV-HO-1 |
| HO-1 | ↑/# | ↓ | ↑/# | ↑/*#& |
| p22 | ↑/# | ↑/* | ↑/# | ↓/#& |
| cleaved-N-GSDMD | ↑/# | ↑/* | ↑/# | ↓/#& |
| NLRP3 | ↑/#& | ↓/* | ↓/# | ↓/*& |
| ROS | ↑/# | ↑/* | ↑/# | ↓/*#& |
| ALT | ↑/# | ↑/* | ↑/# | ↓/*#& |
| AST | ↑/# | ↑/* | ↑/# | ↓/*#& |
| IL-1 |
↑/# | ↑/* | ↑/# | ↓/*#& |
| IL-18 | ↑/# | ↑/* | ↑/# | ↓/*#& |
*, compared with DCD group, p
| Characteristic | 6 h | 24 h | 72 h | 168 h |
| HO-1 | ↑/* | ↑/* | ↑/*# | ↑/# |
| p22 | ↑/* | ↑/* | ↑/*# | ↑/# |
| cleaved-N-GSDMD | ↑/* | ↑/* | ↑/*# | ↑/# |
| NLRP3 | ↑/* | ↑/*# | ↑/*# | ↑/*# |
| ROS | ↑/* | ↑/* | ↑/*# | ↑/*# |
| ALT | ↑/* | ↑/* | ↑/*# | ↑/*# |
| AST | ↑/* | ↑/* | ↑/*# | ↑/*# |
| IL-1 |
↑/* | ↑/* | ↑/*# | ↑/*# |
| IL-18 | ↑/* | ↑/* | ↑/*# | ↑/*# |
*, compared with normal group, p
The overall comparison result was
The effects of ischemia on the transplanted liver were assessed at different
durations of reperfusion (DCD + IR6h, DCD + IR24h, DCD + IR72h, and DCD + IR168h
groups). HE staining revealed rapid progression of tissue damage in the DCD +
IR6h group, along with obvious necrosis. In the DCD + IR24h group, the liver
tissue damage was greater than in the DCD + IR6h group, with extensive necrosis.
However, in the DCD + IR72h and DCD + IR168h groups, necrosis was not as obvious
as in the DCD + IR24h group, and the degree of damage gradually decreased.
Particularly, the normal lobules had been destructured, and the sinus space was
still wider than normal. Compared with the normal group, the DCD + IR6h, DCD +
IR24h, DCD + IR72h, and DCD + IR168h groups demonstrated significantly greater
liver tissue damage (p
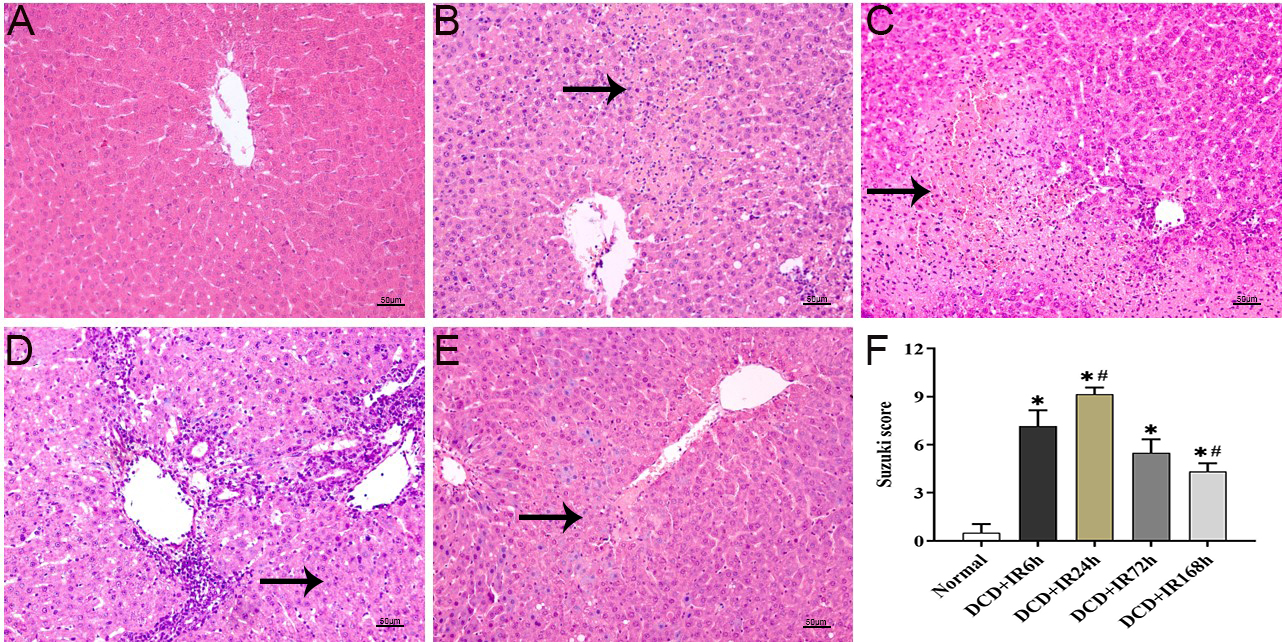 Fig. 2.
HE staining and Suzuki score of the donor livers after liver
transplantation. (A–E) HE results of liver tissue after LT, (A) normal, (B) DCD
+ IR6h, (C) DCD + IR24h, (D) DCD + IR72h, and (E) DCD + IR168h. (F) The histogram
based on the Suzuki score, *, p
Over time, the ROS levels in the liver tissues of each group decreased after
reperfusion. Compared with the normal group, the DCD + IR6h, DCD + IR24h, DCD +
IR72h, and DCD + IR168h groups had significantly lower ROS levels (p
 Fig. 3.
ROS level changes after LT. (A–E) After DCD LT, the donor
liver of ischemia was followed by different durations of reperfusion for 6 h, 24
h, 72 h, and 168 h. (F) Flow cytometry was used to detect the expression level of
ROS in the liver tissue. *, compared with normal group, p
The liver function and cytokine levels would change accordingly after
reperfusion. The results revealed that ALT and AST levels increased significantly
at 6 and 24 h but decreased at 72 and 168 h. Compared with the normal group, ALT
and AST levels were significantly different in the DCD + IR6h, DCD + IR24h, DCD +
IR72h, and DCD + IR168h groups (p
 Fig. 4.
Liver function and protein changes after LT. (A) Biochemical
analysis results of ALT. (B) Biochemical analysis results of AST. (C) The level
of IL-1
Over time, IL-1
Over time, proteins showed a trend with the prolongation of the postoperative
reperfusion time after LT. Results of western blotting revealed that (Fig. 4E)
HO-1 expression was significantly increased in the DCD + IR6h group, but it
decreased in the other long-term groups. Moreover, HO-1 expression in the DCD +
IR6h group was significantly different from the normal group, DCD + IR72h, and
DCD + IR168h groups (p
The p22 of pro-caspase1 was significantly increased in the short term but
gradually decreased over the long term. Compared with the normal group, p22
expression in the DCD + IR6h, DCD + IR24h, and DCD + IR72h groups was
significantly different (p
The expression of cleaved-N-GSDMD was the highest in the short-term groups but
decreased in the long-term groups. Compared with the normal group, the expression
of cleaved-N-GSDMD in the DCD + IR6h, DCD + IR24h, and DCD + IR72h groups were
significantly different (p
Immunohistochemistry revealed that NLRP3 was not expressed in the normal group.
Notably, the DCD + IR6h and DCD + IR24h groups demonstrated extensive necrosis.
However, NLRP3 expression in the DCD + IR6h group was the lowest among the other
groups. Over time, NLRP3 expression increased in the short term but decreased
over the long term. Compared with the DCD + IR6h group, the normal group, DCD +
IR24h, DCD + IR72h, and DCD + IR168h groups differed significantly in terms of
NLRP3 expression (p
 Fig. 5.
Change in NLRP3 after LT. (A–E) Immunohistochemistry
of NLRP3 results of liver tissue after LT. (A) Normal, (B) DCD + IR6h, (C) DCD +
IR24h, (D) DCD + IR72h and (E) DCD + IR168h. (F) The expression level of NLRP3 in
the liver tissue. *, compared with normal, p
Based on previous experiments, the time point of reperfusion was chosen as 6 h
in this study. After 21 days of AAV pretreatment, the donor’s liver was
reperfused for 6 h after DCD LT. Compared with the control group, the DCD +
shRNA-HO-1 group exhibited greater damage in the liver tissue, with larger areas
of necrosis, severe congestion, and sinus space. The necrotic area in the DCD +
AAV-HO-1 group was significantly reduced, the hepatic cord was intact, the sinus
space was approximately the same as the sham group, and the degree of congestion
was significantly lower. Compared with the DCD group, the sham, DCD + shRNA-HO-1,
and DCD + AAV-HO-1 groups showed statistically significant differences in the
degree of damage (p
 Fig. 6.
HE staining results and Suzuki score of different groups after
AAV pretreatment. (A–F) Postoperative liver tissue HE staining results. (A)
Sham, (B) DCD, (C) DCD + shRNA-NC, (D) DCD + shRNA-HO-1, (E) DCD + AAV-NC, and
(F) DCD + AAV-HO-1. (G) A histogram based on the Suzuki score. *, compared with
the DCD group, p
The hepatic ROS level in the DCD + shRNA-HO-1 group was significantly higher
than that in other groups but was significantly lower than the DCD + AAV-HO-1
group. The ROS level differed significantly between the DCD + shRNA-HO-1 group
and the DCD, DCD + shRNA-NC, DCD + AAV-NC, and DCD + AAV-HO-1 groups (p
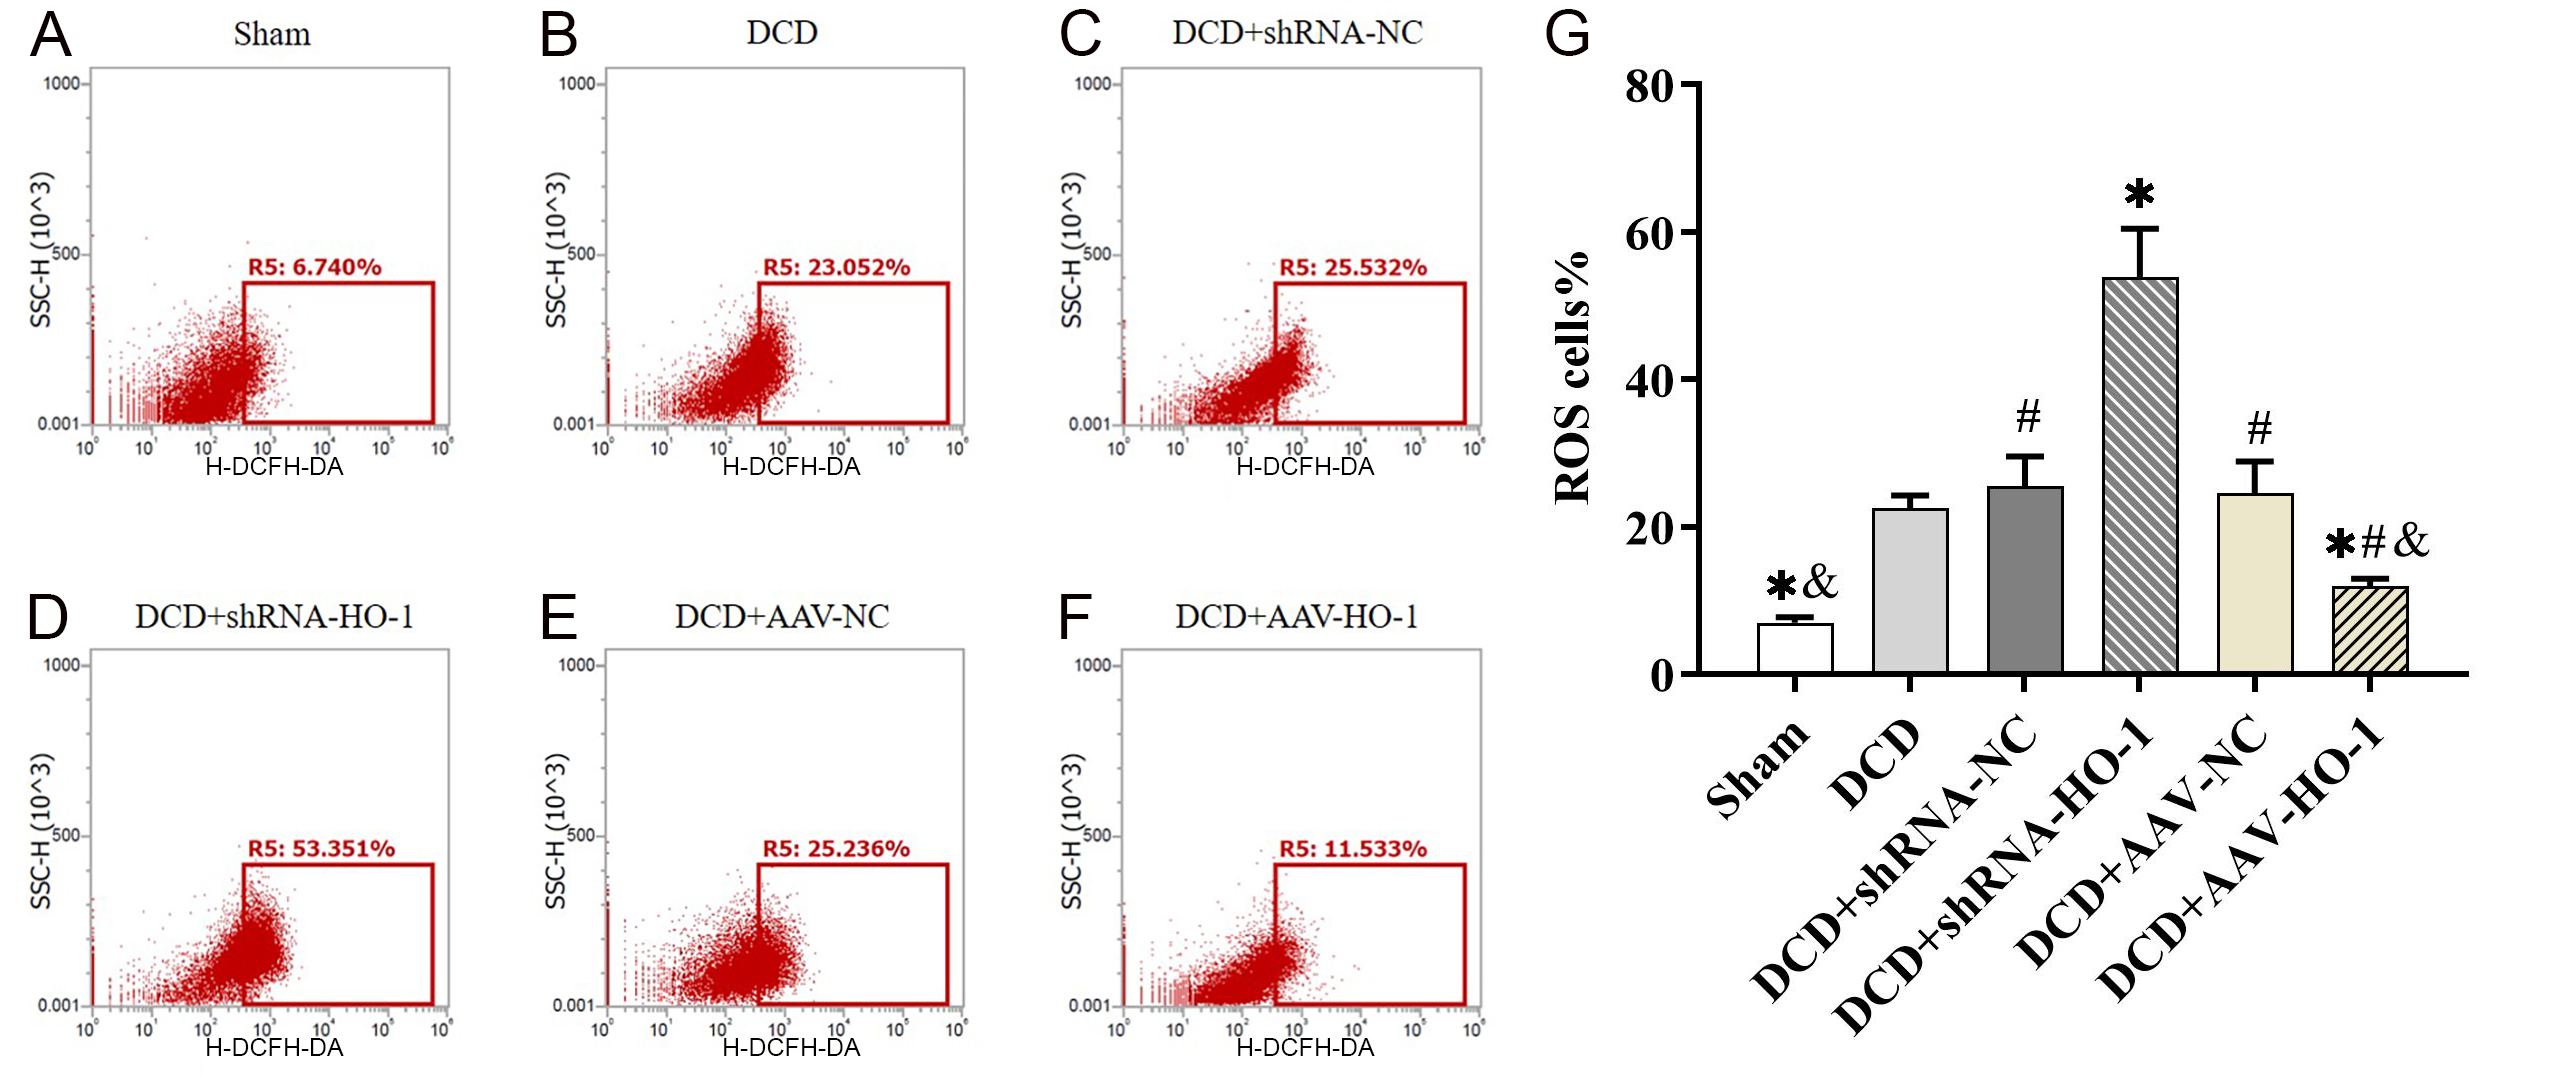 Fig. 7.
After AAV pretreatment, the donor’s liver was reperfused for 6 h
after DCD LT and the level of ROS was measured in liver tissues. *, compared with
DCD group, p
Following DCD LT, the donor liver was pretreated with AAV for 21 days and was then reperfused for 6 h. Following this, serum ALT and AST levels in the DCD + shRNA-HO-1 group increased significantly. However, these levels in the DCD + AAV-HO-1 group showed a downward trend compared with those in the control, but they were still higher than those in the sham group.
Compared with the DCD + shRNA-HO-1 group, the DCD, DCD + shRNA-NC, DCD + AAV-NC,
and DCD + AAV-HO-1 groups had significantly different ALT levels (p
 Fig. 8.
With AAV pretreatment, the donor liver was reperfused for 6
hours after DCD LT. (A) Biochemical analysis results of ALT. (B) Biochemical
analysis results of AST. (C) The expression level of IL-1
Compared with the DCD + shRNA-HO-1 group, the DCD, DCD + shRNA-NC, DCD + AAV-NC,
and DCD + AAV-HO-1 groups had significantly different AST levels (p
The hepatic levels of IL-1
Compared with the DCD + shRNA-HO-1 group, the IL-1
Compared with the IL-18 level in the DCD + shRNA-HO-1 group, the DCD, DCD +
shRNA-NC, DCD + AAV-NC, and DCD + AAV-HO-1 groups was significantly different
(p
The HO-1 mRNA level in the transplanted liver in each group was in line with our
expectations. The mRNA transcription level of the HO-1 interference expression
group was significantly lower than that of the control but was slightly higher
than that of the sham group. In contrast, the mRNA transcription level of the DCD
+ AAV-HO-1 was significantly higher. The mRNA transcription levels in the DCD,
DCD + shRNA-NC, DCD + shRNA-HO-1, DCD + AAV-NC, and DCD + AAV-HO-1 groups were
significantly different (p
The expression of p22 of pro-caspase1 was increased significantly in the DCD +
shRNA-HO-1 group but was decreased in the DCD + AAV-HO-1 group. In addition, the
expression was significantly different in the DCD + shRNA-HO-1 group compared
with the DCD, DCD + shRNA-NC, DCD + AAV-NC, and DCD + AAV-HO-1 groups (p
The trend in the expression of spliced cleaved-N-GSDMD of full-GSDMD was similar
to that of p22. The expression of spliced cleaved-N-GSDMD was increased
significantly in the DCD + shRNA-HO-1 group and was decreased significantly in
the DCD + AAV-HO-1 group. Compared with spliced cleaved-N-GSDMD expression in the
DCD + shRNA-HO-1 group, the DCD, DCD + shRNA-NC, DCD + AAV-NC, and DCD + AAV-HO-1
groups was significantly different (p
In addition, treatment altering the expression of HO-1 immediately affected the NLRP3 level, which in turn affected the level and activation of caspase-1 and GSDMD.
Immunohistochemical analysis revealed that NLRP3 expression in the DCD +
shRNA-HO-1 group was significantly decreased; the group also had large areas of
tissue necrosis. The expression differed significantly among DCD, DCD + shRNA-NC,
and DCD + AAV-NC groups (p
 Fig. 9.
Following AAV pretreatment, the donor liver was reperfused for 6
hours after DCD LT, and the expression of NLRP3 was observed. (A–F)
Immunohistochemistry results of NLRP3 coloration in each group (200
LT is reportedly the most effective curative treatment for end-stage liver disease [22]. However, in cases of DCD, it is essential to optimize graft function and reduce IRI to eventually increase donor liver availability [23]. HO-1 is the rate-limiting enzyme of heme metabolism, and its high expression is currently recognized as a key cytoprotective mechanism against inflammation, hyperthermia, and IRI [24]. In LT involving DCD, the expression of HO-1 was correlated with the ischemia-reperfusion time. Moreover, HO-1 expression increased significantly in the DCD + IR6h group and gradually decreased. This trend coincided with the most severe early stress response of IRI, which additionally correlated with the ROS level. These findings are consistent with those of previous studies [10]. In the present study, HO-1 expression was significantly increased at 6 h and 24 h, indicating that DCD significantly induces HO-1 expression after IRI, which may have the potential to resist oxidative stress damage. However, the recent high expression of HO-1 did not immediately relieve liver damage. As shown in Fig. 2, HE staining revealed extensive necrosis in the DCD + IR6h group, with the most severe damage being observed in the DCD + IR24h group. According to the Suzuki score, damage at 78 and 168 h was significantly lower than at 6 and 24 h. In addition, serum ALT and AST levels indicated that liver damage in the early stages was severe, with that at 24 h being slightly lower than at 6 h, which then decreased gradually. We speculate in the early stages, although HO-1 was highly expressed during IRI and LT, liver damage occurred before this expression. Therefore, high HO-1 expression could only be seen as a follow-up response to oxidative stress and could play a role in anti-inflammatory and anti-injury effects in the future. The gradual reduction in the long-term damage may be because the high expression of HO-1 in the early stage exerted a long-term effect, which enhanced the tolerance of the undamaged liver tissue to oxidative stress and inhibited the combination of DAMPs and PRR. This subsequently inhibited the inflammatory response and reduced the long-term damage to liver cells, which was consistent with previous findings [14].
To further explain the cause of hepatic injury, we tested the level of NLRP3, cleaved caspase-1 (p22/p20), and cleaved N-GSDMD in the donor’s liver at each IRI time point. The results showed that the expression of p22 and cleaved N-GSDMD was the highest at 6 and 24 h, indicating that pyroptosis occurred when the donor’s liver underwent IRI. The degree of pyroptosis was the highest at the beginning of IRI and gradually reduced. However, NLRP3, which is directly related to pro-caspase-1 activation, was found to have the opposite effect. In addition, immunohistochemistry results revealed that the NLRP3 level in the IR6h group was the lowest, inconsistent with the most severe scorch death in the IR6h group. Burdette et al. [25] have revealed that NLRP3 is expressed in the cytoplasm and mediates pro-caspase-1 splicing activation and functioning. Therefore, we speculated that the inconsistent expression trend of NLRP3 was due to severe liver damage in the IR6h group. After cell rupture, NLRP3 is completely released and cannot be assessed by immunohistochemistry. This speculation was consistent with the most severe pyroptosis observed in the IR6h group.
We additionally tested IL-1
RT-qPCR detected the overexpression of HO-1, HO-1 shRNA recombinant AAV and the respective blank control viral vectors were transduction into normal SD rats. This showed that the intervention effect of HO-1 overexpression and HO-1 shRNA recombinant AAV was statistically significant compared with no intervention in the blank group. HO-1 overexpression was positively correlated with the survival of SD rats after DCD LT.
RT-qPCR and western blotting revealed that the expression of HO-1 was in line with expectations. When HO-1 was overexpressed, the expression of p22 and cleaved N-GSDMD was significantly downregulated. However, when HO-1 expression was downregulated, the levels of p22 and cleaved N-GSDMD increased significantly. GSDMD-N and -C mediate cell perforation and rupture causes caspase-1-dependent cell pyroptosis [9]. Accordingly, under high HO-1 expression in the donor’s liver, pyroptosis was inhibited when the DCD underwent ischemia-reperfusion after LT. This result was consistent with the results of HE staining of the transplanted liver. In addition, HE staining showed that when HO-1 was overexpressed, tissue cell damage was minimal, with mild cell destruction and lysis. However, inhibition of HO-1 expression resulted in aggravation of liver cell damage and the necrotic area compared with the control conditions. In addition, cell lysis was severe, with no intact and normal hepatic cord or hepatic sinusoid structure. According to AST and ALT levels, the overexpression of HO-1 could reduce the level of liver damage after LT from DCD. This proves that the degree of damage after LT was significantly alleviated by HO-1 overexpression in the donors. In addition, when HO-1 expression was inhibited, NLRP3 levels were significantly lower than in the donor’s liver with HO-1 overexpression. This effect could be attributed to severe liver tissue necrosis observed when HO-1 expression is inhibited, which decreases immunohistochemical detection of NLRP3. Regarding the HO-1 overexpression group, as the tissue structure was intact and immunohistochemical results were normal, these data are reliable. Compared with the control group, it was significantly lower, indicating that NLRP3 activation was inhibited at that time.
In the early stage of IRI after LT, HO-1 expression was increased, but this was only a follow-up response to oxidative stress and could not immediately alleviate liver injury. However, the early-stage high expression of HO-1 played a role in the recovery of long-term liver function. In the IR6h group, oxidative stress was the most severe among all groups, and early pyroptosis was likely to be one of the main causes of liver damage. Therefore, inhibiting early liver injury could be the key to promoting the recovery of liver function after transplant.
Survival analysis revealed significant differences in at least two groups.
Subsequent pairwise comparisons demonstrated that the sham (14.00
The study selected a cardiac death rat donor model to simulate the acquisition and preservation of a clinically transplanted liver, and the study was conducted by interfering with the expression of HO-1 in the donor liver. The results showed that HO-1 could promote ischemia reperfusion recovery in SD rats after DCD liver transplantation; HO-1 overexpression inhibited hepatocyte pyroptosis, thereby alleviating ischemia-reperfusion injury after liver transplantation from a cardiac death SD rat donor.
AAV, adeno-associated virus; DAMPs, damage-associated molecular patterns; DCD, donors after circulatory death; GSDMD, gasdermin D; HO-1, heme oxygenase-1; IR, ischemia-reperfusion; IRI, ischemia-reperfusion injury; LT, liver transplantation; AST, aminotransferase; PRRs, pattern recognition receptors; SD, Sprague Dawley.
The datasets used and/or analysed during the current study are available from the corresponding author on reasonable request.
YM, ZZ and HH designed the research study. TW and YF designed and conducted all experiments, provided all images, drafted the work and reviewed it critically for important intellectual content. XZ, YY, LJ, ZL Contributed acquisition, analysis, and interpretation of data for the work. All authors have read and agreed to the published version of the manuscript. All authors have participated sufficiently in the work and agreed to be accountable for all aspects of the work.
This study was approved by the Institutional Animal Care and Use Committee of the First Affiliated Hospital of Kunming Medical University (KMMU2020189).
Not applicable.
The study was financially supported by a grant from National Natural Science Foundation of China (No. 81960123 and 81760124). The funding body had no role in study design, data collection, analysis, and interpretation of data, and writing the manuscript.
The authors declare no conflict of interest.
Publisher’s Note: IMR Press stays neutral with regard to jurisdictional claims in published maps and institutional affiliations.