
- Academic Editor
†These authors contributed equally.
Background: Over the past few years, there have been many reports on the abnormal expression and functional relevance of long non-coding RNAs (lncRNAs) in tumors. The role played by lncRNAs in epithelial ovarian carcinoma (EOC) remains poorly understood, however the goal of the present work was to study molecular mechanisms that underlie involvement of prostate androgen-regulated transcript 1 (PART1) lncRNA in EOC development. Methods: A total of 25 tumor and 17 normal specimens were obtained from women undergoing surgery between 2015 and 2019 in the Second Affiliated Hospital, Nanjing Medical University. Expression levels for PART1 in EOC tissue and EOC cell lines were assessed using qRT-PCR. Assays for CCK-8, trans-well, colony forming and western blotting were used to investigate PART1, miR-150-5p and MYB (MYB proto-oncogene) for their invovement in EOC cell proliferation, migration and invasion. Luciferase reporter gene assay was also performed to investigate biological functions of PART1, miR-150-5p and MYB in EOC, and an animal xenograft model was employed to test tumorigenicity. Results: PART1 expression was increased in EOC relative to normal cells and correlated with EOC cell proliferation, migration and invasion. PART1 can sponge miR-150, thereby inhibiting growth of EOC by targeting MYB. The xenograft mouse model revealed that PART1 can regulate tumorigenesis in vivo. Conclusions: The PART1/miR-150/MYB axis is involved in EOC pathogenesis and could represent a new target to use in diagnosis and therapy.
Epithelial ovarian carcinoma (EOC) accounts for a large proportion of gynecologic malignancies, with an annual incidence of 3–12 new cases per 100,000 women [1, 2]. The most common treatment for EOC is maximum surgical cytoreduction combined with platinum chemotherapy. Despite the advances in surgery and chemoradiotherapy, 5-year survival rates for EOC patients are still poor due to the relatively late diagnosis of this disease and to acquired drug resistance [3, 4, 5, 6]. It is therefore crucial to identify the molecular mechanism associated with the development of EOC.
A large-scale human genomic sequencing study showed that just 2% is transcribed
into RNA that codes for protein. Most of the remaining RNA transcripts are
non-coding (ncRNA) [7]. Long ncRNA (lncRNA) is defined as non-coding transcript
Here, we identified PART1/miR-150-5p/MYB axis in EOCs was identified, as well as the presence of a ceRNA mechanism. This axis was shown to have a major impact on EOC progression.
Tumor (n = 25) and normal (n = 17) tissue were obtained from women undergoing surgery for EOC between 2015 and 2019 at our institution. None had received preoperative chemoradiotherapy. Histopathology was used to confirm specimens prior to storage in a liquid nitrogen tank at –196 °C until the extraction of RNA. All patients gave informed consent. The major clinicopathological features of cohort are indicated below (Table 1). For the relationship between MYB, miR-150-5p and clinicopathological features, see Supplementary Tables 1,2. Ethical approval for the study was given by the host institute (No. 2017AE02133, approval date December 3, 2017) and the Declaration of Helsinki guidelines were followed.
| Variables | Cases (25) | LncRNA PART1 expressional level | p | ||
| Low/Negative | High | ||||
| Age (years) | |||||
| 11 | 6 | 5 | |||
| 14 | 6 | 8 | |||
| FIGO stage | |||||
| I–II | 10 | 8 | 2 | ||
| III–IV | 15 | 4 | 11 | ||
| Histological grade | |||||
| 1–2 | 13 | 9 | 4 | ||
| 3 | 12 | 3 | 9 | ||
FIGO stage, International Federation of Gynecology and Obstetrics stage.
The human cell lines studied here were provided by the Chinese Science Academy
(Shanghai, China) and Zhong Qiao Xin Zhou (Shanghai, China). These consisted of
normal ovarian surface epithelial cells (IOSE80, ZQ0721, Zhong Qiao Xin Zhou,
Shanghai, China) and three EOC cell lines ((A2780, ZQ0486, Zhong Qiao Xin Zhou,
Shanghai, China), (SKOV3, TCHu185, Chinese Science Academy, Shanghai, China) and
(OVCAR3, TCHu228, Chinese Science Academy, Shanghai, China)). SKOV3 was grown in
McCoy’s 5A medium (Gibco, New York, USA) with 10% fetal bovine serum (FBS), while
remaining cell lines were grown in Dulbecco’s modified Eagle medium (DMEM) with
high-glucose and 10% FBS. Cells were kept at 37 °C in a humidified
incubator with 5% CO
RNA was extracted with Trizol (Invitrogen, Carlsbad, USA) and cDNA for qPCR was prepared
using HiScript II SuperMix (Vazyme, Nanjing, China). qRT-PCR (Q6, Life) was carried out with
SYBR® Green PCR Master Mix (Applied Biosystems, Waltham, USA) and primer
sequences as follow: PART1 forward 5
StarBase v3.0 (https://starbase.sysu.edu.cn/index.php) and miRcode (http://www.mircode.org/index.php) were employed to predict potential miRNAs that bind to PART1 [23, 24]. StarBase v3.0 was also used to identify candidate mRNAs that bind to miR-150-5p. This software integrates 5 different miRNA prediction softwares (TargetScan, PicTar, microT, miRmap, miRanda/mirSVR). The GEPIA database was used to analyze the expression levels of the target genes for miR-150-5p [25].
PART1-shRNA-lentiviruses (sequence: sh1:GAAC TCAATTACGACTACATA; sh2:CCAGAUGAGACUAC GAUAATT; sh3:GAACAGAGUUGACUUUGUGTT; sh4:GCAAAGUAUCCAAGACCAATT) used for the in vivo experiments were provided by GenePharma (Shanghai, China), as were the siRNAs that target PART1. Transfection of cells was performed with Lipofectamine 3000 (Invitrogen, Carlsbad, USA). MiR-150-5p inhibitors (sequence: CACUGGUACAAGGGUUGGGAGA) were also from GenePharma. Triplicate experiments were performed throughout.
CCK-8 assay was used to quantify the proliferation rate of cells. Following
inoculation into 96-well culture plates (1.5
Transwell chambers (Millipore, Darmstadt, Germany) used for cell invasion assays were first
pretreated with 50 µL of a 1:9 Matrigel/DMEM solution (BD, New Jersey, USA).
Subsequently, 1
Cells were dispersed into a single-cell suspension at 48 h after transfected.
The colony forming assay was carried out by incubating 1
Five
A2780 and SKOV3 cell lines were grown in 6-well plates. Wild-type (WT) and
mutant fragments (MUT) from the 3
Female BALB/c nude mice aged 4–5 weeks were obtained from Animal Core Facility,
Nanjing Medical University. Each mouse (5 mice per group) received a subcutaneous
injection in the right armpit with a 200 µL suspension containing 5
Experiments were conducted in triplicate. SPSS 15.0 (IBM, Chicago, USA) was used for
statistical analyses, with values expressed as the mean
LncRNA PART1 expression in clinical specimens was quantified by qRT-PCR. Fig. 1A shows the expression was significantly higher in EOC relative to normal ovarian surface epithelial (OSE) tissue. LncRNA PART1 expression was also higher in advanced stage EOC relative to lower stage tumors (Fig. 1B). Finally, the expression level in three EOC cell lines (OVCAR3, SKOV3, A2780) was greater relative to the OSE cell line (IOSE80), particularly in SKOV3 and A2780 cells (Fig. 1C).
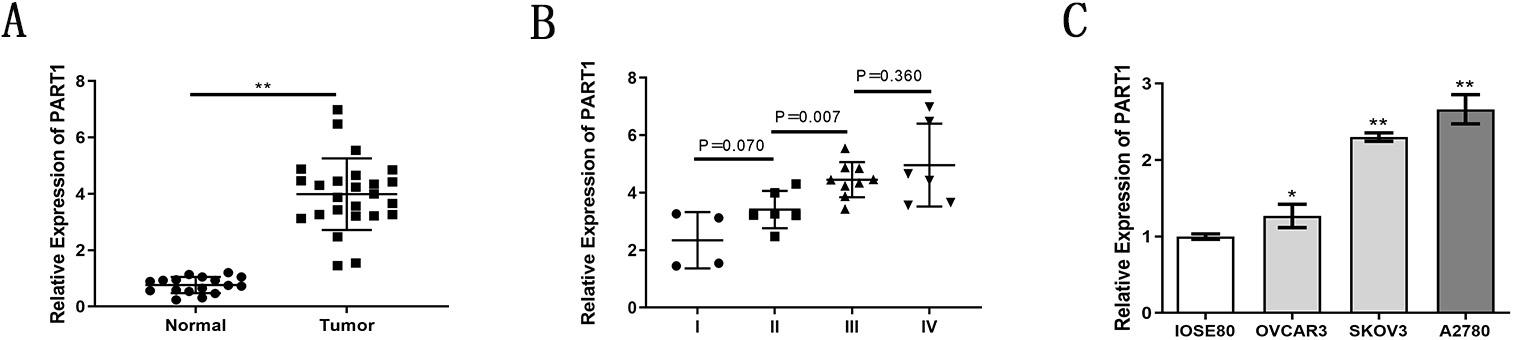 Fig. 1.
Elevated expression of lncRNA PART1 in EOC detected with
qRT-PCR. (A) PART1 expression in EOC and normal ovarian tissue. (B) PART1
expression in EOCs at different FIGO stages. (C) PART1 expression in EOC (OVCAR3,
SKOV3, A2780) and ovarian surface epithelial (OSE) (IOSE80) cells. *p
PART1 expression in SKOV3 and A2780 cells was reduced following transfection with a knockdown vector (sh-PART1). A control vector (sh-NC) was also used, and transfection efficiency confirmed using qRT-PCR. Among them, sh-1, sh-2, sh-3 and sh-4 were compared with sh-NC, respectively, and sh-2 had the best transfection efficiency (Fig. 2A,B). Results from colony forming assays and CCK-8 assays demonstrated that lncRNA PART1 knockdown inhibited EOC cell proliferation (Fig. 2C–E). Furthermore, transwell assay revealed that lncRNA PART1 knockdown also inhibited the migration and invasion ability of cells (Fig. 2F–I). Hence, the above results imply that PART1 enhances the proliferation, migration and invasion of EOC cells in vitro.
 Fig. 2.
LncRNA PART1 knockdown reduces the proliferation, migration and
invasion of A2780 and SKOV3 cells. (A,B) PART1 expression in cells transfected
with sh-PART1 (including sh-PART1-1, sh-PART1-2, h-PART1-3 and sh-PART1-4) as
measured by qRT-PCR. (C) Proliferation of cells following transfection with
sh-PART1 or sh-NC (control), as determined using colony-forming assay. (D,E)
Proliferation of cells following transfection with sh-PART1 or sh-NC, as
determined by CCK8 assay. (F,G) Migration of cells following transfection with
sh-PART1 or sh-NC, as determined by transwell assay. (H,I) Invasion of cells
following transfection with sh-PART1 or sh-NC, shown using transwell assay.
*p
The findings from starBase revealed the presence of binding sites between lncRNA PART1 and miR-150-5p (Fig. 3A). Luciferase reporter gene assay also demonstrated that miR-150-5p decreased luciferase activity in lncRNA PART1-WT cells, but not lncRNA PART1-MUT cells (Fig. 3B). miR-150-5p expression was significantly reduced in EOC tissue relative to normal tissue (Fig. 3C). Pearson’s analysis demonstrated an inverse correlation between PART1 and miR-150-5p levels in EOC tissue (Fig. 3D). Similar results to EOC tissues were obtained for miR-150-5p expression in OSE and EOC cells. The expression levels in the three EOC cell lines (OVCAR3, SKOV3, A2780) were lower than those in the OSE80 cell line, especially in SKOV3 and A2780 cells (Fig. 3E). miR-150-5p expression was increased in SKOV3 and A2780 cells in which lncRNA PART1 was down-regulated (Fig. 3F). Together, these results indicate lncRNA PART1 is able to sponge miR-150-5p in EOC cells.
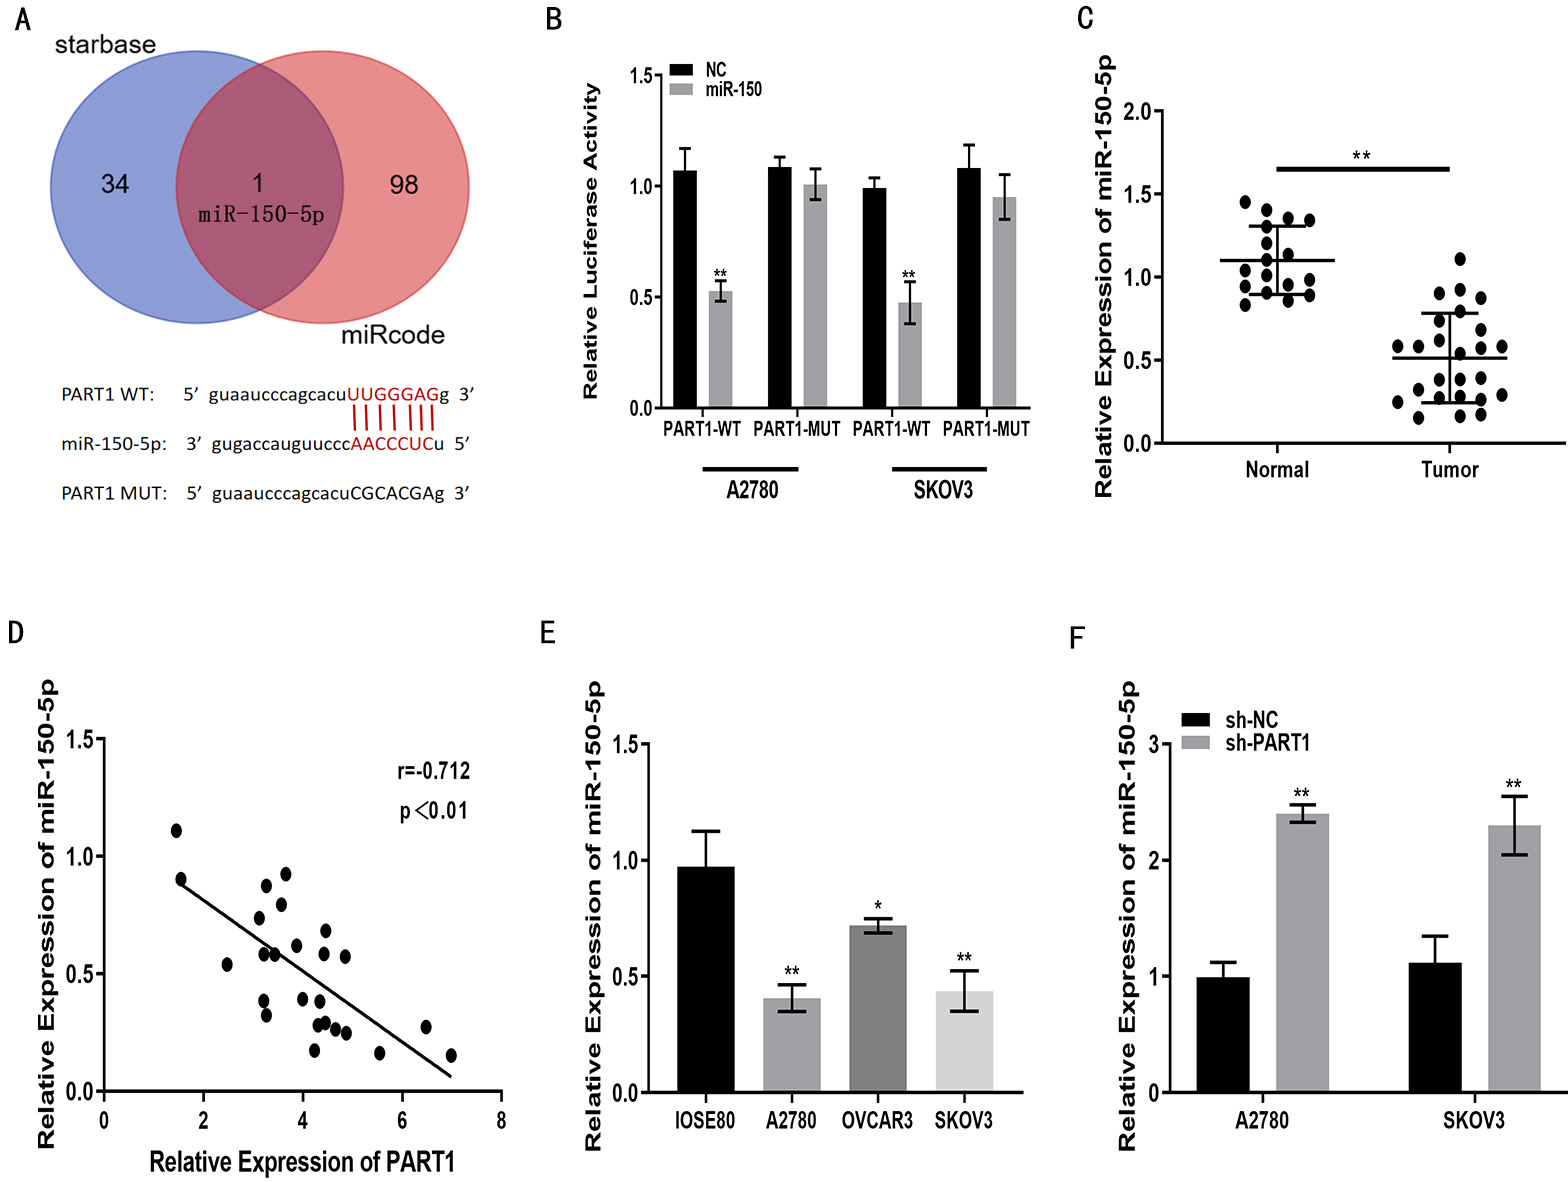 Fig. 3.
LncRNA PART1 can sponge miR-150-5p. (A) Putative binding sites
between miR-150-5p and PART1 identified with online databases. (B) miR-150-5p
reduces luciferase activity of PART1-WT, but not PART1-MUT, as shown by
luciferase reporter gene assay. (C) miR-150-5p expression in EOC and normal
ovarian tissue, as quantified by qRT-PCR. (D) Correlation analysis of relative
expression levels for PART1 and miR-150-5p in clinical specimens. (E) miR-150-5p
expression levels in EOC cells (OVCAR3, SKOV3, A2780) and OSE cells (IOSE80), as
measured with qRT-PCR. (F) miR-150-5p expression in A2780 and SKOV3 cells after
transfection with sh-PART1 or with sh-NC (negative control), as measured with
qRT-PCR. *p
Functional assays were performed to determine whether lncRNA PART1 acts in A2780 and SKOV3 cells by binding to and therefore effectively removing miR-150-5p. Transfection efficiencies for miR-150-5p inhibitor, sh-PART1 and corresponding controls were confirmed using qRT-PCR (Fig. 4A,B). CCK-8 assays revealed that lncRNA PART1 down-regulation decreased EOC cell proliferation. This was partially reduced by miR-150-5p inhibitor (Fig. 4C,D). Similarly, results from transwell assays revealed miR-150-5p inhibitor can attenuate inhibition of migration and invasion caused by lncRNA PART1 downregulation (Fig. 4E–H). These findings suggest that lncRNA PART1 can enhance EOC cell proliferation, migration and invasion through binding and thus inactivation of miR-150-5p.
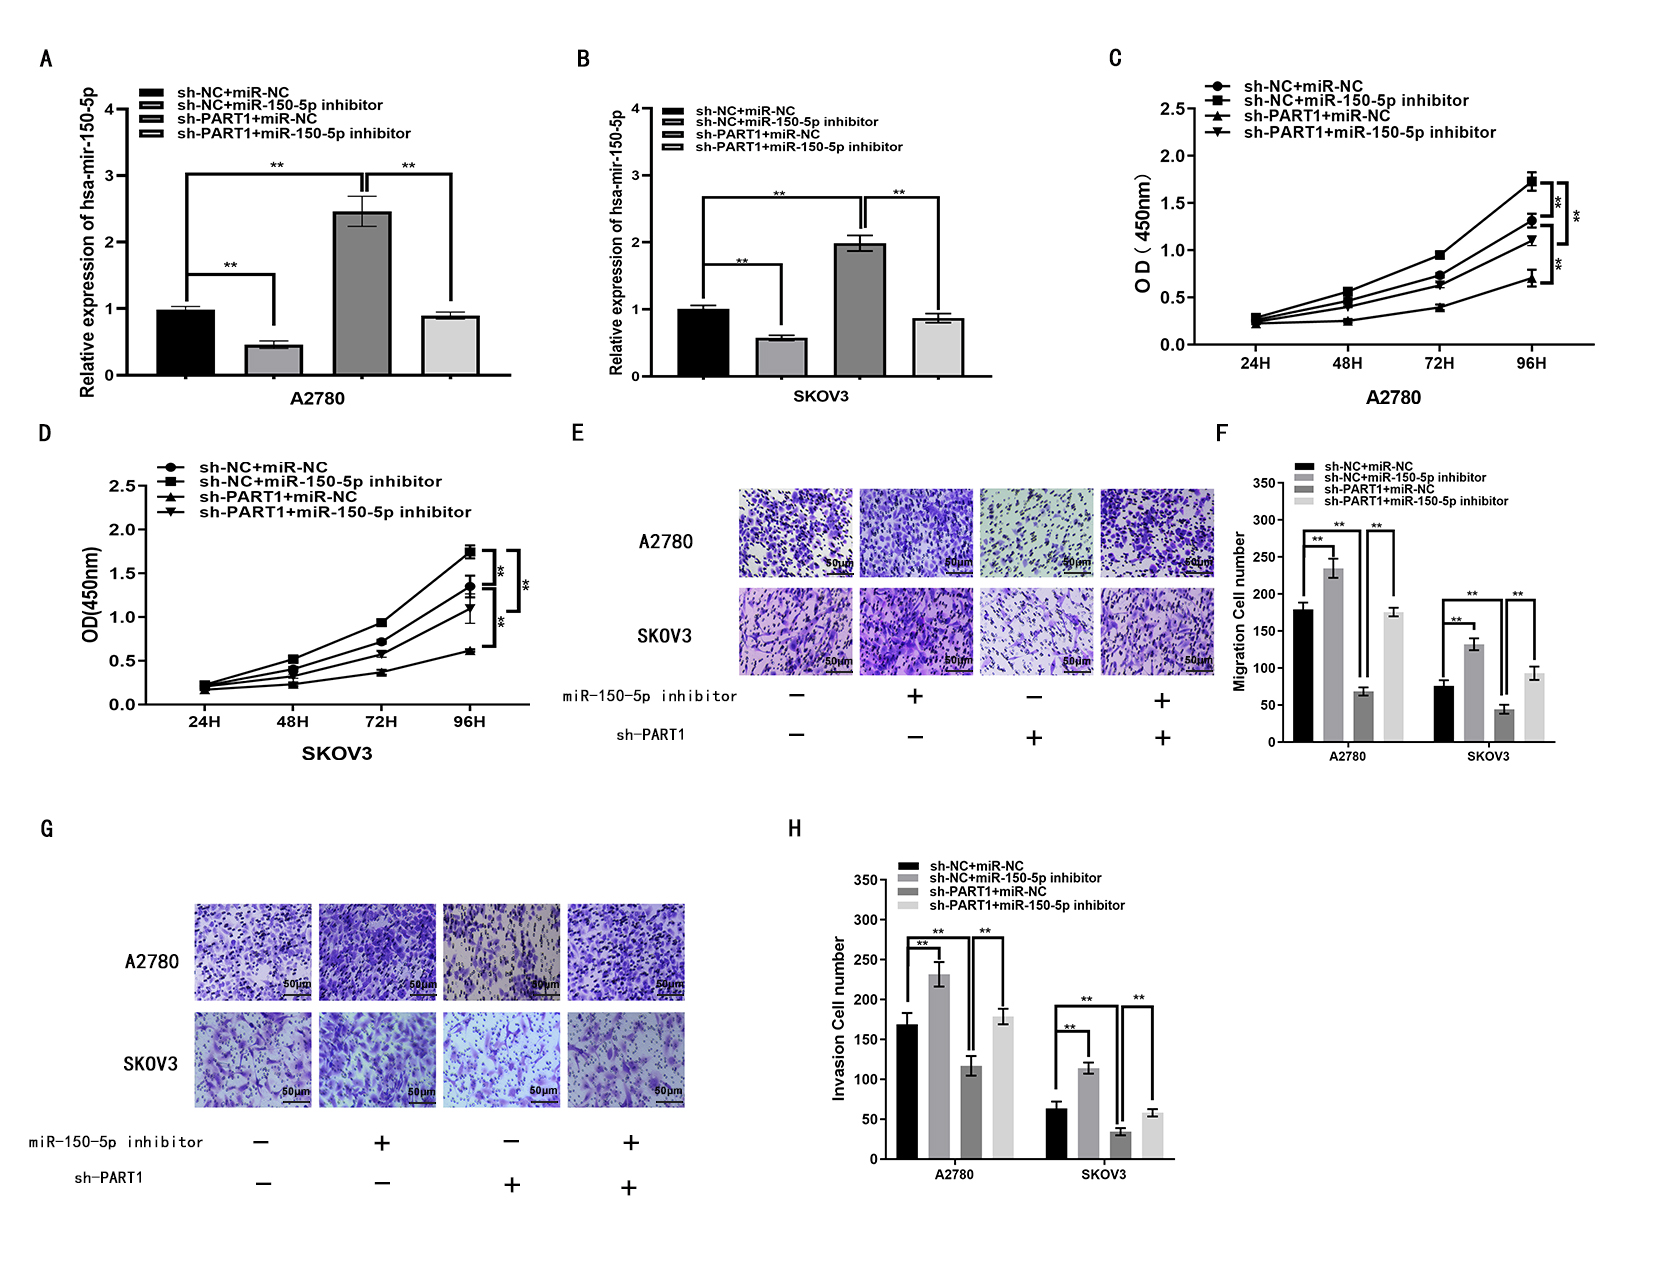 Fig. 4.
LncRNA PART1 enhances the progression of EOC by binding
miR-150-5p. (A,B) miR-150-5p expression in A2780 and SKOV3 cells after
transfection with miR-150-5p inhibitor, sh-PART1 or the corresponding controls,
as determined with qRT-PCR. (C,D) A2780 and SKOV3 cell proliferation after
transfection with miR-150-5p inhibitor, sh-PART1 or the corresponding controls,
as measured with the CCK8 assay. (E,F) Migration of A2780 and SKOV3 cells
following transfection with miR-150-5p inhibitor, sh-PART1 or the corresponding
controls, as measured with the transwell assay. (G,H) Invasion of A2780 and SKOV3
cells following transfection with miR-150-5p inhibitor, sh-PART1 or the
corresponding controls, as measured with the transwell assay. *p
We investigated miR-150-5p target genes to test the ceRNA hypothesis. 22 genes were screened out by StarBase v3.0. Then three of these genes, MTCH2, MYB and NDC1, were found to be elevated in ovarian cancer tissues relative to normal ovarian tissues through the GEPIA database (Supplementary Fig. 1). MYB is one of the more classical, malignant progression-promoting oncogenes in a variety of tumors, such as: breast, liver, colon and lung cancers [27, 28, 29, 30]. Next, MYB was selected as the object of study (Fig. 5A). The luciferase reporter gene assay revealed that miR-150-5p decreased luciferase activity for MYB-WT, but there was no significant effect for MYB-MUT (Fig. 5B). The expression of MYB was elevated in EOC compared to OSE tissue (Fig. 5C). Moreover, MYB expression was inversely associated miR-150-5p expression in EOC specimens, as shown by Pearson’s correlation analysis (Fig. 5D). Three EOC cell lines (OVCAR3, SKOV3, A2780) were compared with OSE cell line (OSE80), respectively. qRT-PCR also demonstrated that MYB expression in EOC cells was higher than in OSE cells (Fig. 5E). Together, the data indicate that MYB is a target for miR-150-5p. Functional assays showed the impacts of si-MYB on the proliferation, migration and invasion of EOC cells were partly attenuated by miR-150-5p inhibitor (Fig. 6A–H). Overall, these findings demonstrate that miR-150-5p can reduce proliferation, migration and invasion of EOC cells through targeting MYB.
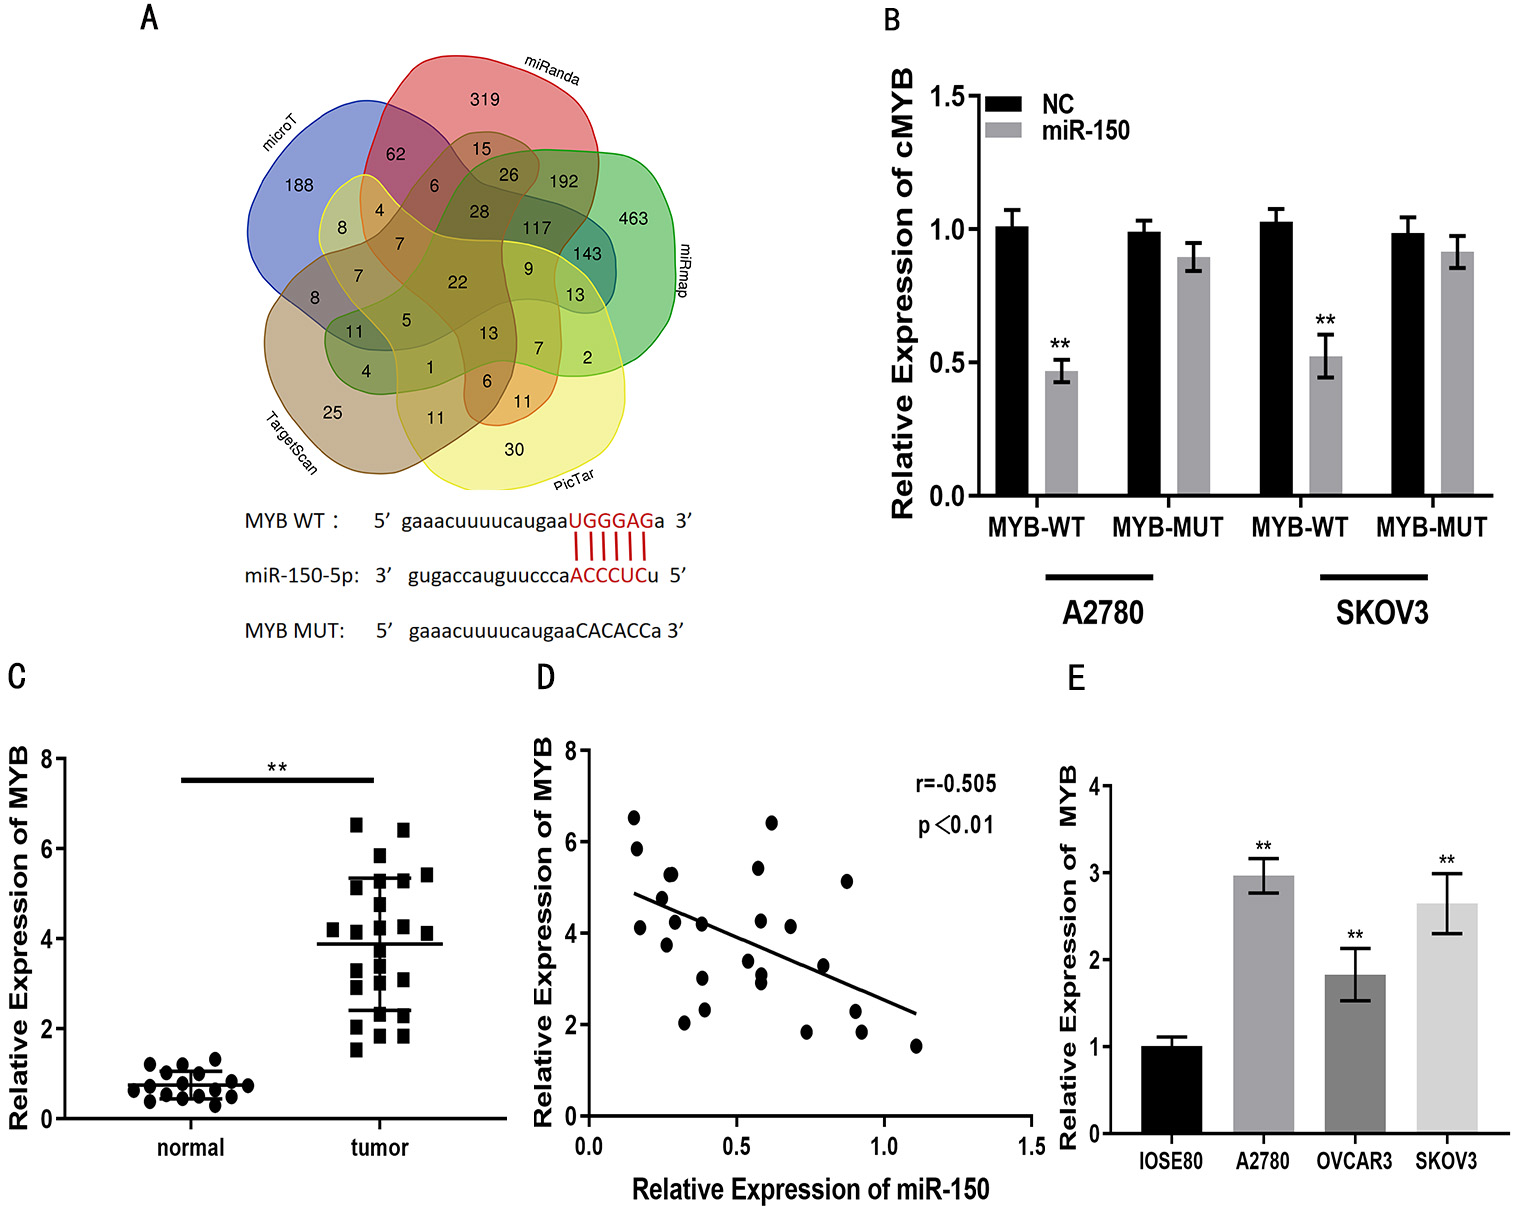 Fig. 5.
MYB is a target for miR-150-5p. (A) Putative binding sites for
miR-150-5p on MYB, identified with online databases. (B) miR-150-5p reduces
luciferase activity of MYB-WT in EOC cell lines, but not for MYB-MUT, as shown by
luciferase reporter assay. (C) MYB expression levels in EOC and normal ovarian
tissue, as measured with qRT-PCR. (D) Correlation between MYB and miR-150-5p
expression in clinical specimens, as determined using Pearson’s analysis. (E) MYB
expression in EOC (OVCAR3, SKOV3, A2780) and OSE (IOSE80) cells, as measured with
qRT-PCR. **p
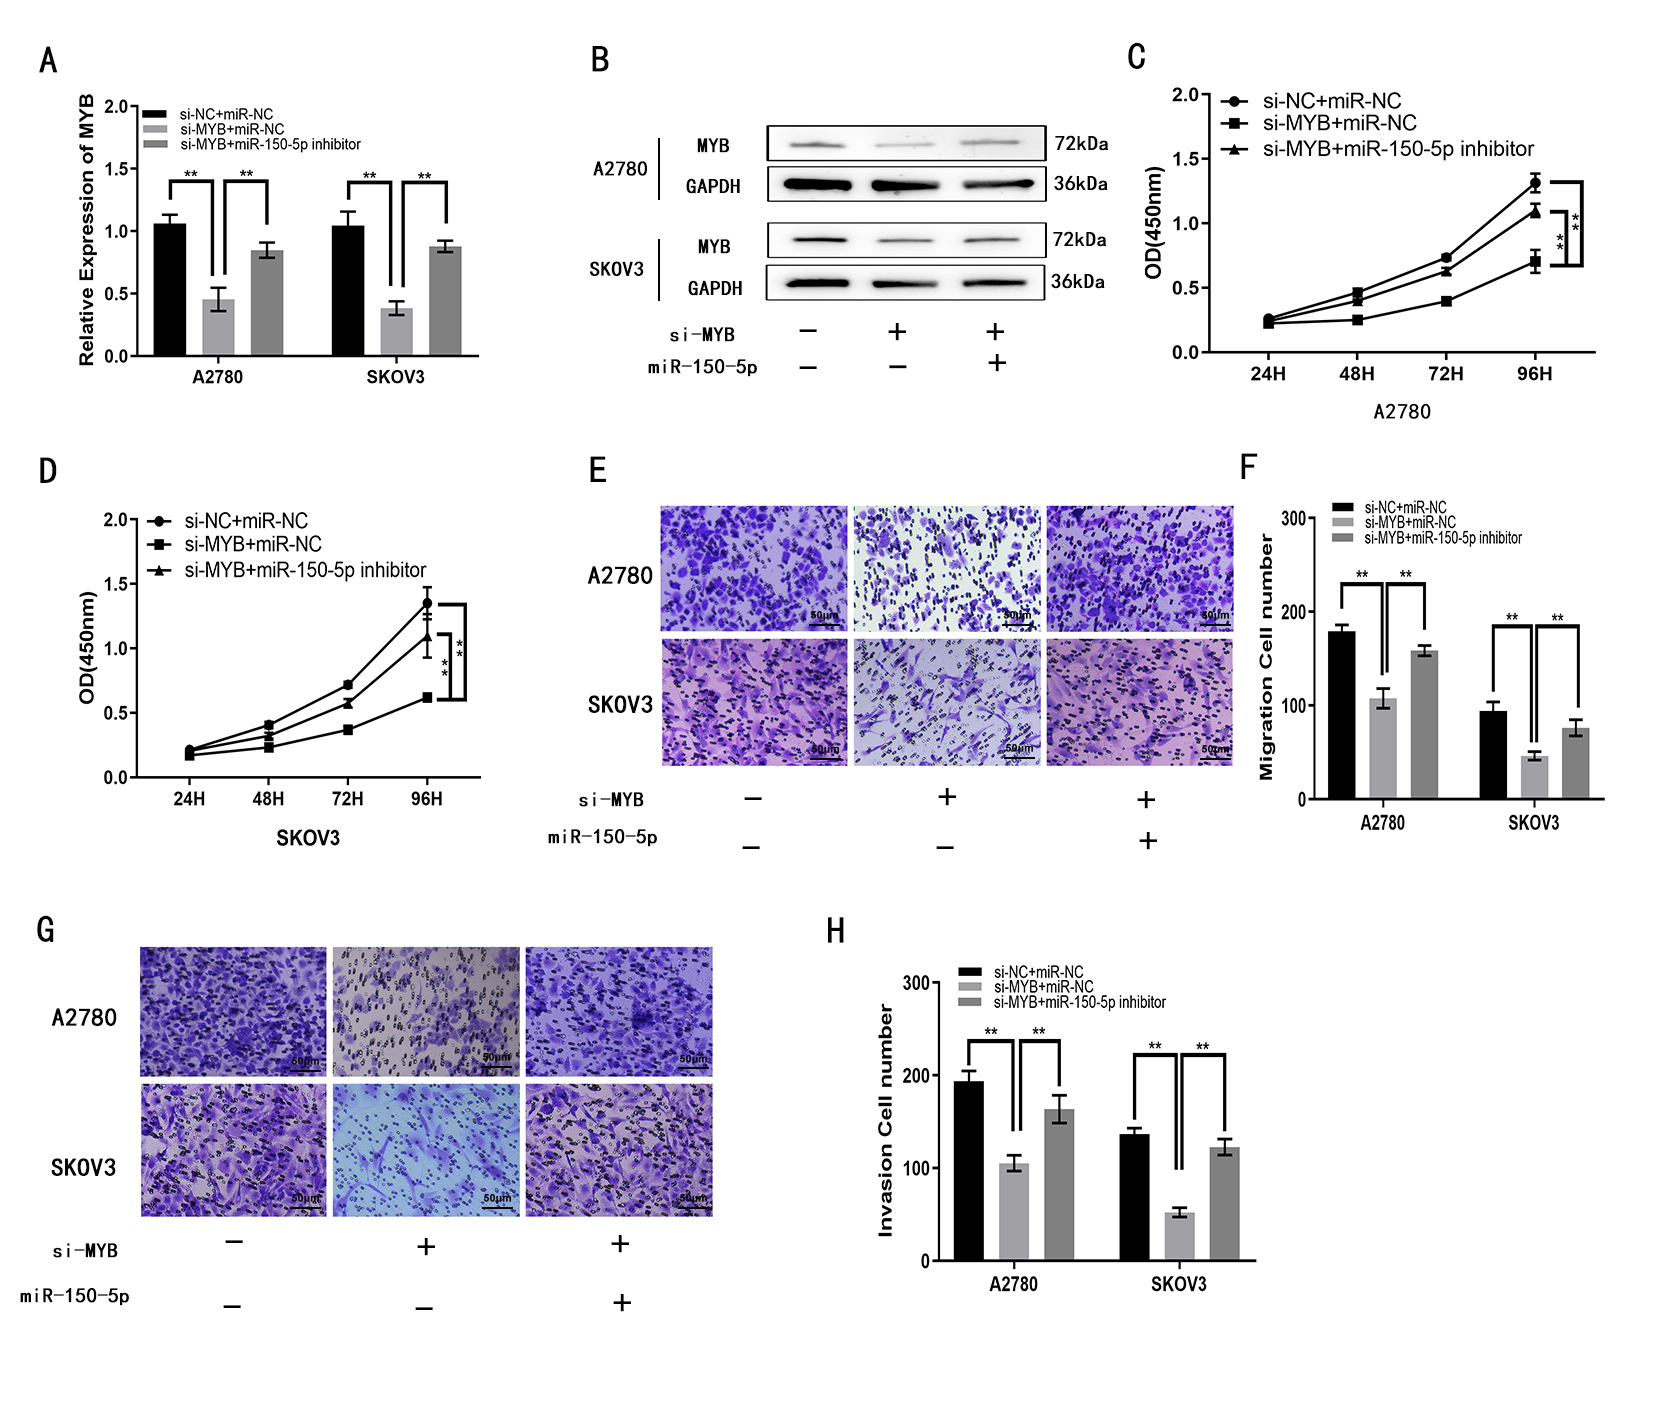 Fig. 6.
MYB enhances the proliferation, migration and invasion of A2780
and SKOV3 cells in vitro. (A,B) MYB expression in A2780 and SKOV3 cells
following transfection with si-MYB, or si-MYB plus miR-150-5p inhibitor, as
measured with qRT-PCR and Western blotting. (C,D) Proliferation of A2780 and
SKOV3 cells following transfection with si-MYB, or si-MYB plus miR-150-5p
inhibitor, as measured with the CCK8 assay. (E,F) Migration of A2780 and SKOV3
cells following transfection with si-MYB, or si-MYB plus miR-150-5p inhibitor, as
determined using the transwell assay. (G,H) Invasion by A2780 and SKOV3 cells
following transfection with si-MYB, or si-MYB plus miR-150-5p inhibitor, as
measured using transwell assays. **p
To investigate whether lncRNA PART1 is involved in EOC growth in vivo, female nude mice received subcutaneous injections of A2780 cells following transfection with sh-PART1 or sh-NC (negative control). Tumor size was estimated every four days and the tumor growth rate determined after 30 days. sh-PART1 was found to suppress cancer growth in the nude mice compared to controls (Fig. 7A–C). In addition, mean tumor volume and weight were smaller with sh-PART1(Fig. 7D,E). Overall, these finding indicate that lncRNA PART1 can enhance the growth of EOC in vivo.
 Fig. 7.
MYB promotes in vivo growth of EOC. (A,B) EOC growth
in mice injected with A2780 cells that had been transfected with sh-PART1 or with
sh-NC. (C–E) PART1 downregulation resulted in a lower tumor growth rate (volume
and weight) than observed in controls. **p
EOC shows a high degree of malignancy in female patients [31]. The lack of obvious symptoms during the initial stages of EOC mean that is easily be ignored by patients. As a consequence, most women are diagnosed with middle and late stages of this cancer, thus greatly increasing the difficulty of treatment [32, 33]. A large body of research has revealed a major role for lncRNAs in the pathogenesis of human malignancies [34, 35]. Novel transcriptome sequencing technology has resulted in the discovery of an ever-increasing number of lncRNAs. There is now strong research evidence showing the involvement of lncRNAs in several biological behaviors including the regulation of gene transcription, epigenetic regulation, ontogenetic regulation, and chromatin modification [36, 37, 38]. Several research groups have demonstrated that progression of several tumor types, including EOC, correlates with aberrant expression of lncRNAs [39]. Some lncRNAs have also been suggested as markers for early cancer detection and diagnosis [40, 41, 42]. PART1 is increasingly recognized to be associated in the pathogenesis of many cancer types. Recently, Zhao et al. [43] published that lncRNA PART1 can suppress the growth of esophageal cancer, while Chen et al. [44] reported it could also increase proliferation of lung cancer cells. Presently, we confirmed that lncRNA PART1 expression was elevated in EOC compared to normal tissue. Knockdown of PART1 expression in EOC cells markedly inhibited EOC cell proliferation, migration and invasion in vitro. An EOC xenograft animal model was also established and was used to show that lncRNA PART1 knockdown lowered the growth rate of xenografts.
Salmena et al. [19] demonstrated that lncRNAs could act as a sponge to absorb miRNAs, thereby indirectly regulating mRNA expression. An increasing number of interrelationships in the lncRNA-miRNA-mRNA ceRNA axis have recently been found. Several investigators have suggested a role for ceRNA during progression of multiple tumor types including bladder, colorectal and cervical cancer [45, 46, 47]. With major advances in sequencing technology, bioinformatics now plays an important role in both foundational and clinical medicine [48, 49]. In the current study, the online databases starbase V3.0 and miRcode were used to identify miR-150-5p as being a downstream target of lncRNA PART1. LncRNA PART1expression was higher in EOC tissue and cells, but this was decreased by miR-150-5p. Functional studies also revealed that lncRNA PART1 had oncogene-like properties in EOCs. Both PART1 sh-RNA and miR-150-5p mimic reduced MYB-WT luciferase activity in a reporter gene assay, while the inhibitory action of PART1 sh-RNA was restored with miR-150 inhibitor. Furthermore, qRT-PCR and Western blot revealed that lncRNA PART1 knockdown reduced MYB expression. This effect was partly attenuated with miR-150 inhibitor. In addition, functional assays showed the effect of sh-PART1 on the proliferation, migration and invasion ability of EOC cells was abolished with miR-150 inhibitors. These results indicate PART1 can act like a ceRNA, thus regulating the miR-150/MYB axis and hence EOC progression.
This study has several limitations. The study cohort of EOC tissues was relatively small and hence the five different EOC subtypes (low grade plasmacytosis, high grade plasmacytosis, endometrioid, clear cell, mucinous) could not be evaluated individually. The fallopian tube is the main source of high-grade serous ovarian carcinoma (HGSOC), which is the most frequent type of ovarian cancer. Therefore clinical tissue selection cannot be limited to normal ovarian tissue alone. Moreover, the development of ovarian cancer involves complex molecular regulation pathways that need further investigation.
Our work suggests a tumorigenic role for lncRNA PART1 in EOC. It has revealed a potential mechanism by which lncRNA PART1 binds competitively to miR-150-5p, thereby upregulating the downstream oncogene MYB (Fig. 8). This research confirms a role for lncRNA PART1 in the development and pathogenesis of EOC, as well as identifying the likely molecular pathway.
 Fig. 8.
Schematic model showing the putative role for lncRNA PART1 in the proliferation, migration and invasion of EOC.
The datasets used and/or analyzed during the current study are available from the corresponding author on reasonable request.
JW, YH and TZ performed the in vivo studies. JW and YH performed the in vitro studies. JL and BX contributed to the design and analysis of the study and revised the manuscript. All authors contributed to editorial changes in the manuscript. All authors read and approved the final manuscript. All authors have participated sufficiently in the work to take public responsibility for appropriate portions of the content and agreed to be accountable for all aspects of the work in ensuring that questions related to its accuracy or integrity.
All patients were provided with written informed consent. This study obtained ethical approval from the Second Affiliated Hospital of Nanjing Medical University. All tests were carried out in accordance with the Declaration of Helsinki. Ethics Committee of the Second Affiliated Hospital of Nanjing Medical University, number 2017AE02133.
All animal experiments complied with the Animal Research: Reporting of In vivo Experiments (ARRIVE) guidelines. AND all experiments involving use of mice were conducted in accordance with animal protocol (certificate number: 1811051) approved by the Animal Care and Use Committee of the Model Animal Research Center of Key Lab of Reproductive Medicine.
Not applicable.
This study was funded by National Natural Science Foundation of China (81873820) and 789 Excellent Talents Training Program of The Second Affiliated Hospital of Nanjing Medical University (789ZYRC202070208).
The authors declare no conflict of interest.
Publisher’s Note: IMR Press stays neutral with regard to jurisdictional claims in published maps and institutional affiliations.