
- Academic Editor
Background: The occurrence and progression of lung cancer are correlated with telomeres and telomerase. Telomere length is reduced in the majority of tumors, including lung cancers. Telomere length variations have been associated with lung cancer risk and may serve as therapeutic targets as well as predictive biomarkers for lung cancer. Nevertheless, the effects of telomere-associated genes on lung cancer prognosis have not been thoroughly studied. We aim to investigate the relationship between telomere-associated genes and lung cancer prognosis. Methods: The Cancer Genome Atlas and Genotype-Tissue Expression databases were used as training sets to build a predictive model. Three integrated Gene Expression Omnibus datasets served as validation sets. Using cluster consistency analysis and regression with the least absolute shrinkage and selection operator, we developed a telomere-related gene risk signature (TMGsig) based on 11 overall survival-related genes (RBBP8, PLK1, DSG2, HOXA7, ANAPC4, CSNK1E, SYAP1, ALDOA, PHF1, MUTYH, and PGS1). Results: The results indicated a negative outcome for the high-risk score group. Immunological microenvironment and somatic mutations differed between the high- and low-risk groups. A statistically significant difference existed between the low-risk and high-risk groups in terms of the expression levels of B cells and CD4 cells, and the risk score was essentially inversely linked with immune cell expression. Conclusions: TMGsig can predict outcomes in patients with lung adenocarcinoma.
Lung cancer is the most lethal malignant tumor, claiming over a million lives annually worldwide [1]. Different pathological subtypes of lung cancer carry different prognoses and clinicopathological features. Lung cancer has a 5-year survival rate of only approximately 18%, and survival rates for different stages of lung cancer vary greatly [2]. Due to the high heterogeneity of lung cancer, and despite the availability of numerous treatment methods, the effectiveness of most clinical medications for treating the condition remains relatively low. Chemotherapy, radiotherapy, targeted therapy, and even immunotherapy may be effective, but many tumors eventually develop drug resistance, which complicates the clinical treatment of lung cancer. Its poor survival rate and complex treatment indicate a key conclusion: the recovery and survival rates of patients can only be successfully increased by early identification, early diagnosis, and early treatment. In this sense, multigene models are generally better at predicting tumors [3]. As a result, it is possible to more precisely pinpoint patient subgroups with poor survivals, to deliver more precise adjuvant therapy and follow-up. Decision-making and individualized care are also aided by this. During cell division, the DNA near the ends of chromosomes is gradually eroded due to the incapacity of chromosomal DNA replication processes to effectively copy this DNA. A reverse transcriptase called telomerase adds telomere sequences to the ends of chromosomes, making up for the DNA loss that happens in the region during cell division. The telomere lengths of somatic cells gradually decrease during their life cycles because most normal tissues lack telomerase activity. However, telomerase is reactivated in 85–90% of human tumors [4]. In 2009, for discovering the processes by which telomeres and telomerase protect chromosomes, three scientists received the Nobel Prize in Physiology or Medicine. Since then, research on telomeres and telomerase in cancer has gradually gained interest, particularly the blocking of the telomere elongation mechanism, and telomerase inhibitors as a potential new therapeutic target for anti-tumor therapy [5].
Telomere shortening may be a risk factor or predictor of susceptibility to lung
cancer, according to some research [6]. However, one prospective observational
study of heavy smokers indicated that lung cancer risk was higher in people with
longer telomeres [7]. Similar conclusions were reached in a follow-up study of
26,540 Chinese Singaporeans [8]: a Cox regression model was used, and the results
revealed that individuals in the top 20% concerning telomere length had an
increased risk of lung adenocarcinoma (LUAD) compared with those in the bottom
20% (hazard ratio [HR] = 2.84; 95% confidence interval [CI]: 1.94–4.14;
p
Given the link between telomeres and lung cancer, we created a predictive model for LUAD based on telomere-associated genes. We also discussed the relationship between this model and the immune micro-landscape. Hopefully, this strategy may support physicians in making crucial treatment-related decisions in the future.
The Sangerbox online platform (http://vip.sangerbox.com/) was used to access the Genotype-Tissue Expression (GTEx) database and The Cancer Genome Atlas (TCGA) database to view clinical and gene expression data for patients with LUAD [12]. The datasets for GSE31210, GSE11969, and GSE72049 were retrieved from the Gene Expression Omnibus (GEO) database (http://www.ncbi.nlm.nih.gov/geo/). Table 1 provides an overview of the clinical characteristics of the four groups. Furthermore, the TelNet database (http://www.cancertelsys.org/telnet/) was used to acquire telomere-associated genes [13].
| Cohort names | RNA Type | Cancer type | Number of patients | Cohort Type |
| TCGA-LUAD | RNA-seq | LUAD | 575 | Training |
| GSE70249 | Microarray | LUAD | 398 | Validation |
| GSE31210 | Microarray | LUAD | 226 | Validation |
| GSE11969 | Microarray | LUAD | 149 | Validation |
TCGA, The Cancer Genome Atlas; LUAD, lung adenocarcinoma.
The TCGA dataset provided RNAseq results and associated clinical data for 516
LUAD tumors. The Limma package for R (version 3.40.2, R Foundation for
Statistical Computing, Vienna, Austria) was used to investigate differential mRNA
expression. Adjusted p-values were examined in TCGA or GTEx to correct
false positive results, and “Adjusted p
The data was analyzed through functional enrichment analysis. To better understand the oncogenic activities of target genes, the ClusterProfiler package (version: 3.18.0) for R was used to analyze the Gene Ontology (GO) functions of potential targets and enrichments identified via the Kyoto Encyclopedia of Genes and Genomes (KEGG) pathway.
The intersection between DEGs and telomere-related genes yielded Tolmere related DEGs (TM-DEGs). To investigate the relationships between the expression levels of TM-DEGs and LUAD subtypes, ConsensusClusterPlus was used to perform cluster analysis [14] on all 514 LUAD patients in the TCGA dataset. After 10 iterations of agglomerative pam clustering with a 1-Pearson correlation distance, 80% of the data were resampled. The ideal number of clusters was established using the empirical cumulative distribution function plot. As a result, prognostic analysis was performed on the two identified groups.
A telomere-related gene signature (TMGsig) was established using the least absolute shrinkage and selection operator (LASSO)-Cox regression analysis. The maxstat package for R was used to determine the optimal threshold of risk score, to divide each cohort into high-risk and low-risk groups. The survival analysis tool of the R software package was used to determine the prognostic difference between the two groups. The log-rank test was used to assess the substantial prognostic variances between the groups. A receiver operating characteristic (ROC) curve was used to evaluate the predictive ability of the signature. Finally, using risk scores based on the TCGA cohort, a nomogram was developed to forecast 1-, 3-, and 5-year survival.
We used the KEGG and GO enrichment methods to analyze 11 identified telomere-related prognostic genes.
Minimum and maximum gene sets were 5 and 5000, respectively, and statistical
significance was defined as p
The TCGA-LUAD cohort was used for Spearman correlation analysis between model
score and immune score using the Tumor Immune Estimation Resource (TIMER) and
quanTIseq algorithms, respectively, and with p
The TCGA genomic data commons (GDC) data portal contained somatic mutation information in the Mutation Annotation Format (MAF) format, for LUAD samples. For waterfall mapping, the “Maftools” package in R software was used, which made it easier to visualize and summarize mutant genes and create a waterfall map of somatic mutations for high- and low-risk subgroups.
Using the TIMER and quanTIseq methods, we compared the immune microenvironment infiltration of the two risk subgroups. The findings were displayed as a landscape map.
The differential gene analysis of cancer and standard tissue samples from the TCGA-LUAD cohort, compared with normal tissue samples from GTEx database revealed a total of 4269 DEGs, 1475 of which showed upregulation and 2794 of which showed downregulation (Fig. 1).
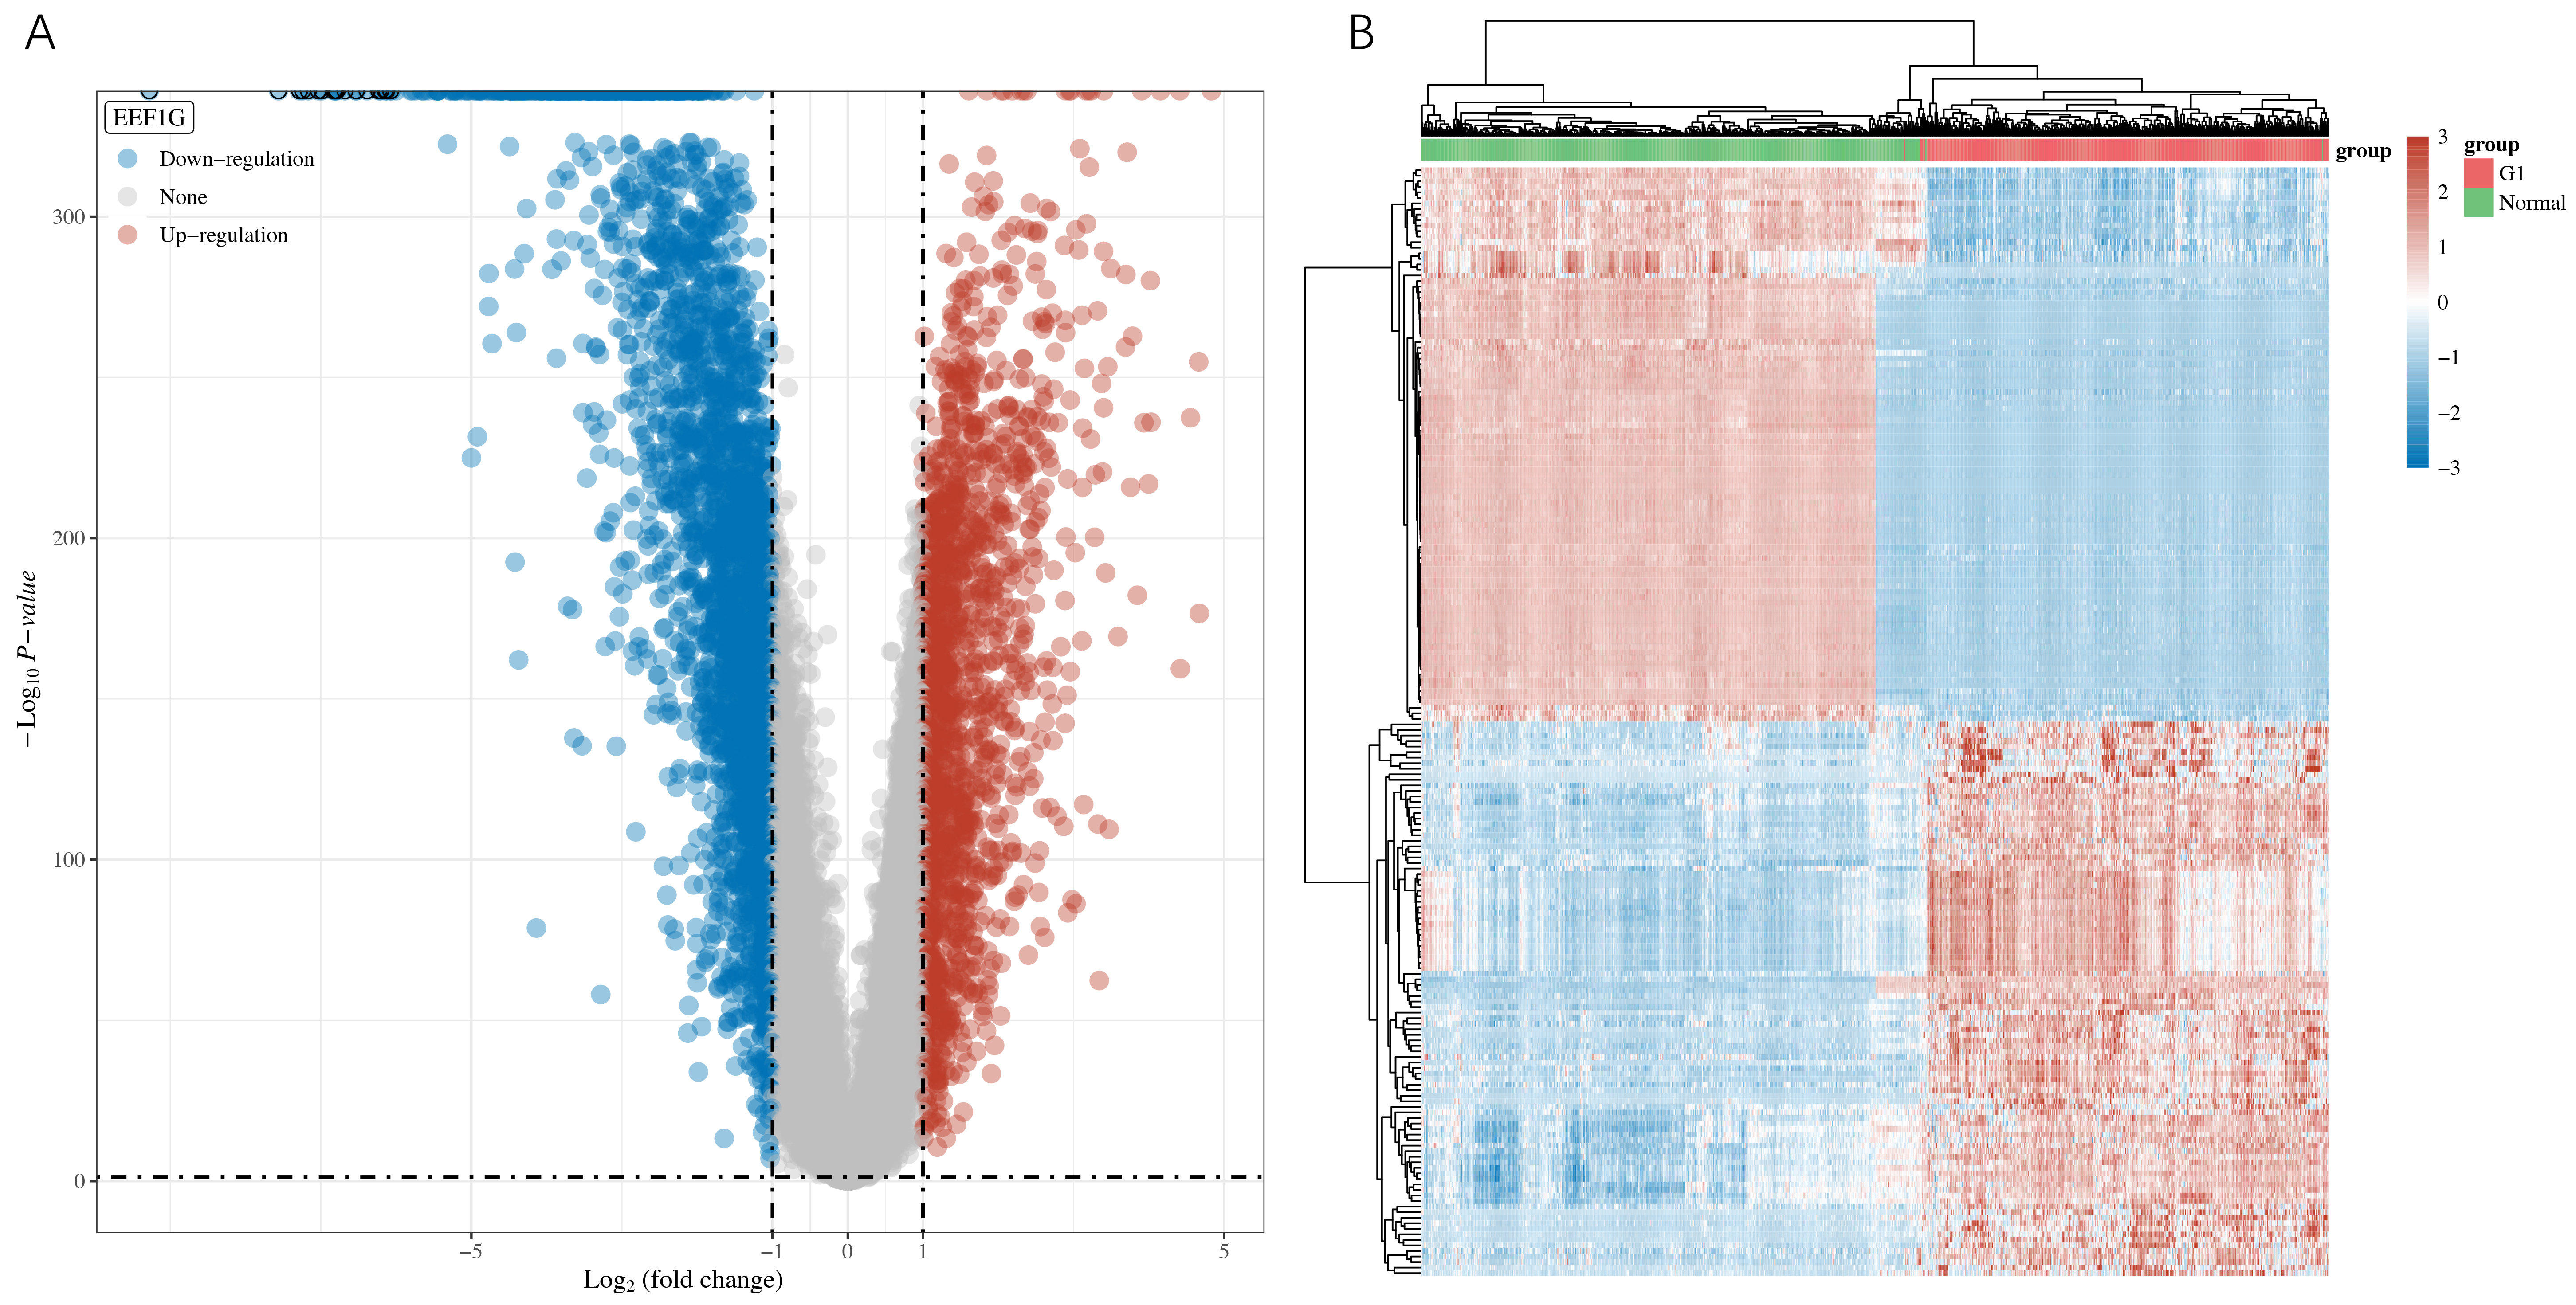 Fig. 1.
Screening of Differentially Expressed Genes (DEGs). (A) Using fold change and adjusted p-values to construct a volcano map. (B) Heat map of differential gene expression.
GO analysis revealed that the majority of up-regulated genes were primarily involved in organelle fission, nuclear division, and nuclear chromosome segregation. The majority of the down-regulated genes were involved in second messenger-mediated signaling, regulation of vasculature development, and neutrophil degranulation neutrophil activation during the immune response.
According to our KEGG analysis, up-regulated genes are mainly enriched within the functional regions of the p53 signaling pathway, tight junction, and cell cycle. However, the active regions of the PI3KAkt signaling pathway, the Ras/Rap1 signaling pathway, and the MAPK signaling pathway were enriched with down-regulated genes (Fig. 2).
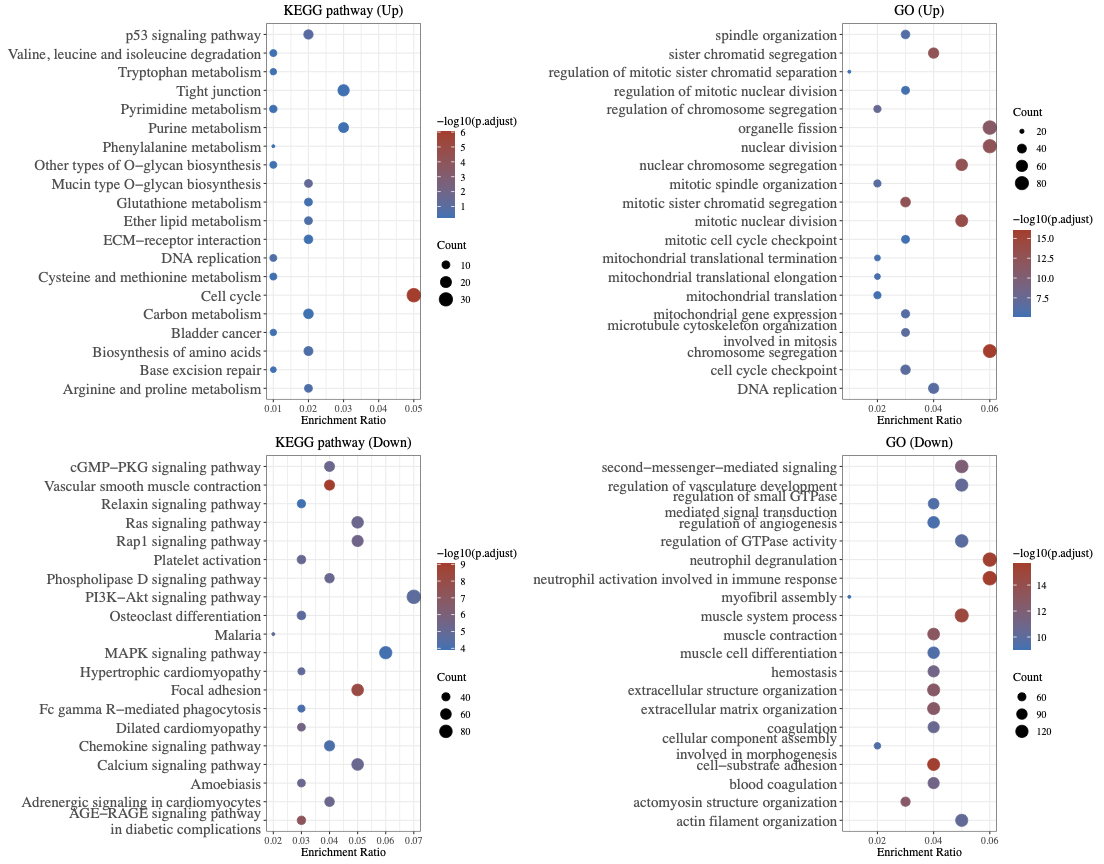 Fig. 2.
Functional enrichment analysis of DEGs.
A total of 2089 telomere-related genes were obtained from the previous website.
The intersection of DEGs and telomere-related genes was then used to identify
TM-DEGs (488 genes, among which 186 were up-regulated and 302 were
down-regulated). Three NA expression values were eliminated, leaving 485
remaining genes. After dividing the patients into C1 and C2 groups, a separate
survival analysis was conducted on each group. With a pvalue of 2.4
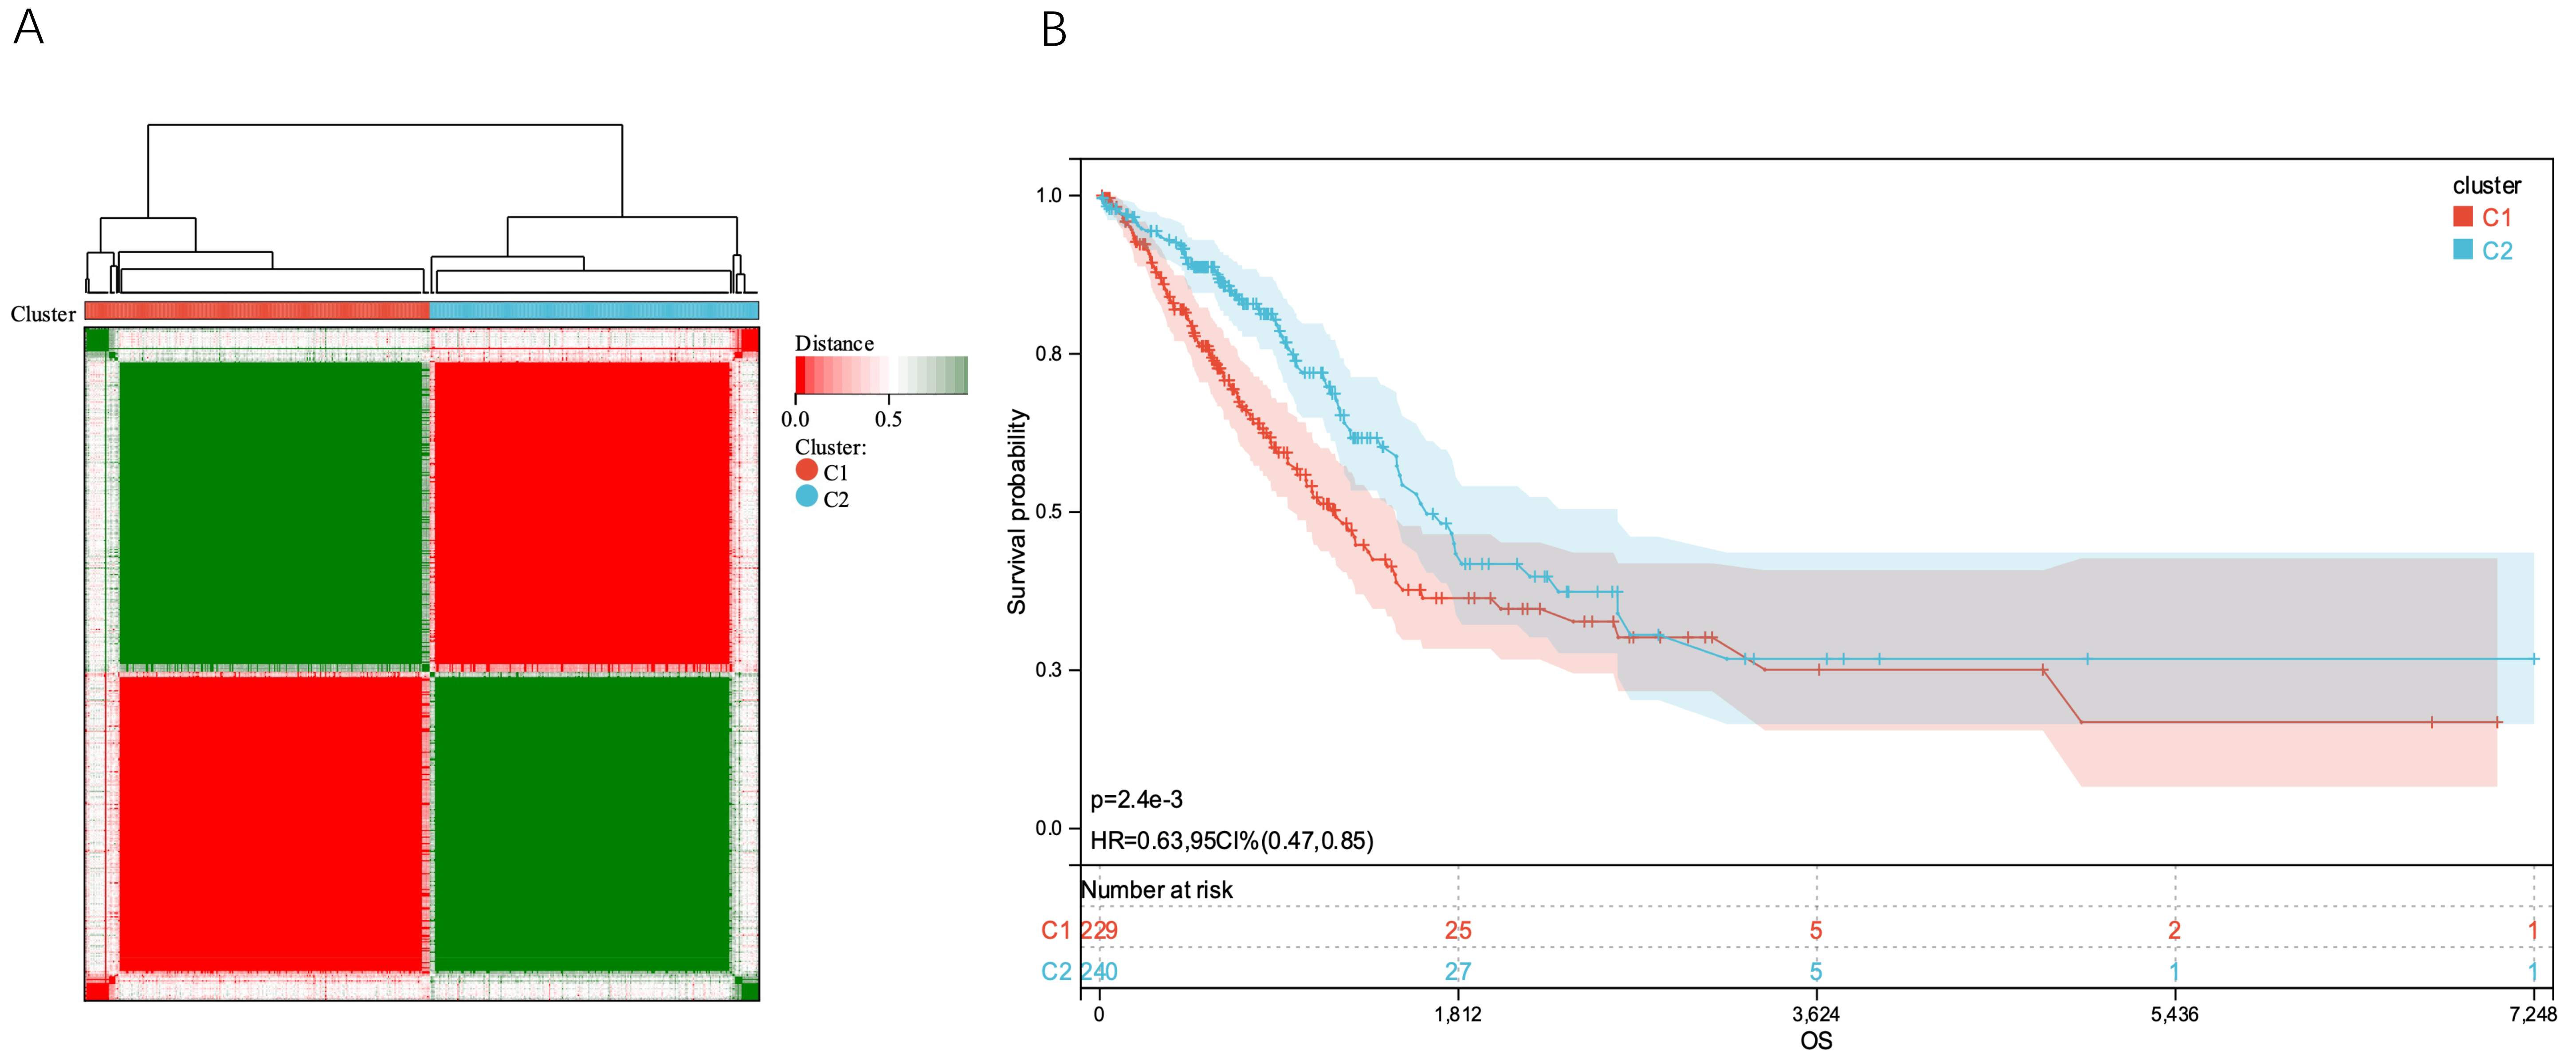 Fig. 3.
Tumor classification based on TM-DEGs. (A) 514 LUAD patients were divided into two groups according to the uniform cluster matrix (k = 2). (B) Kaplan - Meier OS curves for the two clusters. LUAD, lung adenocarcinoma; OS, overall survival.
Data on expression levels of TM-DEGs, survival time, and survival state were combined using the R software tool glmnet. The Lasso-Cox approach was used to create a prognostic signature (Fig. 4A–E).
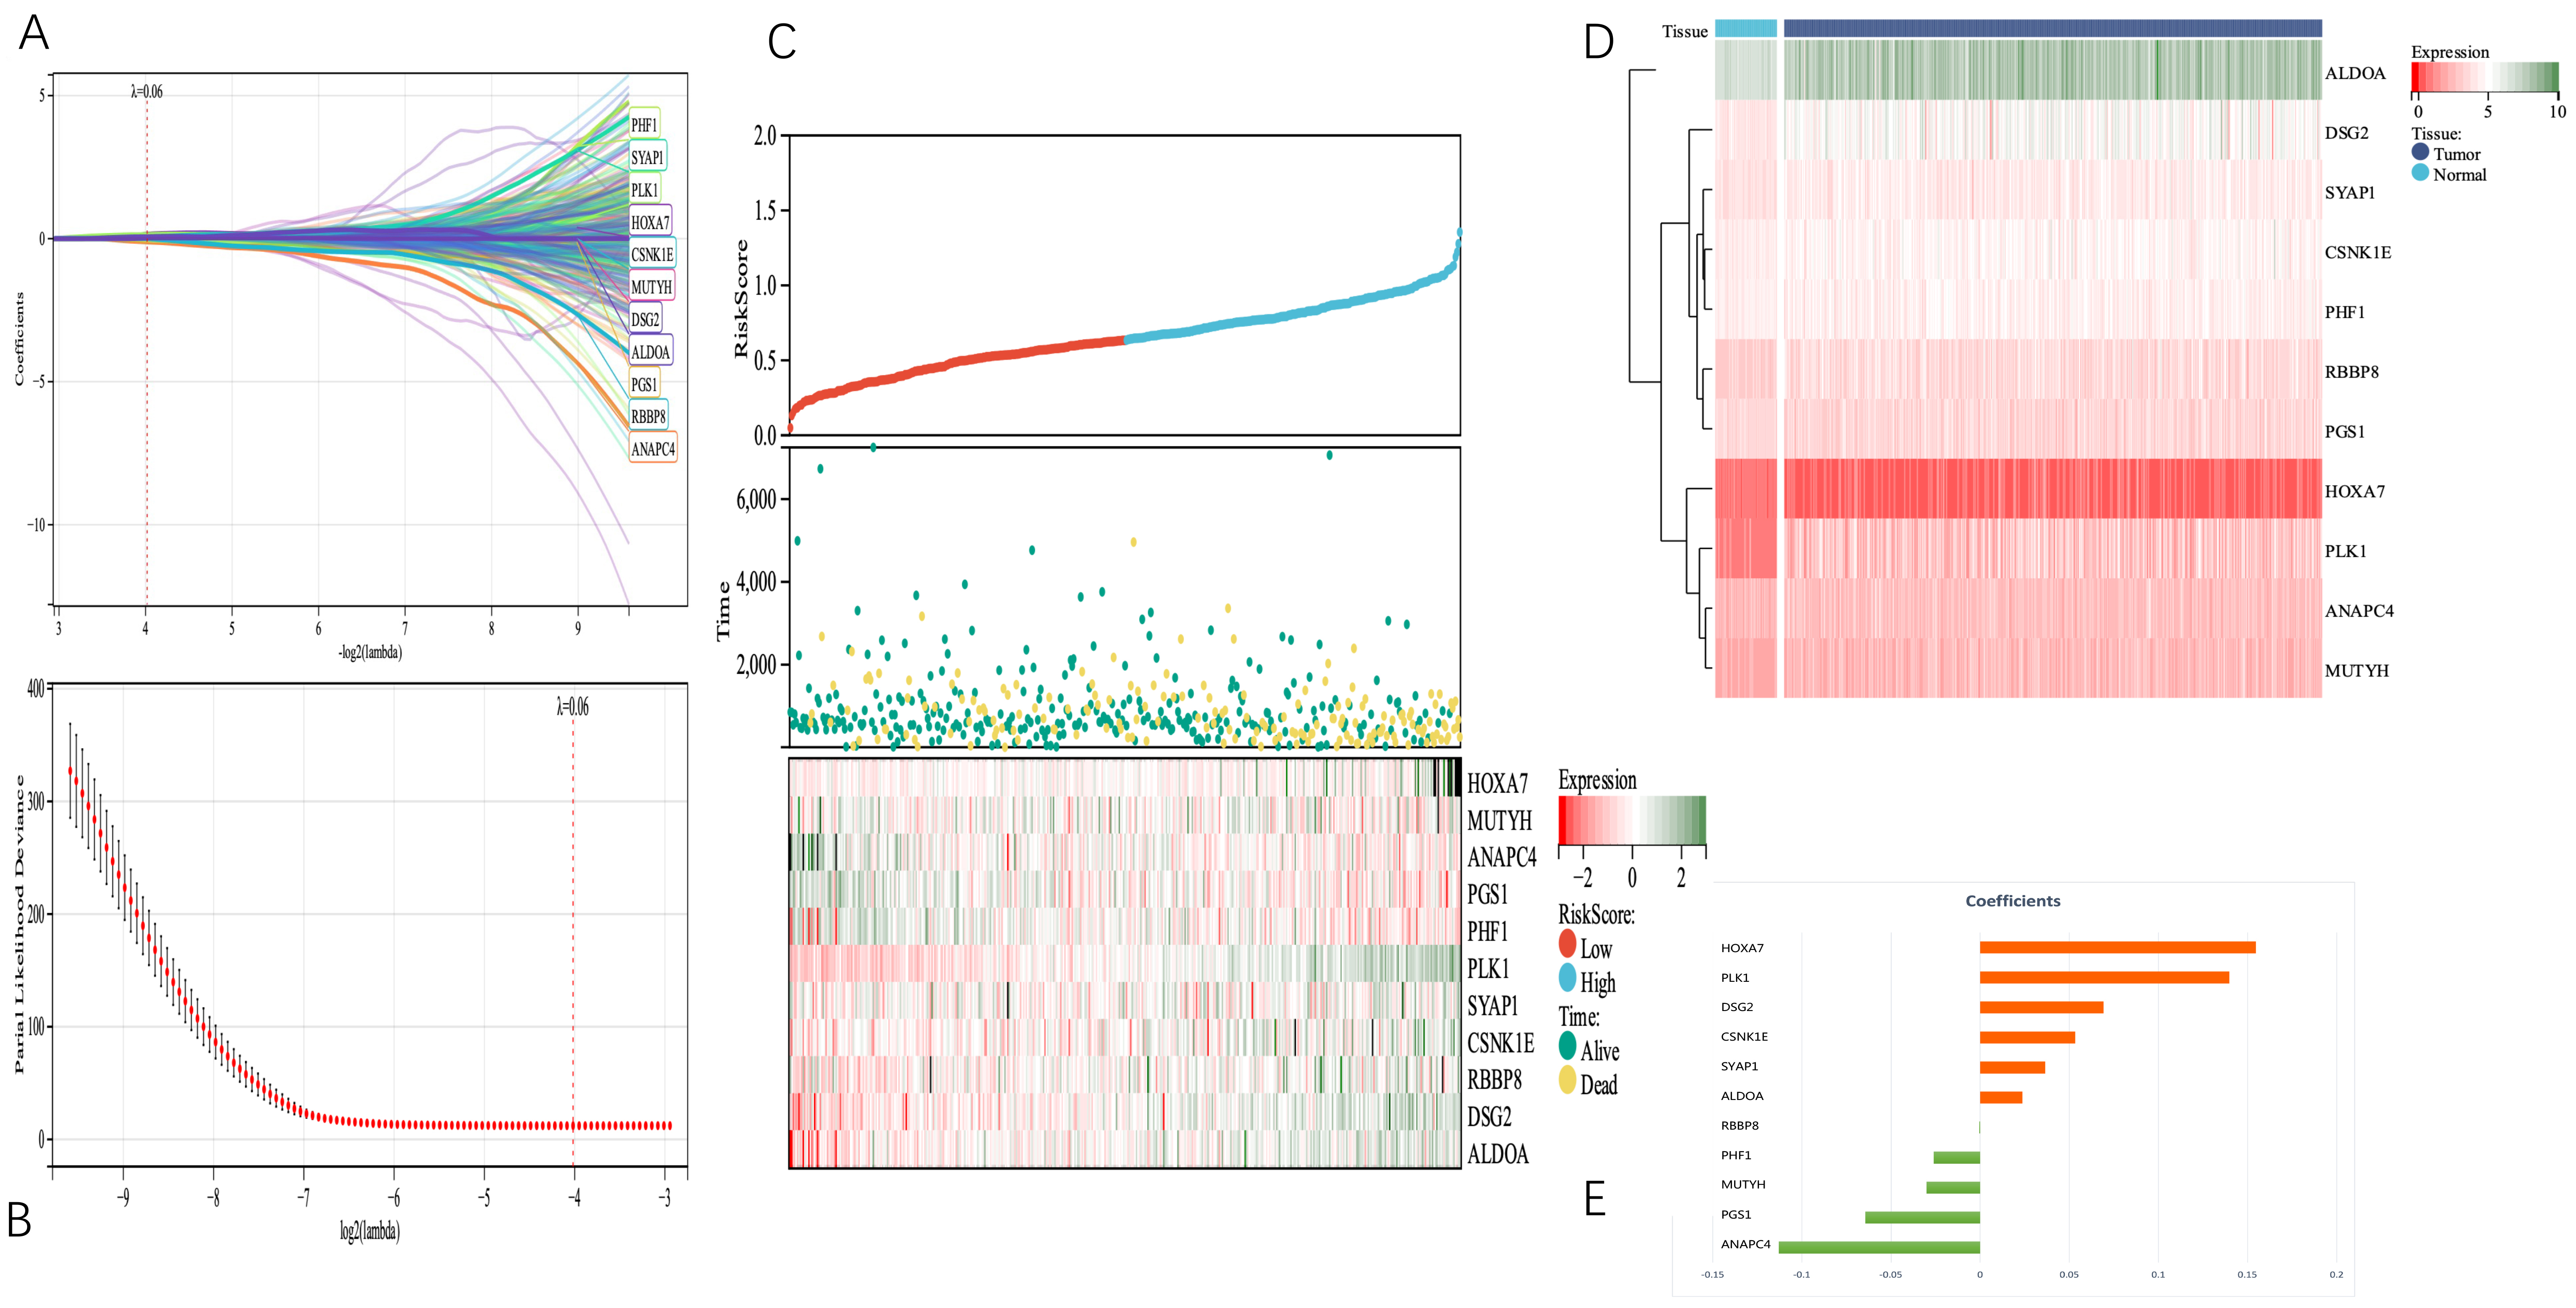 Fig. 4.
Telomerase-related genes associated with tumor survival in LUAD patients were identified from the TCGA cohort. (A) and (B) 11 TM genes associated with OS were identified by LASSO regression and cross-validation. (C) Distribution of telomerase-associated gene risk score (TMGsig), survival status, and 11 prognostic TMG expression levels in LUAD patients in the TCGA cohort. (D) The heat map showed the expression of 11 TM genes in tumor and normal tissues. (E) Coefficients of the 11 screened telomerase-related genes (TMGs) in the Lasso Cox regression model. LASSO, least absolute shrinkage and selection operator; TCGA, The Cancer Genome Atlas.
We set the Lambda value to 0.0617426400041608, and obtained the following model formula for the construction based on the 11 identified genes:
riskscore = 0.1547
Additionally, the Cox method was used to examine the prognostic significance of TM-DEGs in 469 samples, These findings suggest that the risk score and Tumor-Node-Metastasis (TNM) stage were independent prognostic factors (Fig. 5).
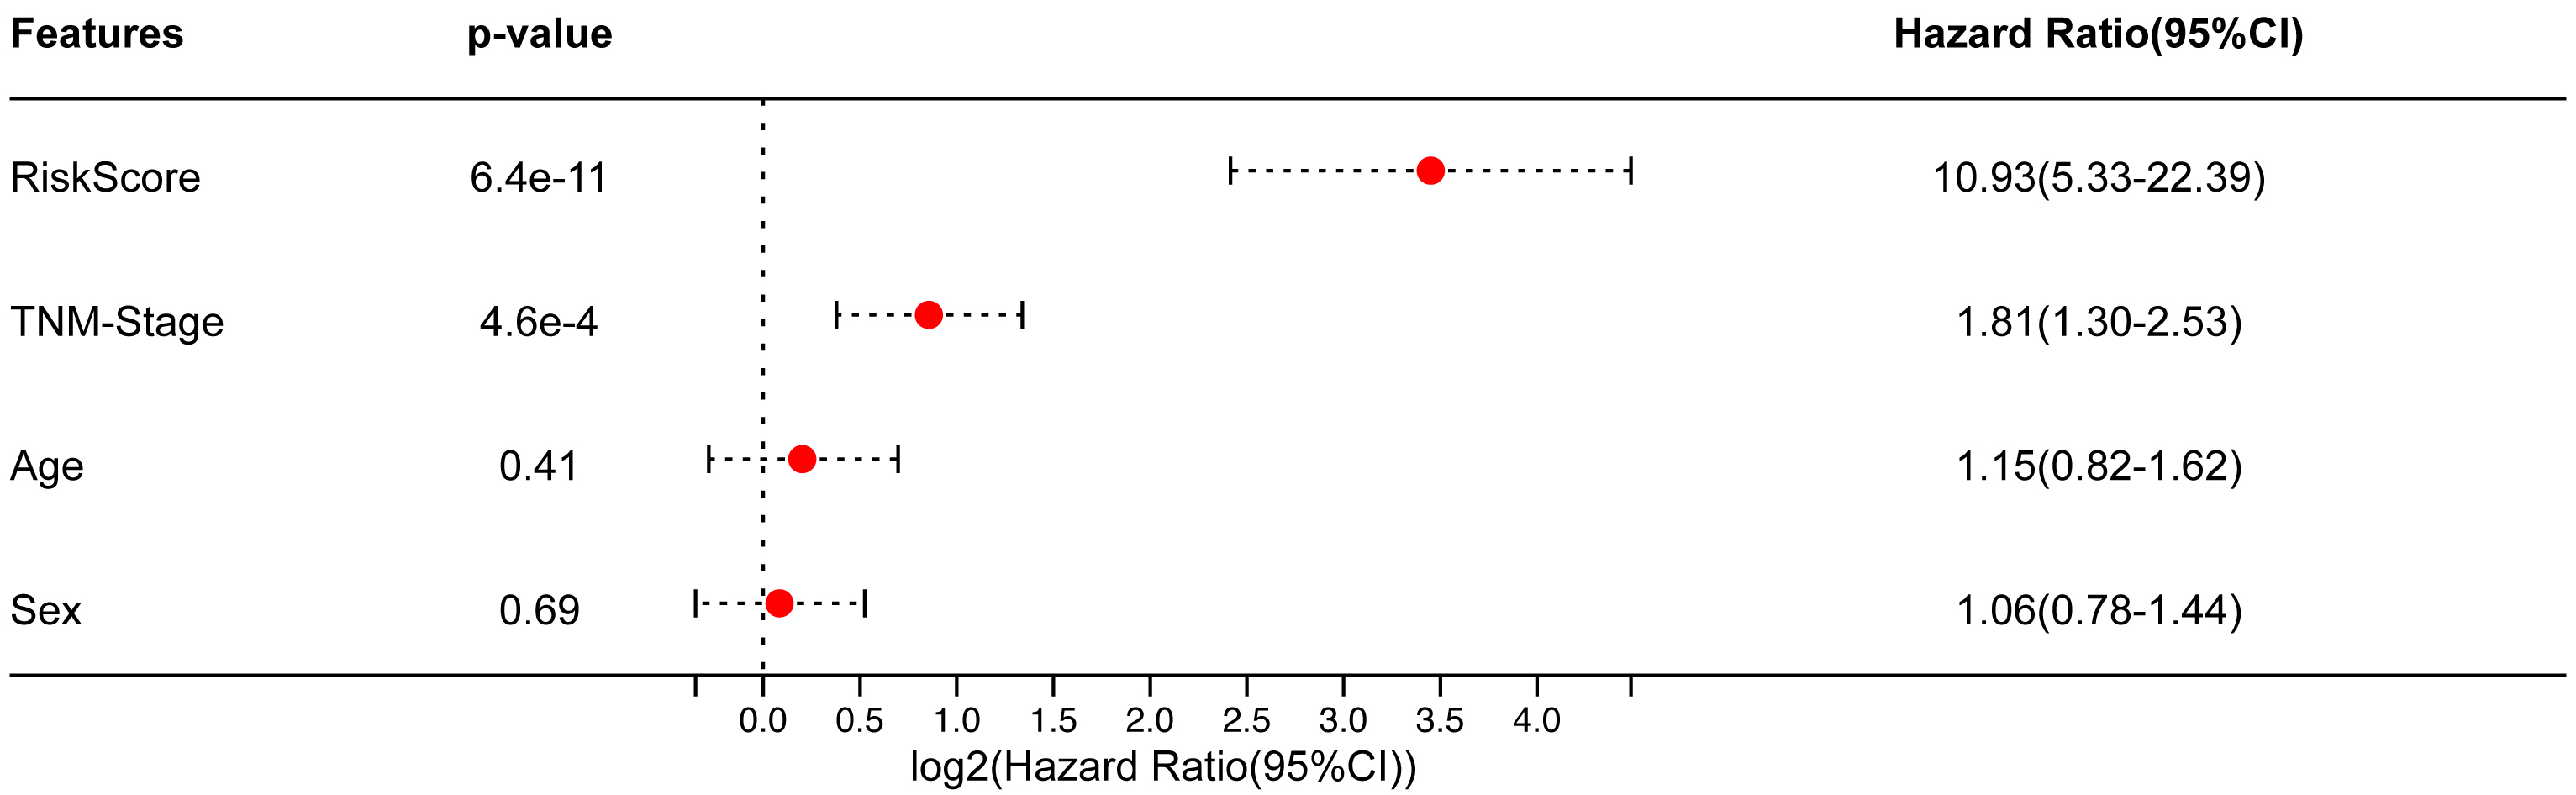 Fig. 5.
In the TCGA-LUAD cohort, multivariate Cox results.
Based on this, the patients were divided into high- and low-risk groups, and we
discovered a statistically significant difference in prognosis (p = 1.1
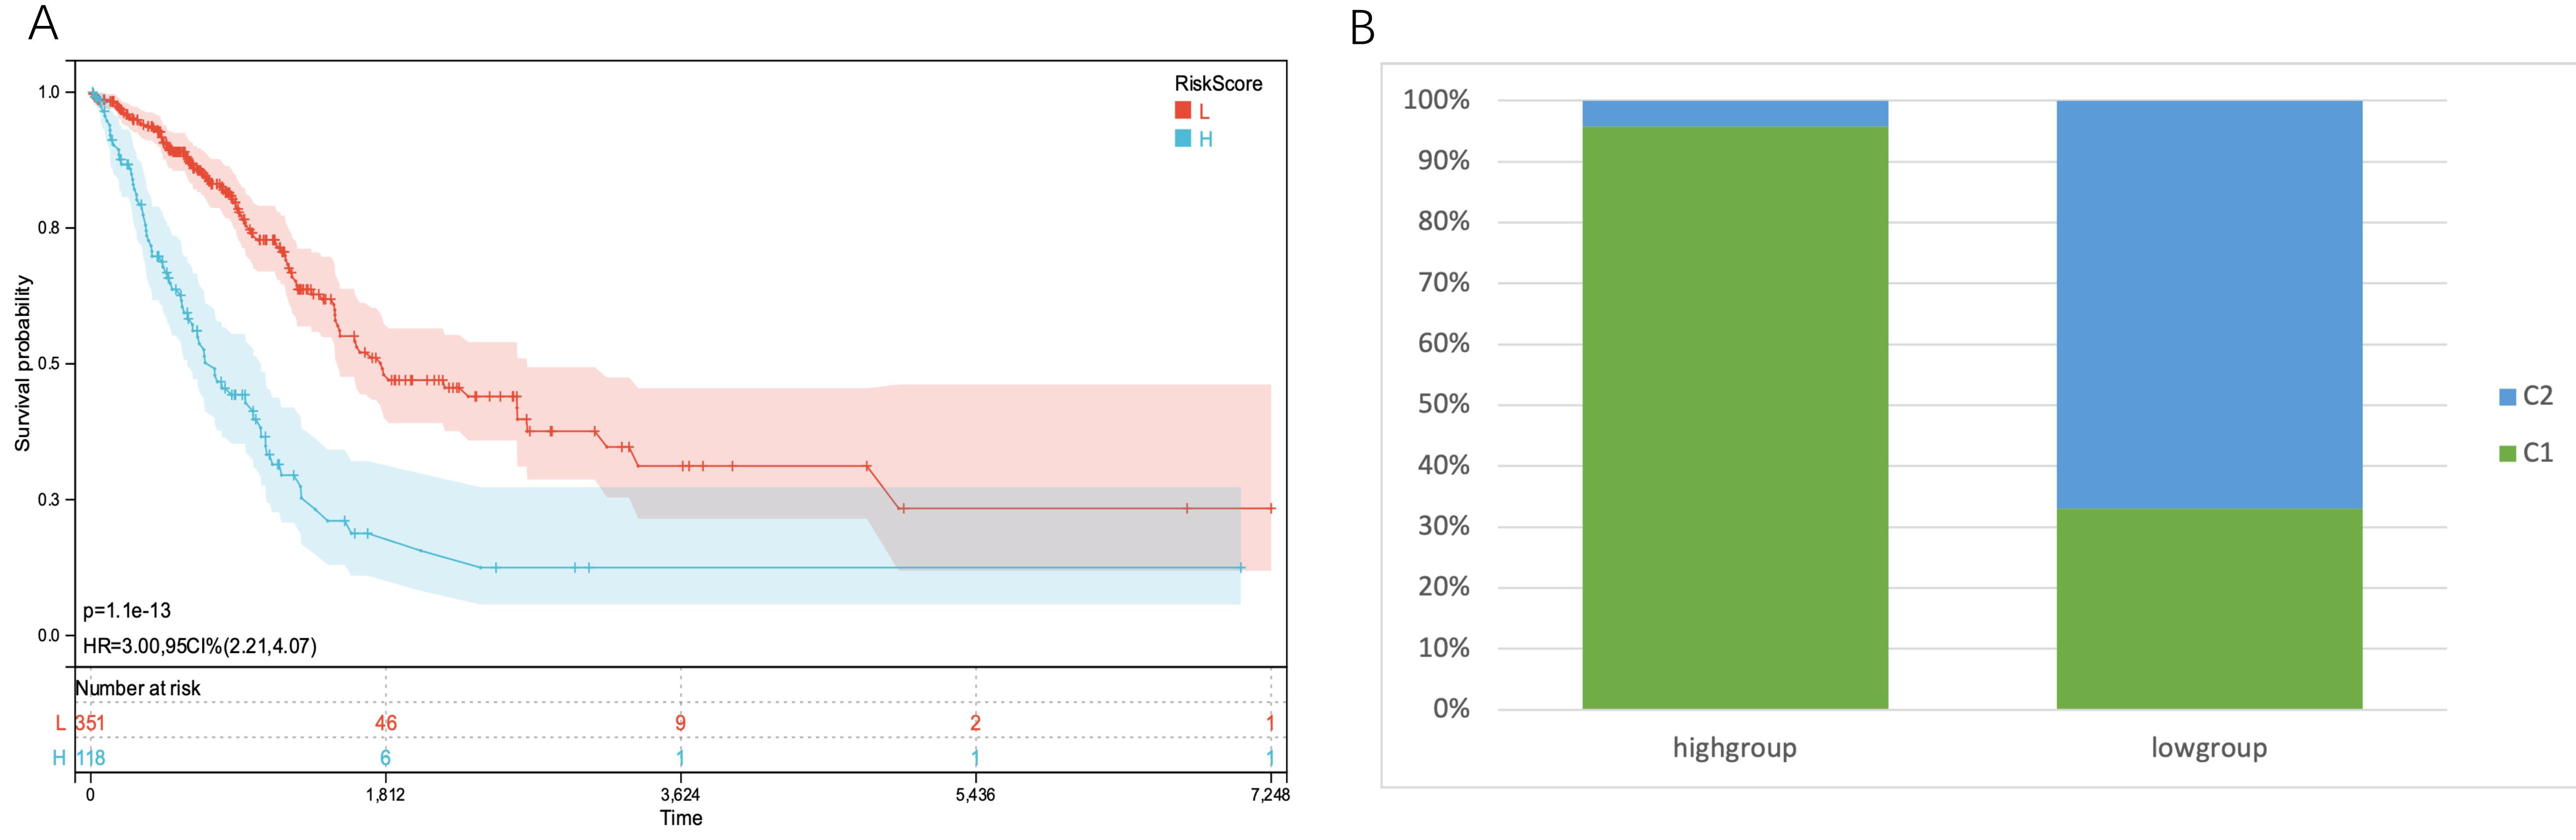 Fig. 6.
KM curves of the two subgroups and the proportion of subtypes
identified by clustering in the two groups. (A) In the TCGA-LUAD cohort, the KM
curves of patients with high TMGsig risk scores and patients with low TMGsig
showed apparent differences, and patients with high-risk score had a poorer
prognosis. p-value = 1.1
ROC analyses were conducted at time points 365, 1095, and 1825, yielding area under the curve (AUC) values of 0.71, 0.70, and 0.70, respectively (Fig. 7).
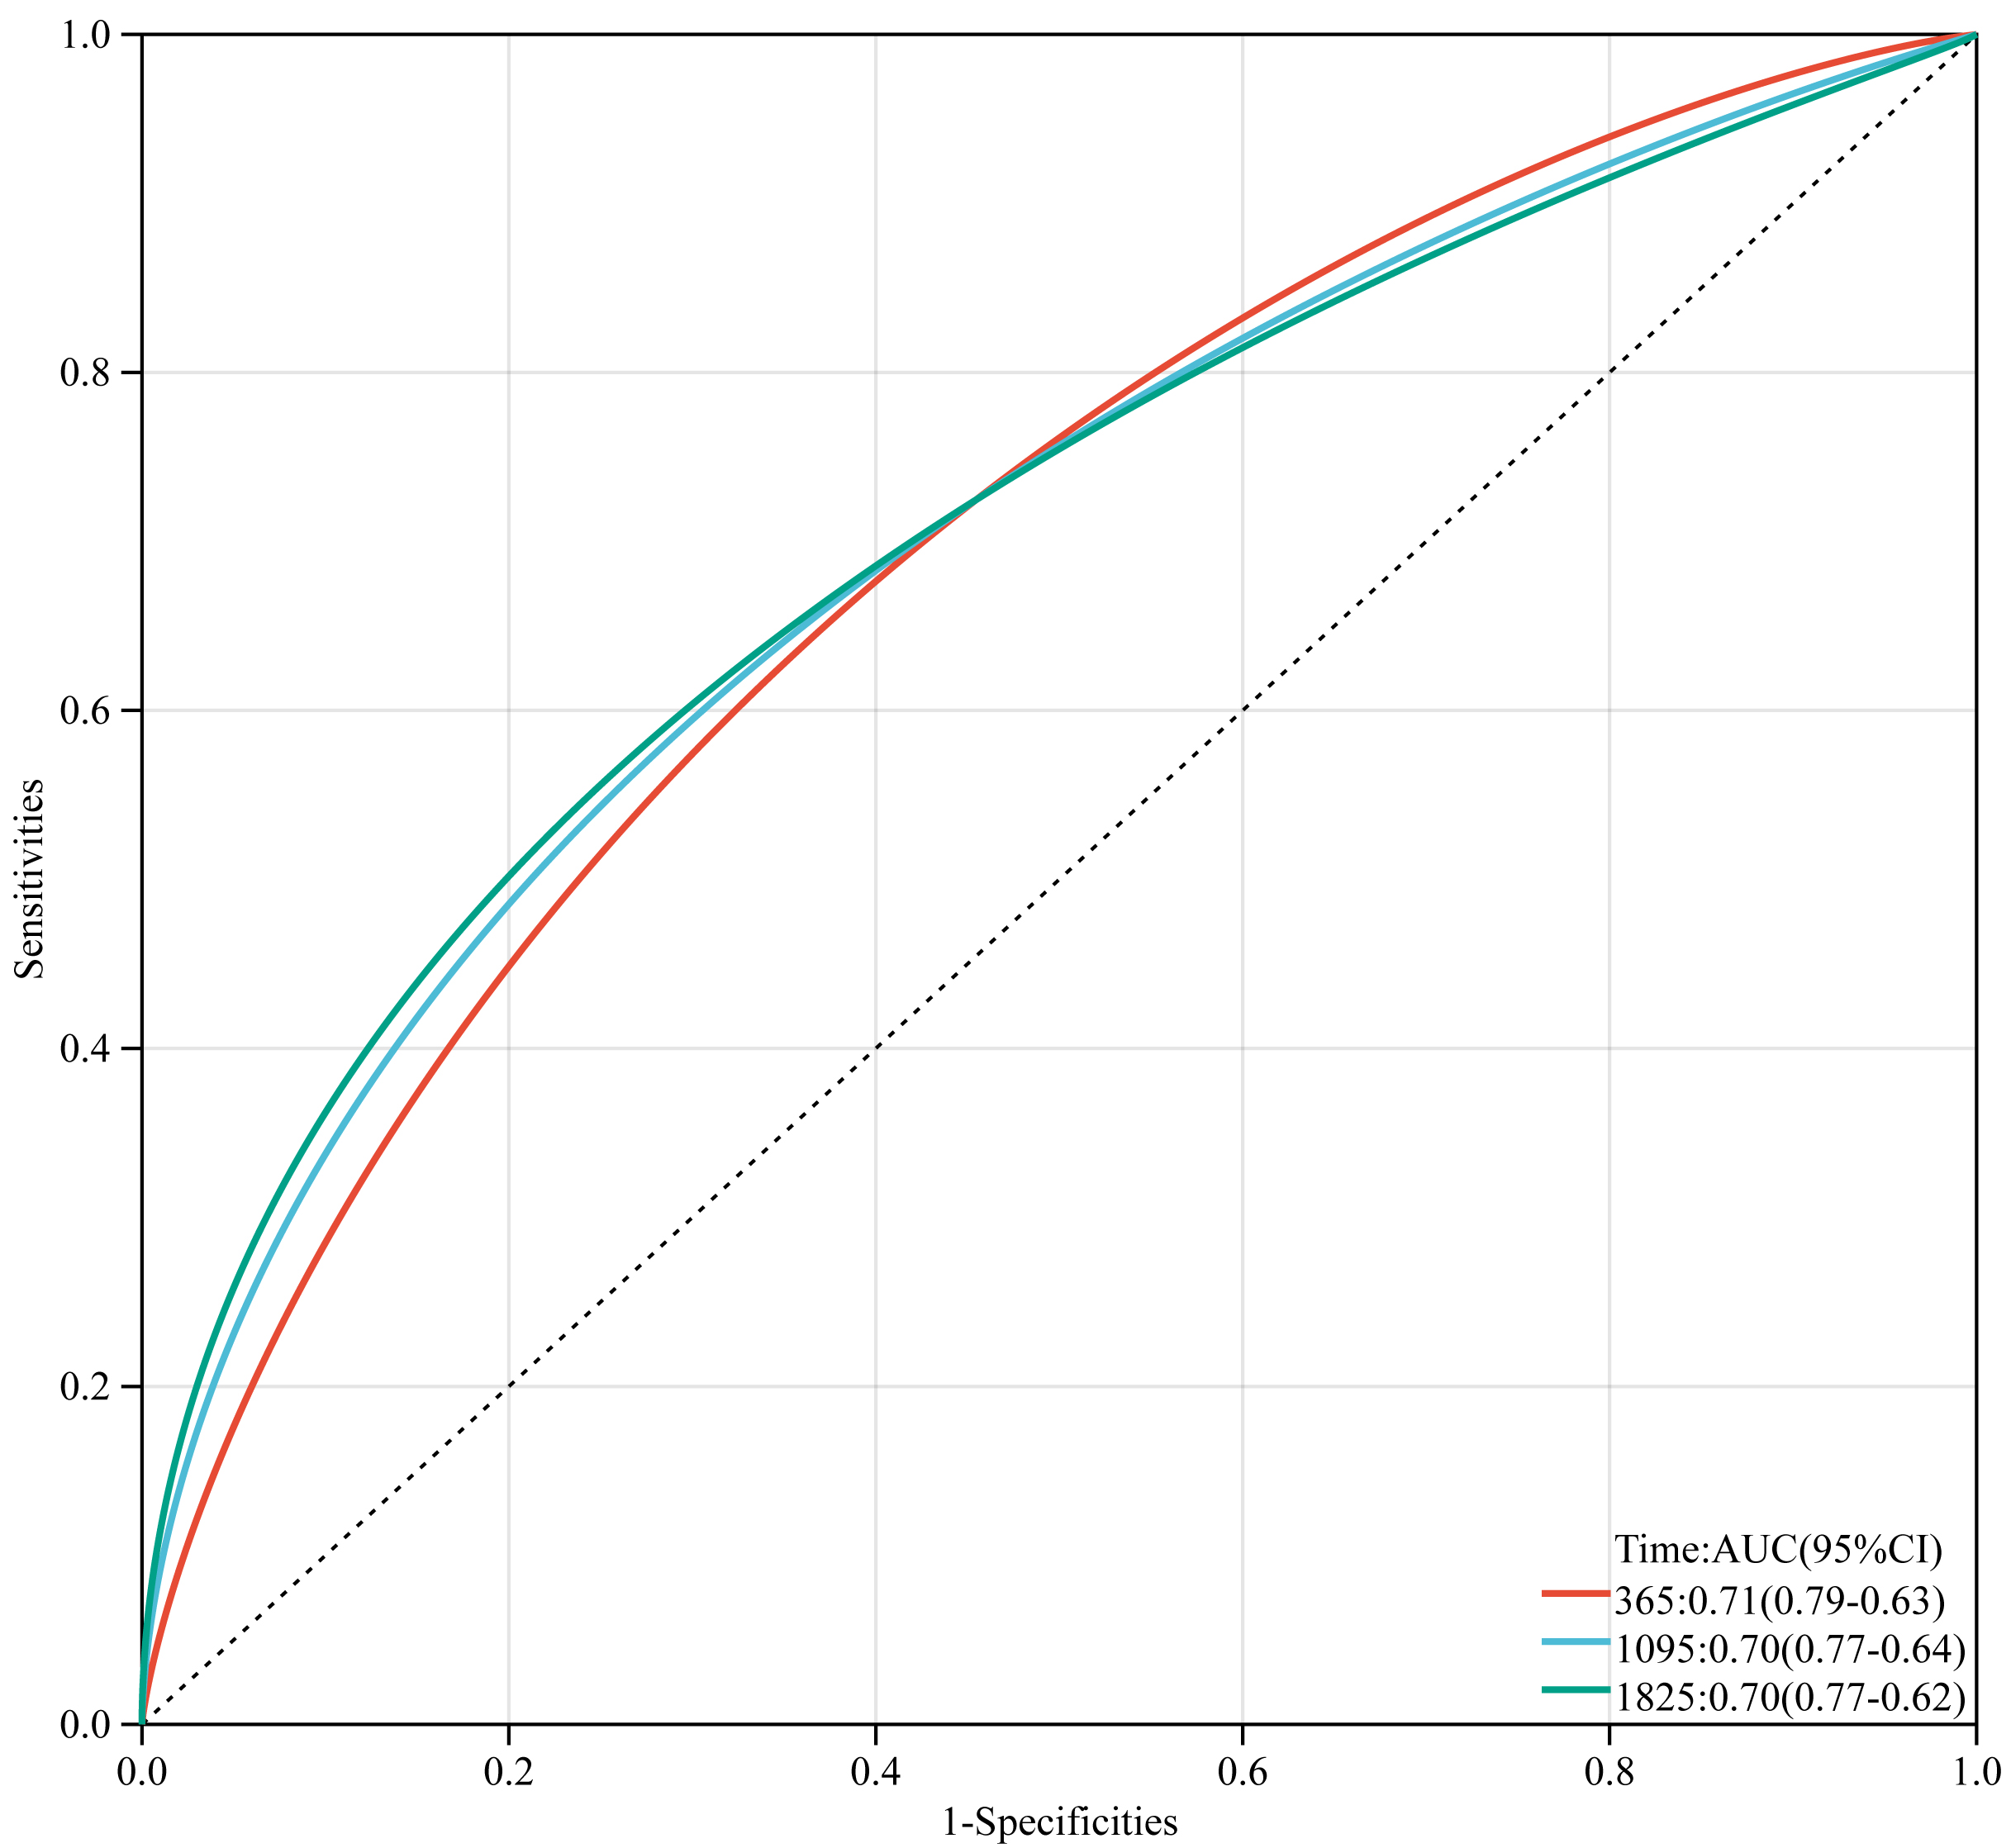 Fig. 7.
Time-dependent receiver operator characteristic curves of TMGsig in the TCGA training cohort.
By combining survival time data, survival status, age, TNM stage, and risk score, we created a
nomogram with Cox methods and the R software package rms to assess the predictive
value of these variables in 446 samples. The overall C-index of the model was
0.7097, 95% CI (0.6647–0.7548), p = 7.0453
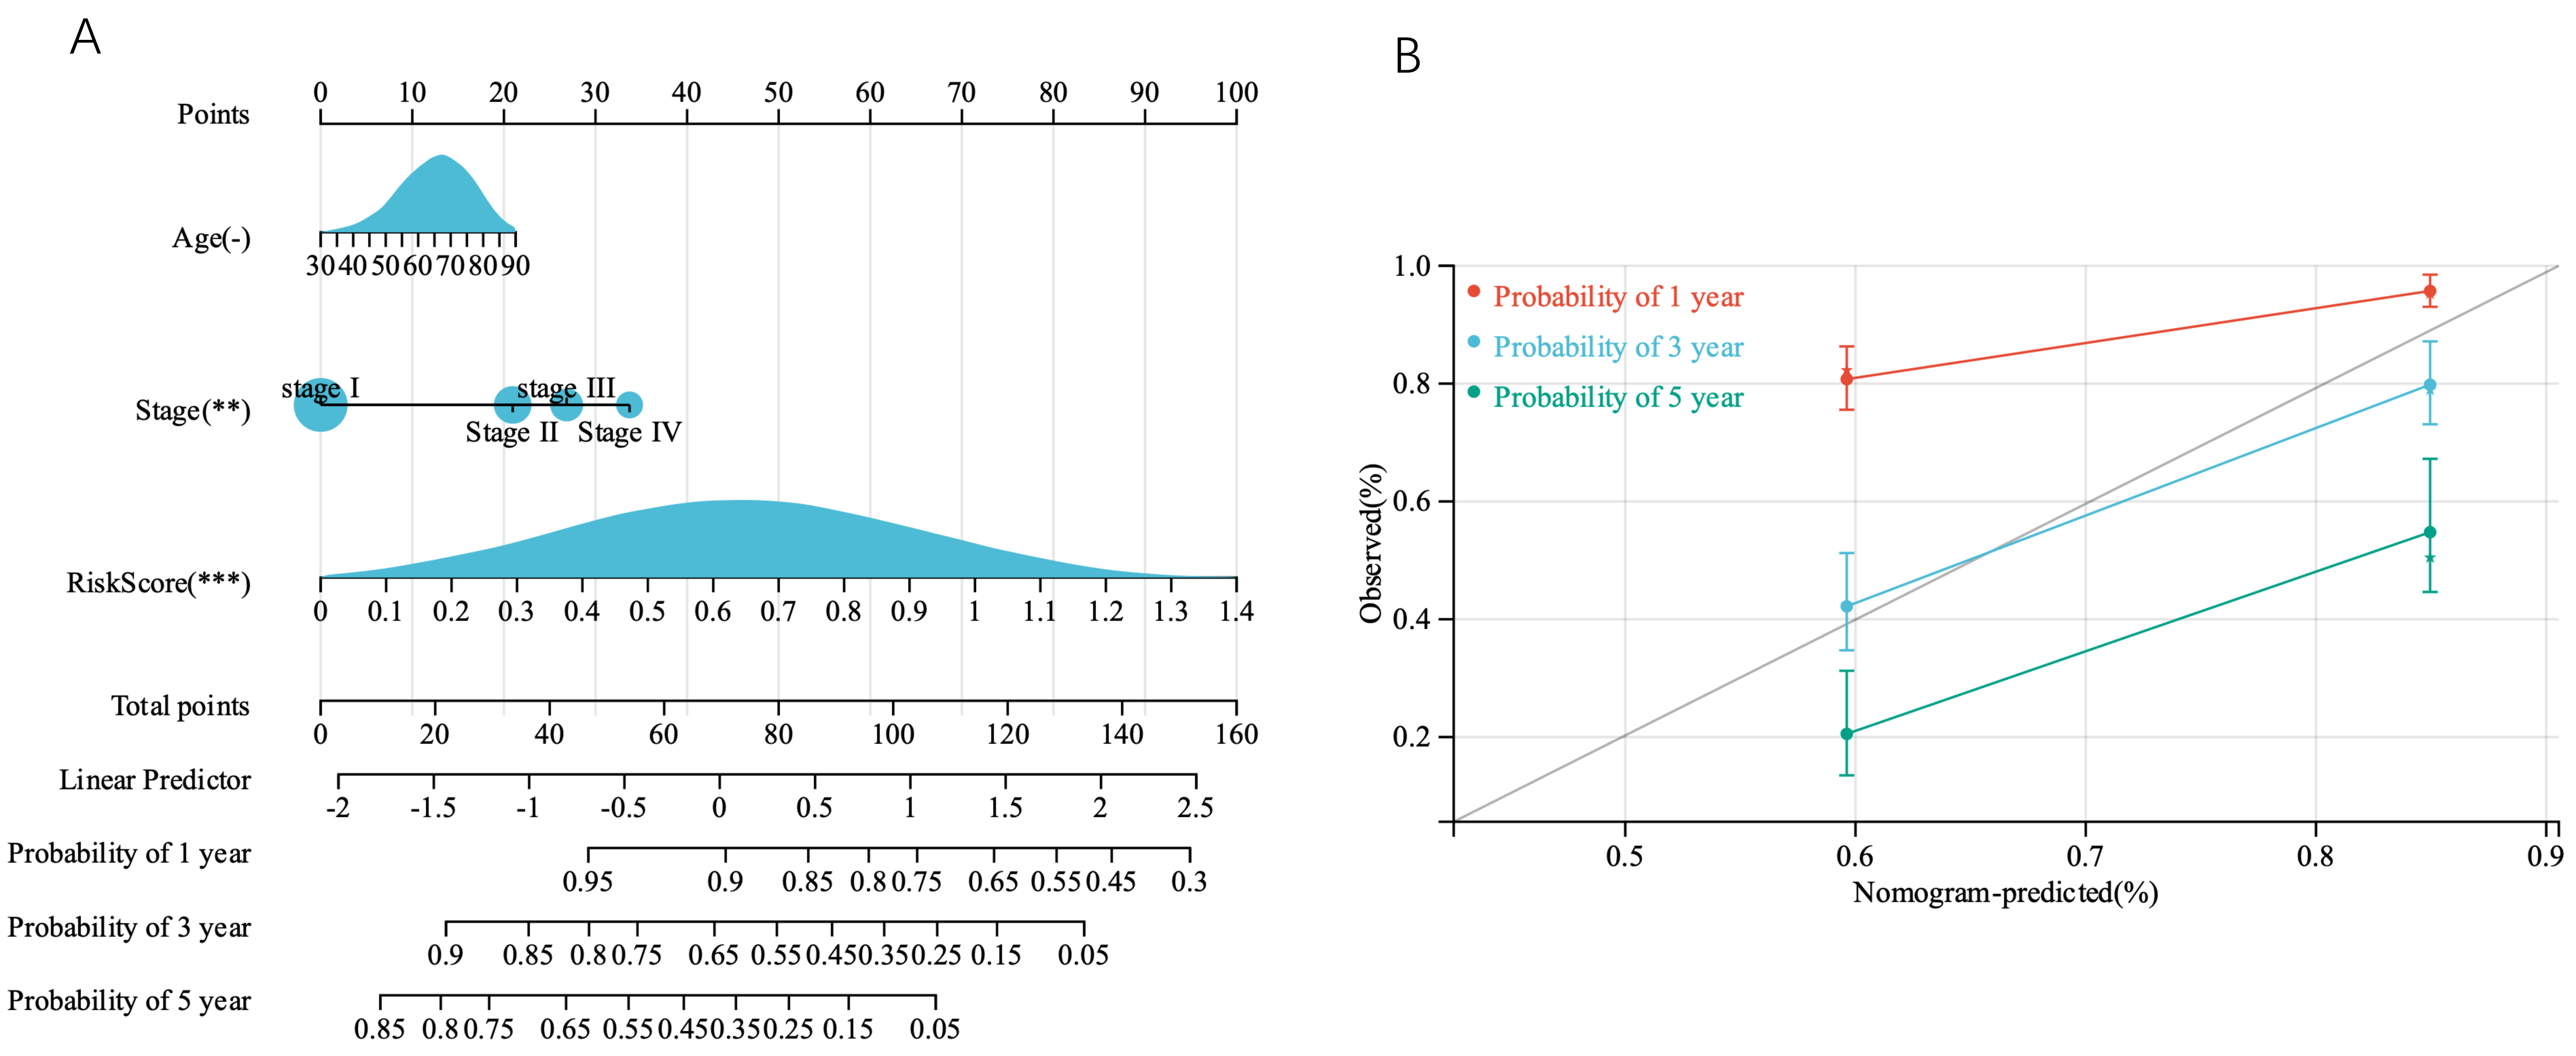 Fig. 8.
Construction and validation of the nomogram. (A) A prognostic nomogram based on the risk score derived from the prognostic TMGsig and the age TNMstage, to predict 1-, 3-, and 5-year survival in patients with LUAD. (B) Calibration curves adjusted for discrepancies between the predicted and observed 1-, 3-, and 5- years survival rates.
Eleven TMGs were found to be mainly enriched in the nucleoplasm, cellular response to DNA damage, catalytic activity, and acting on DNA functional regions, as determined by GO analysis. KEGG analysis revealed that they were primarily enriched in progesterone-mediated oocyte maturation, cell cycle, and oocyte meiosis (Fig. 9A,B).
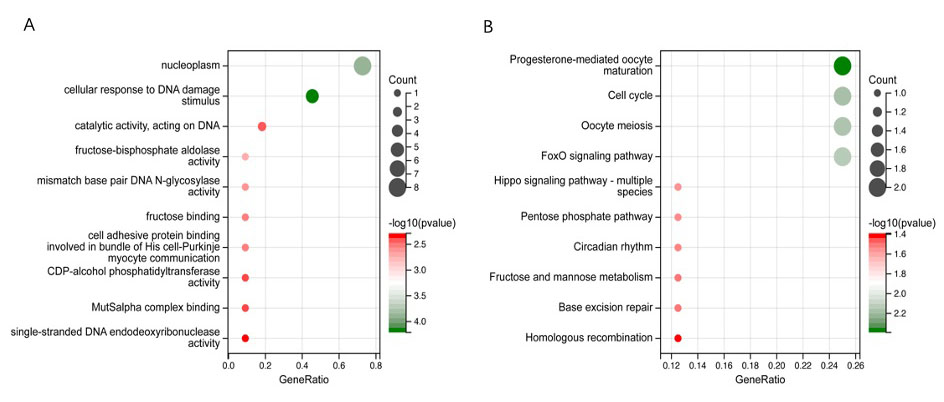 Fig. 9.
Functional enrichment analysis of 11 TMGs. (A) Gene Ontology (GO) signaling pathway enrichment analysis. (B) Kyoto Encyclopedia of Genes and Genomes (KEGG) signaling pathway enrichment analysis.
For external validation, we used three cohorts from the GEO database to further
validate the predictive value of the prediction signature. In the GSE31210 cohort
of 226 patients with stage I-II LUAD, individuals at high risk had significantly
shorter OS (p = 2.0
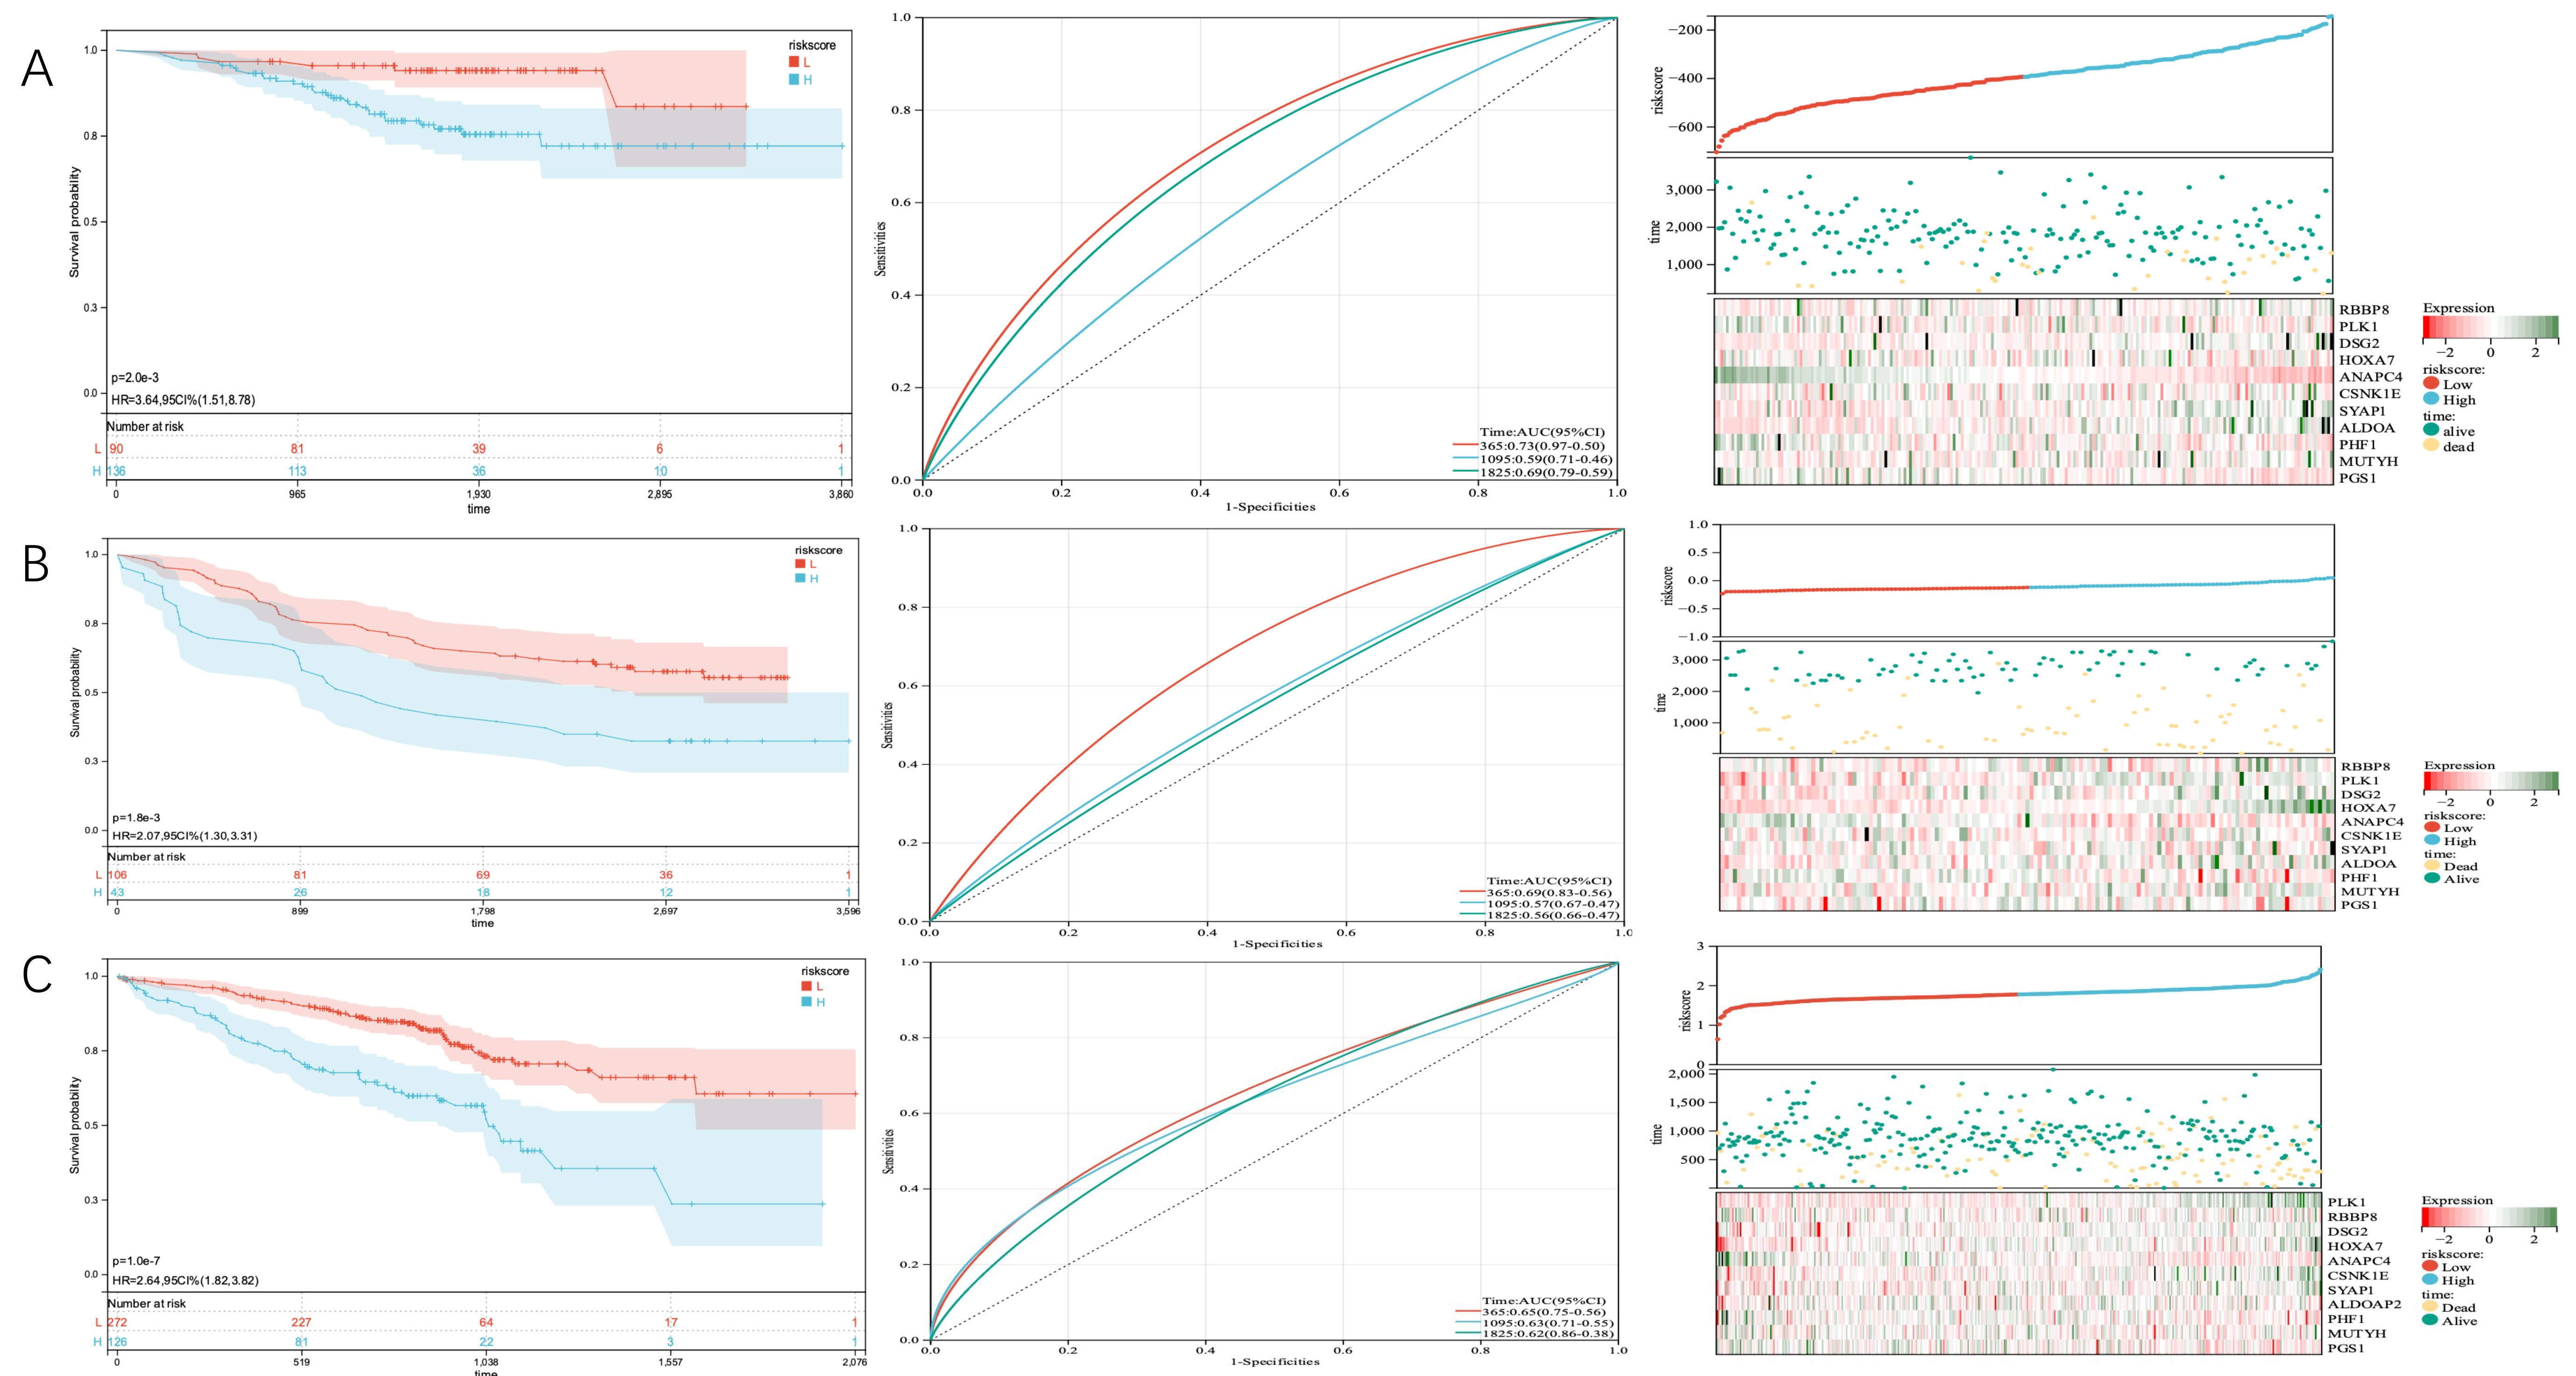 Fig. 10.
KM curves of OS according to TMGSig, distribution plots of patients, and time-dependent ROC curves of TMGsig in the GEO validation cohort. (A) The GSE31210 cohort. (B) The GSE11969 cohort. (C) The GSE70249 cohort. ROC, receiver operating characteristic; GEO, Gene Expression Omnibus.
We discovered that the cancer subtypes had distinct somatic mutant spectra. Although the most prevalent mutation types were consistent between the two groups, the relative frequencies differed between the different subtypes. The most common mutations in the high-risk group were TP53, TTN, CSMD3, RYR2, and MUC16, accounting for 62.5%, 62.6%, 50.4%, 48.7%, and 47.8% of the total number of mutations, respectively. In the low-risk group, the most common mutations were TP53, TTN, MUC16, CSMD3, and RYR2, accounting for 47.3%, 45.3%, 39.3%, 35.9%, and 35.2% of the total number of mutations, respectively (Fig. 11A,B).
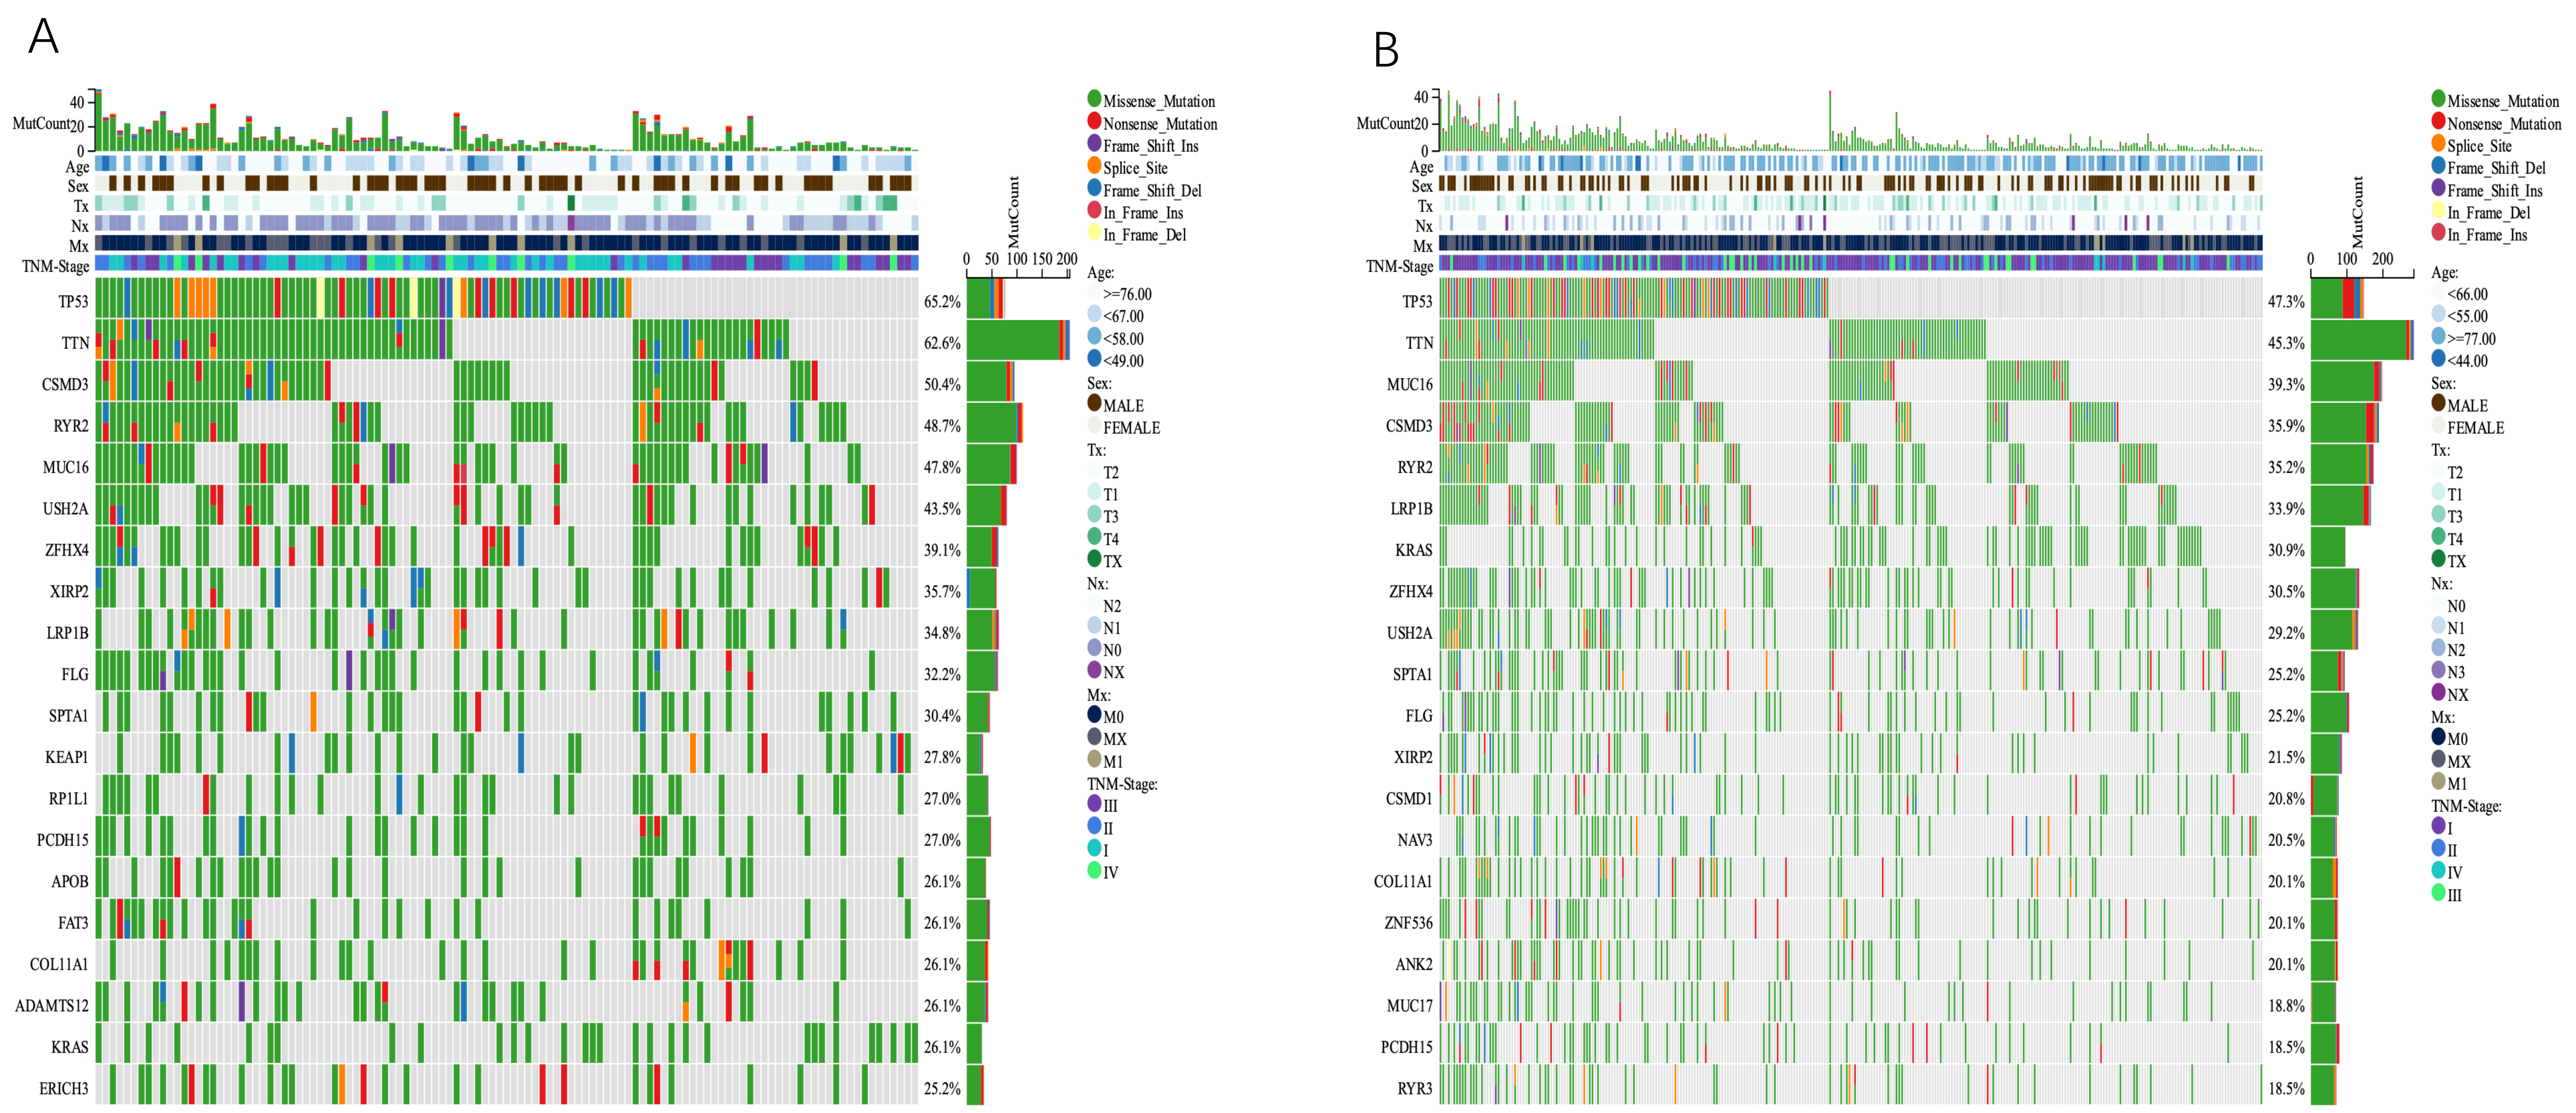 Fig. 11.
Comparison of somatic mutations between different TMGsig subtypes. (A) Ocoprint representation of the top 20 most frequently mutated genes in the TMGsig-high subtype. (B) Ocoprint representation of the top 20 most frequently mutated genes in the TMGsig-low subtype.
We then investigated the connection between TMGsig and the tumor microenvironment (TME). The TIMER algorithm revealed a negative correlation between activated CD8 cells, active CD4 cells, B cells, and myeloid dendritic cells in patients with high-risk scores. The quanTIseq algorithm revealed that high-risk scores were associated with B cells, NK cells, macrophages, activated CD8 cells, and Treg, but not with active CD4 cells (Fig. 12A,B).
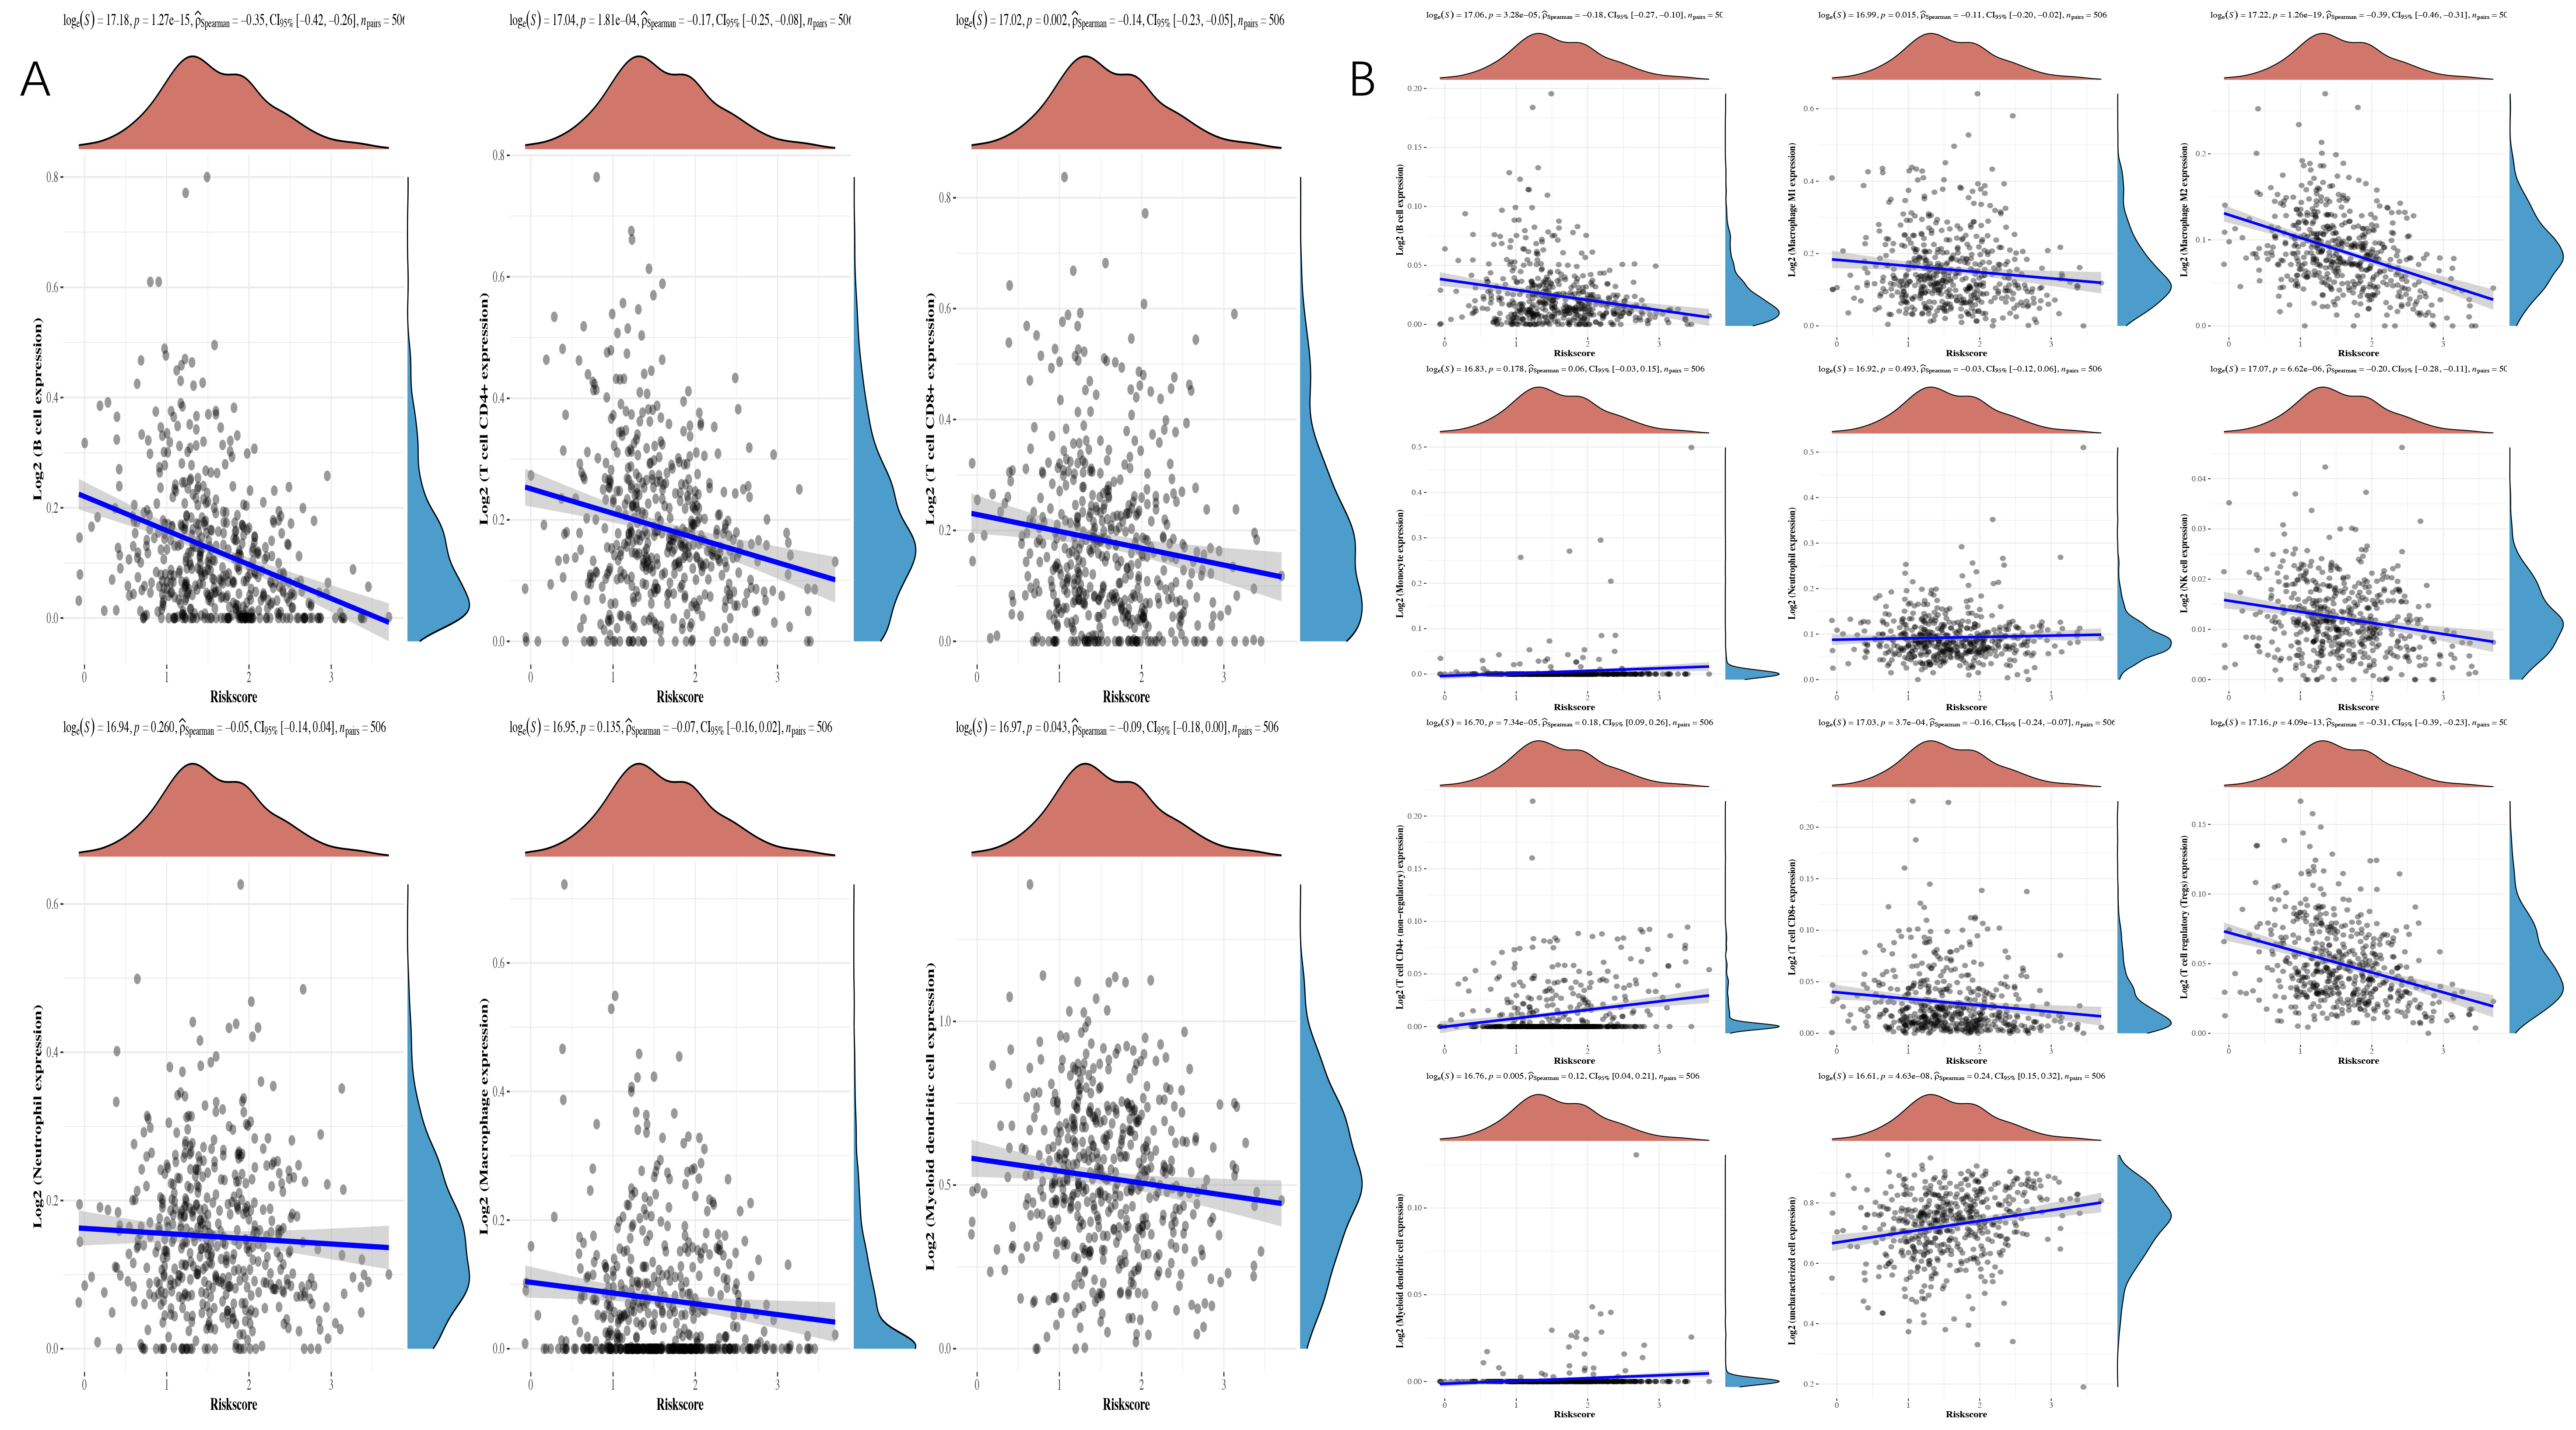 Fig. 12.
Spearman correlation analysis between risk score and immune score. (A) TIMER algorithm. (B) quanTIseq algorithm.
TME cell invasion is crucial to both carcinogenesis and treatment response. We looked at the frequency of several immune cell types in the high- and low-risk subgroups of the TCGA dataset to evaluate whether telomere-associated genes played major roles in the development of TMEs. Using TIMER and quanTIseq analysis of immune cell types, we found that there were significant distinctions between the two groups in terms of the characteristics of TME cell invasion. For example, we discovered statistically significant differences between B cells and CD4 cells, indicating higher expression levels in the low-risk group (Fig. 13A–F).
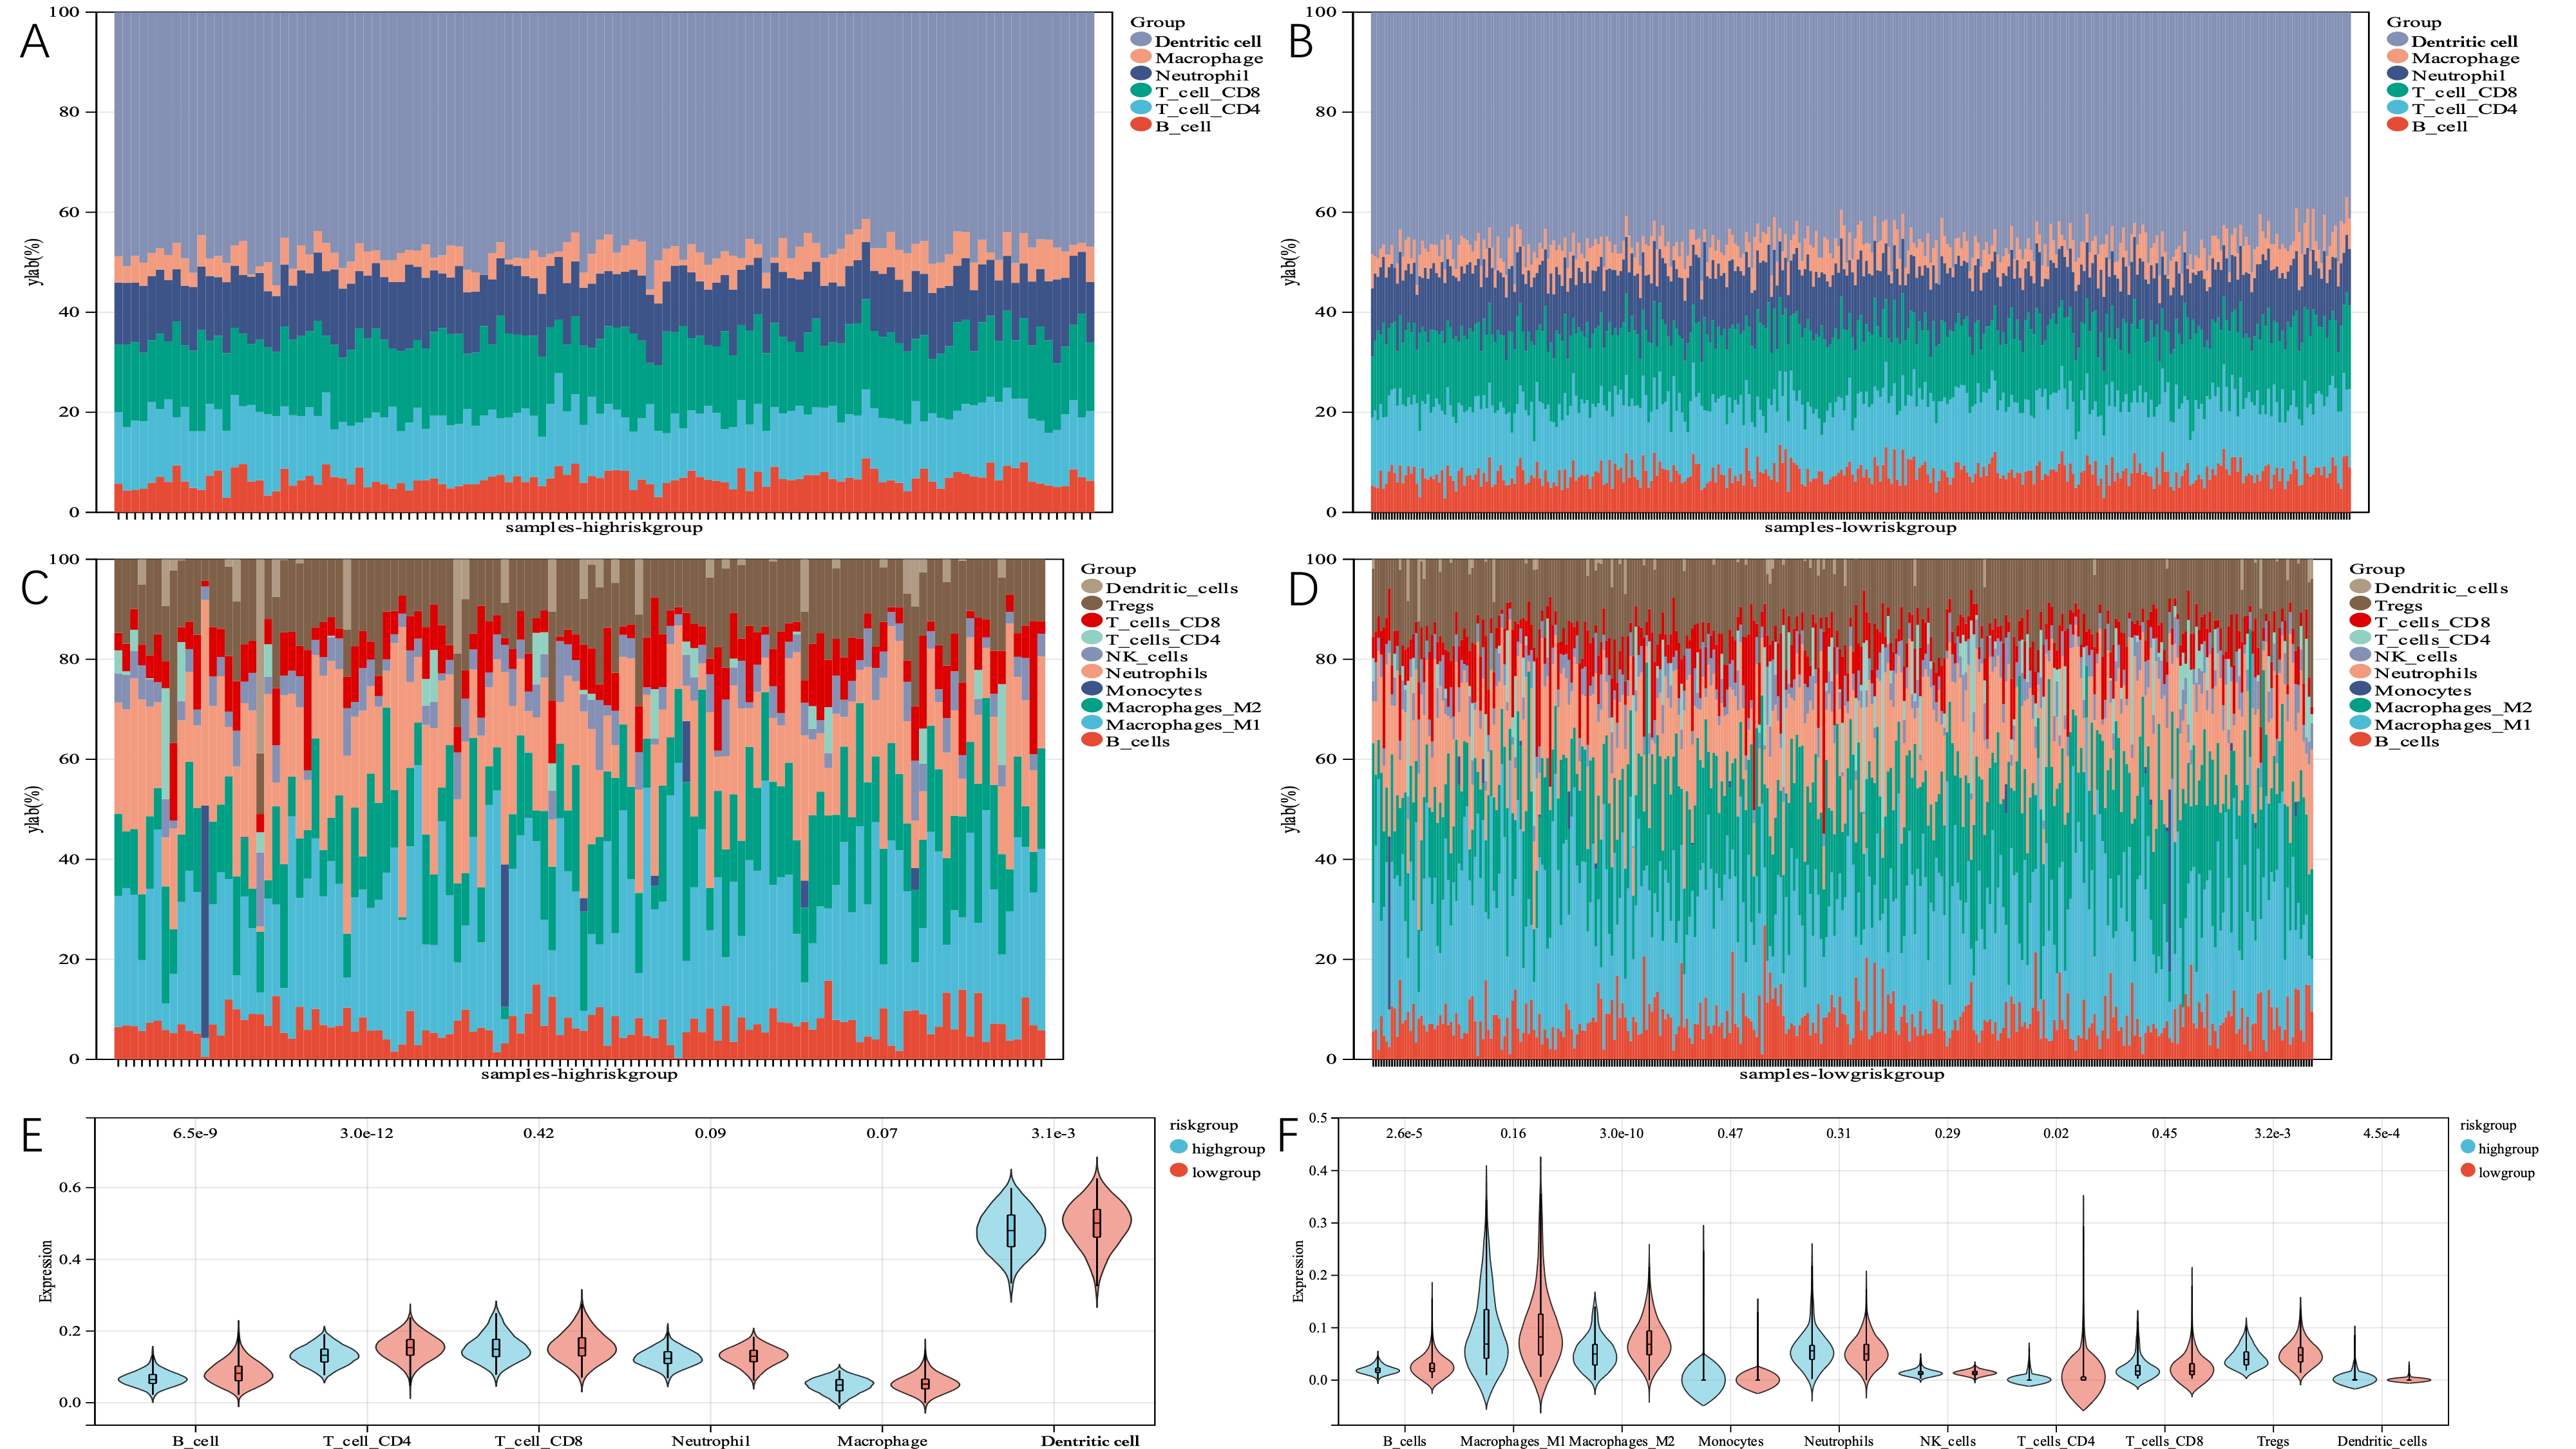 Fig. 13.
The immune landscape of TMGsig-high and TMGsig-low subtypes. (A) The relative abundance of 6 cell types in the high-risk score subgroup using the TIMER algorithm. (B) The relative abundance of 6 cell types in the low-risk score subgroup using the TIMER algorithm. (C) The relative abundance of 10 cell types in the high-risk score subgroups was calculated by the quanTIseq algorithm. (D) The relative abundance of 10 cell types in the low-risk score subgroups was calculated by the quanTIseq algorithm. (E) Boxplot was used to compare the differences in cell infiltration abundance between the two subgroups using the TIMER algorithm. (F) Boxplot was used to compare the differences in cell infiltration abundance between the two subgroups using the quanTIseq algorithm.
According to cancer statistics from 2021, lung cancer is the leading cause of cancer-related mortality in both men and women, accounting for over a quarter of all cancer-related deaths [15]. Low lung cancer survival rates are a result of a high percentage of patients (57%) having metastatic diseases by the time they are diagnosed.
When it comes to the development and prognosis of lung cancer, telomeres play a
significant role. Using a publicly available database, we developed and validated
a predictive signature, and then matched it to tumor immune microenvironments and
somatic mutations. The genes in the signature serve a variety of functions in
disease states. The Homeobox (HOX) gene family is closely associated
with various cellular processes related to homeostasis, as well as tissue repair
[16, 17]. Several studies have shown that aberrant expression of the HOX
gene is associated with the development of non-small cell lung cancer (NSCLC), as
well as abnormal histological variants of adenocarcinoma and squamous cell
carcinoma [18]. In one study on liver cancer, the HOXA7 gene, which is
part of the A cluster of chromosome 7, significantly enhanced proliferation,
migration, and invasion in vitro, as well as tumor growth and
metastasis [19]. This study found that the gene contributed the most as
a risk factor to risk score, indicating that a worse prognosis was linked to its
increased expression. Polo-like kinase 1 (PLK1) is the best-studied of
the four Polo-like kinase subtypes that are essential for mitosis. PLK1
expression is increased in various tumor cell lines, and is frequently associated
with a poor prognosis [20]. An increase in PLK1 activity leads to polyploid
production, which is related to the growth of tumors. As a member of the
classical cadherin family, Desmoglein 2 (DSG2) helps regulate
intercellular connectivity and promotes the assembly of desmosomes [21].
Desmosomes are connected to cell adhesion junctions, which are crucial for the
growth and invasion of cancer cells during tumor formation [22]. Studies have
shown that the knockout of the DSG2 gene can inhibit the proliferation
of NSCLC [23]. Casein kinase 1 epsilo (CSNK1E) is a circadian gene that
encodes DNA replication and repair-related members of the serine/threonine
protein kinases and casein kinase I protein families. However, in normal cells,
its primary function is to phosphorylate members of the Period family of
circadian proteins, thereby regulating the average rhythm of cell growth and
development. IC261, which has been reported to be a CSNK1E inhibitor in both
in vitro and in vivo studies, also inhibits microtubule
polymerization [24], which may lead to increased cancer cell death [25]. One
study suggested that the synergistic lethality between Tumor protein p53
(TP53) and CSNK1E is essential for the destruction of cancer cells [26].
Both activated WNT signaling [27] and TP53 inactivation [28] are often associated
with the development of cancerous tumors. Because TP53 is mutated in 50% of all
cancers, CSNK1E may be a promising drug target for patients with TP53
mutations. Currently, the majority of Synapse associated protein 1
(SYAP1) research focuses on nervous system diseases. There is evidence
that the DNA methylation and expression profiles of this gene differ between male
and female glioma patients [29]. As a member of the aldolase family, ALDOA is
highly expressed in various tissues such as gastric cancer [30], NSCLC [31],
breast cancer [32], and oral squamous cell carcinoma [33]. As an independent
prognostic factor, it is indicative of a poor prognosis [34, 35]. In lung cancer,
Aldolase, fructose-bisphosphate A (ALDOA) promotes tumor proliferation
and is closely related to HIF-1
This study divided TM-DEGs in LUAD patients into two clusters, by identifying
cluster consistencies. Our predictive analysis showed that the two patient
clusters had statistically different OSs, with cluster C1 patients having a
shorter mean OS time (p = 2.4
Our KEGG analysis of 11 TM-DEGs showed that they were particularly significant in the FoxO signaling pathway, progesterone-mediated oocyte maturation, and oocyte meiosis. In ovarian and age-related infertility, one of the factors that determine the success of IVF is telomeres. Fertilization will not succeed if the oocyte’s telomere length is shortened [49]. Pharmacological treatment of short telomeres has been used in various aging and degenerative diseases [50, 51], and follicular cells can be considered potential targets for treatments to improve aging oocytes by promoting increases in telomere lengths. Cancer, as an age-related disease, may also serve as a reference to the application of telomere therapy for aging diseases.
With the rapid development of tumor immunotherapy, lung cancer therapy has entered a new era of treatment. Based on the correlation between lung cancer, immunity, and telomeres, we continued to analyze the relationship between TMGsigs and TMEs. We found that risk scores were generally negatively correlated with immune cells, the most significant of which were B cells, macrophage M2 cells, and regulatory T cells. A team of researchers led by Alessio Lanna of University College London recently published an interesting study in Nature Cell Biology, detailing the mechanism whereby memory T cells extend their lifespans. They found that, during antigen presentation, antigen-presenting cells (APCs) actively “donate” their telomeres to T cells via vesicles, to help them prolong their lifespans [52]. Combined with the results of this study, the increase in risk score and the decrease in APCs, composed of B cells, dendritic cells, or macrophages, lead to the shortening of T cell lifespans, the decline of immune function, and worse prognoses for lung cancer patients.
Using the TCGA dataset, we created a telomere-related gene risk signature and validated it using three GEO datasets. The results showed that this signature was very good at distinguishing patients’ prognoses. Our findings demonstrate a correlation between TMG subtypes in LUAD and alterations in the immune TME. These findings may be advantageous for immunotherapy interventions in patients with LUAD.
The datasets presented in this study can be found in online repositories and additional inquiries can be directed to the corresponding author upon reasonable request.
First draft writing: XL and JL; Methodology: JW; Data analysis: XL and JL; Review and editing: XG and MD; Conception design and review: SS and JW; Data acquisition and assisted analysis: XG and MD. All authors contributed to editorial changes in the manuscript. All authors read and approved the final manuscript.
Not applicable.
Not applicable.
This research was funded by Jiangyin Science and Technology Bureau Social Development Science and Technology Demonstration Project, grant number JY0603A021014210005PB.
The authors declare no conflict of interest.
Publisher’s Note: IMR Press stays neutral with regard to jurisdictional claims in published maps and institutional affiliations.