


1 Department of Radiology, Azienda Ospedaliero Universitaria, 40138 Cagliari, Italy
2 Stroke Monitoring and Diagnostic Division, AtheroPoint™, Roseville, CA 95661, USA
3 School of Bioengineering Research and Sciences, Maharashtra Institute of Technology's Art, Design and Technology University, 412021 Pune, India
4 Department of Cardiology, Indraprastha APOLLO Hospitals, 110001 New Delhi, India
5 Department of Medicine, Division of Cardiology, Queen's University, Kingston, ON K7L 1C2, Canada
6 Department of Medicine, Division of Cardiology, University of Toronto, Toronto, ON M5S 1A1, Canada
7 Heart and Vascular Institute, Adventist Health St. Helena, St Helena, CA 94574, USA
8 Department of Vascular Surgery, Central Clinic of Athens, 11526 Athens, Greece
9 Invasive Cardiology Division, University of Szeged, 6725 Szeged, Hungary
10 Department of Radiology, Harvard Medical School, Boston, MA 02118, USA
11 Department of Vascular Surgery, University of Lisbon, 1600-209 Lisbon, Portugal
12 Department of Neurology & Stroke Program, University of Maryland, Baltimore, MD 21201, USA
13 Vascular Screening and Diagnostic Centre and University of Nicosia Medical School, 2368 Agios Dometios, Cyprus
14 Nephrology Department, Kaiser Permanente, Sacramento, CA 95823, USA
15 Department of Food Science and Technology, Graphic Era Deemed to be University, Dehradun, 248002 Uttarakhand, India
16 Department of Electrical and Computer Engineering, Idaho State University, Pocatello, ID 83209, USA
17 Department of Radiobiology and Molecular Genetics, National Institute of The Republic of Serbia, University of Belgrade, 11001 Belgrade, Serbia
18 Allergy, Clinical Immunology and Rheumatology Institute, Toronto, ON L4Z 4C4, Canada
19 MV Diabetes Centre, Royapuram, Chennai, 600013 Tamil Nadu, India
20 Department of Computer Engineering, Graphic Era Deemed to be University, 248002 Dehradun, India
Abstract
Background: Cardiovascular disease (CVD) is challenging to diagnose and
treat since symptoms appear late during the progression of atherosclerosis.
Conventional risk factors alone are not always sufficient to properly
categorize at-risk patients, and clinical risk scores are inadequate in
predicting cardiac events. Integrating genomic-based biomarkers (GBBM)
found in plasma/serum samples with novel non-invasive radiomics-based
biomarkers (RBBM) such as plaque area, plaque burden, and maximum plaque height
can improve composite CVD risk prediction in the pharmaceutical paradigm. These
biomarkers consider several pathways involved in the pathophysiology of
atherosclerosis disease leading to CVD. Objective: This review proposes
two hypotheses: (i) The composite biomarkers are strongly correlated and can be
used to detect the severity of CVD/Stroke precisely, and (ii) an
explainable artificial intelligence (XAI)-based composite risk
CVD/Stroke model with survival analysis using deep learning (DL) can predict in
preventive, precision, and personalized (aiP
Keywords
- cardiovascular disease
- stroke
- biomarkers
- radiomics
- genomics
- deep learning
- bias
- pruning
- cloud
- multicenter
- pharmaceutical
- explainable artificial intelligence
Cardiovascular diseases (CVD) kill 17.3 million people each year. This figure is
predicted to increase to 23.6 million by 2030 [1, 2]. By 2030, this will cost
Furthermore, the current design of the risk assessment tool lacks CVD risk stratification due to the non-linear behavior caused by the amalgamation of all the risk predictors [18]. However, the benefit to the drug industry in medication design has not been realized due to the absence of artificial intelligence (AI) methodologies, which leads to CVD risk stratification with different grades [19]. So, to achieve the above objectives, one certainly needs AI strategies for CVD risk assessment, particularly in big data or large cohorts [20, 21]. This requires composite CVD risk designs that can operate in batch (large cohort side) mode, sometimes called Pharma (Pharmaceutical) Mode, for automatically processing a large set of patients [22]. Previous studies conducted clinical trials but lacked AI-based solutions [22].
Further, it did not consider the composite risk of CVD stratification [23, 24]. Studies that did CVD also lack AI-based solutions [25]. Thus, there is a need for AI-based CVD composite risk in large cohorts for pharmaceutical companies to benefit from their drug design [26].
The Precision Medicine Initiative (PMI), introduced by former US President Obama in 2015, can potentially reduce the worldwide burden of CVD by mobilizing collective resources and expertise to develop and spread knowledge [27]. The precision medicine approach makes it possible to start treatments earlier, use more advanced diagnostics, and make treatments more personalized and affordable [28]. The precision medicine approach, with the help of AI, can improve symptom-driven care by proactively combining multi-omics assessments with clinical [28], imaging [29, 30], epidemiological [31], and demographic variables [32].
Precision medicine allows for earlier treatments for advanced diagnostics and tailoring better and more affordable personal treatment [29, 33, 34]. Advanced data analysis techniques are being employed more and more to aid in the development of successful CVD treatments [35]. Batch mode processing allows large data sets to be analyzed at once, facilitating a more thorough examination of patient risk factors and comorbidities to determine the best course of treatment [36]. Additionally, composite CVD risk stratification considers the combined effect of multiple risk factors to create a more comprehensive assessment of a patient’s risk [37]. Finally, the ability to categorize patients into different risk classes ranging from low to high allows for more personalized and effective treatment approaches to be developed based on a patient’s risk profile [38]. These tools provide valuable support to healthcare providers in managing CVD and improving patient outcomes. In this paragraph, we have to first give the spirit of using DL due to the success of DL in healthcare [39]. As a result, we propose that DL can be adapted for routine mode and pharmacological models for assessing CVD/Stroke risk.
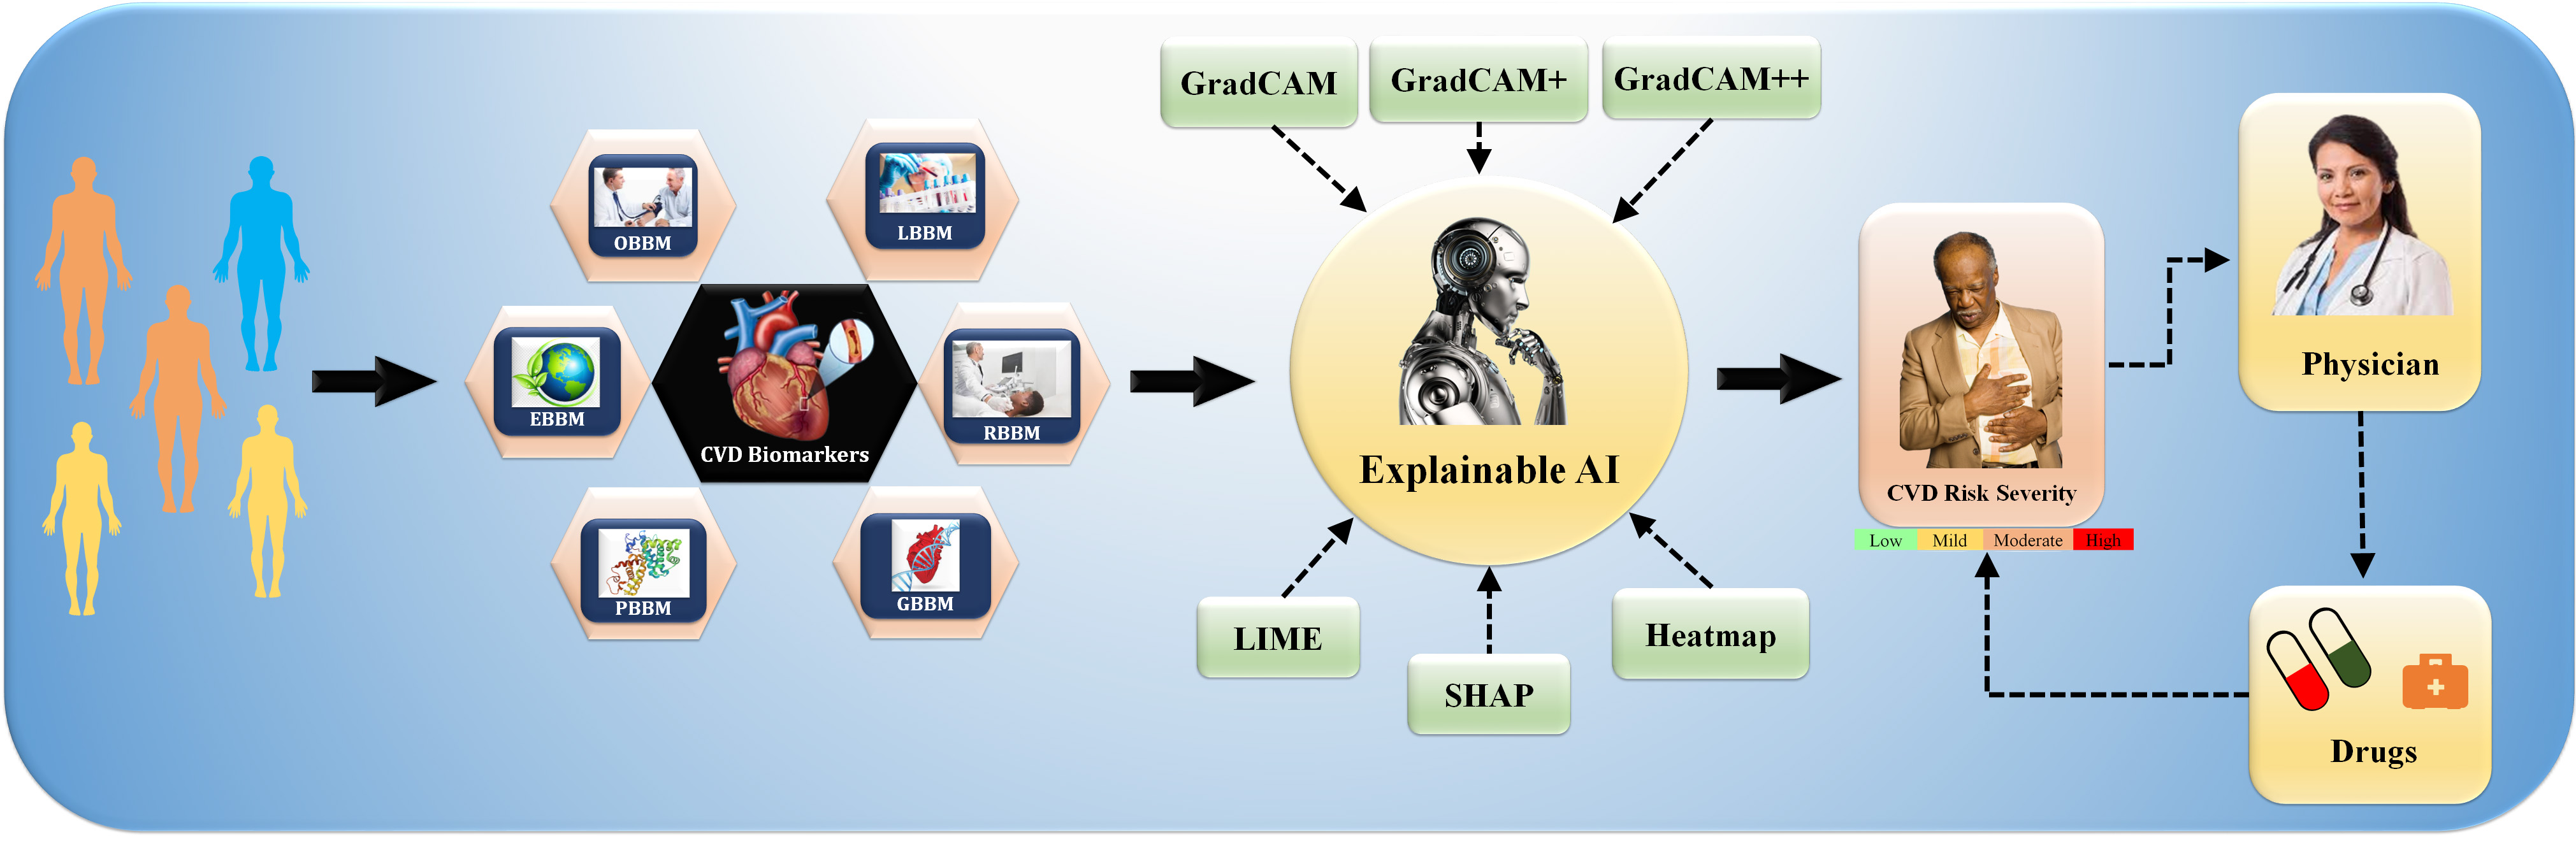
This study proposes deep learning (DL) to stratify the risk of CVD/Stroke using radiomics-based biomarker (RBBM) and genomics-based biomarker (GBBM) as covariates in pharmaceutical mode. The study also investigates pruned or compacted AI systems for CVD risk using multi-omics data and uses an explainability model to illuminate AI’s “Black Box Nature” [40]. Fig. 1 depicts the explainable AI (XAI) model integration of various CVD biomarkers, including (i) office-based biomarkers (OBBM), such as age, gender, ethnicity, BMI, hypertension, and smoking, (ii) laboratory-based biomarkers (LBBM), such as LDL, HDL, triglycerides, eGFR, and ESR, (iii) RBBM, such as plaque burden, cIMT, PA, and maximum each patient tries to help clinicians figure out how personalized medical information differences might affect health, so they can diagnose and plan the best way to treat the patient [41].
 Fig. 1.
An overview of composite biomarkers using the XAI model for CVD risk stratification in the pharmaceutical domain (Original image, AtheroPoint™ LLC, Roseville, CA, USA).
Finally, a cloud-based framework is implemented to make the results clinically
explainable [42] and accessible through telemedicine [43, 44]. The presented
study aims to reduce bias, increase compression, and achieve aiP
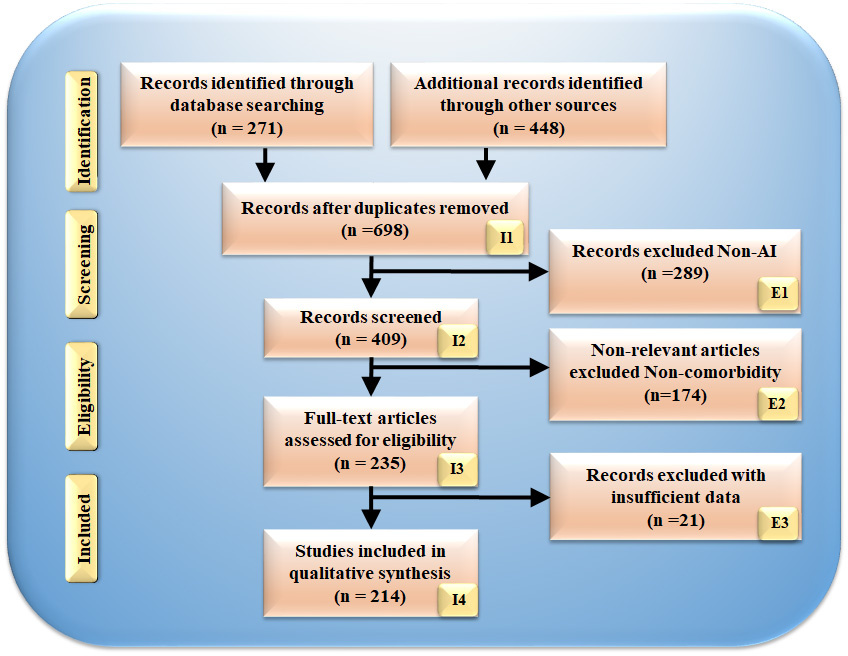
The search methodology employed the PRISMA framework, illustrated in Fig. 2; we employed various keywords to search for articles such as “cardiovascular disease”, “stroke”, “CVD”, “genomics and CVD”, “radiomics and CVD and pharmamode”, “radiomics and stroke”, “genomics and stroke batch mode”, “prevention medicine and clinical trial”, “preventive medicine and CVD”, “personalized medicine and artificial intelligence”, “atherosclerotic in genomics”, “radiomics and AI”, “genomics and radiomics”. Out of these 698 articles, 326 publications were considered, while 289 studies were excluded based on three criteria: unrelated research, irrelevant papers, and inadequate data. These criteria led to eliminating 289, 174, and 21 studies, as indicated by E1, E2, and E3 (Fig. 2), respectively, resulting in a final assessment of 214 studies. Our focus was solely on articles that linked CVD/Stroke with radiomics and GBBM. Studies investigating diseases, such as Parkinson’s, cancer, and diabetes, were not considered.
 Fig. 2.
PRISMA model for study selection.
The omitted E1 category included 289 studies unrelated to CVD/Stroke or RBBM/GBBM. The E2 category contained 174 papers that either needed more information to be included in our analysis or needed to show a link between RBBM/GBBM and CVD/Stroke. Additionally, these studies lacked selectable AI and CVD/Stroke characteristics for analysis that could be utilized for CVD/stroke risk stratification. Finally, we found 27 research studies with inadequate data sets designated as E3 in the PRISMA model.
Various radiological methods have been invented and widely used in recent years to rule out and/or identify preclinical atherosclerotic-based CVD to advise optimal prophylactic therapy. Since the carotid artery can be used for the prediction of coronary artery disease [45, 46, 47, 48], thus the most commonly used imaging modalities for its screening are Magnetic Resonance Imaging (MRI) [49, 50, 51], Computed Tomography Angiography (CTA) [52, 53, 54, 55, 56], Optical Coherence Tomography (OCT) [57], and Ultrasound (US) [58, 59]. The US is the most common, user-friendly, cost-effective, high-resolution, non-invasive image acquisition modality capable of imaging and recognizing atherosclerotic plaque [58, 60, 61].
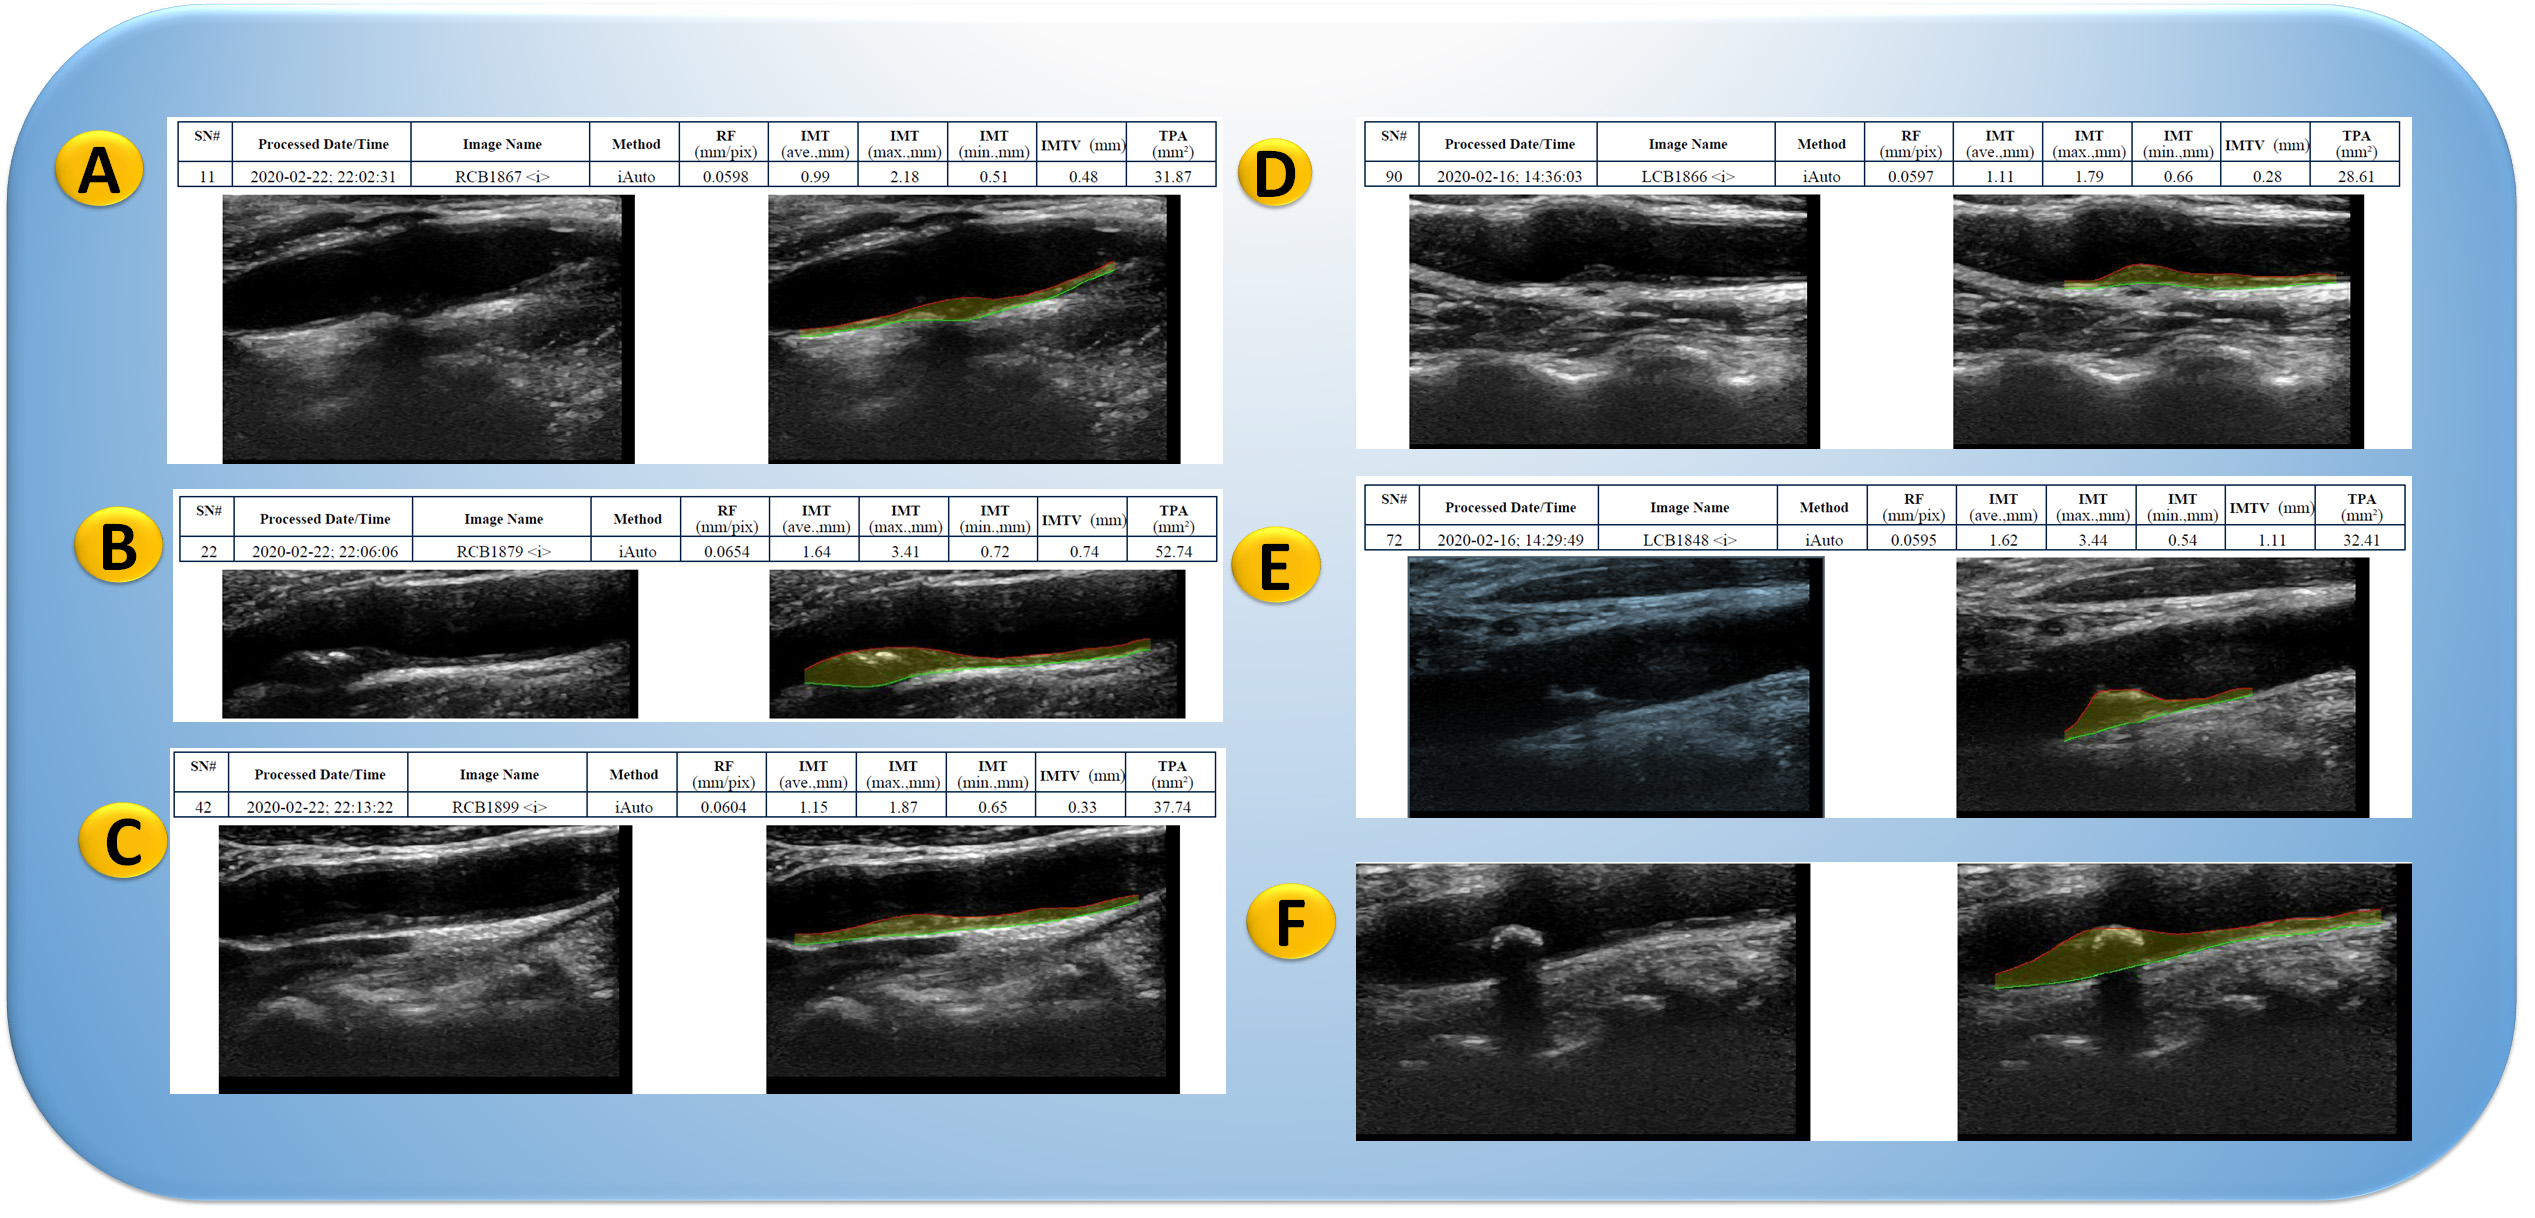
Plaque segmentation attempts to identify plaques precisely and consistently to measure plaque burden and track progression over time. This can be used to diagnose and plan treatment for CVD patients. The segmentation results can be utilized to quantitatively analyze plaque features such as volume, shape, and composition. Regression and progression of the plaque in over 10,000 patients in a few hours retrospectively. Fig. 3 shows the carotid ultrasound image phenotype (CUSIP) parameters derived from carotid artery scans representing the surrogate makers for coronary atherosclerotic disease.
 Fig. 3.
Carotid artery scans show plaque in the far wall of the carotid artery. Carotid ultrasound image phenotype (CUSIP) consists of carotid intima-media thickness (IMT, ave., max., min.) and total plaque area (TPA). The shaded yellow region corresponds to the region of plaque burden. (A) Moderate plaque burden in carotid bulb; (B) Moderate plaque burden in common carotid artery; (C) Moderate-High plaque burden in carotid blub artery; (D) High plaque burden in carotid blub artery; and (E) High plaque burden in carotid blub artery. LCB, left carotid bulb; RCB, right carotid bulb (Original image, AtheroPointTM LLC, Roseville, CA, USA).
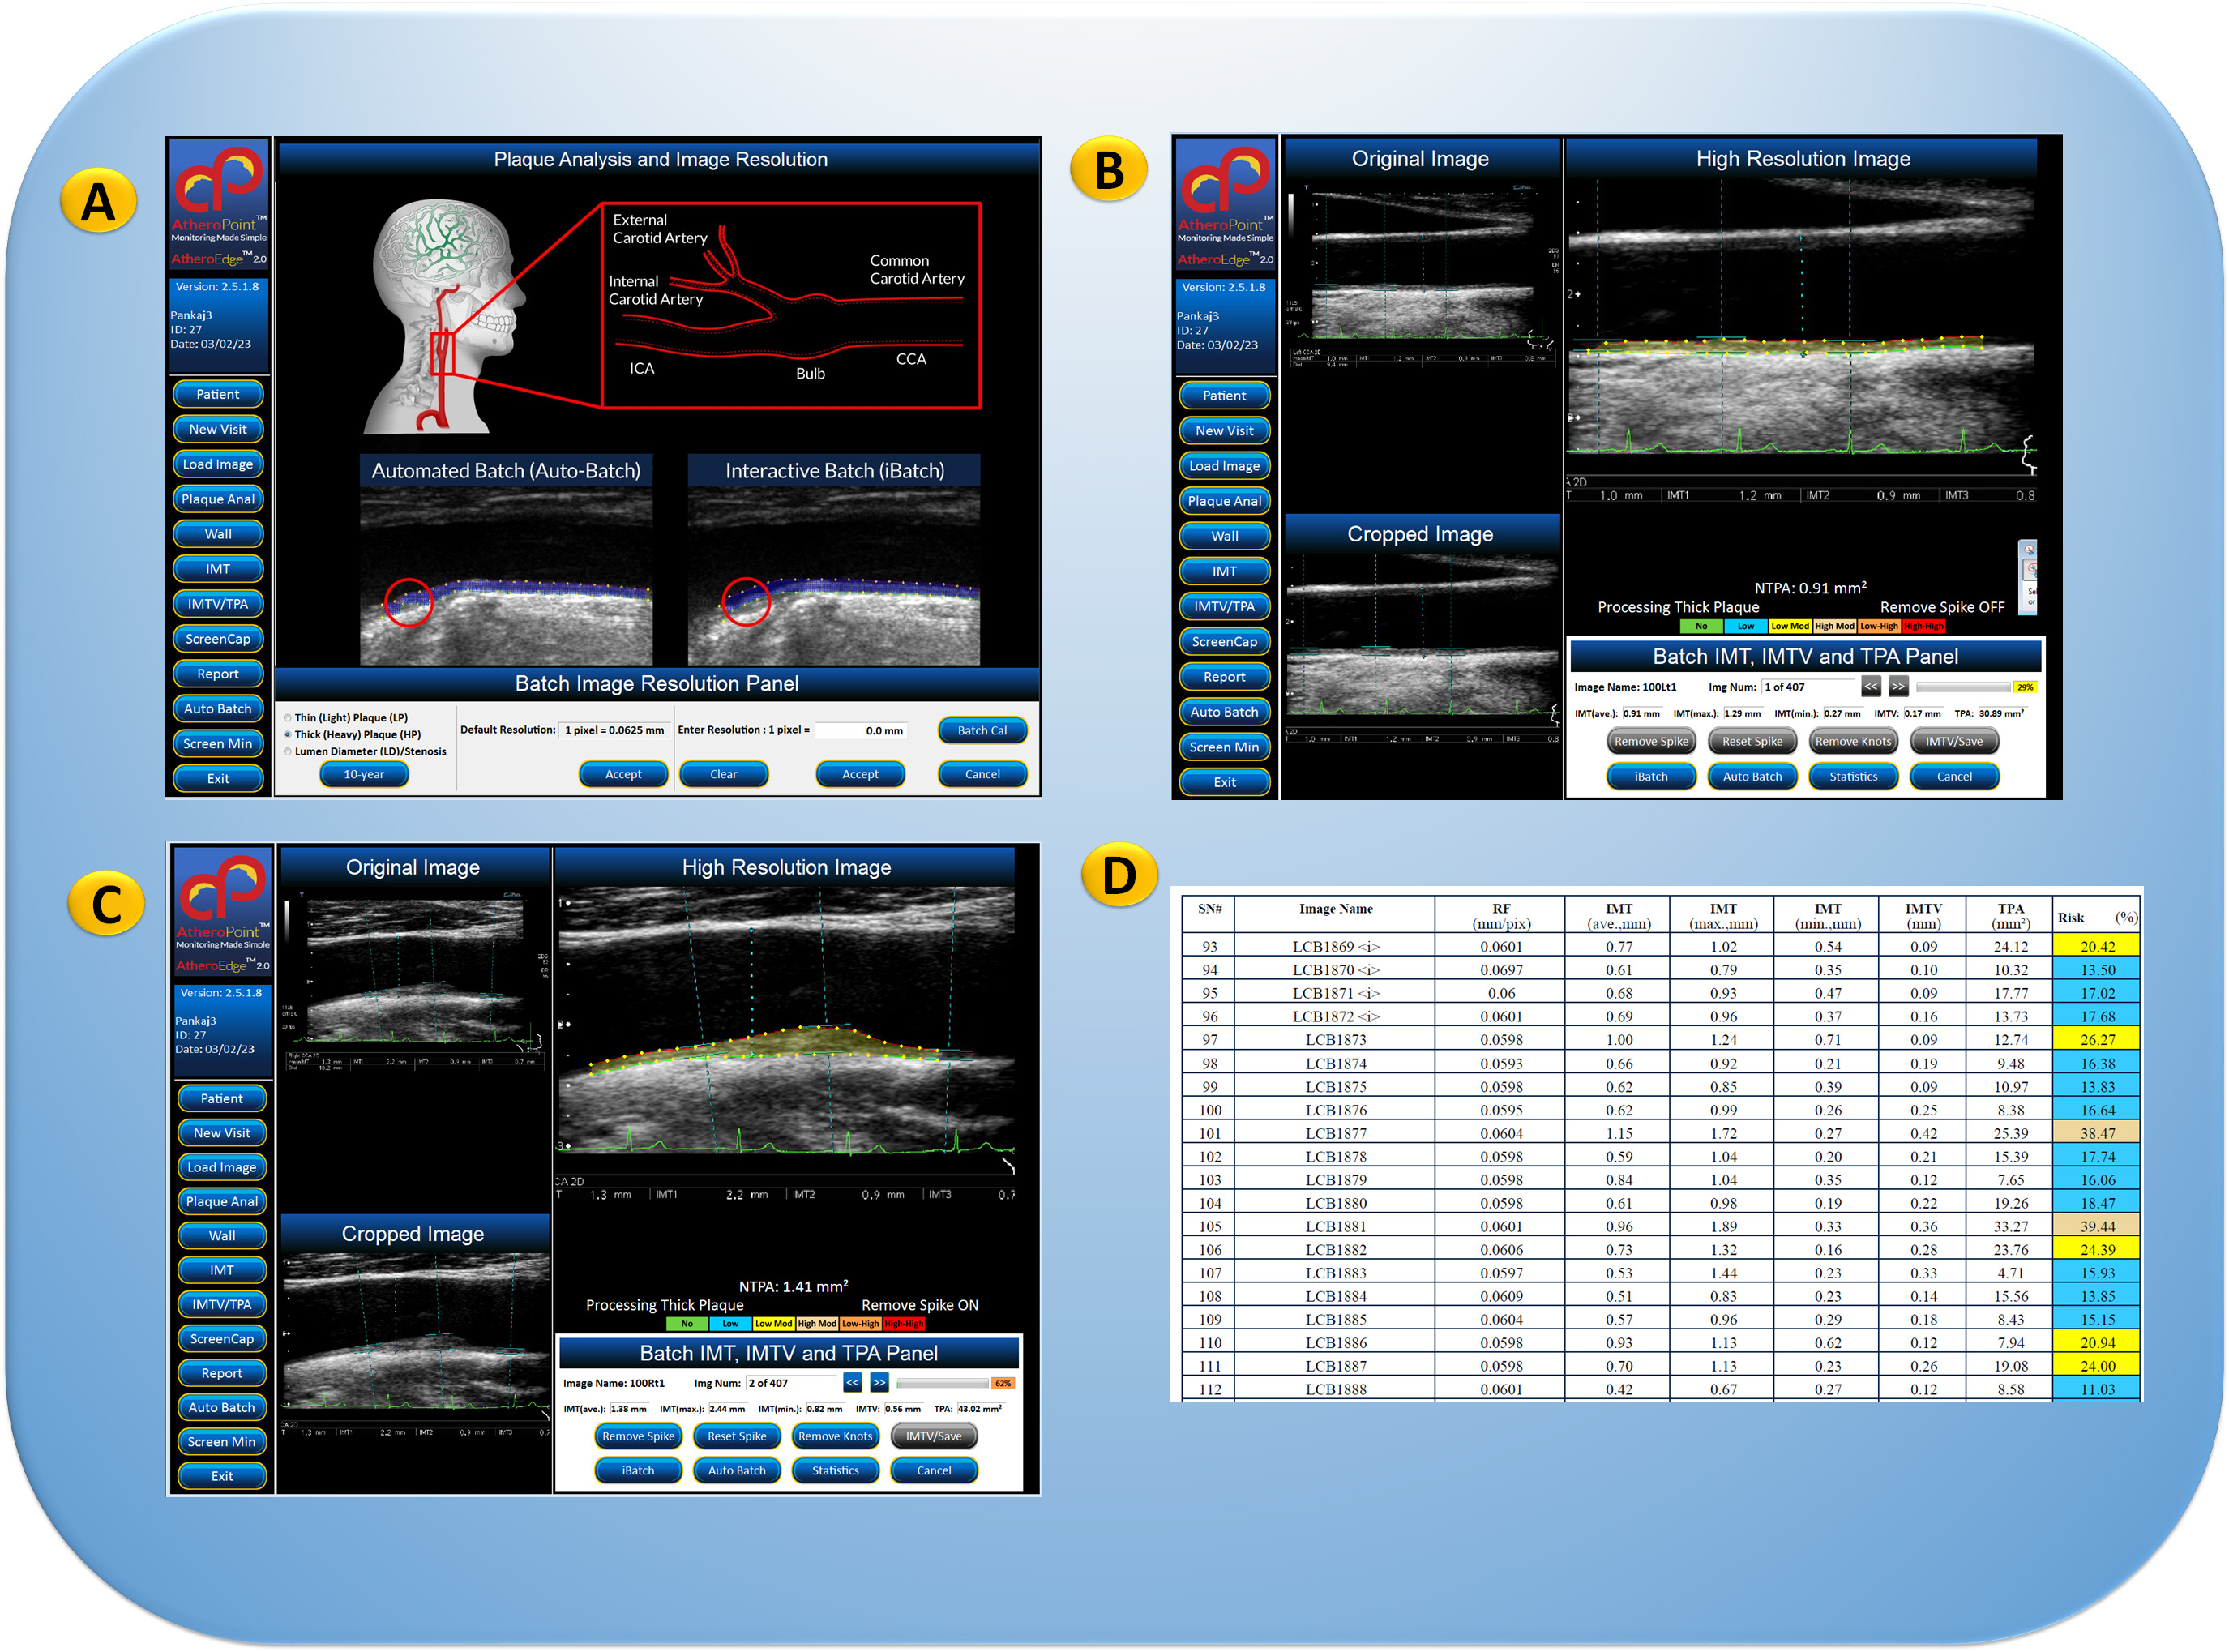
The segmentation process can be challenging due to the variability in plaque appearance and the presence of other structures in the images. A combination of multiple methods can be used to improve the accuracy and reliability of plaque segmentation as part of the radiomics features. Carotid ultrasound image phenotypes (CUSIP) have been tried before [62, 63, 64]. Therefore, it offers a wide range of applications for regular proactive monitoring of atherosclerotic plaque for CVD risk assessment [65, 66, 67, 68, 69, 70]. The statistical reports in the Pharma Mode shown in Fig. 4 will give the regression or progression of the plaque based on the statins during the 5–10-year follow-up of thousands of patients. The surrogate carotid artery disease and genetic-based biomarkers gathered from blood plasma will be used to track the atherosclerotic disease of the coronary artery disease. In addition, statistical regression plots will be constructed to link CVD risk to other clinical biomarkers.
 Fig. 4.
GUI view of AtheroEdge™ 2.0, showing carotid artery plaque measurement. (A) Pharma Mode selection for selection of the image resolution. (B) CUSIP parameters showing cIMT and TPA measurements for low plaque patient. (C) CUSIP parameters (cIMT/TPA) measurements for the high-plaque patient. (D) Pharma Mode report showing the CUSIP parameters and composite CVD risk (marked in color code). This includes (i) renal effect on CVD risk via estimated glomerular filtration rate (eGFR) biomarkers, (ii) arthritis effect on CVD using erythrocyte sedimentation rate (ESR) biomarkers, (iii) diabetic effect on CVD using HbA1c, (iv) changes in CVD due to low-density lipoprotein (LDL) (Original image, AtheroPoint™ LLC, Roseville, CA, USA).
AI-based radiomics techniques have been recently used to extract and analyze segmented features from the carotid artery based on carotid ultrasound imaging modalities [30, 71]. The studies have used different DL algorithms, including convolutional neural networks (CNN), UNet, UNet+, and DenseNet, along with other machine learning (ML) algorithms such as support vector machine (SVM), random forest (RF) and logistic regression (LR) for classification. An example of AtheroEdge™ 3.0 in Pharma mode is seen in Fig. 5A. On clicking the “Pharma Mode” feature of the system, the epidemiologist or physician conducting the Pharma trial will select the spreadsheet with 100,000 patients.
 Fig. 5.
GUI view of AtheroEdge™ 3.0, AI-based Cardiovascular Disease Risk Stratification system in Pharma mode. (A) AI-based system in Pharma Mode with 70% (green) patient cohort processed. (B) AtheroEdge™ 3.0: An example of the results of the Pharma Mode trial. The color code shows the CVD risk class. The percentage risk is shown in the second column from the right. The rest of the columns are the CVD risk predictors (zoomed version of Fig. 5B is shown in the Supplementary Material) (Original image, AtheroPoint™ LLC, Roseville, CA, USA).
The patient data file will be loaded into the system and ready to select the trained AI model for CVD risk prediction. On clicking the “Trained Model” button, the user can fetch the trained AI model and the number of risk classes. Finally, on clicking the “Predict” button, the user AtheroEdge™ 3.0 system will compute the risk of all the 100,000 patients in, say, five seconds per patient. Fig. 5B depicts an example report. Table 1 (Ref. [30, 72, 73, 74, 75, 76, 77, 78, 79, 80]) also includes a list of the segment characteristics used in each investigation, such as carotid intima-media thickness (cMIT), carotid wall thickness (cWT), lumen diameter (LD), plaque load (PB), and plaque area (PA). Table 1 also displays the accuracy (ACC), area under the curve (AUC), and study conclusion for each algorithm. Saba et al. [72] used ML-based radiomics to assess intra/inter-observer variability in detecting the common carotid artery (CCA) using SVM and RF classifiers, achieving an ACC of 98.32%. Biswas et al. [30] used DL-based radiomics to detect joint cWT, and PB features with an accuracy of 93% and AUC of 0.89. Vila et al. [73] also used a DenseNet CNN model to detect and estimate the cIMT with an ACC of 96.45% and an AUC of 0.89. Jain et al. [74] used a UNet-based model to detect and segment the CCA plaque area (PA) with an ACC of 88% and an AUC of 0.91. In another study, Jain et al. [75] used UNet+ to detect and segment the PA in the internal carotid artery (ICA) with an ACC of 97% and AUC of 0.99%. Yuan et al. [76] used UNet-based radiomics to segment and analyze cMIT and plaque with an ACC of 97% and a Dice score of 83.3–85.7.
| SN | Studies | Year | DS | AS | IM | AI (ML/DL) | AA | Segment Features | Performance | Conclusion |
| Segmentation | ||||||||||
| 1 | Jain et al. [74] | 2021 | 970 | CCA | US | DL | UNet, UNet+ | PA | ACC: 88%, AUC: 0.91 (p |
Detection of PA and segmentation |
| 2 | Jain et al. [75] | 2022 | 379 | ICA | US | DL | UNet, UNet+ | PA | AUC: 97%, AUC: 0.99 (p |
Detection of PA and segmentation |
| 3 | Yuan et al. [76] | 2022 | 115 | CCA | US | DL | UNet | cMIT | ACC: 97%, Dice 83.3–85.7 | cMIT and Plaque segmentation |
| 4 | Gago et al. [78] | 2022 | 8000 | CCA | US | DL | UNet | PA, cMIT, and cWT estimation | ACC: 79.00% | Tissue characterization of plaque |
| 5 | Lainé et al. [80] | 2022 | 2676 | CCA | US | DL | UNet | cWT | ACC: 86.00% | Dilated U-net architecture is used for cWT |
| Classification | ||||||||||
| 6 | Saba et al. [72] | 2018 | 100 | CCA | US | ML | SVM, RF | LD | ACC: 98.32% | intra/inter-observer variability |
| 7 | Biswas et al. [30] | 2020 | 250 | CCA | US | DL | CNN, LR | cWT, PB | cMIT error |
Joint detection cWT and PB |
| 8 | Vila et al. [73] | 2020 | 8000 | CCA | US | DL | CNN (Dense Net) | cIMT | ACC: 96.45%, AUC: 0.89 (p |
Plaque detection and cIMT estimation |
| 9 | Molinari et al. [77] | 2022 | 500 | CCA | US | DL | CNN | cMIT and cWT | ACC: 95.6%, AUC:0.83 (p |
cMIT and cWT measurement |
| 10 | Shin et al. [79] | 2022 | 1440 | CCA | US | DL | CNN | Plaque viscous index | ACC: 83.00%, AUC: 0.87 (p |
Viscoelasticity index |
SN, Serial number; DS, Data size; AS, Artery Segment; IM, Imaging modality; CCA, Carotid artery; COA, Coronary artery; CLA, Classifier; FE, Feature extraction; IVUS, Intra-vascular ultrasound; US, Ultrasound; cWT, Carotid wall thickness; cMIT, Carotid intima-media thickness; LD, Lumen diameter; PB, Plaque burden; PA, Plaque area; CCA, Common carotid artery; ICA, Internal carotid artery; ACC, Accuracy; AUC, Area under the curve; AI, Artificial Intelligence; AA, AI Algorithms; ML, Machine Learning; DL, Deep Learning; HDL, Hybrid Deep Learning; SVM, Support vector machine; RF, Random Forest; DT, Decision Tree; CNN, Convolution neural network; LR, Logistic regression; NR, Not Reported.
Molinari et al. [77] used a CNN-based radiomics model to analyze cMIT and cWT features, achieving an ACC of 95.6% and an AUC of 0.83. UNet-based tissue characterization of CCA plaque by Gago et al. [78] yielded an ACC of 79.00%. Shin et al. [79] used a CNN-based model to analyze the viscous plaque index with an ACC of 83% and an AUC of 0.87, while Lainé et al. [80] segmented the cWT with an ACC of 86% using a dilated U-Net architecture.
Genetic factors play a significant role in the development and progression of plaque buildup in the arteries, and understanding an individual’s genetic makeup can provide valuable insights into their risk for CVD. Genetic data is used to identify potential treatment and prevention strategies targets and can help personalize care for individual patients. To accurately assess and understand the plaque burden in an individual, it is essential to have access to genetic data. This section highlights conventional risk scores and AI-based composite risk score methods for the personalized predication of CVD.
A polygenic risk score, often known as a “polygenic risk score” or “PRS”, is a prediction tool that assesses an individual’s genetic predisposition to various diseases, such as CVD [81]. The PRS is estimated by taking into account the presence and frequency of genetic variants associated with the disease [82, 83].
SNPs associated with CVD can be used as markers to establish an individual’s genetic profile [84]. Individual genotyping data is collected after SNP identification. Large-scale genotyping initiatives or DNA tests can provide genotype data [85]. After that, each person’s PRS is calculated based on their genome’s risk allele count [86]. The CVD association of risk alleles influences their weight [81]. The “effect size” measures how much an SNP affects CVD risk [87]. This statistic typically measures the strength of the relationship between two variables. The odds ratio compares the risk of CVD for those with a particular SNP to those without [88]. The odds ratio usually quantifies the effect [82]. An individual’s PRS is calculated by summing the weights of all risk alleles found in their genotyping data [89]. Higher PRS scores indicate a higher CVD predisposition. Fig. 6 shows using the molecular data to calculate the PRS.
 Fig. 6.
Molecular data used for prediction of PRS for CVD (Original image, AtheroPoint™ LLC, Roseville, CA, USA).
The PRS is not a diagnostic tool and should not be used alone to make clinical decisions [90]. The PRS should be used with family history, lifestyle, and other risk factors to make a more informed decision about CVD risk [91, 92]. Table 2 (Ref. [93, 94, 95, 96, 97, 98, 99, 100, 101, 102, 103, 104, 105, 106, 107, 108, 109, 110, 111, 112, 113, 114]) lists In-vitro biomarkers that can be identified in the serum and plasma of asymptomatic and CVD patients. To improve diagnosis and CVD risk stratification, multivariate genomic-based biomarkers and multivariable prediction models have been used [93, 115, 116]. The prediction models assess multivariate atherosclerosis and coronary artery development indicators in circulating molecules. Cellular, biochemical, epigenetic, and/or transcriptional GBBM contributing to CVD are addressed below. ACS biomarkers include C-reactive protein (CRP) [94], a liver protein released in response to inflammation, which increases cardiovascular risk. Another study by Barwari et al. [95] and Barwari et al. [95] found plasma LDL-cholesterol levels to be a biomarker for ACS. LDL-cholesterol is considered “bad” because it causes arterial plaque. Joshi et al. [96] and Cristell et al. [97] noted that PCSK9 regulates cholesterol metabolism and that the identified variant is associated with higher LDL-cholesterol levels and an increased risk of cardiovascular events. Pedicino et al. [98] and Partida et al. [99] identified pro-inflammatory CD4+ cells with poor CD28 expression as a biomarker for ACS. Sato et al. [100] and Montone et al. [101] found that biomarkers of ACS include a drop in the number of regulatory T lymphocytes and their ability to stop cancer cells from growing. The following rows list plaque rupture biomarkers without systemic inflammation. Kelley et al. [102] found inflammasome activation, while Kreiner et al. [103], Toldo et al. [104], and Omerovic et al. [105] found interleukins 1 and 18 and emotional disturbance-induced catecholamine release as CVD biomarkers. Repova et al. [106] found neutrophil activity, while Dang et al. [107] found macrophages or T lymphocytes as ACS biomarkers, eroding plaque. In summary, Table 2 provides a comprehensive overview of different biomarkers associated with plaque progression in patients with CVD. The table highlights the complexity of CVD and the need for personalized treatment approaches based on individual patient characteristics.
| SN | Author | Disease | Phenotype | Biomarker |
| 1 | Thibaut et al. [93], Padua et al. [94] | CVD | common phenotype | C-reactive protein (CRP) |
| 2 | Barwari et al. [95], Cristell et al. [97] | CVD | common phenotype | Plasma levels of low low-density protein cholesterol (LDL-cholesterol) |
| 3 | Joshi et al. [96], Cristell et al. [97] | CVD | common phenotype | PCSK9 variant |
| 4 | Pedicino et al. [98], Partida et al. [99] | CVD | systemic inflammation and plaque rupture | CD4+ cells that are pro-inflammatory and have a poor expression of the co-stimulatory molecule CD28 on their cell surfaces |
| 5 | Sato et al. [100], Montone et al. [101] | ACS | systemic inflammation and plaque rupture | a decrease in the number of circulating regulatory T lymphocytes as well as their inhibitory function |
| 6 | Montone et al. [101] | CVD | systemic inflammation and plaque rupture | CD31 and protein tyrosine phosphatase N22, upstream regulatory mediators, modulate T-cell number and function. |
| 7 | Kelley et al. [102] | CVD | plaque rupture without systemic inflammation | Activation of Inflammasome |
| 8 | Kreiner et al. [103] | ACS | plaque rupture without systemic inflammation | Interleukin (IL)-1 |
| 9 | Toldo et al. [104] | CVD | plaque rupture without systemic inflammation | Interleukin (IL)-18 |
| 10 | Omerovic et al. [105] | CVD | plaque rupture without systemic inflammation | Catecholamine release due to emotional disturbance |
| 11 | Repova et al. [106] | CVD | erosion of plaque | activation of Neutrophil |
| 12 | Dang et al. [107] | CVD | erosion of plaque | Macrophages or T lymphocytes |
| 13 | Thota et al. [108] | CVD | erosion of plaque | Proteoglycans |
| 14 | Wang et al. [109] | ACS | erosion of plaque | Glycosaminoglycans |
| 15 | Worssam et al. [110] | CVD | erosion of plaque | Arterial Smooth Muscle Cells (SMCs) |
| 16 | Romo et al. [111] | CVD | erosion of plaque | Monocyte HYAL2 expression increased. |
| 17 | Pinheiro-de-Sousa et al. [112] | CVD | erosion of plaque | up regulation of Endothelial cell CD44 |
| 18 | Chong et al. [113] | CVD | plaque in the absence of thrombus | Vasospasm |
| 19 | Shimokawa et al. [114] | CVD | plaque in the absence of thrombus | Rho-kinase activity |
ACS, Acute Coronary syndrome.
Radiogenomics Risk Predictors are valuable biomarkers used for CVD risk stratification, combining radiological imaging data and genetic information to assess an individual’s CVD risk [75, 117]. These predictors analyze quantitative features extracted from imaging modalities like MRI, CTA, OCT, and US, alongside genetic data, serving as specific indicators of pathological changes in the arteries [118]. Referred to as “RBBMs”, they are not mere symptoms but powerful tools for risk evaluation [119]. Numerous studies, detailed in Table 1, have explored and emphasized the significance of these risk predictors.
CAD affects major blood vessels supplying the heart muscle, primarily due to cholesterol deposits causing atherosclerosis, leading to reduced blood flow and potential heart attacks, angina, or strokes [120]. Symptoms of CVD may differ between genders, with men experiencing more chest pain and women often presenting shortness of breath, nausea, and extreme fatigue, indicating underlying heart or blood vessel issues [121]. Abnormal anatomical conditions in CVD, such as cardiomegaly, myocardial infarction, vasculitis [122], atherosclerosis, and thrombosis [123], are observable through medical imaging, physical examinations [124], or laboratory tests, providing critical insights into disease development. Studying these pathological changes is vital for understanding CVD and utilizing radiological biomarkers, to detect stenosis and other risk factors, contributing to a comprehensive comprehension of CVD and its related conditions.
The medical imaging field has noted the progress made in ML and DL [125, 126, 127, 128]. Deep neural networks (DNNs), a subset of DL, work like the human brain [39, 117, 129]. AI has been used in recent studies to figure out the risk of CVD using RBBM [11, 12, 38, 130, 131, 132, 133, 134] and GBBM [33, 135, 136] frameworks. DL is becoming more popular because (i) it automatically extracts features [137], (ii) it can fuse with different ML configurations for classification [117, 138], (iii) it uses UNet and Hybrid UNet-based DL strategies for segmentation [43, 119], and (iv) Lastly, it gives more accurate segmentation and solo or ensemble-based classification because it can go through forward and backward propagation by reducing the loss using different kinds of loss functions [74].
The architecture consists of two halves. The left is the training subsystem, while the right is the prediction subsystem.
The DL training classifiers consist of one of the DL classifiers, namely, long short-term memory network (LSTM), recurrent neural network (RNN), gated recurrent units (GRU), bidirectional-LSMT (BiLSTM), bidirectional-RNN (BiRNN), and bidirectional-GRU (BiGRU) (presented in the following subsection).
Along with the DL classifier bank, there are supervised clinical risk labels representing ground truth (GT), such as heart failure (or high CVD risk) and stroke [130, 139]. This GT representing the CAD includes computed tomography (CT) coronary score [140] or quantification of CAD lesions using intravascular ultrasound (IVUS) [141, 142]. Several non-linear training-based approaches have been shown in heart disease risk stratification [12, 132, 134, 143]. Fig. 7 shows AI-based architecture for CVD risk assessment.
 Fig. 7.
AI genomics-based architecture for CVD risk assessment (Original image, AtheroPoint™ LLC, Roseville, CA, USA).
The RNN [144], BiRNN [145], LSTM [146], BiLSTM [147], GRU [148], and BiGRU [149]models evaluate sequential data, such as Electrocardiograph (ECG) [148, 150], text [146], speech [151], localization of myocardial infraction [147], and handwriting [152, 153]. Table 3 (Ref. [154, 155, 156, 157, 158, 159, 160, 161, 162, 163, 164, 165, 166, 167, 168]) below summarises AI-based genomics studies that make a personalized and accurate prediction of CVD. A total of 15 studies are listed in the table and described with sample size, ground truth, technology, benchmark, source description, AI type, classifier type, cross-validation technique, and performance characteristics. In the first investigation, Davies et al. [154] (2010) tried to predict CVD using SNP data in conjunction with ML techniques using SVM and LR. The total number of participants in the study was 2333, and the ACC and SPE parameters each attained an AUC of 0.80 and 0.78, respectively. The study was prospective.
| SN | Studies | Year | SS | GT | BM | SD | Tech | AI (ML/DL) | CT | CVP | Performance parameters | CTR | ||||
| ACC | SEN | SPE | AUC | F1 | ||||||||||||
| 1 | Davies et al. [154] | 2010 | 2333 | CVD | LBBM, OBBM | SNP | GWAS | ML | SVM, LR | 10K | 0.61, 0.55 | NR | NR | 0.80, 0.78 | NR | Prospective |
| 2 | Valavanis et al. [155] | 2010 | 63 | CVD | LBBM, OBBM | DNA | DEG | DL | PDM-ANN | 3K | 0.95 | 0.98 | 0.94 | 0.96 | NR | Retrospective |
| 3 | Beigi et al. [156] | 2011 | 23 | CVD | LBBM, OBBM | SNP | Proteinase k | ML | SVM | 10K | 0.91 | NR | NR | NR | NR | Prospective |
| 4 | Montañez et al. [157] | 2017 | 12 | CVD | LBBM, OBBM | SNP | DEG | ML | SVM, RF, XGB | 10K | NR | 0.88, 0.52, 0.70 | 0.86, 0.95, 0.82 | 0.90, 0.87, 0.85 | NR | Retrospective |
| 5 | Zhao et al. [158] | 2019 | 490 | CVD | LBBM, OBBM | SNP | DEG | DL | CNN | 10K | 0.81 | 0.83 | 0.79 | 0.82 | NR | Prospective |
| 6 | Schiano et al. [159] | 2021 | 443 | DCM | LBBM | mRNA | DEG | ML | DT | 10K | 0.79 | NR | NR | NR | NR | Prospective |
| 7 | Yang et al. [160] | 2021 | 117 | CVD | LBBM, OBBM | SNP | DEG | ML | SVM, RF | 10K | 0.86, 0.89 | NR | NR | 0.91, 0.93 | NR | Retrospective |
| 8 | Akbarzadeh et al. [161] | 2022 | 4756 | CVD | LBBM | DNA | Proteinase k | ML | SVM, DT, RF, LR | 5K | 0.72,0.73, 0.74, 0.70 | 0.66,0.66, 0.69, 0.67 | 0.78,0.80, 0.78,0.73 | 0.78, 0.77, 0.80, 0.77 | NR | Prospective |
| 9 | Kesar et al. [162] | 2022 | 203 | CVD | LBBM, OBBM | NR | NR | ML | LR, XGB | 10K | NR | NR | NR | 0.75, 0.76 | NR | Prospective |
| 10 | Pirruccello et al. [163] | 2022 | 116 | CVD | LBBM, OBBM | SNP | DEG | DL | UNet | 10K | 0.96 | NR | NR | NR | NR | Retrospective |
| 11 | Steinfeldt et al. [164] | 2022 | 395713 | CVD | LBBM | NR | NR | DL | CNN | 10K | 0.78 | NR | 0.81 | NR | NR | Prospective |
| 12 | Lee et al. [165] | 2022 | 283 | CVD | LBBM | SNP | DEG | ML | LR | 10K | 0.81 | 0.79 | 0.83 | NR | NR | Retrospective |
| 13 | Libiseller‑Egger et al. [166] | 2022 | 34432 | CVD | LBBM, OBBM | SNP | GWAS | DL | SVM, LR | 5K | 0.76 | 0.81 | 0.84 | 0.81 | NR | Prospective |
| 14 | Kang et al. [167] | 2023 | 17044 | AMI | LBBM | mRNA and miRNA | DEG | ML | SVM, RF, DT | 10K | 0.81, 0.85, 0.81 | 079, 0.89, 0.77 | 0.84, 0.82, 0.86 | 0.92, 0.96, 0.88 | NR | Retrospective |
| 15 | Venkat et al. [168] | 2023 | 82 | CVD | LBBM, OBBM | SNP | DEG | ML | RF | 5K | 0.80 | NR | NR | NR | NR | Prospective |
SN, serial number; SS, Sample size; GT, Ground Truth; Tech, Technique; BM, Benchmark; LBBM, Lab-base biomarkers; OBBM, Office base biomarkers; SD, Source description; AI, Artificial Intelligence; CT, classifier type; CVP, Cross-validation protocol; CTR, Clinical trials; ACC, Accuracy; SEN, Sensitivity; SPE, Specificity; AUC, Area under the curve; ML, Machine Learning; DL, Deep Learning; CNN, Convolution neural network; PDM, parameter decreasing method; ANN, Artificial neural network; PDM, parameter decreasing method; DEG, Differential expression gene; SVM, Support vector machine; RF, Random forest; DT, Decision tree; NR, Not Reported; DCM, Dilated cardiomyopathy; AMI, Acute myocardial infarction.
Valavanis et al. [155] (2010) demonstrated the ability to predict CVD using DNA data and the DL algorithm PDM-ANN. With a sample size of 63 in a retrospective study, the accuracy of the prediction was found to be 95.5%. However, Beigi et al. [156] (2011) used SNP data with an SVM-based ML paradigm to predict CVD. In a prospective study, the sample size was only 23, but it still reached a very high accuracy of 91%. By combining SNP data with ML algorithms like SVM, RF, and XGB, Montañez et al. [157] (2017) conducted a retrospective study that predicted CVD. In the study, there were 12 participants, and the SPE parameter managed to reach an AUC of 0.9.
Zhao et al. [158] (2019) carried out a prospective study that uses SNP data in conjunction with the DL technique known as CNN to predict CVD. The total number of participants in the trial was 490, and the AUC was 0.82. To predict dilated cardiomyopathy (DCM), Schiano et al. [159] (2021) used mRNA data in conjunction with the DT-based ML technique. The study has an accuracy of 0.79 with a sample size of 443. Yang et al. [160] (2021) carried out the study, which used SNP data and ML algorithms like SVM and RF to predict CVD. The retrospective study included 117 participants and obtained an AUC value of 0.91 for the SEN of 0.93. The study by Akbarzadeh et al. [161] (2022) uses DNA data and ML algorithms SVM, DT, RF, and LR to predict CVD. The prospective research study utilized a sizable sample size of 4756 participants and successfully achieved a range of performance criteria, one of which was an AUC of 0.78 for the ACC. The study, which was conducted by Kesar et al. [162] (2022), forecasted CVD using both LBBM and OBBM; however, the data types were not stated. The research had a total of 203 participants as its sample size, and it managed to get an AUC of 0.75 and an F1 score of 0.76. The research was prospective in scope.
Overall, these studies demonstrate the potential of AI-based genomics approaches to predict CVD accurately and provide personalized and precise care for patients. However, more studies are needed to validate these approaches’ effectiveness and assess their impact on clinical practice.
This section discusses using explainable AI, reliability stability, and survival analysis techniques to design and develop the CVD risk stratification in a joint cloud and pharmaceutical framework. It examines the benefits and limitations of these techniques and provides examples of successful implementations. Section 5.1 focuses on the importance of explainability in AI-based decision-making in the pharmaceutical paradigm. It discusses different techniques to ensure explainability, provides examples of use cases, and examines potential benefits and limitations.
Section 5.2 discusses the use of cloud-based solutions for AI in the pharmaceutical industry, including the benefits of scalability, flexibility, and cost-effectiveness. It also examines potential challenges and limitations, such as data security and privacy concerns, and provides case studies of successful implementations. Subsection 5.3 explains the use of statistical methods to analyze the reliability and accuracy of AI prediction models in the pharmaceutical industry. It provides an overview of common statistical techniques, different types of AI prediction models, and case studies of successful applications. Lastly, Subsection 5.4 focuses on applying AI-based survival analysis in the pharmaceutical industry. It examines different types of AI-based survival analysis models, their benefits, and the importance of interpretability and explainability. It also provides case studies of successful applications.
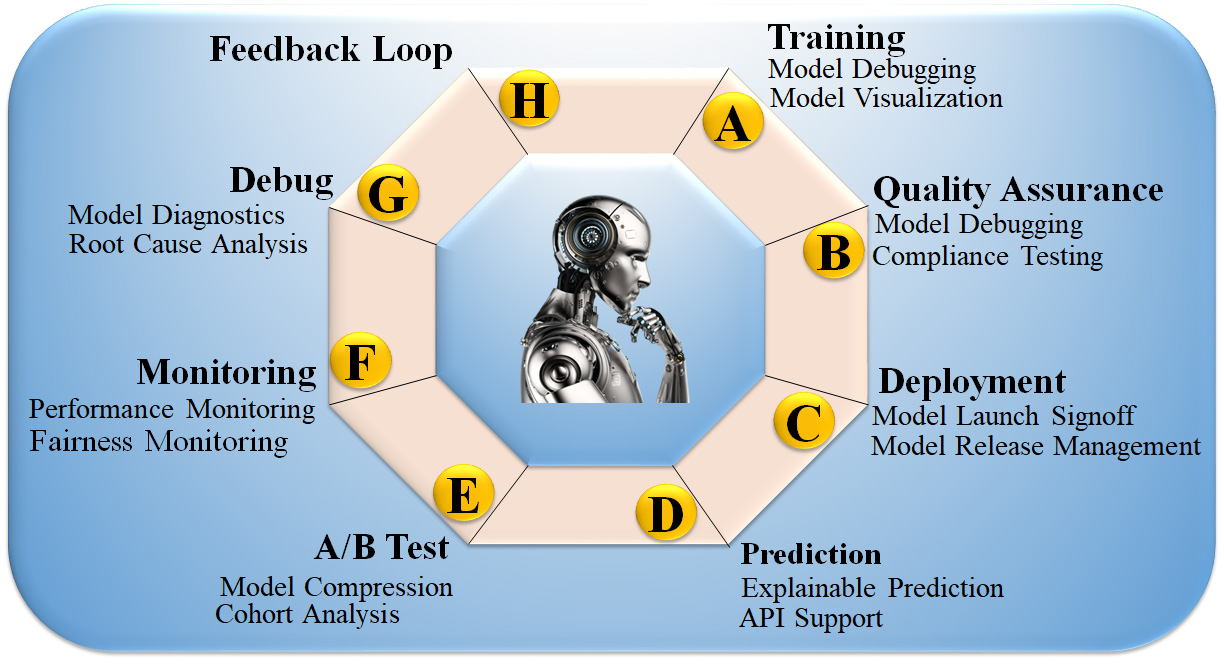
In the past, AI models were considered “black boxes”, meaning that it was unknown what specific patterns in the input data would result in the desired output. To put it another way, even if a classification algorithm is nearly perfect, humans must still determine what circumstances led to the categorisation [169]. The lack of transparency in model decisions becomes problematic when a model is trained to make accurate predictions based on features that are irrelevant to the situation at hand, and, as a result, it lacks generalization for that dataset [170]. Fig. 8 (Ref. [171]) shows the eight customizable DL processes: (i) DL training, (ii) quality assurance (QA), (iii) installation, (iv) deployment, (v) prediction, (vi) cross-validation-based testing (A/B test), (vii) monitoring, and (viii) debugging. These processes are made possible by incorporating the feedback loop in XAI. Incorporating XAI enhances its usability, increasing demand for such systems and generating higher revenue [172]. Moreover, it offers greater stability to the AI system, thus extending the lifespan of the product design. XAI strategies expose sophisticated model decision patterns [173]. XAI can provide new information about a dataset and the disease by revealing input variables’ predictive importance, including risk factors, traits, and protein expression levels. However, models like principal component analysis (PCA), LR, and Cox linear regression use model parameters to determine feature relevance [174].
The average importance of features across samples is determined using feature analysis [175]. Training models to distinguish across classes can be expanded to numerous classes, providing insights such as specific patient groups [176]. XAI clinical power stems from strategies that explain patient decisions. Fig. 9 illustrates the clinical decision system concept employing XAI. If the AI model predicts a patient’s risk, the doctor can inquire about the model’s output for clinical, imaging, or molecular features route databases and gene set enrichment estimates can uncover risk variables and molecular disease pathways. This information can help clinicians choose better treatment plans. Furthermore, by understanding the decision process, the physician will be able to judge the accuracy of the predictions. Explainability has thus been recommended as an ethical requirement for prospective clinical decision systems [177]. This section describes various XAI techniques and summarises medical and clinical applications for patient evaluation [8, 42, 43, 153].
 Fig. 9.
Clinical features decisions system using XAI. AI models are trained using clinical, imaging, or multi-omics data into different classes (low, mild, moderate, and high). The trained algorithm predicts (prediction blocks) patient disease or symptom risk. Lastly, the XAI presents decision patterns to help the doctor evaluate the forecast and plan treatment (Original image, AtheroPoint™ LLC, Roseville, CA, USA).
XAI can help interpret the results of a clinical Pharma Mode, such as the diseases like CVD. An ML model was trained in Pharma Mode to predict the risk of CVD based on clinical and demographic variables. Local interpretable model-agnostic explanations (LIME) work by training a local linear model to approximate the behavior of the ML model in the neighbourhood of a specific instance. The local model can be used to identify which features strongly influence the predicted outcome for that instance. The equation for the local linear model is:
where,
where
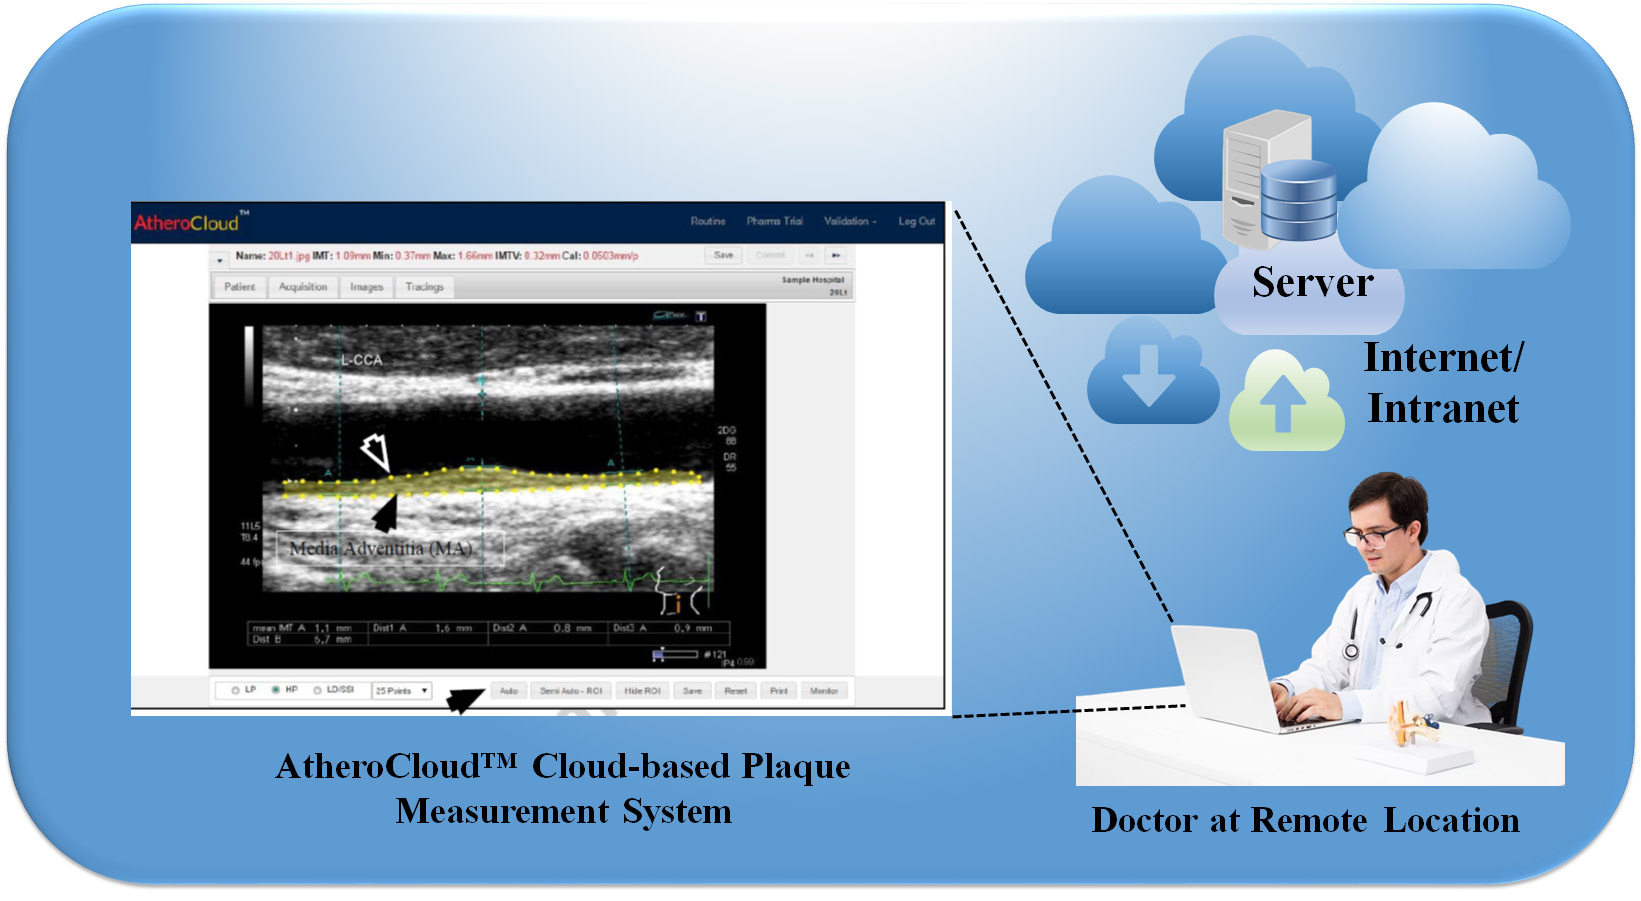
Cloud-based XAI is an approach that allows researchers and healthcare professionals to access powerful ML/DL models and tools for data analysis and prediction without needing specialized hardware or software. In the context of predicting CVD, cloud-based XAI can provide an efficient and cost-effective way to analyze large amounts of data and generate accurate predictions. Cloud-based XAI relies on cloud computing technology, which involves using remote servers to store and process data rather than relying on local resources [43, 72, 178, 179]. Fig. 10 shows a cloud-based XAI system. By leveraging cloud-based infrastructure, researchers can access powerful computing resources and AI models that can process vast amounts of data quickly and efficiently.
 Fig. 10.
AtheroCloud™ system depicts a typical daily routine. A yellow color fills the plaque region, representing the total plaque area after the image has been loaded in the Routine mode and the “Auto Trace” button has been clicked (Original image, AtheroPoint™ LLC, Roseville, CA, USA).
To build a cloud-based XAI system for predicting CVD reserchers can follow a few steps: (i) Feature selection: Feature selection is the process of identifying the most important features contributing to predicting CVD. This can be accomplished through the use of statistical approaches such as regression analysis or machine learning/deep learning algorithms that automatically choose the most relevant features. (ii) Model interpretability: The model can be made more interpretable using algorithms that explain individual predictions, such as LIME and SHAP. These algorithms provide feature importance scores and highlight the most important features for a specific prediction. (iii) Data visualization: Data visualization can be utilized to explore data and uncover patterns and relationships among features. Visualization tools such as scatter plots, heatmaps, and box plots can help researchers identify outliers and correlations that may be useful for predicting CVD. (iv) Cloud-based infrastructure: Cloud-based infrastructure can be used to store and process large amounts of data, making it possible to build more complex and accurate models.
Cloud-based AI platforms such as Amazon Web Services (AWS) and Google Cloud Platform (GCP) provide powerful tools for building and deploying ML/DL models [180]. (v) Collaboration: Collaboration is essential for developing accurate and reliable models for CVD prediction. Cloud-based XAI platforms enable researchers to share data and models, collaborate on model development, and work together to identify new insights and approaches [181]. Cloud-based XAI has several advantages over traditional on-premises solutions. First, researchers can access powerful computing resources without needing specialized hardware or software. Second, it provides a scalable and flexible platform that can be easily adapted to meet changing healthcare needs. Finally, it enables researchers and healthcare professionals to collaborate and share data and models, leading to better and more accurate predictions for CVD and other health conditions.
Heatmaps in Explainable AI work by highlighting the regions of input data that significantly influence the model’s output. For image-based tasks, such as object detection or medical image analysis, heatmaps visually depict the importance of different pixels or regions within the input image. The intensity of colors in the heatmap indicates the magnitude of the model’s focus on particular areas [182]. The generation of heatmaps often involves techniques like Gradient-weighted Class Activation Mapping (Grad-CAM) and Guided Backpropagation. Grad-CAM computes the gradients of the target class with respect to the final convolutional layer’s feature maps. These gradients are then global-average-pooled to obtain the heatmap, which highlights the relevant regions in the image. Guided Backpropagation, on the other hand, is used to ensure that only meaningful features are highlighted in the heatmap by preventing the model from backpropagating through unimportant regions [183]. By interpreting heatmaps, researchers, domain experts, and end-users gain valuable insights into why a specific decision was made by the AI model. For instance, in medical diagnosis, heatmaps can help doctors understand which regions of an X-ray or MRI scan contributed most to the AI model’s identification of a certain condition [184].
Skandha et al. [138] proposed the first of its kind method to
characterize and classify the carotid plaque using an optimized transfer learning
approach and SuriNet (a class of Atheromatic™ 2.0 TL). Eleven
Atheromatic™ models were implemented, and the best AUC was 0.961
(p
In conclusion, heatmaps are a crucial tool in the toolkit of Explainable AI, offering visual interpretations of AI model decisions and making complex AI systems more transparent and interpretable. As AI continues to impact various aspects of our lives, XAI using heatmaps will play an instrumental role in building responsible and trustworthy AI applications.
The statistical analysis involved the presentation of continuous variables as
mean
Multivariable linear regression analysis assessed the association between left
atrium (LA) function parameters and myocardial scar size/location [118]. The
regression models included demographic characteristics, traditional
cardiovascular risk factors, and Late gadolinium enhancement (LGE) location/size
as covariates. To avoid co-linearity, Spearman correlation coefficients were used
to test for correlations between continuous variables, and variables with r
AI-based survival analysis is a cutting-edge technique used to predict the risk of CVD [134]. Using huge amounts of medical data, AI algorithms may estimate the chance of an individual having CVD based on parameters such as age, gender, blood pressure, cholesterol levels, and lifestyle patterns [129]. This approach can give physicians valuable insights into patient health and help them create personalized treatment plans for each individual [191].
By utilizing AI-based survival analysis, doctors can also identify high-risk individuals who may require closer monitoring or more aggressive treatment to prevent the development of CVD [192]. AI technology can revolutionize the healthcare industry by improving the accuracy of CVD diagnosis and treatment, leading to better patient outcomes and improved overall public health [69, 193].
The ML/DL system needs to overcome critical concerns like bias, explainability, ergonomic design, and affordability to ensure the safety and effectiveness of the medical product, such as CVD risk stratification.
This is the first study of its kind (a) that combines radiomics and genomic
biomarkers to detect the severity of CVD and stroke risk precisely, and (b) an
explainable XAI-based composite risk CVD/Stroke model using DL can predict with
precision in a preventive and personalized (aiP
AtheroCloud
Table 4 (Ref. [27, 41, 75, 119, 143, 159, 194, 195, 196, 197, 198, 199, 200, 201]) displays the benchmarking studies. It has 17 attributes, namely, K0: Serial Number, K1: Studies, K2: Year, K3: References, K4: OBBM, K5: LBBM, K6: RBBM, K7: GBBM, K8: PBBM, K9: EBBM, K10: Preventive, K11: Prediction, K12: Personalized, K13: AI Type, K14: FDA discussion, K15: Clinical Setting, K16: Risk of bias; K17: AI explainability. Our observations showed that there were only eight studies [27, 41, 159, 194, 195, 196, 197] that discussed the role of GBBM in CVD using DL, while the remaining studies predicted CVD using RBBM [75, 119, 143, 198, 199, 200, 202, 203]. However, all the studies mentioned the role of OBBM and LBBM in CVD risk. Five studies adopted DL technologies [27, 41, 75, 196, 198, 199], while eight studies used ML [11, 131, 197, 202], and two studies used HDL [143, 201]. Only four studies discussed the risk of bias (RoB) [75, 143, 202]. Except for the proposed study, no other study addressed clinical settings, AI explainability, and fusion of GBBM and RBBM.
| K0 | K1 | K2 | K3 | K4 | K5 | K6 | K7 | K8 | K9 | K10 | K11 | K12 | K13 | K14 | K15 | K16 | K17 |
| 1 | Krittanawong et al. [194] | 2017 | 31 | ✓ | ✓ | × | ✓ | ✓ | × | ✓ | ✓ | ✓ | NR | × | × | × | × |
| 2 | Arena et al. [195] | 2018 | 202 | ✓ | ✓ | × | ✓ | × | × | ✓ | × | ✓ | NR | × | × | × | × |
| 3 | Krittanawong et al. [27] | 2018 | 88 | ✓ | ✓ | × | ✓ | × | × | ✓ | × | ✓ | DL | × | × | × | × |
| 4 | Jamthikar et al. [143] | 2019 | 110 | ✓ | ✓ | ✓ | × | × | × | ✓ | ✓ | × | HDL | × | × | × | × |
| 5 | Saba et al. [199] | 2019 | 125 | ✓ | ✓ | ✓ | × | × | × | ✓ | ✓ | × | DL | × | × | × | × |
| 6 | Dainis et al. [41] | 2019 | 83 | ✓ | ✓ | × | ✓ | × | × | ✓ | × | ✓ | DL | × | × | × | × |
| 7 | Gruson et al. [201] | 2020 | 42 | ✓ | ✓ | × | ✓ | ✓ | × | ✓ | × | ✓ | HDL | × | × | × | × |
| 8 | Alimadadi et al. [197] | 2020 | 56 | ✓ | ✓ | × | ✓ | × | × | ✓ | × | ✓ | ML | × | × | × | × |
| 9 | Saba et al. [198] | 2020 | 69 | ✓ | ✓ | ✓ | × | × | × | ✓ | ✓ | × | ML | × | × | ✓ | × |
| 10 | Westerlund et al. [196] | 2021 | 167 | ✓ | ✓ | × | ✓ | × | × | ✓ | × | ✓ | DL | × | × | × | × |
| 11 | Schiano et al. [159] | 2021 | 29 | ✓ | ✓ | × | ✓ | ✓ | × | ✓ | × | ✓ | ML | × | × | × | × |
| 12 | Jain et al. [119] | 2022 | 67 | ✓ | ✓ | ✓ | × | × | × | × | ✓ | × | ML | × | × | × | × |
| 13 | Staub et al. [200] | 2022 | 25 | ✓ | ✓ | ✓ | × | × | × | × | ✓ | × | NR | × | × | × | × |
| 14 | Jain et al. [75] | 2022 | 85 | ✓ | ✓ | ✓ | × | × | × | ✓ | ✓ | × | DL | × | × | ✓ | ✓ |
| 15 | Saba et al. (Proposed) | 2023 | 214 | ✓ | ✓ | ✓ | ✓ | ✓ | ✓ | ✓ | ✓ | ✓ | DL | × | × | ✓ | ✓ |
K0: Serial Number, K1: Studies, K2: Year, K3: References, K4: OBBM, K5: LBBM, K6: RBBM, K7: GBBM, K8: PBBM, K9: EBBM, K10: Preventive, K11: Prediction, K12: Personalized, K13: AI Type, K14: FDA discussion, K15: Clinical Setting, K16: Risk of Bias, K17: AI explainability. CVD, Cardiovascular Disease; DL, Deep Learning; ML, Machine Learning; HDL, Hybrid deep learning; NR, Not reported.
Evaluating bias in AI models has gained much greater significance in recent years [204, 205]. Earlier computer-aided diagnosis techniques showed a lack of bias in evaluations [206]. To reduce bias, a large sample size, appropriate clinical testing, the incorporation of comorbidities, the use of big data configurations, the usage of unseen data analysis, and the scientific validation of training model design are all strategies that can be utilized [140, 207]. Essential phases in patient risk stratification include determining the AI RoB [191, 207, 208] and suitably modifying diagnostics and treatment.
Edge devices are becoming increasingly important as cloud-based systems and the internet improve. Edge devices are extremely important when using trained AI models for future predictions or disease risk stratifications in mobile frameworks. There is a requirement to deploy compressed models since huge data models cannot be deployed on edge devices. Image-based DL models such as fully convolutional networks (FCN) or segmentation networks (SegNet) [40] can be pruned using evolutionary algorithms such as Particle Swarm Optimization (PSO), Genetic Algorithms (GA), Wolf Optimization (WO), and Differential Evolution (DE) [209]. The future of radiomics-based CVD risk stratification fused genetic-based paradigms can be compressed and deployed on edge devices for rural areas, especially in third-world nations.
The following are recommendations for a suggested Radiogenomics model that can
be used to stratify CVD/stroke risk. The study proposes two hypotheses: (a)
radiomics and genomic biomarkers have a strong correlation and can be used to
detect the severity of CVD and stroke precisely, and (b) The proposed review
suggests a unique, unbiased, and XAI model (AtheroEdge
This pilot review’s ability to risk stratify CVD and stroke patients by
integrating RBBM and GBBM was a major strength. The biomarkers generated from
radiological, biochemical, and morphological complexity that demonstrated a link
to CVD supported the first hypothesis. An XAI-based composite risk CVD/Stroke
model using DL can predict, with precision, in a preventive and personalized
(aiP
In clinical trials, researchers often analyze the effectiveness of a new treatment or intervention compared to a control group. One of the essential statistical measures used in this context is the “Odds Ratio” (OR). The odds ratio helps to assess the association between an exposure (such as receiving a treatment) and an outcome (such as a positive response to the treatment) [212].
The odds ratio is calculated by taking the ratio of two odds: the odds of an event occurring in the treatment group and the odds of the same event occurring in the control group. Mathematically, it can be expressed as:
The odds ratio is calculated as follows:
Where:
The odds ratio can be used to determine if there is a significant difference in the odds of the outcome between the treatment and control groups. If the odds ratio is equal to 1, it suggests that there is no association between the treatment and the outcome, meaning the treatment has no effect. If the odds ratio is greater than 1, it indicates that the treatment is associated with a higher likelihood of the outcome. Conversely, if the odds ratio is less than 1, it implies that the treatment is associated with a lower likelihood of the outcome [213].
Researchers typically calculate the odds ratio along with a confidence interval to assess the statistical significance of the results. If the confidence interval includes the value 1, the results are considered not statistically significant, while values above or below 1 indicate a statistically significant association [214]. The odds ratio is a useful tool in clinical trials as it provides valuable information about the relative impact of a treatment compared to a control group. However, it’s essential to interpret the odds ratio in the context of the study design and the specific clinical question being addressed [214]. In conclusion, the odds ratio is a critical statistical measure used in clinical trials to analyze the association between treatment and outcomes, providing valuable insights into the effectiveness of interventions.
The proposed research investigation presented two hypotheses: (i) an extensive
investigation into several genomic biomarkers, namely, IL, CD31+, EPCs, and
hs-CRP, which have been found to correlate most significantly with prognosis. The
surrogate radiomic features such as plaque burden, plaque area, carotid intima
thickness, maximum plaque height, and lumen stenosis/lumen diameter further
improve the CVD risk prediction. (ii) The proposed review suggests a unique,
unbiased, and XAI model (AtheroEdge
ARDS, Acute respiratory distress syndrome; LGE, Late gadolinium enhancement; ASCVD, Atherosclerotic cardiovascular disease; LIME, Local interpretable model-agnostic explanations; ANS, Autonomic nervous System; MRI, Magnetic resonance imaging; AUC, Area-under-the-curve; NR, Not reported; AI, Artificial intelligence; NPV, Negative predictive value; ACS, Acute coronary syndrome; NB, Naive bayes; BMI, Body mass index; Non-ML, Non-machine learning; CAD, Coronary artery disease; OBBM, Office-based biomarker; CAS, Coronary artery syndrome; OH, Orthostatic hypotension; CHD, Coronary heart disease; OxLDL, Oxidation of low-density lipoprotein; CT, Computed tomography; PE, Performance evaluation; CUSIP, Carotid ultrasound image phenotype; PPV, Positive predictive value; CV, Cross-validation; PCA, Principal component analysis; CVD, Cardiovascular disease; PBBM, Proteomics based bio-markers; CVE, Cardiovascular events; PRISMA, Preferred reporting items for systematic reviews and meta-analyses; CNN, Convolution neural network; PTC, Plaque tissue characterization; DL, Deep learning; RA, Rheumatoid arthritis; DM, Diabetes mellitus; RF, Random forest; DT, Decision tree; ROS, Reactive oxides stress; EC, Endothelial cell; RoB, Risk of bias; EBBM, Environment-based biomarkers; ROC, Receiver operating-characteristics; GT, Ground truth; RNN, Recurrent neural network; GBBM, Genetically based biomarkers; SCORE, Systematic coronary risk evaluation; HTN, Hypertension; SMOTE, Synthetic minority over-sampling technique; HDL, Hybrid deep learning; SVM, Support vector machine; ICAM, Intercellular adhesion molecule; SHAP, Shapley additive explanations; VCAM, Vascular cell adhesion molecule; TPA, Total plaque area; LBBM, Laboratory-based biomarker; TC, Tissue characterization; LA, left atrium; US, Ultrasound.
MM: Design of the manuscript, proofreading many iterations, researching PubMed and other research sites for article search, AMJ, KIP, NNK, MM, JFF, JSS: Resources, imaging contribution and proofreading of the manuscript, MM, AMJ, LM, ERI, MMF: Design of the genomics and genetics component of the manuscript, proofreading many iterations, researching PubMed and other research sites for article search, JSS, VR, VV, MKK, NS: Proofreading and guidance of cardiology components of the manuscript, JSS, AN, NNK: The vision of cardiac risk assessment and proofreading the manuscript, final approval of the manuscript, MKK, LS: Design and support of radiology components such as CT and carotid ultrasound, JRL, SC, MMF, MAM: Proofreading and guidance of cardiology imaging components of the manuscript, JRL, VV, KIP ZR, ERI: Proofreading and guidance of cardiology and genomics components, MM, JSS: Design and solid proofreading of the manuscript, especially the Phramamode component, revising it critically for important intellectual content, and final approval of the manuscript, SC, VR, MKK ERI, MMF: clinical trial and proofreading of the manuscript, JSS: Principal Investigator-design, proofreding of the manuscript and management. All authors contributed to editorial changes in the manuscript. All authors read and approved the final manuscript. All authors have participated sufficiently in the work and agreed to be accountable for all aspects of the work.
Not applicable.
Not applicable.
This research received no external funding.
Dr. Suri and Dr. Maindarkar is with AtheroPoint™ LLC, Roseville, CA, USA, which does cardiovascular and stroke imaging. The authors declare no conflict of interest.
References
Publisher’s Note: IMR Press stays neutral with regard to jurisdictional claims in published maps and institutional affiliations.