
- Academic Editor
Background: Metabolic reprogramming is an important player in the prognosis of cancer patients. However, metabolism-related genes (MRGs) that are essential to the prognosis of bladder cancer (BLCA) are nor yet fully understood. The purpose of this study is to use bioinformatics methods to establish prognostic models based on MRGs in BLCA to screen potential biomarkers. Methods: Based on the transcriptomic data from BLCA patients in The Cancer Genome Atlas Program (TCGA) and Gene Expression Omnibus (GEO) databases, we identified the differentially expressed genes related to metabolism and analyzed the functional enrichment by edgeR package. A prognostic model was generated using univariate Cox regression analysis and validated using GEO dataset. The prognostic risk model was analyzed by the Kaplan-Meier curve. The single cell RNA sequencing (scRNA-seq) revealed the gene interaction networks and traced the development trajectories of distinct cell lineages. The levels of key metabolism-related biomarkers in vitro were verified by quantitative real-time polymerase chain reaction (qRT-PCR). Results: We screened 201 differentially expressed metabolism-related genes (DEMRGs), which were significantly enriched in oxidative phosphorylation. The risk model was constructed by 5 biomarkers. qRT-PCR analysis verified that there is a significant higher expression of FASN and MTHFD1L in carcinoma tissue. Conclusions: This study constructed a novel prognostic model based on a combination of clinical and molecular factors that related to metabolic reprogramming, which has the potential to improve the prediction of independent prognosis indicators and management of BLCA patients, leading to better treatment outcomes and survival rates.
Bladder cancer (BLCA) is one of the most invasive malignant tumors in the urinary system, and it is associated with a high recurrence rate and high mortality rate [1]. In 2020, there were 573,000 new cases and 213,000 deaths worldwide [2]. Urothelial cancer, is the most common type of BLCA, accounting for 95% of cases. It is typically classified into two main subtypes based on the depth of invasion into the bladder wall: non-muscular invasive bladder cancer (NMIBC) and muscular invasive bladder cancer (MIBC). The treatment for BLCA depends on the stage and grade of the tumor, and the main treatment options include transurethral resection of bladder tumor, intravesical instillation, radical cystectomy, chemotherapy, radiotherapy, immunotherapy, and targeted therapy [3, 4]. Although there are various therapy methods that have made great progress, more than half of the patients may still relapse or progress after treatment, and the cystectomy rate and cancer-specific mortality rate of these patients are significantly higher. It is a serious threat to the quality of life and even the lives of patients with BLCA [5, 6]. One of the reasons may be the lack of reliable biomarkers to accurately predict the prognosis and the inability to stratify the risk in advance, which makes it impossible for us to adjust the treatment plan accordingly [7].
Studies have indicated that all kinds of cancer cells undergo great metabolic
changes in order to maintain their proliferation and evolution under adverse
environment, mainly as follows: glucose metabolism dominated by aerobic
glycolysis, oxidative phosphorylation weakened, pentose phosphate metabolic
pathway enhanced, glutamine catabolism active, fatty acid ab initio synthesis and
Previous studies have confirmed that some MRGs are closely associated with the occurrence and pregression of BLCA. Fructose-1 receptor 6-diphosphatase 1 (FBP1), as a potential biomarker of BLCA molecular subtypes, is involved in glycolysis flow and gluconeogenesis [13]. Fork frame transcription factor J1 (FOXJ1) also plays a role in glycolysis phenotype of BLCA [14]. Forthermore, fatty acid desaturase 1 (FADS1), which is a member of the fatty acid desaturase gene family, has been shown that its overexpression is positively correlated with BLCA tumor grade [15]. The epigenetic crosstalk of SAT1 and ASS1 genes might play a role in chemotherapy and personalized treatment of BLCA by regulating the amino acid metabolism of BLCA [16]. While certain MRGs have been shown to be associated with BLCA, the potential value of these genes in predicting the prognosis of BLCA independently is limited. Futheromore, the important role of somatic mutation is not included in the research system, which requires us to further develop and explore.
The development of single cell sequencing (scRNA-seq) technology has given us a new and profound understanding of cancer evolution, tumor microenvironment (TME) and tumor heterogeneity. This has led to new insights into the mechanisms of tumorigenesis, tumor metastasis, and therapeutic resistance, and has helped identify norvel drugs targets and treatment strategies [17]. For example, the application of scRNA-seq in the field of BLCA has enhanced our understanding of the origin and driving genes of BLCA. scRNA-seq analysis of the somatic mutant alleles spectrum and clone structure of muscle infiltrating bladder urothelial cell carcinoma has ide tified four non-silent mutant alleles of CFTR, NIPBL, ASTN1 and DHX57 that might contribute to maintain the ancestral clones and the muscle invasion ability of subclones [18]. Furthermore, scRNA-seq has shed light on the potential origin of BLCA stem cells, which may be derived from non-stem cells within the bladder or bladder epithelial stem cells, and identified co-mutations of ARIDA1, GPRC5A, and MLL2 that can enhance the stem cell nature of BLCA [19].
Therefore, a series of bioinformatics analysis methods were used to screen the valuable somatic mutation-driven MRGs of BLCA, and the survival risk prediction model based on these potential biomarkers was established and verified. Meanwhile, the correlation analysis of immune cell infiltration, immune checkpoint and chemotherapeutic drug sensitivity were performed in this study. In addition, scRNA-seq data analysis revealed the changes in the expression of these biomarkers with the changes of epithelial cell status, and the key epithelial cell subsets that may affect the prognosis of BLCA were identified. The goal of this study is to explore the mechanism and potential biomarkers of BLCA, and develop new therapeutic targets and approaches.
We downloaded the RNA-seq data of 433 BLCA patients from the TCGA database (https://portal.gdc.cancer.gov/) as training sets, of which 19 control samples and 414 tumour cases. 399 BLCA samples with complete survival information and 338 BLCA samples with somatic mutation data were retrieved. The GSE13507 and GSE135337 datasets were downloaded from the GEO database (https://www.ncbi.nlm.nih.gov/geo/). GSE13507 dataset, including 165 BLCA cases with survival information, was used as a validation set. The GSE135337 dataset incorporated scRNA-seq data of 7 BLCA samples. And 2751 MRGswere obtained from literature reports [20].
The expression matrix of 2751 MRGs was extracted from the TCGA-BLCA. The
differentially expressed metabolism-related genes (DEMRGs) between normal and
BLCA samples were screened using limma (version 3.48.3) [21] package in the R
(version 4.2.3, University of Auckland, New Zealand). Based on p
Firstly, the mutation frequency of DEMRGs was calculated using maftools package (Version 2.8.05) [24] according to TCGA-BLCA somatic mutation data. 399 BLCA samples with complete survival information from the TCGA-BLCA were randomly assigned to a training set of 279 cases and a test set of 120 cases. Survival package (Version 3.2-13) in R was used to perform univariate and multivariate COX proportional risk regression analysis. The COX model is used to evaluate whether the mutated DEMRGs were associated with patient survival. R package forestPlot (Version 1.10) was used to draw COX forest plots. The mutated DEMRGs that were found to be associated with BLCA patients were then used as prognostic biomarkers.
We developed a risk models for BCLA patients using the predict.coxph function of
survival package. The risk score we had calcuted using this model is based on the
patient’s clinical and demographic variables, represented by X
We employed the ggplot2 to generate risk curves and heat maps for two groups, survminer (version 0.4.9) to assess the correlations between the groups through K-M survival curves, and survivalROC package (version 1.0.3) to plot Receiver Operating Characteristic (ROC) curves for survival time points. We next verified the models applicability by repeating these analyses on a test set and GSE13507 validation dataset. Finally, we calculated mutation frequency of biomarkers to illustrate the importance of biomarkers in diseases.
The difference between the prognostic risk score and clinical traits (age, stage, gender, T-pathologic, M-pathologic, N-pathologic) in 399 BLCA patients were evaluated. The clinical traits were presented in Supplementary Table 1. BLCA patients were divided into two groups based on their disease stages: non-muscle invasive bladder cancer (NMIBC) and muscle-invasive bladder cancer (MIBC). NMIBC included Tis, Ta and T1 stage and MIBC included T2, T3 and T4 stage. To more closely understand the differences of two groups in the different T-stages, Kaplan-Meier survival curves were plotted. Finally, based on independent prognostic indicators identified through Cox analysis, we constructed nomogram using RMS (version 6.2-0) and Regplot (version 1.1). The nomogram was then evulated using the calibration curves of 1-, 3-, 5-year, which was used to observe deviations between predicted and actual survival rates.
In order to further explore related signaling pathways and potential biological
mechanisms, the enrichment analysis for biomarkers was performed using
ClusterProfiler and org.Hs.eg.db Bioconductor annotation data package (version
3.12.0), respectively. The GSEA enriched gene set files (GO:
c5.go.v7.4.entrez.gmt, KEGG: c2.cp.kegg.v7.4.entrez.gmt) were acquired from the
GSEA website (http://www.gsea-msigdb.org/gsea/msigdb). The GSEA was performed for
all genes in two risk groups, the threshold was set to
The ICI of targeting immune checkpoints can upgrade the therapeutic efficacy of tumors. The conventional immune checkpoints CD274(PD-L1), CTLA-4(CTLA4), LAG-3(LAG3), LGALS(GAL9), HAVCR2(TIM3), PDCD1(PD-1), PDCD1LG2(PD-1LG2), and TIGHT(TIGIT) on patient survival were analyzed, and the K-M curves were plotted using survminer. We then used the ggplot2 to plot the checkpoints expression in two risk groups. In addition, we used the corrplot package (Version 0.92) to display the correlation between immune checkpoint and risk score. Ultimately, the correlation of 22 immune cells was investigated using the corrplot package. The CIBERSORT calculated the proportions of tumor infiltrating immune cells, and then the proportion of immune cells in two risk groups was plotted through the vioplot (version 0.3.7).
According to the list of 198 drugs in Genomics of Drug Sensitivity in Cancer database (GDSC, https://www.cancerrxgene.org/), the oncoPredict package (Version 0.2) [25] was used to evaluate the chemotherapy response by the IC50 of each patient, and evaluated the response of two groups to anticancer drugs. The smaller the IC50 value of the drug, the stronger the ability of the drug to inhibit cell growth, the better the effect of cancer treatment.
The Seurat (Version 4.10) package [26] was used to conducte quality control of scRNA-seq data in the GSE135337 dataset. The low quality cells were removed to obtain the core cells, the anova was then performed. The core cells gene expression were normalized. The analysis of available dimensions were used using the JackStraw and ScoreJackStraw function. The dimension reduction was executed for the principal component using the tSNE algorithm. Then FindAllMarkers were used to identify biomarkers in each cluster, with min.pct = 0.2 and only-pos = TRUE, and Wilcoxon rank sum test was used to identify differential genes. SingleR (Version 1.6.1) was used to annotate different clusters in CellMarker database. Pseudo-time and heat map of linear differentiation process were analyzed using the plot_genes_in_pseudotime function of Monocle package (version 2.20.0) [27]. Then, ConsensusClusterPlus (Version1.56.0) [28] was used for synonymous clustering analysis. Finally, we made statistics on the number of interaction ligand receptors and polymers among different cell subtypes. The comprehensive and systematic analysis of communication molecules was conducted using the CellPhoneDB dataset. CellPhoneDB was used to analyze cell-to-cell communication networks and identify key cell-cell communication pathways in complex biological systems, gain insights into the various types of communication molecules involved in cell-to-cell interactions, such as ligands and receptors, and the signaling pathways they activate.
We applied quantitative real-time polymerase chain reaction (qRT-PCR) to
validate the expression level of biomarkers in carcinoma
tissue and normal control of 10 patients. Informed consent was obtained from all
participants prior to enrollment into the study. And study protocols were
approved by the Clinical Research Ethics Committees of the First Hospital of
Shanxi Medical University ([2022](K056)). Total RNA was extracted using the
Trizol reagent (Ambion company, Naugatuck, Connecticut, USA) according to the
manufacturer. The SureScript-First-strand-cDNA-synthesis-kit First-Strand cDNA
Synthesis Kit (Servicebio company, Wuhan, China) was used for reverse
transcription reaction. The qRT-PCR reactions were performed as follows: 95 °C pre
denaturation for 1 minute, 40 cycles of 95 °C denaturation for 20 seconds, 55 °C
annealing for 20 seconds, and 72 °C final extension for 30 senconds. The
2
| Gene name | Forward primer | Reverse primer |
| ABCC4 | GGCATACAAAGCAGAAGAGAGG | AAGGCAACGATGATGACAAACA |
| FASN | ACTTGCAGGAGTTCTGGGACAA | CTCGGAGTGAATCTGGGTTGAT |
| ATP2B4 | CAATGAAATCAACTCCCGAAAG | CAATGAAGAGACACCACAGCCA |
| ATP8B2 | TTCCTGTTCCTCCTCATTCTGC | TTCACCTGGTTATCGCTCTTGT |
| MTHFD1L | AGAGAGGCTGCGAGTAAAAGAAG | TGGTGAGATAGAGAAAGGTGGGT |
| GAPDH | ACAACTTTGGTATCGTGGAAGG | GCCATCACGCCACAGTTTC |
In total, 201 DEMRGs were obtained between normal and BLCA samples in the TCGA-BLCA dataset, with
93 up-regulated DEMRGs and 108 down-regulated DEMRGs (Fig. 1A). Heatmap of DEMRGs
between normal and BLCA samples were shown in Fig. 1B. Then the KEGG pathway and
GO function assessed the function of 201 DEMRGs (p
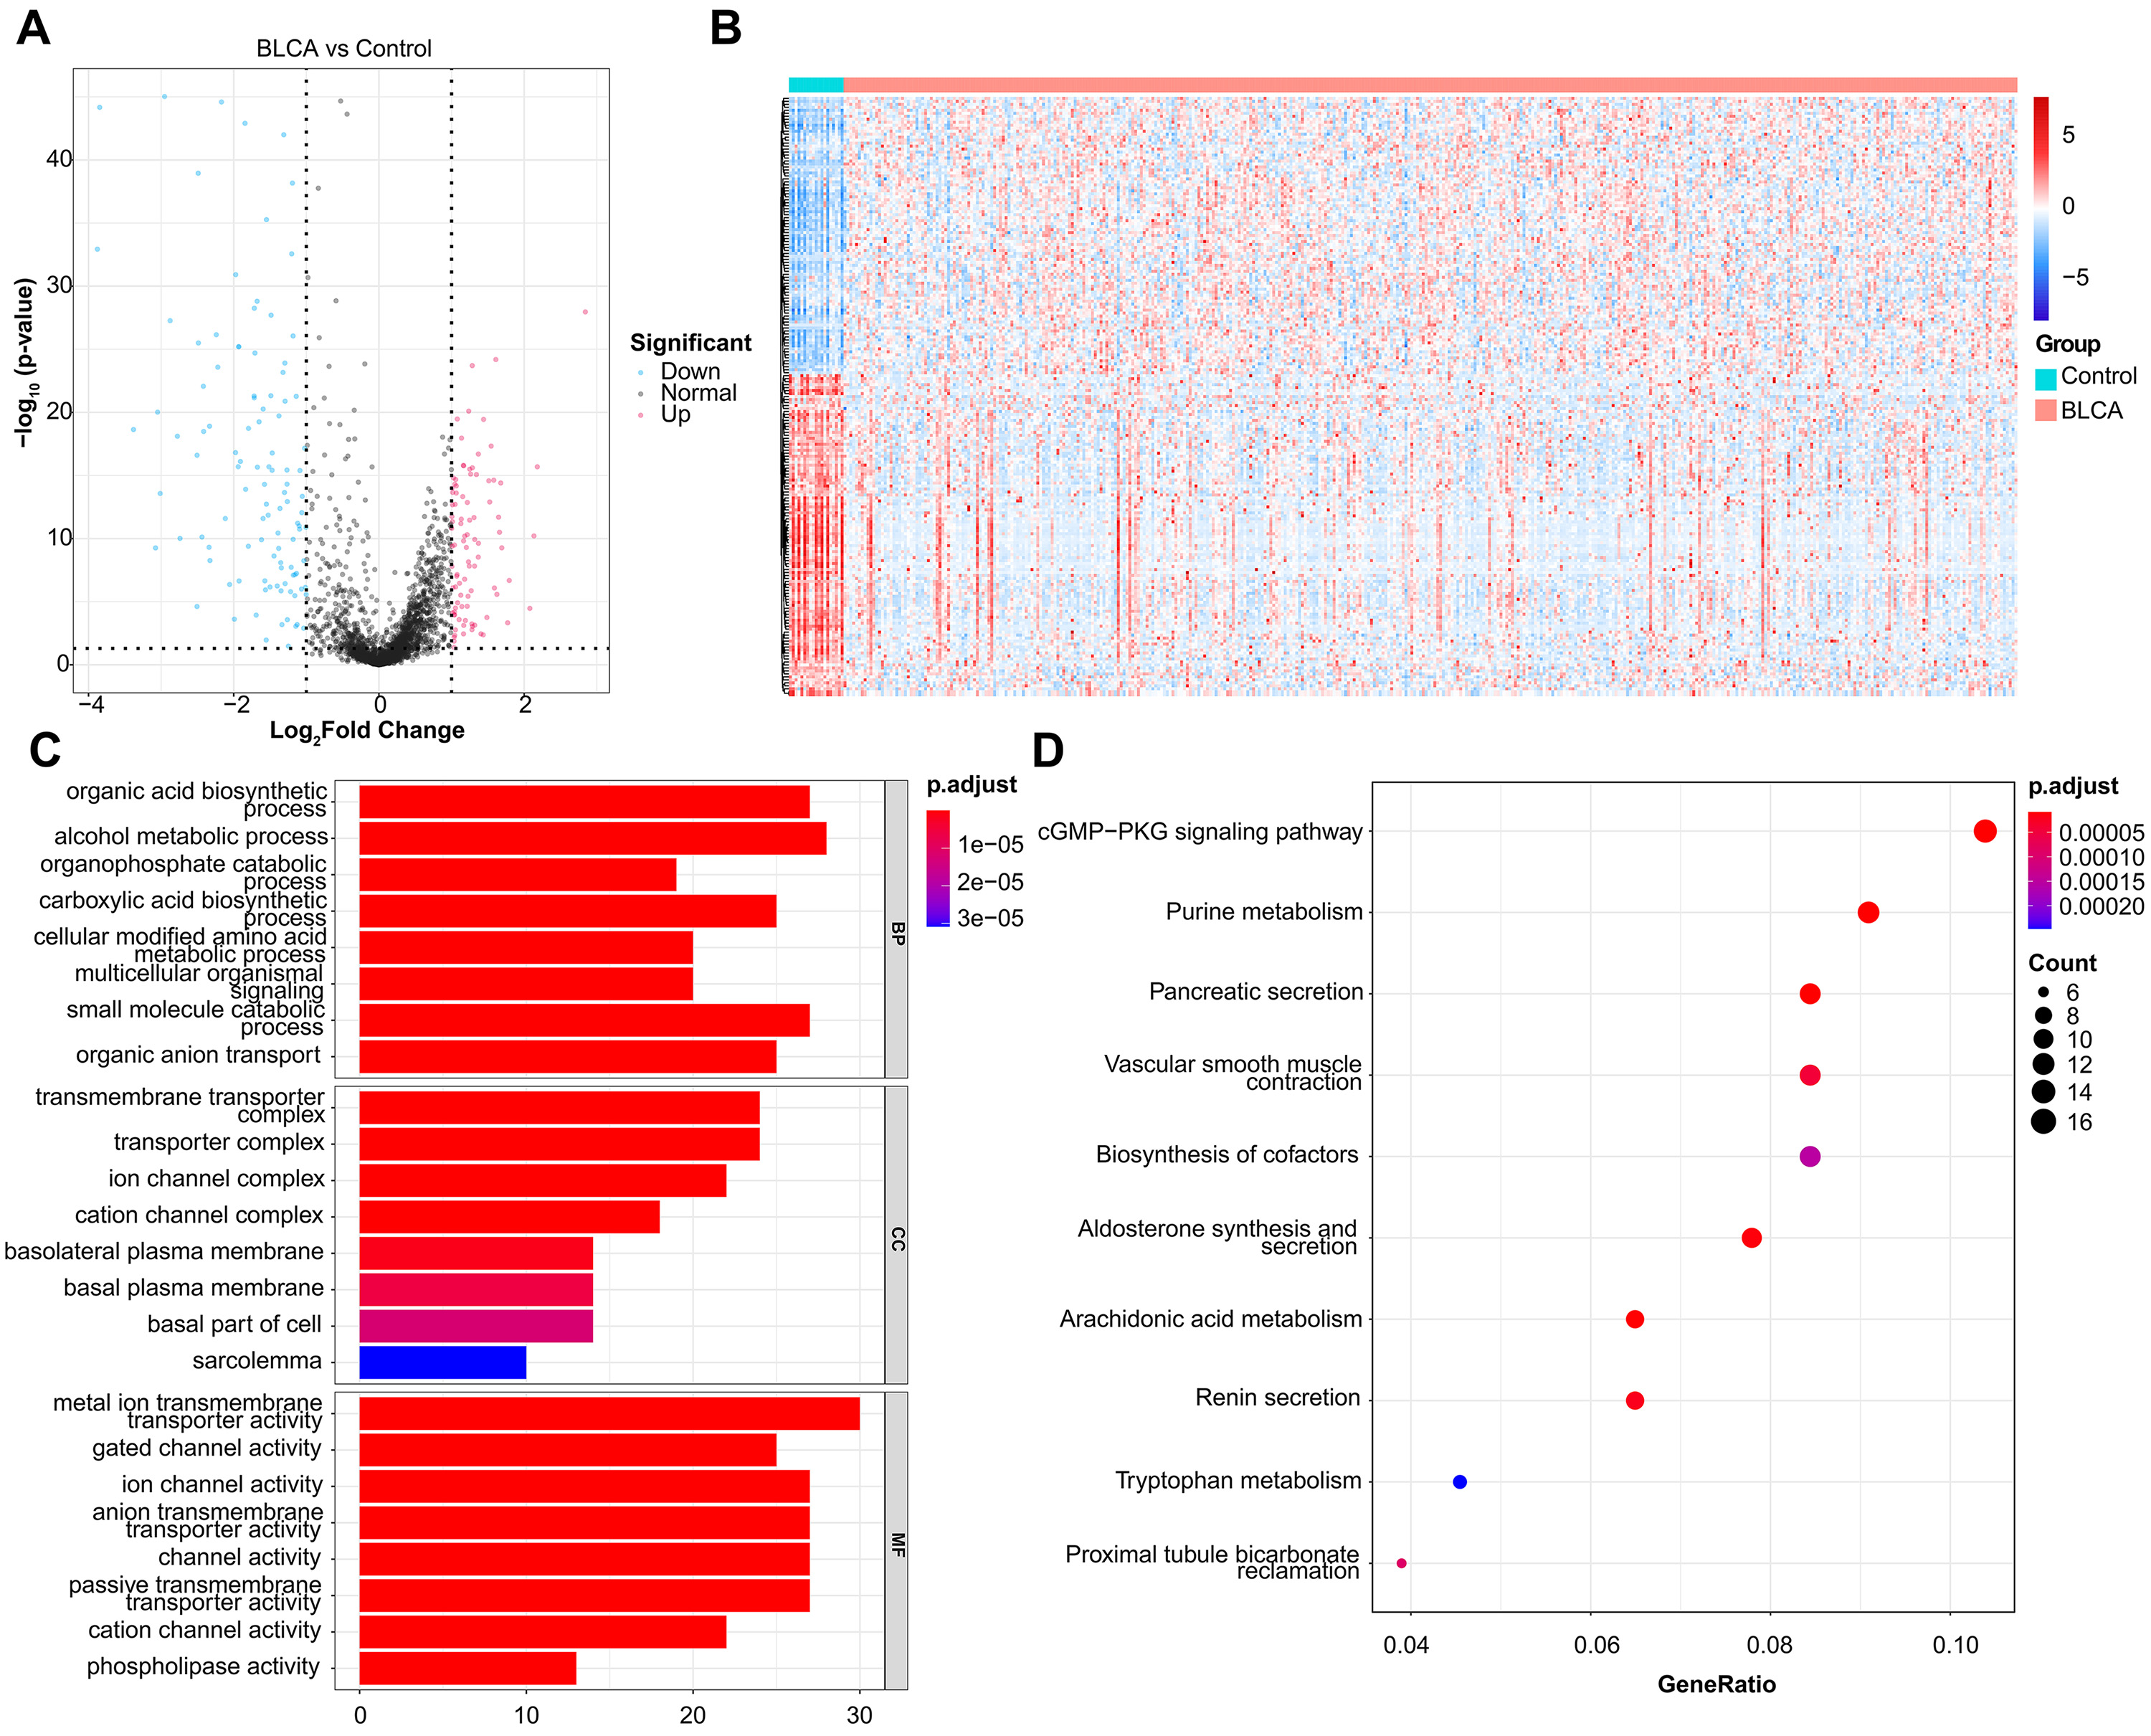 Fig. 1.
DEMRGs screening and functional enrichment analysis. (A) Volcano plot of 201 DEMRGs. The value on x-axis represents the value of Log2FC. Red dots represent up-regulated genes, while blue dots represent down-regulated genes. (B) Heatmap of DEMRGs. The up-regulated DEMRGs are shown in red, while the down-regulated DEMRGs are shown in blue. (C) GO biological process enrichment analysis. (D) KEGG pathway enrichment analysis.
According to TCGA-BLCA somatic mutation data, 24 DEMRGs with mutation frequency
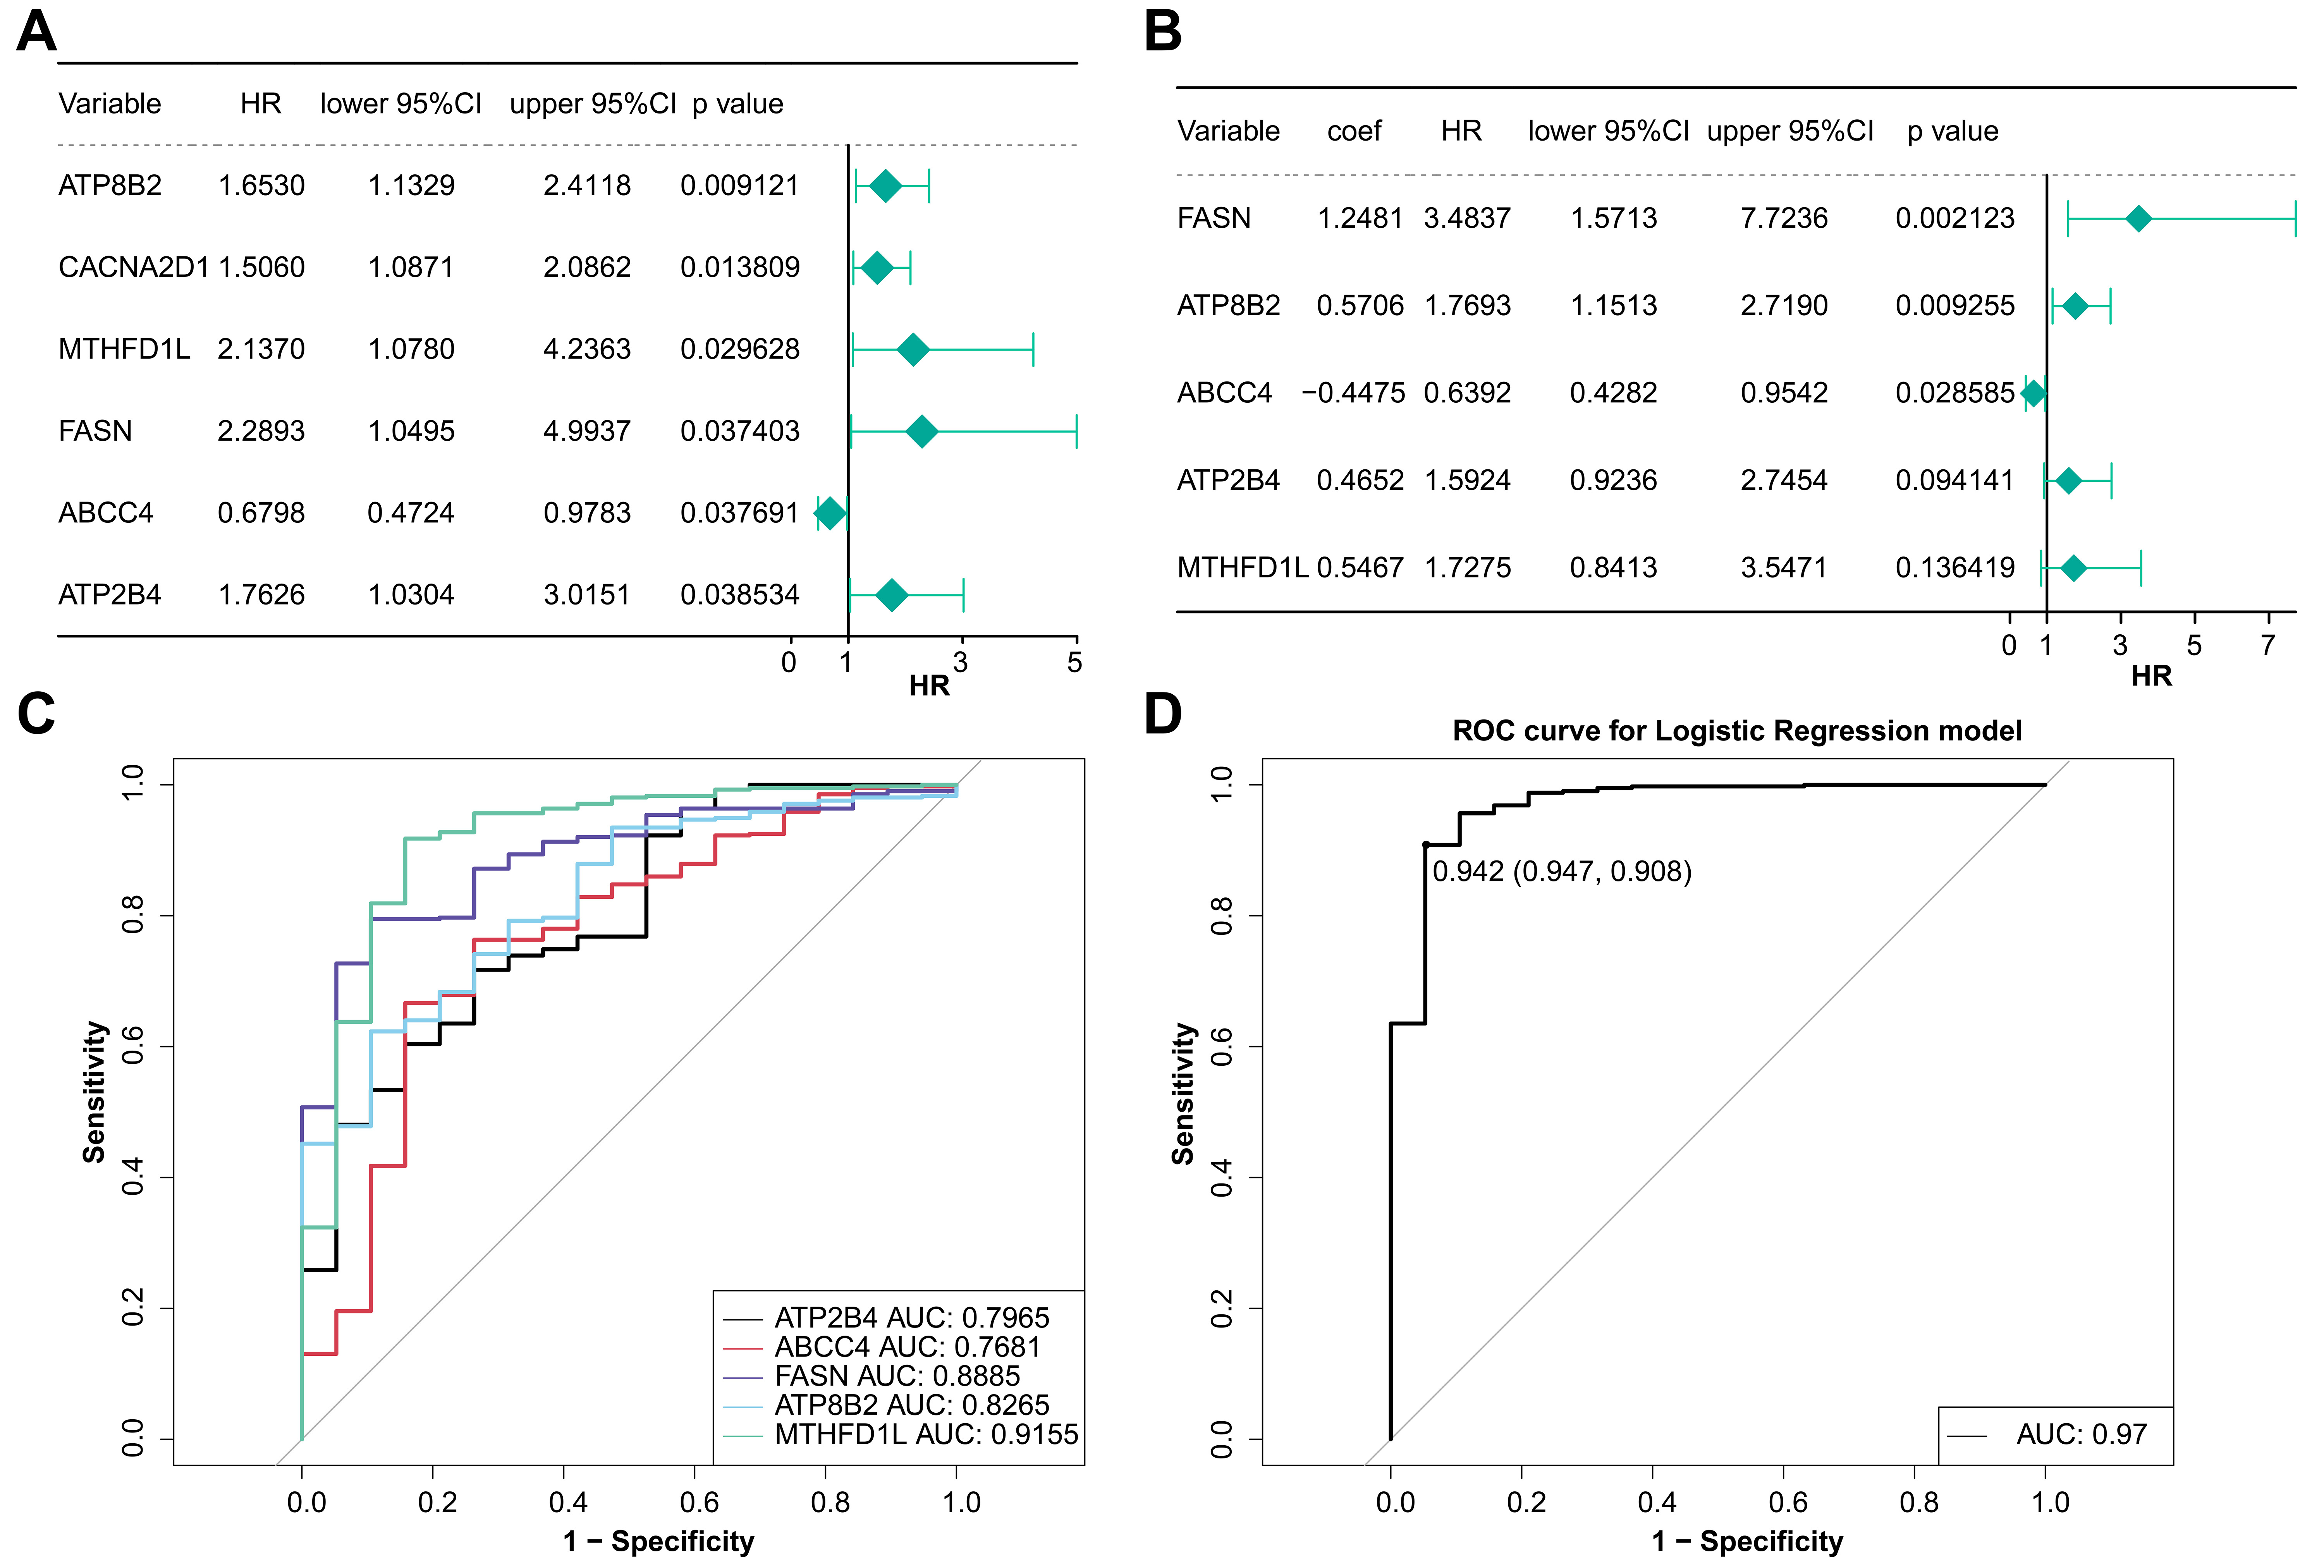 Fig. 2.
Analysis of model genes in BLCA. (A) Univariate Cox regression analysis of prognostic genes. (B) Multivariate Cox regression analysis of prognostic genes. (C) The ROC curve of the diagnostic efficacy of single prognostic genes. (D) The ROC curve of the diagnostic efficacy of model gene.
The risk curve and the heatmap of model genes expression of two groups were
drawn. The expression of ABCC4 in the low-risk group
was higher and it had a HR
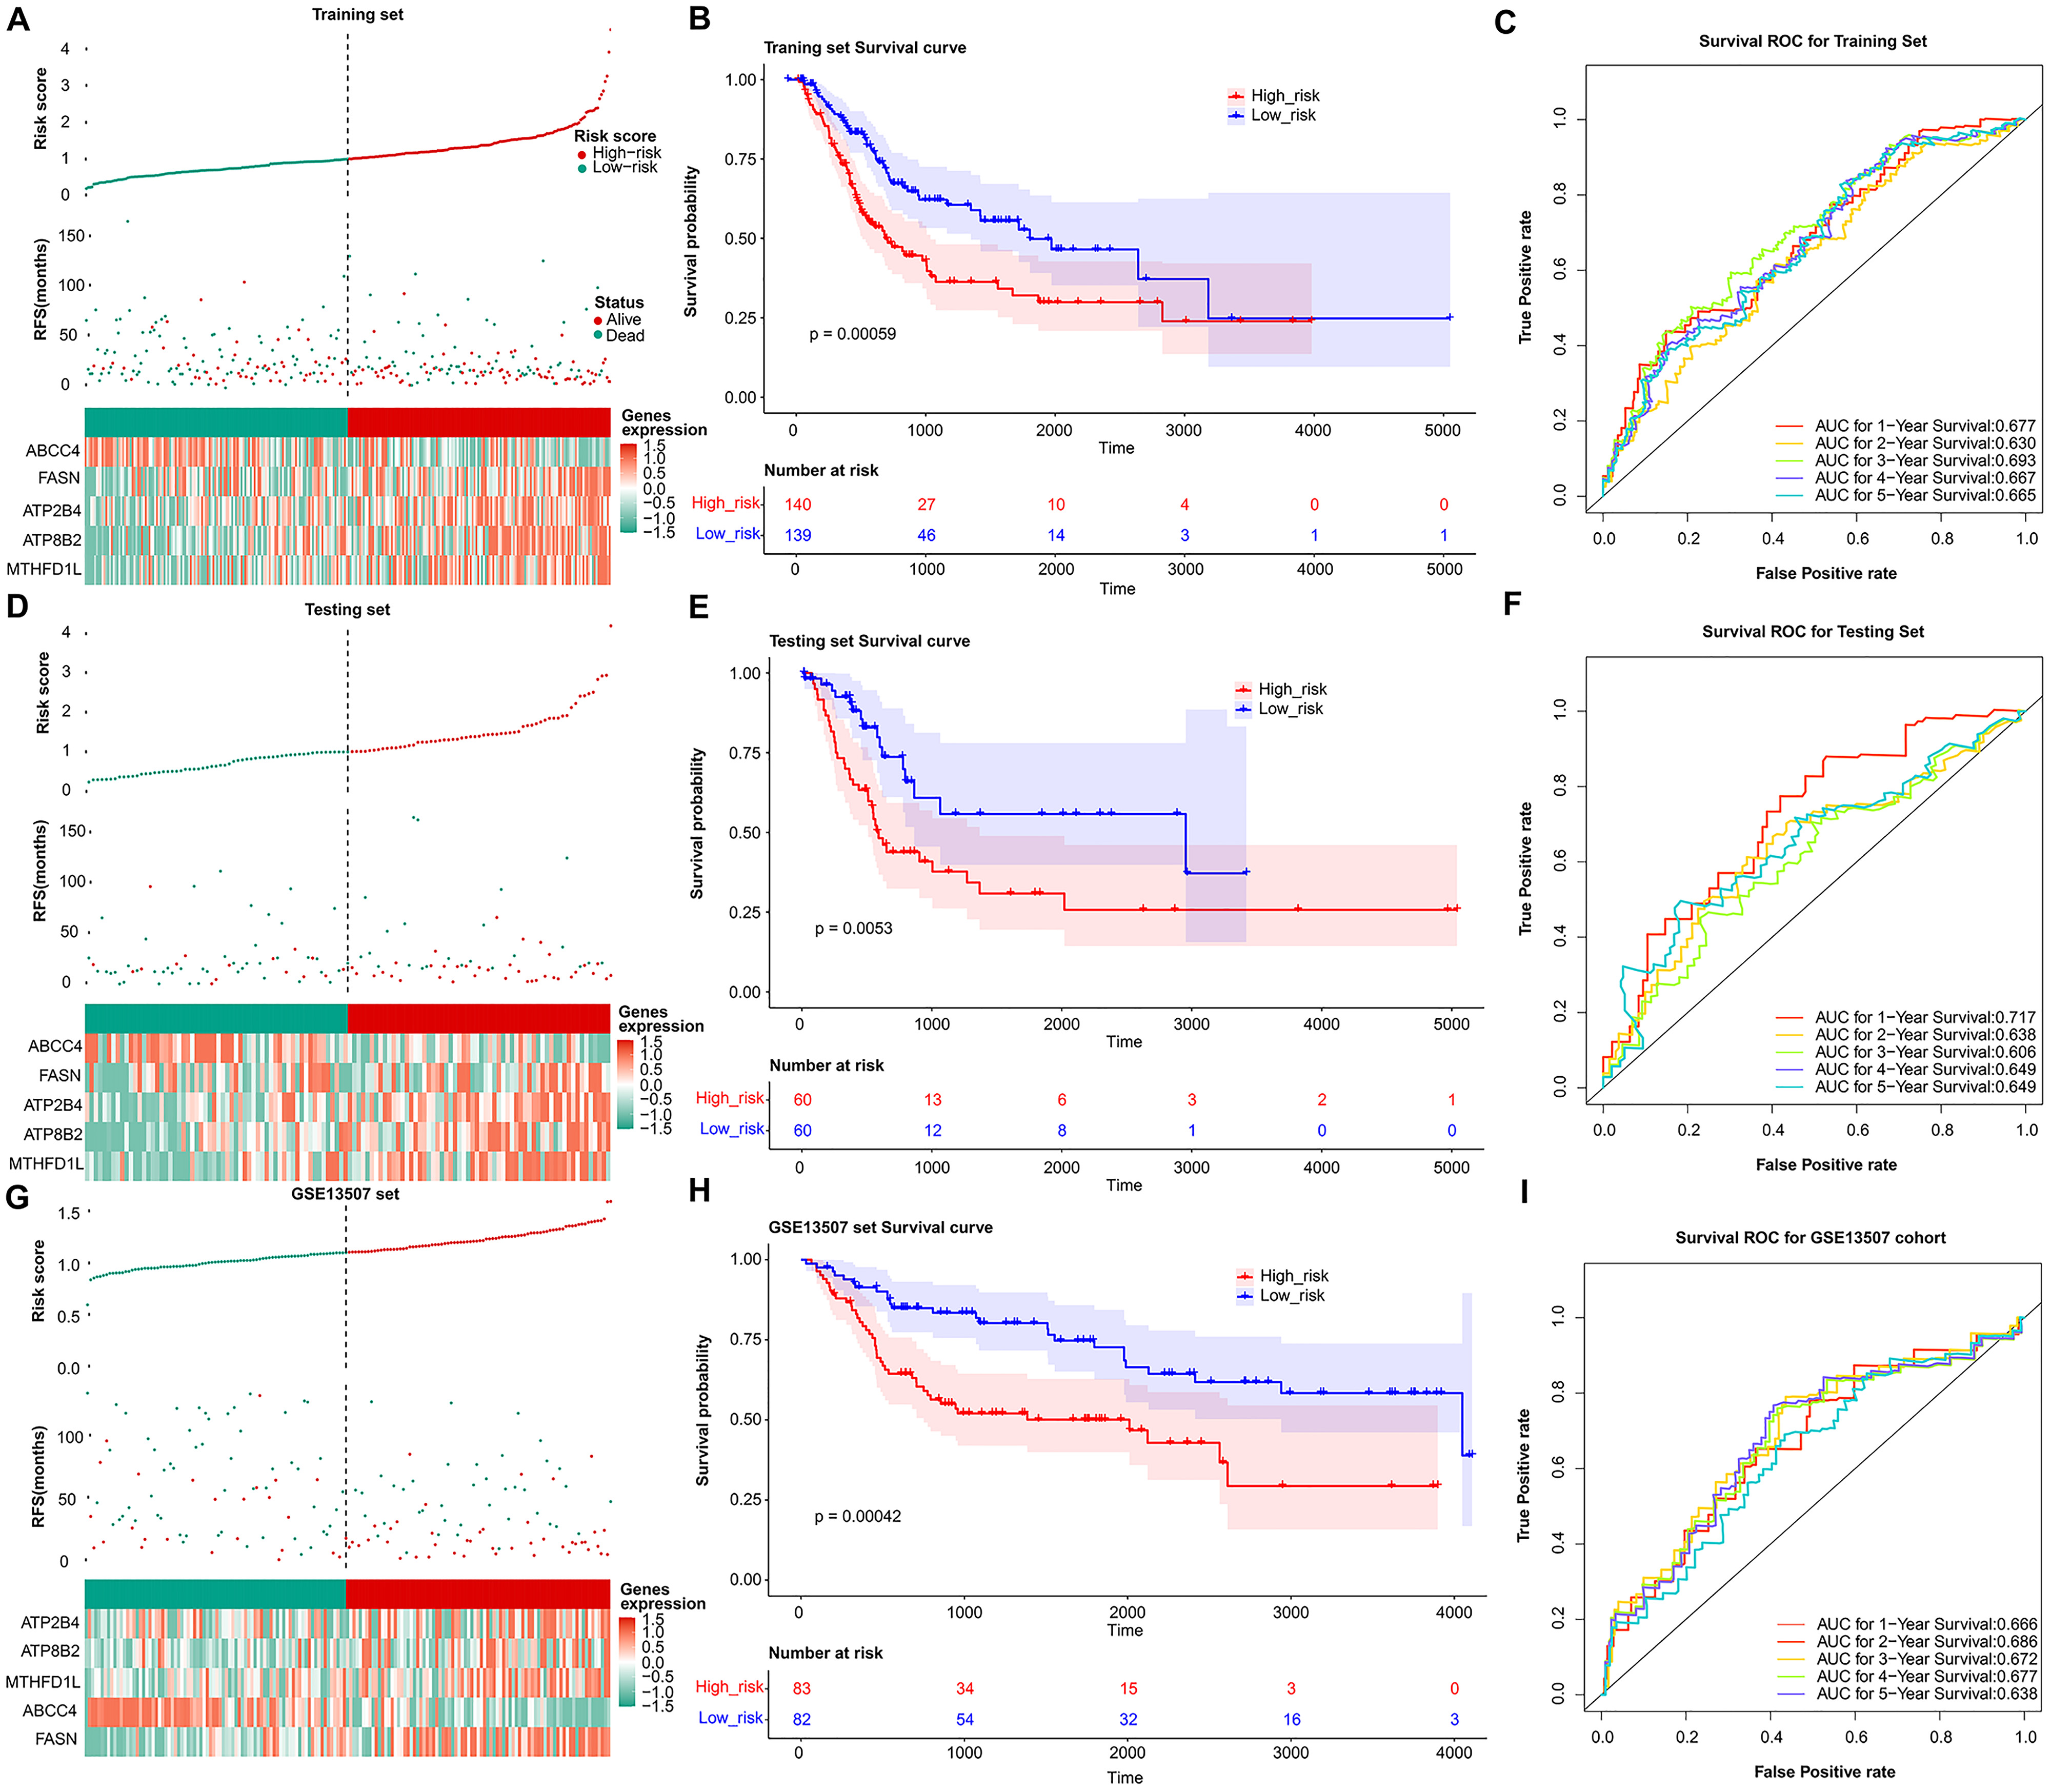 Fig. 3.
Validation of the prognosis genes risk score system. The distribution of the risk score among BLCA patients in high- and low-risk groups, with green representing the number of survivors, and red representing the number of deaths; Heatmap of 5 prognosis genes expression profiles in high- and low-risk groups in the training set (A), test set (D), and validation set (G), separately. (B) Survival curves for high- and low-risk groups in the training set (B), test set (E), and validation set (H). ROC curves analysis of 1-, 2-, 3-, 4-, and 5-year predictions in the training set (C), test set (F), and validation set (I).
The correlation result indicated there were significant differences in prognostic risk scores and clinical traits (Fig. 4A). The results of K-M survival curves in T stage indicated that there were significant survival differences between two groups at pathological T2, T3, T4 stage (Fig. 4B). The Pvalue of all clinical factors was less than 0.05 except gender (Fig. 4C). And riskScore, T-pathologic, age, and N-pathologic were regarded as independent prognostic indicators using multivariate Cox analysis (Fig. 4D). Meanwhile, the nomogram and calibration curves were shown in Fig. 4E,F. And the nomogram C index was 0.7287, indicating the model had good predictive ability.
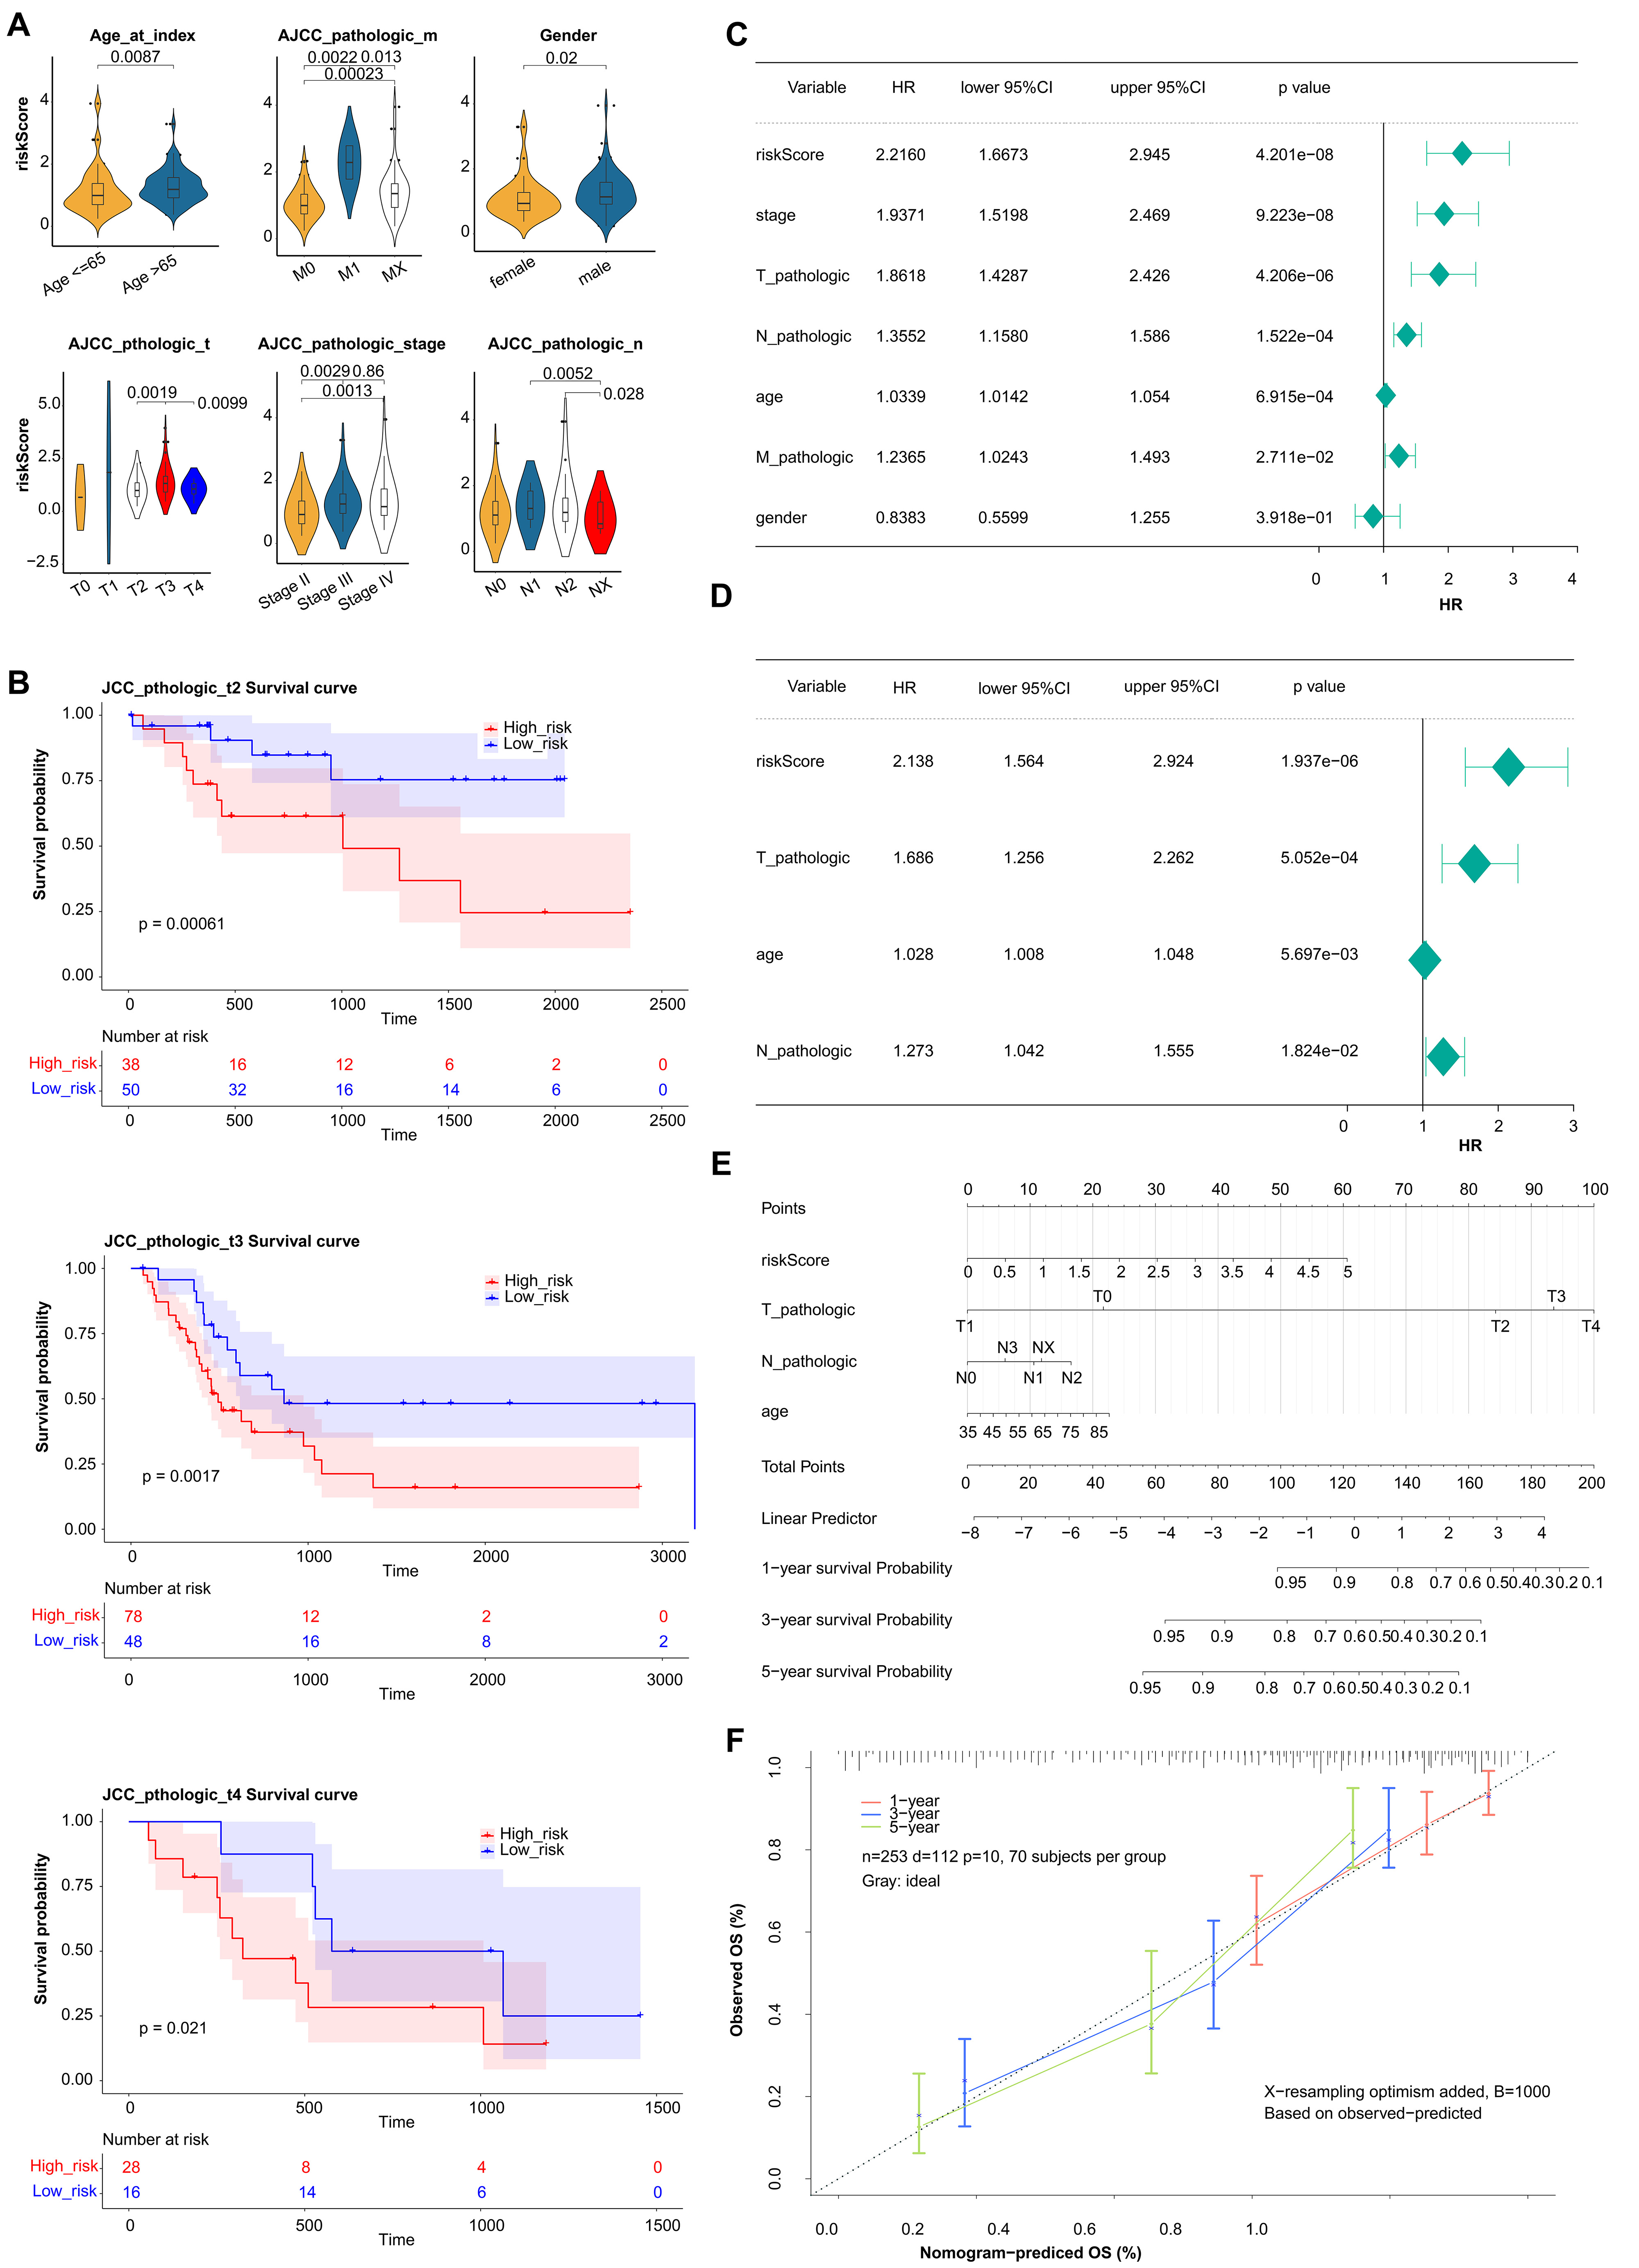 Fig. 4.
Estimation of clinical Value of 5 prognostic genes in BLCA patients. (A) The correlation between the prognostic risk scores and clinical traits. (B) K-M survival curves in T stage between high- and low-risk groups. (C) Univariate Cox regression analysis of clinical traits. (D) Multivariate Cox regression analysis of clinical traits. (E) The nomogram of risk score and clinical traits to predict 1-, 3-, 5-year survival probability. (F) The calibration curves of the nomogram between predicted and observed 1-, 3-, and 5-year Overall Survival (OS).
We performed the GSEA method and acquired 90 GO biological process and 6 KEGG pathways to further validate the function. The top 10 GO enrichment BP and KEGG pathway were shown and the mainly GO terms enriched were GOLGI_APPARATUS, OXIDATIVE_PHOSPHORYLATION, RESPIRASOME, etc. (Supplementary Fig. 3A). The mainly KEGG pathways enriched were STEROID_HORMONE_BIOSYNTHESIS, OXIDATIVE_PHOSPHORYLATION, HUNTINGTONS_DISEASE, etc. (Supplementary Fig. 3B).
The correlation was analyzed to demonstrate the interaction of cell infiltrates in the immune microenvironment (Fig. 5A). The analysis of 22 immune cells population found that 4 immune cells had significantly different proportions. These 4 types of immune cells were B cells memory, Macrophages M0, Dendritic cells resting, and T cells (Fig. 5B). Moreover, the K-M survival curves analysis indicated that the immune checkpoint of LGALS9, PDCD1, and TIGHT had significant differences in two groups (Fig. 5C). And the expression level were analysis, the result indicated significant differences in expression levels of three immune checkpoints between the two groups (Fig. 5D). LGALS9 was significantly increased in low-risk group, wihle PDCD1, and TIGHT were significantly decreased. The correlation analysis results suggested that there are significant positive correlations between risk score and PDCD1 and TIGIF, and negative correlation between the risk score and LGALS9 (Fig. 5E).
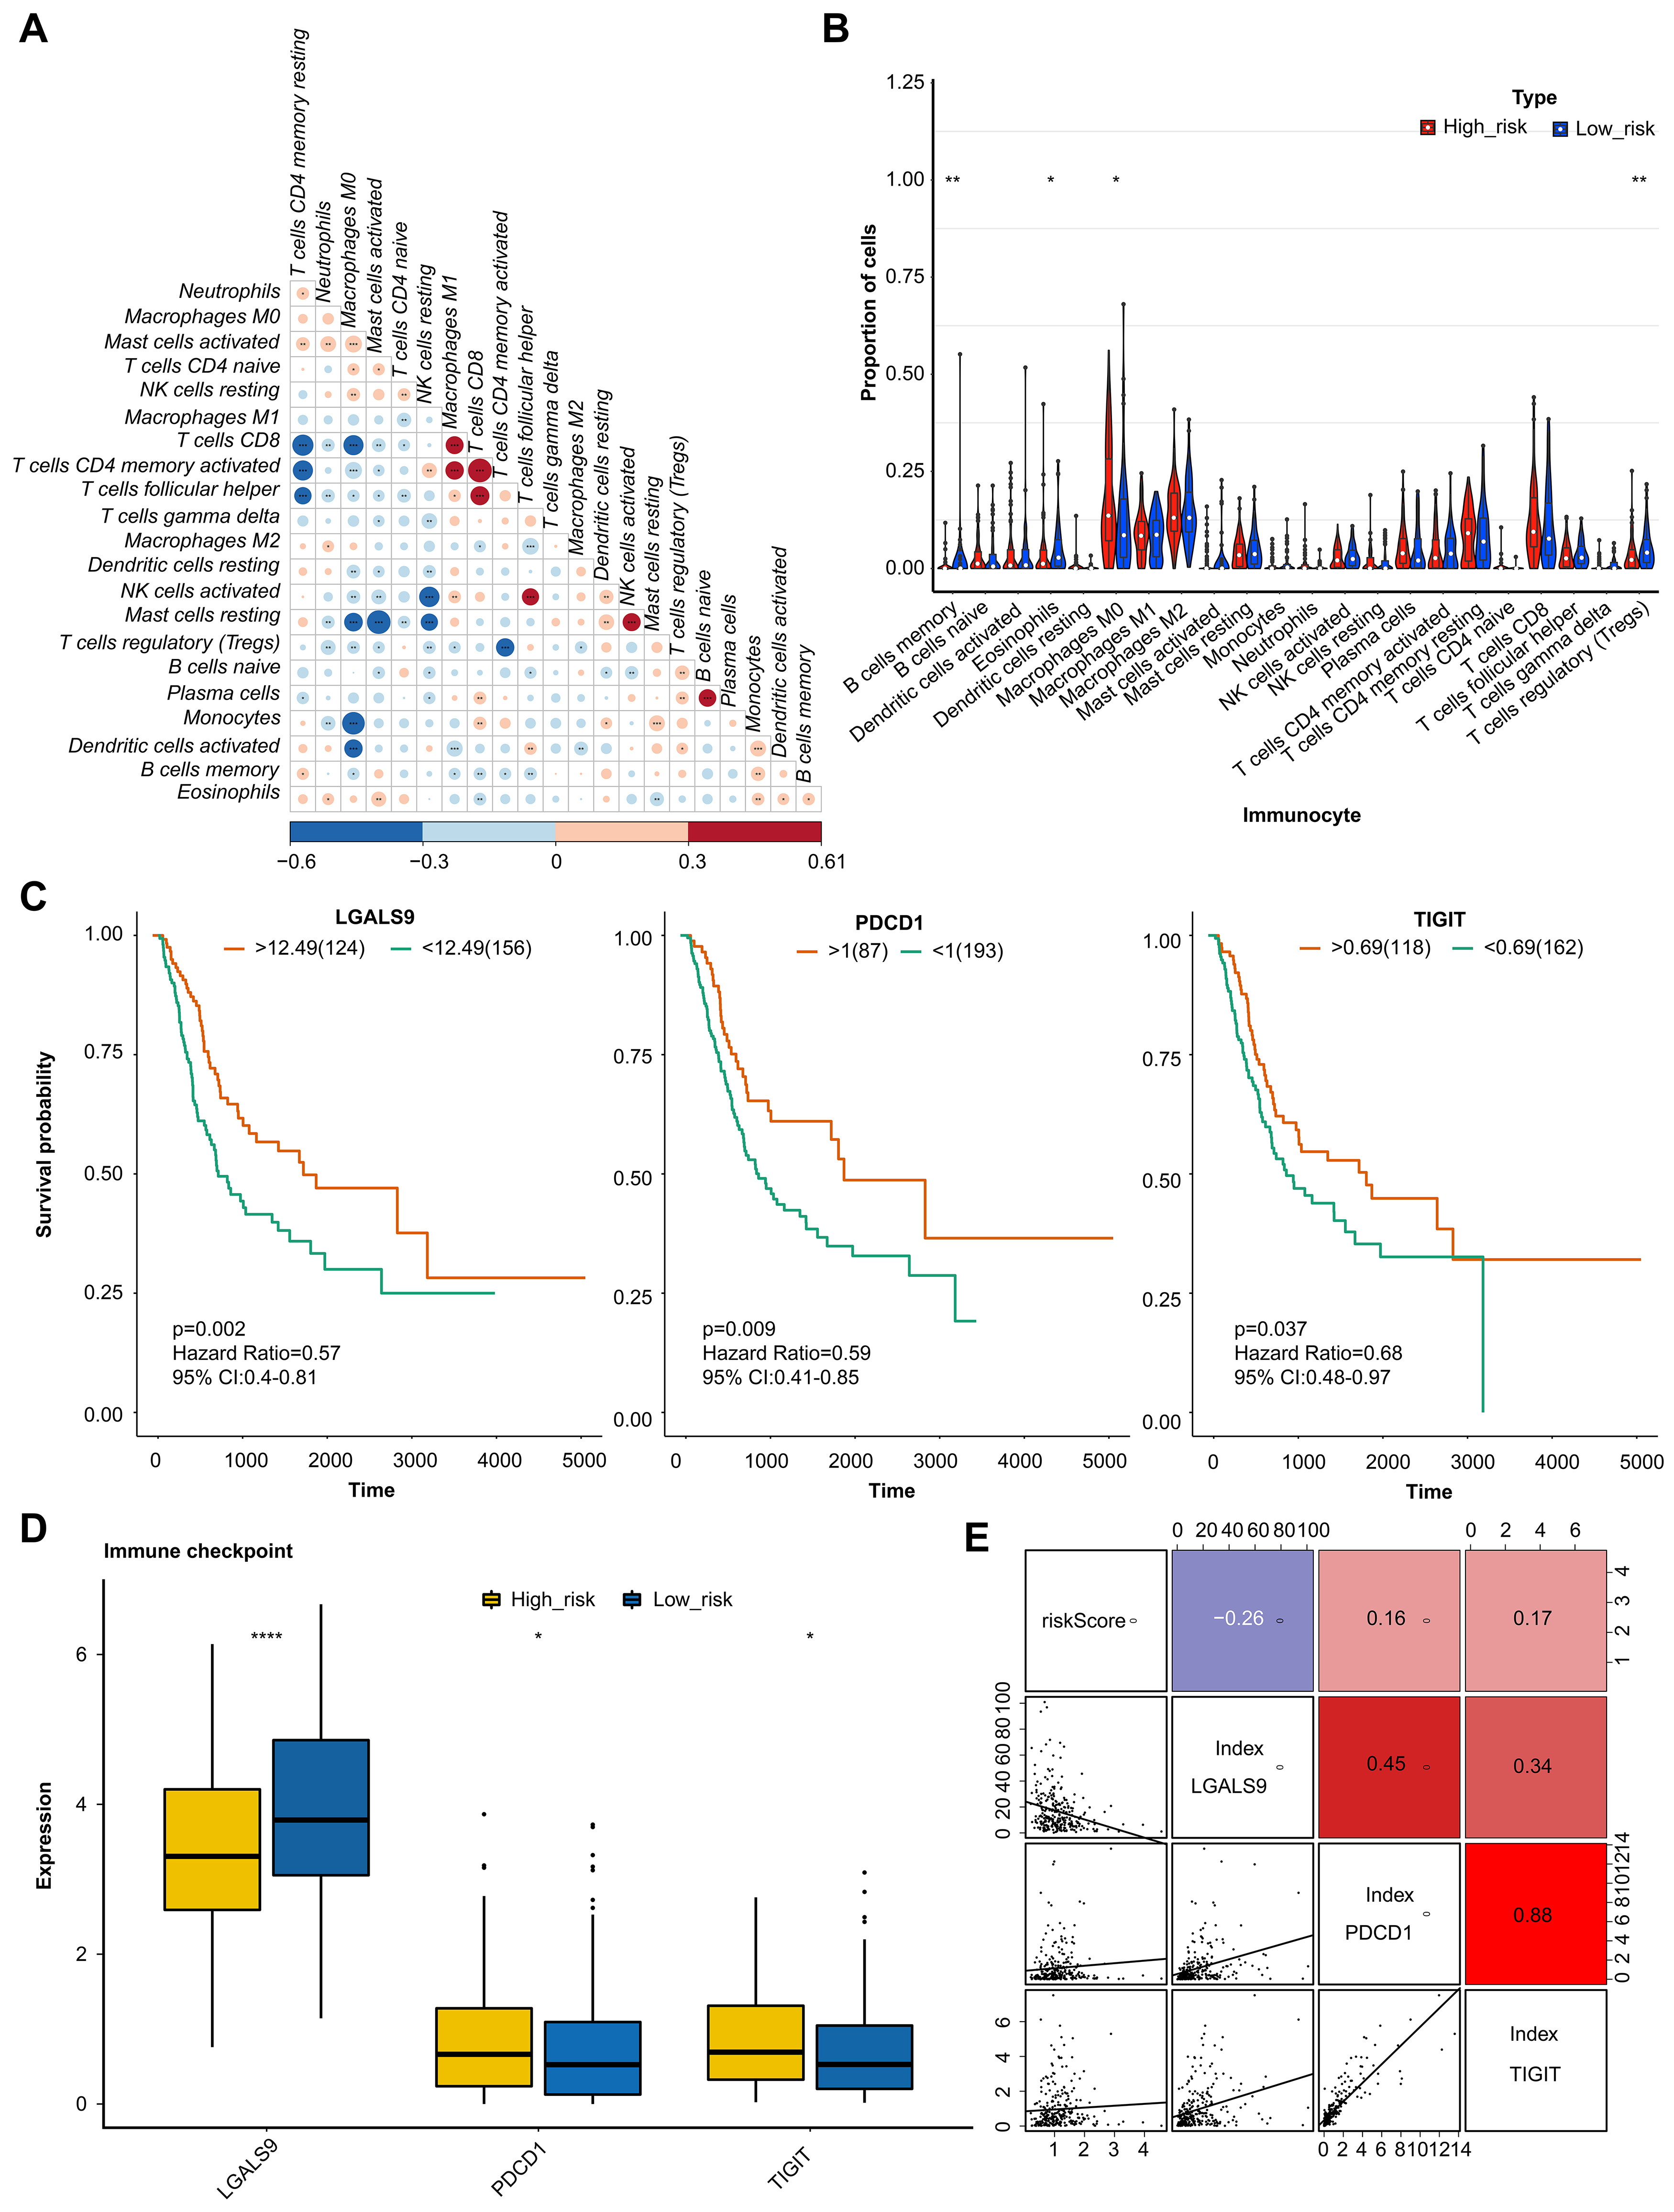 Fig. 5.
Analysis of immune microenvironment and immune checkpoint. (A)
Correlation analysis of immune cells examined the relationship between different
types of immenu cells present in the tumor microenviornment. (B) Proportion of
immune cells by comparison of the percentage of different immune cells in high -
and low-risk groups. (C) KM curve analysis of immune checkpoint showing the
survival rates of patients in high- and low-risk groups, based on the
expression of immune checkpoints. (D) Boxplot of immune checkpoint in high- and
low-risk groups examined the distribution of immune checkpoints in the two
groups. (E) Correlation analysis examined the relationship between the expression
levels of immune checkpoints and risk values. The value bars without asterisk
labeling are not significant, asterisk denotes statistically significant
differences * p
Among the 198 anticancer drug responses, 146 drugs were significantly different between two risk groups (Supplementary Fig. 4A). Patients were more sensitive to 42 drugs in the high-risk group, including 5-Fluorouracil_1073, Camptothecin_1003, Docetaxel_1819, etc. (Supplementary Fig. 4B). While patients were more sensitive to 104 drugs in the low-risk group, including Cisplatin_1005, Epirubicin_1511, Gemcitabine_1190, Vinblastine_1004, etc. (Supplementary Fig. 4C. All 198 drug list was shown in Supplementary Fig. 4D).
The quality control of scRNA-seq was performed, and the results were showed in
Supplementary Fig. 5. The core cells were screened, and 2000 genes whose
expression levels had greatly difference were identified for subsequent analysis
(Supplementary Fig. 6). PCA results showed that the overall distribution
of sample cells was similar, and there were no outlier samples, and 15 principal
components (p
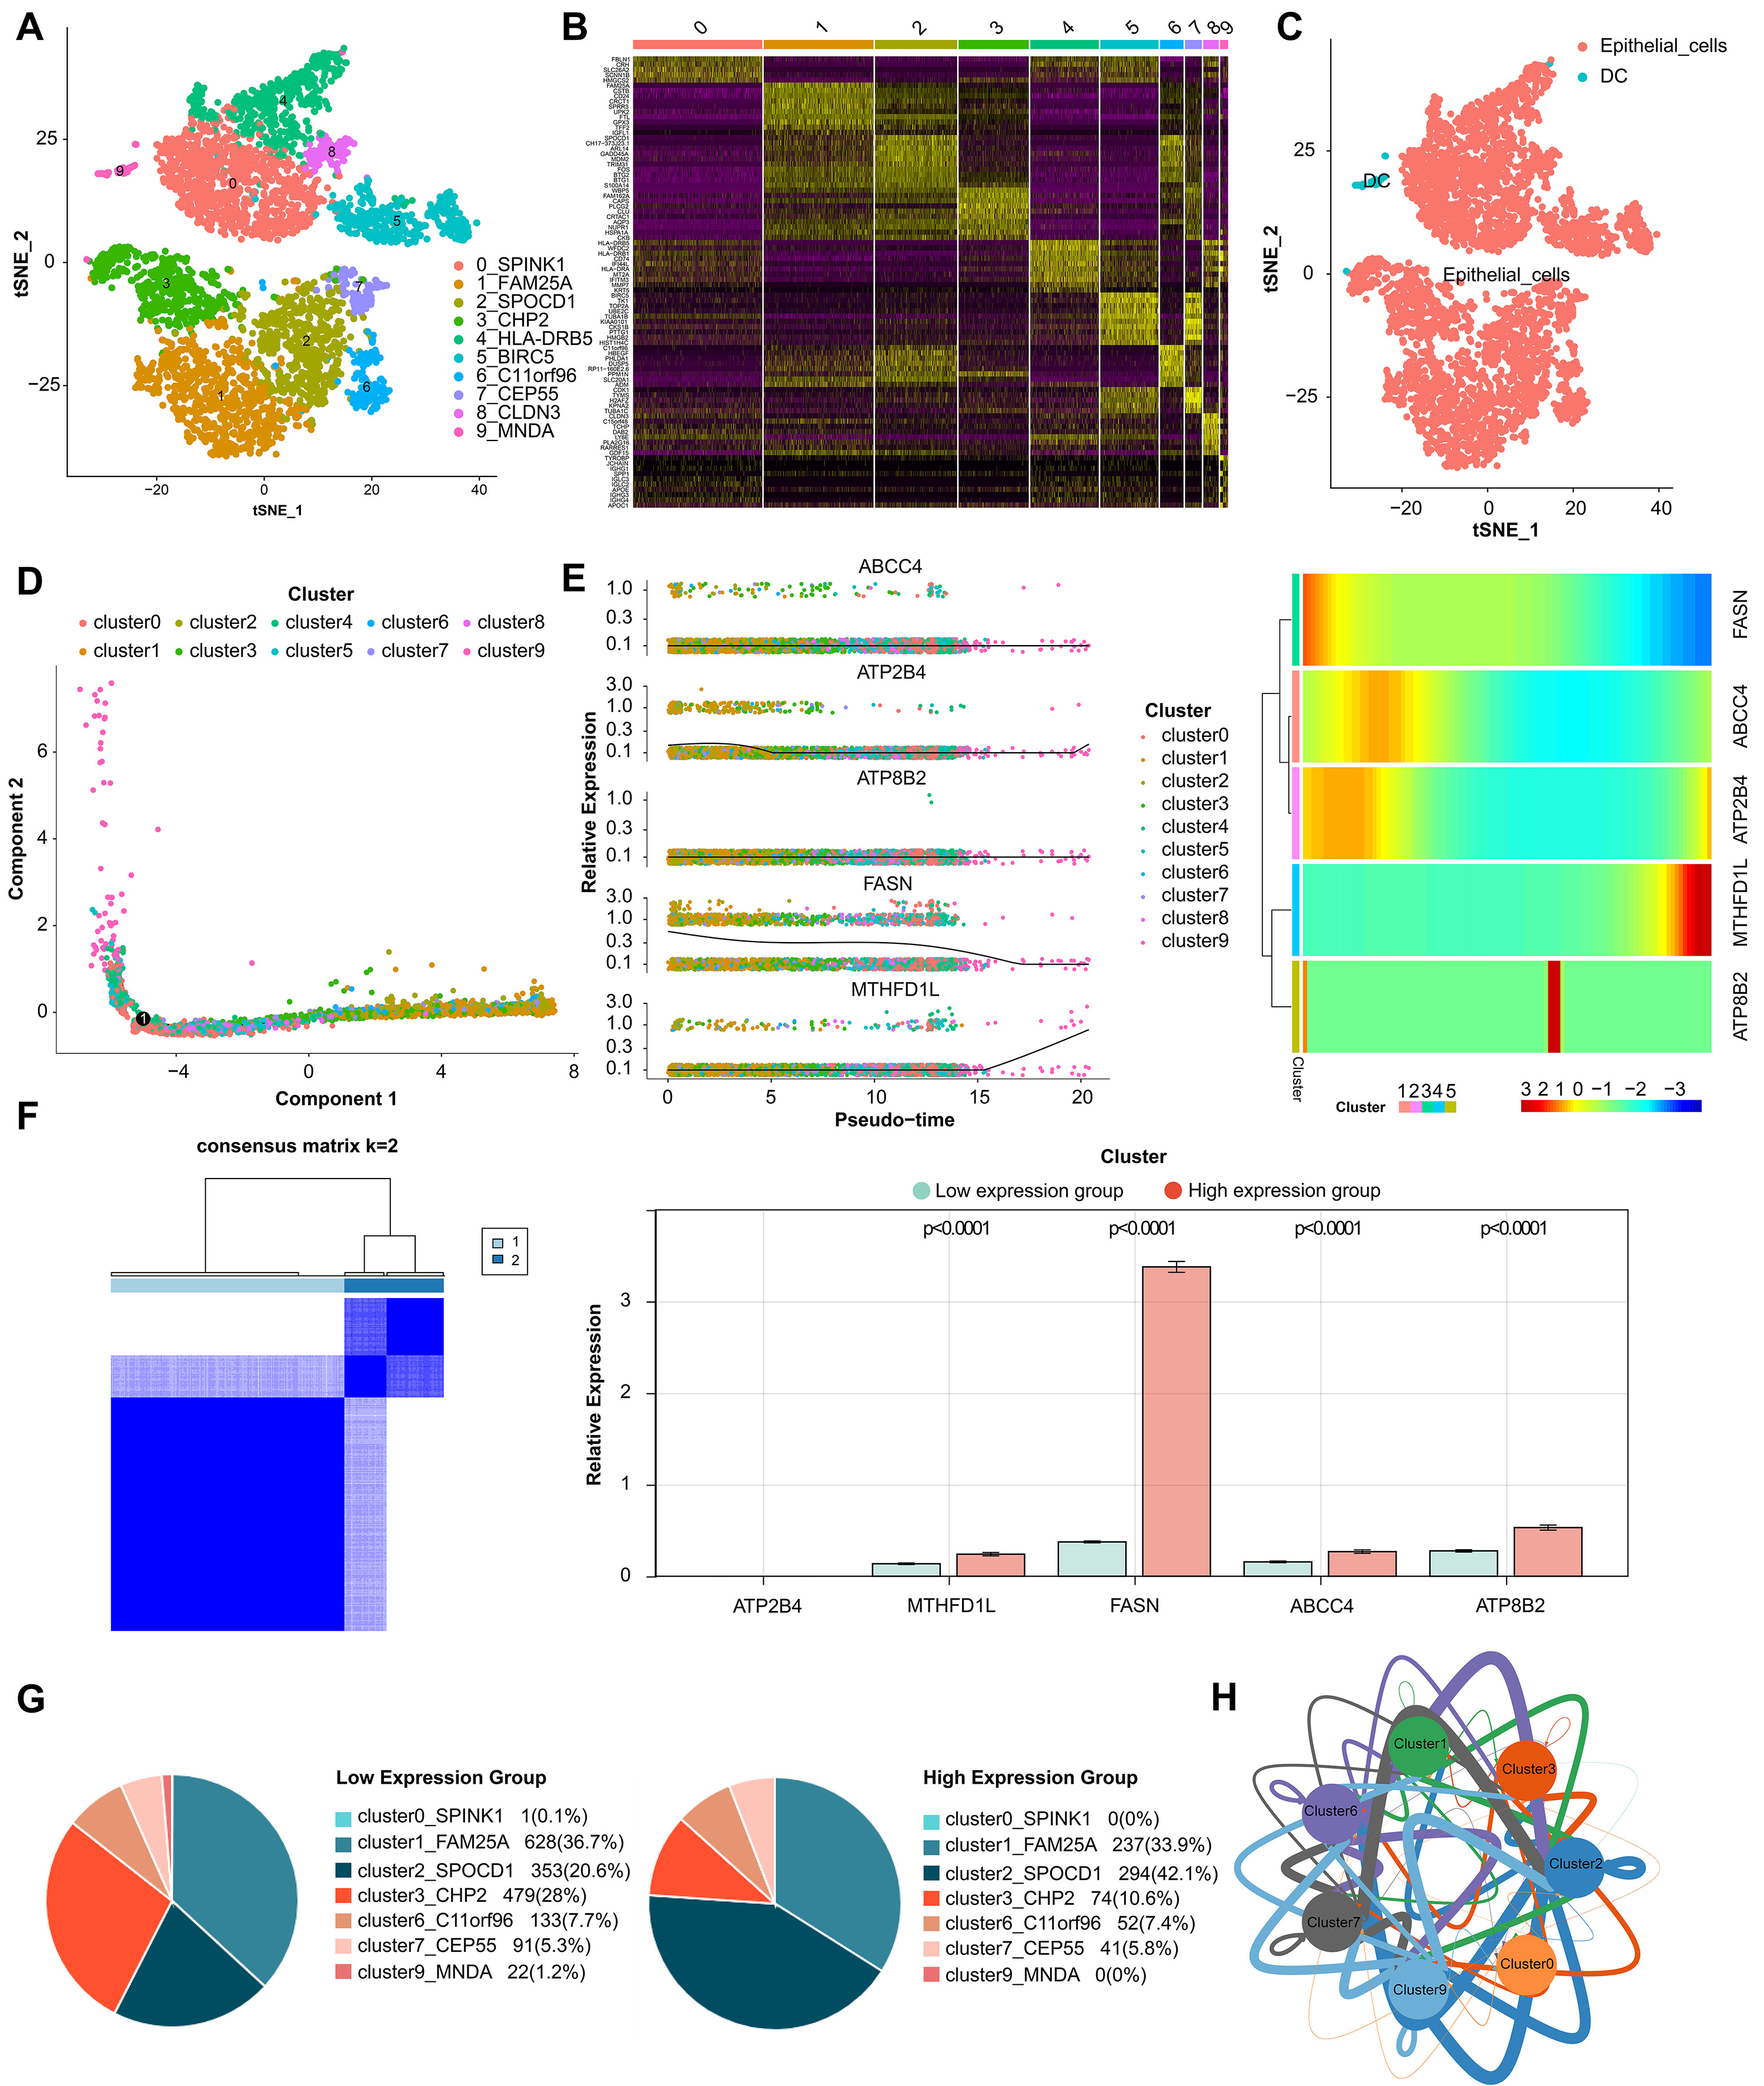 Fig. 6.
Analysis of single-cell RNA sequencing. (A) Cells were clustered into 10 types and visualized in two dimensions using tSNE dimensionality reduction algorithm, and each color represented the annotated phenotype of each cluster. (B) The heatmap showed the top 10 marker genes of each cell cluster. Purple color indicates low expression of marker genes in each cell cluster, while yellow color indicates high expression. (C) The clusters of cells were annotated using singleR and CellMarker based on the composition of the marker genes. (D) Cell trajectory analysis diagram showed the differentiation trajectories of the cells. The cell tracks are epithelial cells. (E) The expression changes of a single gene and the heatmap of the expression levels of all genes in different differentiation trajectories of the pseudotime analysis. (F) Classification of high- and low-expression groups in core cells. (G) Percentage of cluster cells. (H) Interaction of clusters of cells.
We used qRT-PCR to further verify the expression level of the biomarkers (ABCC4, FASN, ATP2B4, ATP8B2, MTHFD1L) in normal control and carcinoma tissue of 10 patients. The qRT-PCR analysis showed that the expression level of these genes exhibited significant difference. The mRNA levels of FASN and MTHFD1Lwere significantly higher in carcinoma tissue, while ABCC4, ATP2B4, and ATP8B2 were lower (Fig. 7).
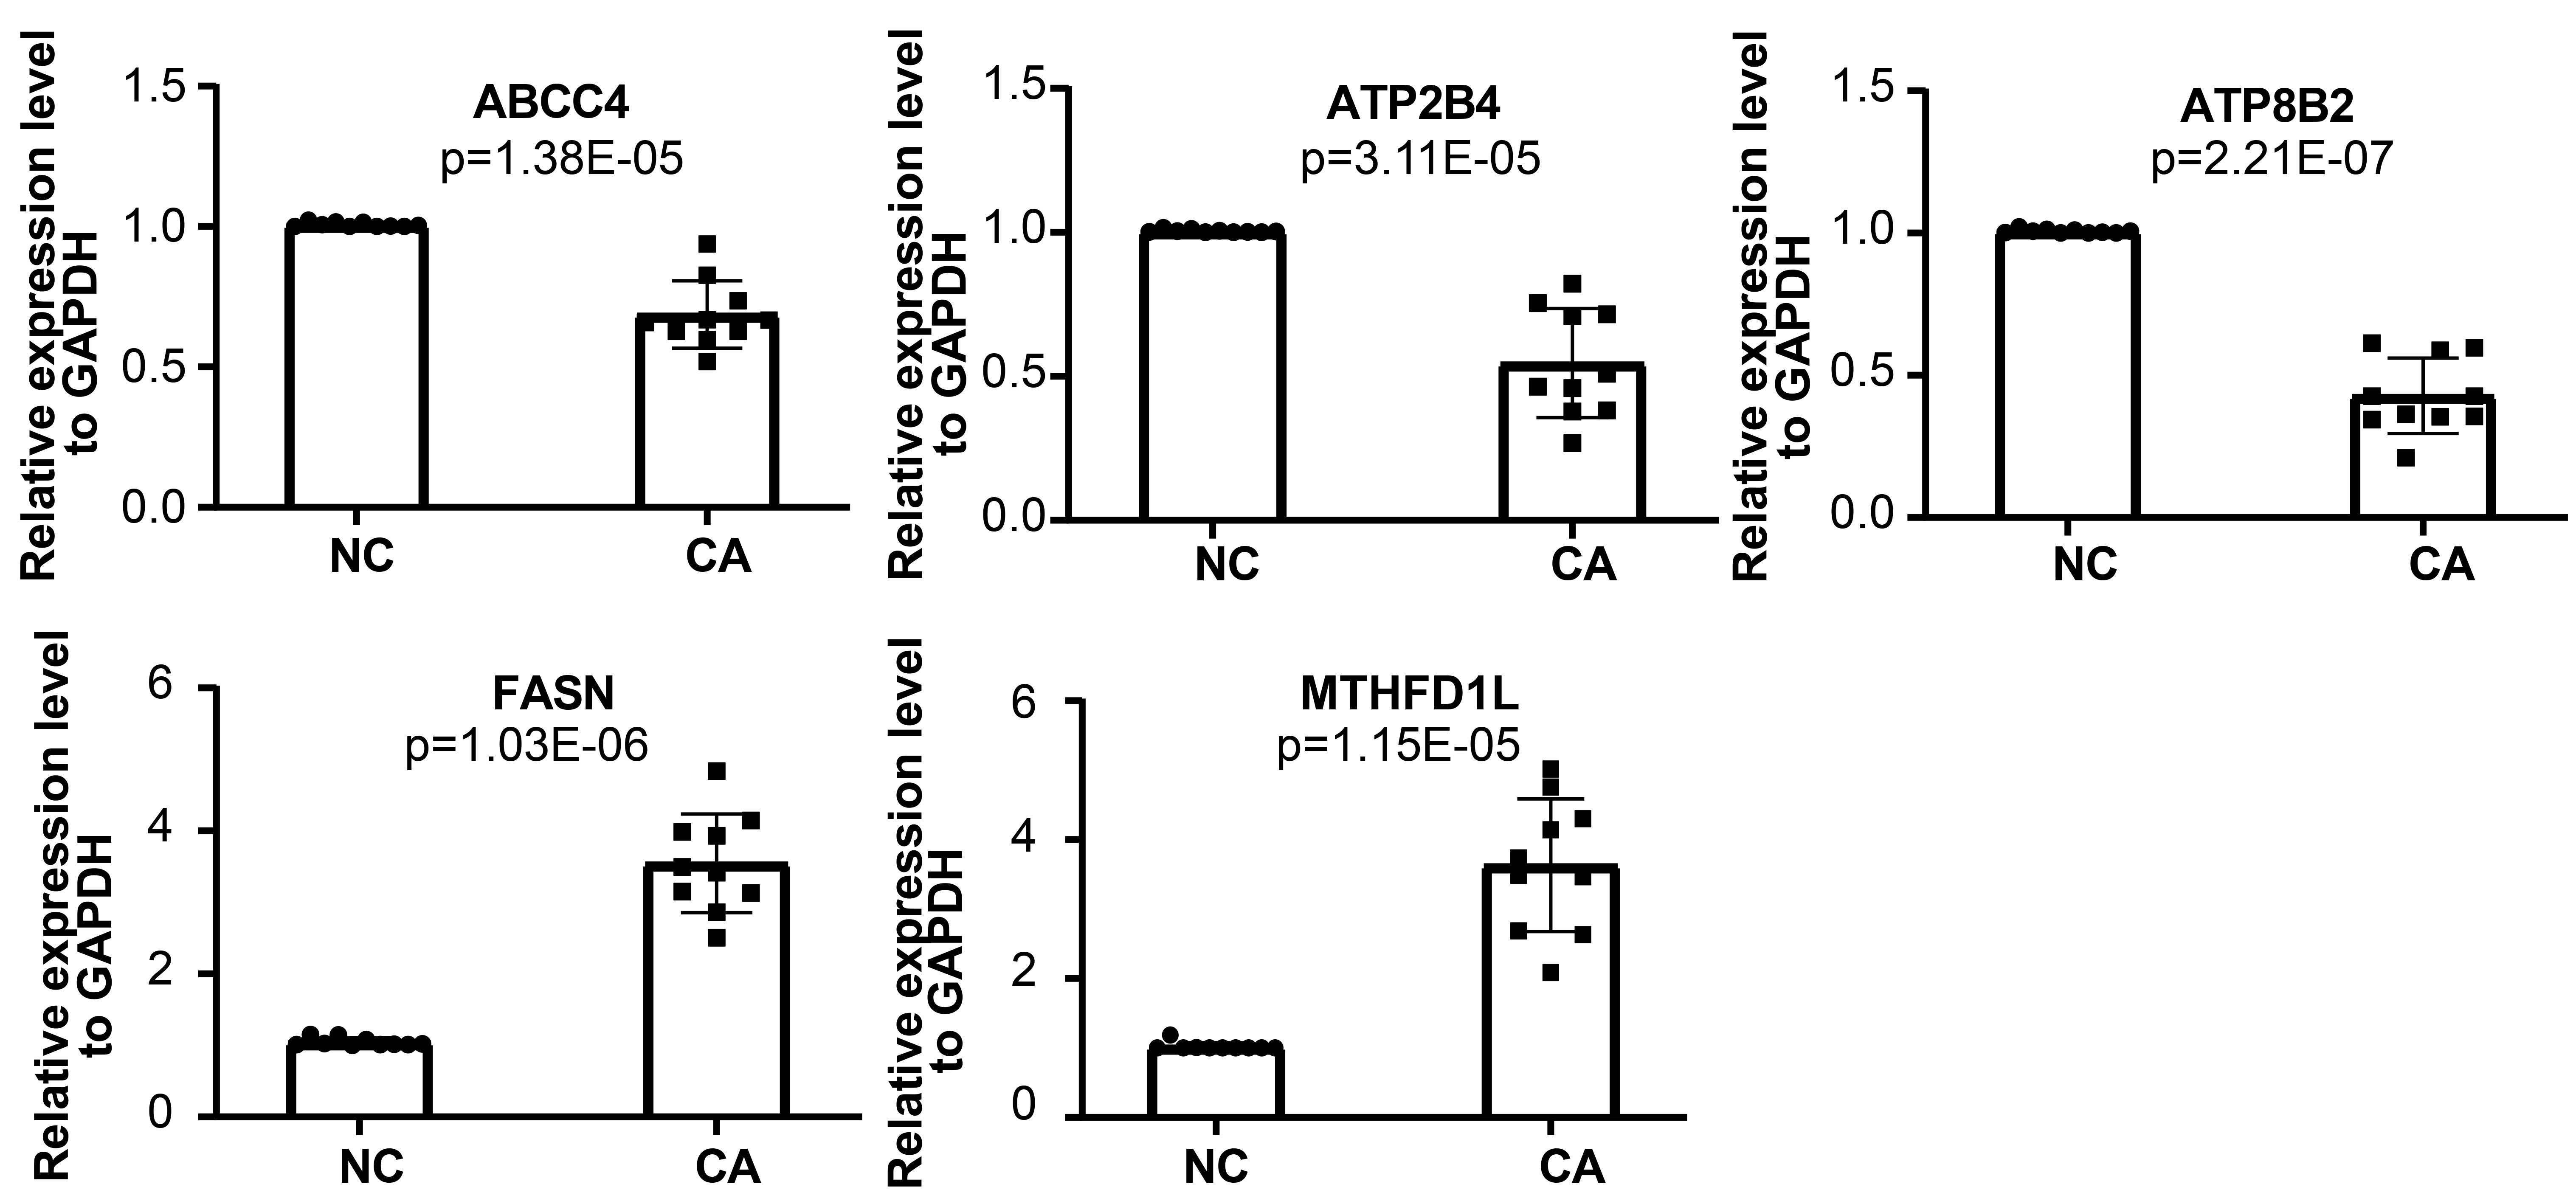 Fig. 7.
qRT-PCR analysis of mRNA levels of ABCC4, FASN, ATP2B4, ATP8B2, and MTHFD1L.
Over the years, the treatments of BLCA have made great progress, but the recurrence and progress of the disease after treatment still exists in a considerable number of patients, and once the disease progress will be a serious threat to the survival of patients. This may be closely related to the lack of good prognostic biomarkers to guide clinical decision-making. Studies have demonstrated that gene mutations and metabolic abnormalities are common and play an important role in various types of cancer, including lung cancer [29], prostate cancer [30], gastric cancer [31] and BLCA [32]. However, there are few studies on the relationship between gene mutation, metabolic abnormality and the prognosis of BLCA. We try to screen potential prognosis biomarkers and establish a reliable gene model by studying the MRGs of BLCA driven by somatic mutations, so as to provide basis for identifying new therapeutic targets and pathways of BLCA.
The functional enrichment results revealed that the differential MRGs of BLCA was mainly involved in the process of organic acid biosynthesis, small molecular catabolism, cell-modified amino acid metabolism, alcohol metabolism, signal transduction in multicellular organisms, organic anion transport, etc. We pay particular attention to the abnormal biosynthesis of organic acids has been implicated in the regulation of the growth and proliferation of cancer cells [33]. In cancer cells, the increased rate of glycolysis leads to the acculation of large amount of lactic acid, which can prevent the hydroxylation of N-myc downstream regulatory protein of NMyc (NDRG3) by proline hydroxylase 2 (PHD2). The accumulation of NDRG3 activates RAF/ERK signaling pathway, which promotes angiogenesis and proliferation of cancer cells, allowing them to survive and adapt to the hypoxic microenvironment [34]. In addition, the changes of fatty acid synthesis metabolism are related to the occurrence and development of BLCA. Silencing the expression of fatty acid synthase FASN can significantly inhibit the proliferation and invasion of BLCA cells through AKT/mTOR signal pathway [35]. Based on the TCGA-BLCA somatic mutation and Cox analyses, we identified five prognostic biomarkers (FASN, ABCC4, ATP2B4, ATP8B2, MTHFD1L) and developed a risk model for predicting the prognostic of BLCA with somatic mutation. The validation using independent test set, validation set and training set and found that these five genes were significantly associated with patient survival and were used to develop the prognostic risk model.
Immune system plays a critical roles in cancer development and progression, including BLCA. Studies have indicated that immune cell infiltration in BLCA is associatied with the occurrence and progression of BLCA. Accordingly, we carried out the correlation analysis of immune microenvironment, and discovered that the activation levels of memory B cells, Treg cells, and dendritic cells were significantly increased in the low-risk group, while the activation level of macrophages was enrich in the high-risk group. Among them, B cells activate T cells mainly through antigen presentation and cytokine secretion, thus playing an anti-tumor immune role [36, 37, 38]. Dendritic cells in the tumor environment usually exhibit inhibitory and dysfunctional phenotypes, which help cancer cells escape host immune surveillance [39]. Although most studies have confirmed that the degree of Treg infiltration is negatively correlated with the survival rate of BLCA patients, different studies have pointed out that Treg may reduce the invasiveness of tumor cells by inhibiting the expression of invasive factor MMP-2 in BLCA cells and TAMs, resulting in Treg playing a good prognostic role in BLCA [40]. It is well known that macrophages undergo phenotypic transformation in tumor microenvironment, thus inhibiting anti-tumor immune response. Studies have shown that the continuous infiltration of tumor-related inhibitory macrophages can significantly reduce the efficacy of BCG, and inhibitory macrophages expressing CD163 can be used as predictors of BCG unresponsive NMIBC [41, 42]. Nevertheless, the correlation between the prognosis of BLCA and immune cell infiltration is very complex and unclear, so we need to do a lot of in-depth research.
In recent years, immune checkpoint inhibitors have shown strong anti-tumor activity in patients with locally advanced and metastatic BLCA [43]. Our study discovered that, in contrast, the expression level of PDCD1 and TIGIT in the routine immune checkpoint was higher in the high-risk group, while the expression level of LGALS9 was higher in low-risk group, suggesting that the gene expression and immune environment of the immune checkpoint are different in different risk groups. Patients may benefit from different types of immunotherapy with specific target. Chemotherapy is indeed a crucial treatment for BLCA and is often used in combination with other treatment such as surgery and radiation therapy [44]. Our results revealed that the low-risk group might be more sensitive to commonly used chemotherapy drugs for BLCA such as cisplatin, gemcitabine, vinblastine and epirubicin. On the other hand, the high-risk group was found to be not sensitive to intracavitary chemotherapy and arteriovenous chemotherapy. It may be necessary to adjust the medication regimen and choose more sensitive chemotherapeutic drugs, such as 5-fluorouracil, docetaxel, hydroxycamptothecin and so on.
Tumor drug resistance and tumor metastasis are major challenges in the treatment of adcanced BLCA patients. By analyzing cell type-specific transcriptome variation by scRNA-seq, a personalized method for recurrent or refractory cancer has been developed, which is expected to overcome tumor drug resistance [45]. Tanaka et al. [46] found a new gene COX7B and its alternative marker CD63 related to platinum resistance by scRNA-seq. Low COX7B level was significantly correlated with poor chemotherapy response to BLCA [46]. Our study also attempts to use scRNA-seq data sets for further correlation analysis. We identified 10 BLCA epithelial cell subsets expressing different marker genes, and showed changes in the expression of five prognostic biomarkers (FASN, ABCC4, ATP2B4, ATP8B2, MTHFD1L) in different differentiation trajectories in pseudo-sequential analysis. Based on this, we found two cell clusters marked by SPOCD1 and CHP2, and their cell proportions changed significantly in the high and low expression groups of biomarkers. Moreover, it interacts with other cell clusters through cell communication and communication network, which not only further verifies the reliability of our survival risk stratification model, but also infers that these two cell clusters may affect the prognosis of BLCA and the key epithelial cell subsets that need our in-depth study.
In addition, combined with our research and previous reports, we have a better understanding of the above five potential prognostic biomarkers of BLCA. FASN is a vital biological enzyme that can catalyze the reduction of acetyl-CoA (CoA) and malonyl-CoA to long-chain fatty acids by NADP [47]. FASN is an enzyme that plays a crucial role in the biosynthesis of fattiy acids. Its up-regulation in many cancer types has been shown to be involved in the maintenance of cellular metabolism, division and proliferation [11]. Some studies have demonstrated that the increased FASN is markedly associated with the recurrence, progression, shorter RFS and poor PFS of BLCA [48, 49]. This is consistent with our results. Moreover, inhibition of FASN can restrain the migration of bladder transitional cell carcinoma by activating AKT pathway [35].
ABCC4 is widely expressed in various tissues [50, 51, 52], and can actively transport a series of organic anions to extracellular, so most of the functional studies on ABCC4 are focused on its effect on cancer chemotherapy [53]. Perivous studies have found that ABCC4 is related to drug resistance in various types of cancer, including breast cancer, colorectal cancer, prostate cancer, pancreatic cancer, and lung cancer [54, 55, 56]. Nonetheless, other studies have uncovered that low expression of ABCC4 can lead to the accumulation of cAMP in cells, which increases the invasiveness and migration of cancer cells [57]. Similarly, our results found that ABCC4 expression was significantly lower in the high-risk group, which had a higher risk of BLCA progression and metastasis. which needs to be confirmed by follow-up experimental study.
ATP2B4, the plasma membrane calcium ATP enzyme 4 (PMCA4), participates in the transport of divalent calcium ions out of the cell and maintains intracellular calcium homeostasis. It plays an important role in many diseases, including malaria, cardiomyopathy and cancer [58, 59, 60]. Previous study shows the evidence that changes in the expression levels of genes related to calcium pumps and calcium channels, including ATP2B4, may be a biomarker of cancer [61]. For example, the overexpression of ATP2B4 gene can promote the progression of colon cancer through intracellular calcium outflow [62]. Our results also show that the up-regulated expression of ATP2B4 may indicate a higher risk of disease progression in BLCA.
The ATP8B2 gene encodes an ATP-dependent phosphatidylcholine transferase that uses ATP as a source of energy to transport metals, ions and phospholipids across the cell membrane. At present, it has been discovered that ATP8B2 is related to various pathophysiological conditions in mouse models, but there are few reports on its relationship with human diseases. Through bioinformatics analysis, it has been found that ATP8B2, as a gene related to phenotypic transformation of macrophages, is related to the poor prognosis of pancreatic cancer [63]. Our results suggest that the expression level of ATP8B2 may serve as a prognostic biomarker for BLCA. Patient with higher expression of ATP8B2 and high risk of BLCA may have a poorer prognosis.
Methylenetetrahydrofolate dehydrogenase 1 (MTHFD1L) is an enzyme that is primarily located in the mitochondria, and it participates in carbon molecule, purine, thymidine and methionine metabolism [64]. MTHFD1L-related folate metabolism disorders and their products have been implicated in the occurrence and progression of various cancers [65, 66, 67, 68, 69]. Overexpression of MTHDF1L has been shown to be significantly related to poor prognosis in various types of cancer,including BLCA, head and neck cancer (HNSC), renal papillary cell carcinoma (KIRP), lung adenocarcinoma (LUAD) and endometrial carcinoma (UCEC) [70], which is consistent with our findings. However, some people have confirmed that MTHFD1L contributes to the regulation the growth and invasion of BLCA [71].
One limitation of this study is the lack of animal in vivo and cell line in vitro experiments to validate their role and specific mechanisms of marker genes in BLCA. Follow-up studies are needed to address this limitation and further investigate the potential of these markers as therapeutic targets or prognostic biomarkers. By conducting more comprehensive studies, we can better understand the complex mechanisms underlying cancer and develop more effective strategies for cancer prevention and treatment.
In this study, a new prognostic prediction model was established and verified by comprehensive bioinformatics analysis, which revealed the expression, prognostic value and function of MRGs driven by somatic mutation in BLCA. The potential markers of immunotherapy and chemotherapy were predicted in BLCA. In addition, through scRNA-seq data analysis, we explored the changes in the expression of biomarkers with the change of epithelial cell status, and identified two key epithelial cell subsets that affect the prognosis of BLCA, which need our in-depth study. The main advantage of this study is to use traditional RNA-seq data and scRNA-seq data to analyze and identify the biological significance of MRGs driven by somatic mutation in BLCA.
CGA-BLCA dataset was downloaded from the TCGA database (https://portal.gdc.cancer.gov/) as training sets, of which 19 control samples and 414 tumour cases. The GSE13507 and GSE135337 datasets were retrieved from the GEO database (https://www.ncbi.nlm.nih.gov/geo/).
LW and XY—conceptualization; LJ, SH, and LW—methodology and software; LW and MX—resources; LW—writing-original draft preparation; XY—writing-review and editing; LJ and MX—visualization; XY—supervision and project administration; LW—funding acquisition. All authors contributed to editorial changes in the manuscript. All authors read and approved the final manuscript. All authors have participated sufficiently in the work and agreed to be accountable for all aspects of the work.
The study was conducted in accordance with the Declaration of Helsinki, and approved by the Clinical Research Ethics Committees of the First Hospital of Shanxi Medical University ([2022](K056)). Informed consent was obtained from all subjects involved in the study.
We thank all the patients who provided the specimens for this study.
This research was funded by the Nature Science Foundation of Shanxi Province, grant number 202103021224412.
The authors declare no conflict of interest.
Publisher’s Note: IMR Press stays neutral with regard to jurisdictional claims in published maps and institutional affiliations.