IMR Press / FBL / Volume 28 / Issue 10 / DOI: 10.31083/j.fbl2810236
Open Access Original Research
Integrative Transcriptome and Metabolome Analysis to Reveal Red Leaf Coloration in Shiya Tea (Adinandra nitida)
Show Less
1 Key Laboratory of Tropical & Subtropical Flowers and Landscape Plants of Guangdong Higher Education Institutions/College of Horticulture and Landscape Architecture, ZhongKai University of Agriculture and Engineering, 510225 Guangzhou, Guangdong, China
2 Xinyi Academy of Forestry, 525357 Maoming, Guangdong, China
3 Forest Conservation Research Institute/Guangdong Academy of Forestry, 510520 Guangzhou, Guangdong, China
*Correspondence: zhaody@sinogaf.cn (Danyang Zhao); zhangbipei@zhku.edu.cn (Bipei Zhang)
These authors contributed equally.
Front. Biosci. (Landmark Ed) 2023, 28(10), 236; https://doi.org/10.31083/j.fbl2810236
Submitted: 12 February 2023 | Revised: 14 June 2023 | Accepted: 19 June 2023 | Published: 16 October 2023
Copyright: © 2023 The Author(s). Published by IMR Press.
This is an open access article under the CC BY 4.0 license.
Abstract

Background: Adinandra nitida, commonly known as Shiya tea, is a healthcare drink enriched in several phenolic acids and flavonoids, with a purple-red leaf variety possessing a unique flavor and a higher economic value. However, the mechanisms underlying leaf coloration and senescence discoloration remain unknown. Methods: Here, we compared both varieties of A. nitida (purple-red leaf, RL, and green leaf, GL) at two stages of development. To make sure the difference in leaf color in these four groups, several indexes, leaf colorimetric differences, H2O2 content in leaf cells, and antioxidant enzymes activities (superoxide dismutase (SOD), catalase (CAT)) were measured. With the integration of metabolome and transcriptome becoming a trend, metabolites in four groups were detected using an Ultra performance liquid chromatography-tandem mass spectrometer (UPLC-MS/MS) system, and the transcriptome was performed after the extraction of RNA in samples. Afterward, the activities of laccase (LAC) and peroxidase (POD) were measured for further analysis. Results: The deeper or discoloration of leaf color was not caused by the reactive oxygen species (ROS) stress because the H2O2 content was similar for each group. And the SOD and CAT activities improved significantly in young leaves, especially RL_young. Metabolome data showed a large shift in four groups. By focusing on the variation of flavonoids and 1079 metabolites detected in both varieties, along with the accumulation of flavonoids and tannins, proanthocyanins (PAs) were mostly accumulated in young RL. Differential analysis of expressed genes (DEGs) revealed six genes associated with leaf discoloration as hub factors, of which ANRs (ANR1 and ANR2) were positively correlated with the accumulation of PA in RL. Conclusions: Using integrate analysis of metabolome and transcriptome, our results revealed that six structural genes found in proanthocyanin biosynthesis, two reductases (ANR), two oxidative polymerases (POD64, LAC17) and two TFs (bHLH3 and MYB4) related to biosynthesis and polymerization of proanthocyanins were associated with not only the difference of GL and RL but also the faded coloration in two RL groups (RL_young and RL_old), which provided a foundation for further research on an understanding of the regulatory genes and the enzymes specific for proanthocyanidin biosynthesis, facilitating the genetic engineering of crops for beneficial metabolite accumulation.

Keywords
Shiya tea (Adinandra nitida)
oxidative polymerization
proanthocyanin
leaf discoloration
1. Introduction

Shiya tea (Adinandra nitida) was originally cultivated in southwest China. In the Guangxi Province, it is a widely consumed traditional tea, the cultivation of which has become increasingly common worldwide [1]. The tea is prepared from young leaves harvested from the top of the shoots, with an annual global harvest yield of nearly 5 million tons [2]. The demand for beneficial compounds in young leaves has been steadily increasing with the increasing popularity of tea drinks [3]. Ceylon tea from Sri Lanka, acclaimed as the best tea in the world, has its inherent unique characteristics and reputation for over a century [4]. Compared with Sri Lankan tea, which only contains 12–24% flavonoids by weight, Shiya tea contains more than 20% [5, 6]. Additionally, Shiya tea possesses a higher concentration (20.9%) of polyphenols than tea plants, which contain 18–36% polyphenols in young shoots [7]. Moreover, the caffeine content in Shiya tea is two to five times lower compared to that in the tea plant, making it an appropriate drink for people with caffeine sensitivity and caffeine-induced insomnia. Moreover, it is an economic crop as a class of drink that produces numerous secondary metabolites, such as flavonoids and alkaloids, that boost immunity [3].

Leaf color is a critical trait for plants with edible leaves with respect to their nutrition, taste, and physiological resistance. Tea obtained from tea plants with purple leaves, called “special tea”, receives increased global attention owing to the pleasant taste and rich anthocyanin content; it contains increased nutrient compounds, thus fetching premium prices to farmers [8]. The synthesis and accumulation of plant secondary metabolites such as carotenoids, flavonoids, and betalains contribute to the leaf and flower color. Anthocyanins, a type of flavonoid, are the best-characterized plant secondary metabolites in terms of coloration, biochemistry, and molecular biology and were found to be responsible for red, blue, and purple pigmentation in petals, leaves, seeds, and fruits [9]. They are bioactive compounds that scavenge free radicals and reactive oxygen species (ROS), provide endurance against high light intensity, cold temperatures, pest attack, and pathogen infection, and contribute to pollen and seed dispersal by attracting birds and bees [10]. There are six main anthocyanidins in vascular plants, including pelargonidin, peonidin, petunidin, cyanidin, malvidin, and delphinidin, with red, purple, and magenta colors. The up-growth in the omics field established more accurately the link among genomic, transcriptomic, proteomic, and metabolomics data throughout the last decade. Integrating metabolome and transcriptome analysis, structure genes (UGT78D2, MYB12) were clarified to facilitate anthocyanins accumulation in purple leaflets of Camellia tachangensis [11]. Similar research found ANS critically related to anthocyanin content while several MYB TFs positively correlated to this gene; these genes co-regulated anthocyanin accumulation in the sepal of Heptacodium miconioides [12]. Therefore, transcriptome and metabolome integrative researches are a reliable approach for metabolic network analysis [13, 14, 15].

However, the mechanisms underlying leaf coloration and senescence discoloration remain unknown. In this study, we aimed to identify the difference between the two kinds of leaf colors at the transcriptional and metabolite levels to elucidate the different regulatory modules involved in the anthocyanidin biosynthesis pathway in the two leaf colors at two different leaf ages. To this end, we performed an integrated metabolomic and transcriptomic analysis of the green and purple Shiya tea leaves, of two different ages, from young shoots. The results of our study provide new insights into leaf color changes in A. nitida, which can aid in tea flavor improvement during Shiya tea breeding.

2. Materials and Methods
2.1 Plant Materials and Sampling

The Shiya tea (Adinandra nitida) leaves of purple and green color were derived from Guangxi, Guangdong, Guizhou province from cliffs with short-day, high-humidity, and low-temperature conditions. The Shiya tea leaves in this study were harvested from Xinyi Forestry Research Institute, Guangdong province, China (N22°1947.518248′′, E110°5523.156544′′) in October 2021, and the two varieties under the same growth conditions, soil pH 5.0, terrain slope greater than 25°, non-flooded at altitude 500 m, 60–65% humidity with a temperature of 25 ℃/20 ℃ (light 10 h/dark 14 h), were separated into purple-red leaf (RL) and green leaf (GL). The criteria for classifying the growth of Shiya tea leaves are: old leaves are biennial, growing for 45 days; the growth time was recovered from the emergence of buds; young leaves are annual, growing for 15 days or more. Fresh leaves were collected from four groups in 2021 (Fig. 1a). In the present study, the leaf samples of two stages of development of two varieties were abbreviated as GL_young, GL_old, RL_young, and RL_old. All samples were fixed in liquid nitrogen immediately and stored at –80 ℃ for further physiological, metabolomic, and transcriptomic analyses. Three biological replicates were assayed for each group.

Fig. 1.

Characteristics of phenotype and physiological traits at different growth stages of red and green colored Adinandra nitida leaves. (a) Shiya tea leaves at two different developmental stages in different colors (RL, red leaves; GL, green leaves; young, young stage, 15 d; old, old stage, 45 d). Scale bar = 1 cm. (b) Changes in the physiological traits of Shiya tea leaves in the four groups. Different lower-case letters indicate a significant difference (p < 0.05), and the same letter on columns indicates no significant difference according to Duncan’s test. Data represent the mean ± SD (n = 3). a, b, c, and ab have achieved statistical significance at the 0.05 level, with p-values below 0.05.

2.2 Estimation of Physiological Traits

Approximately 0.2 g fresh leaf segments collected from each sample were used for the determination of several physiological indices, including colorimetric difference, superoxide dismutase (SOD), catalase (CAT), hydrogen peroxide (H2O2), and soluble sugar content. The colorimetric differences of Adinandra leaves were measured using a CR-400 (Konica Minolta Sensing Americas Inc, Ramsey, NJ, USA) color difference meter. SOD enzyme activity was determined using the NBT photoreduction method, as previously reported [16]. CAT activity was determined using the UV absorption method. The soluble sugar content, an index related to tissue structure, inheritance, energy, and stress resistance, was determined using the method described by Wang et al. [17]. Three biological replicates in each sample were performed for these determinations.

H2O2 was extracted and estimated following the method of Sen et al. [18]. After grounding 5 g of leaf tissue into powder, the leaf powder was added to ice-cold acetone for isolation. By the addition of 5% (w/v) titanyl sulfate and concentrate NH4OH solution, the peroxide-titanium complex was precipitated. This would be dissolved in 15 mL of 2 M H2SO2, setting the final volume to 20 mL with cold double distilled water. The absorbance was read at 415 nm against a water blank. The H2O2 content in vivo was calculated from a standard curve prepared in a similar way.

Total flavonoid content was determined using Aluminum Chloride (AlCl3) calorimetric method as reported by Shao et al. [19] with slight modification. Shiya tea leaf powder (4 g) was extracted with 80 mL methanol. The mixture was heated up in a water bath at 80 ℃ for 2 h. The supernatant was filtered with Whatman No.1 filter paper and dried with a rotary evaporator to obtain the dried extract powder, which was stored at 4 ℃ in the dark. And then, 0.3 mL extracts (10 mg/mL) were diluted with 4 mL distilled water, followed by the addition of 0.3 mL 5% NaNO2, and kept for 5 min at room temperature. Then, 0.3 mL 10% AlCl3 was mixed in the solution, and the mixture was kept for another 5 min. Later, 2 mL 4% sodium hydroxide was added, and the final volume was filled up to 10 mL. Absorbance was measured at 510 nm using a spectrophotometer (UV-1600, Shimadzu, Kyoto, Japan). The quercetin standard curve (0.025–0.25 mg/mL, R2 = 0.99) was used to express the total flavonoids as microgram quercetin equivalent per gram sample dry weight (µg QE/g dw).

Anthocyanins were extracted according to the method of Zhang et al. [20]. About 2.0 g of sample was immersed in 5 mL of 1% (v/v) methanol-HCl overnight in the dark at 24 ℃, then the absorbance of each sample was measured at 530, 620, and 650 nm by a spectrophotometer (UV-1600, Shimadzu, Kyoto, Japan). The anthocyanin content was quantified using the following formula: OD = (A530 – A620) – 0.1× (A650 – A620). The results were shown as average value ± SD of three independent experiments.

Proanthocyanin content determination was imitated by the method from Hrnčič et al. [21]. About 2.0 g of the sample was grounded to powder using liquid nitrogen. Then the powder was transferred into the reagent prepared by 77 mg of Fe(SO4)7H2O and 500 mL of HCl:butanol solution (200 mL HCl AND 300 mL of butanol). Next, 50 mg extract was dissolved into 10 mL MeOH. And then, 1 mL extraction solution was taken out and mixed with 10 mL of FeSO4 solution. The control was set by mixing 1 mL MeOH and 10 mL FeSO4 solution. The sample solution and control solution were incubated in a water bath at 95 ℃ for 15 min. The solutions were cooled, and we measured their absorbance at 540 nm. The results were shown as average value ± SD of three independent experiments.

2.3 Estimation of Laccase and Peroxidase Activities

The activity of laccase (LAC) was estimated to imitate Fioretto et al. [22]. First, 0.5 g leaf sample was crushed to a fine powder using the liquid nitrogen grinding method and transferred into a centrifuge tube, suspended in 10 mL of buffer (50 mM acetate pH 5.0) and kept at 4 ℃. After incubation, the mixture was homogenized for 1 min, centrifuged at 10,000 ×g at 4 ℃ for 20 min and the supernatant was filtered through a Whatman No 1 filter paper. This filtrate was used as the enzyme extract to prepare the following determination. The laccase activity was measured by recording the increase of absorbance at 600 nm for 1 min at 30 ℃ in a mixture containing: 1 mL enzyme extract, 1 mL 50 mM pH 5.0 acetate buffer, and 0.2 mL 25 mM o-tolidine (3-3 dimethyl 4-4 diamino biphenyl).

Peroxidase (POD) activity was determined using 4-methylcatechol as substrate. The increase in the absorption caused by the oxidation of 4-methylcatechol by H2O2 was measured at 420 nm spectrophotometrically. The reaction mixture contained 100 mM sodium phosphate buffer (pH 7.0), 5 mM 4-methylcatechol, 5 mM H2O2, and 500 µL of crude extract in a total volume of 3.0 mL at room temperature. One unit of enzyme activity was defined as a 0.001 change in absorbance per min under assay conditions [23]. The information about the reagents used in this study is provided in Supplementary Table 1.

2.4 Metabolome Analysis

Twelve leaf samples from four groups with three independent biological replicates were used for metabolome analysis. The freeze-dried samples were crushed into powder using a mixer mill (MM 400, Retsch, Haan, Germany) with a zirconia bead for 1.5 min at 30 Hz. Each 100 mg powder was dissolved in 1.2 mL 70 % methanol solution, vortexed 30 s every 30 min, repeating for a total of six times, and finally placed in a refrigerator at 4 ℃ overnight. Following centrifugation at 15,984 ×g for 10 min, the extracts were filtrated through an SCAA-104 membrane (0.22 µm pore size; ANPEL, Shanghai, China). An ultra-performance liquid chromatography-tandem mass spectrometer system was used for the relative quantification of widely targeted metabolites in Shiya tea leaf samples. The sample extracts were analyzed using aUPLC-MS/MS system (Ultra performance liquid chromatography-tandem mass spectrometer. UPLC, Nexera X2, Shimadazu, Kyoto, Japan; MS, 4500 QTRAP, Applied Biosystems, Norwalk, CT, USA) at Wuhan METAWARE Biotechnology Co., Ltd. (Wuhan, China) following their standard analytical procedures as described previously [24, 25]. A local metabolomic database was generated via an appropriate combination of authentic standards, and manual identification was applied as one of the references.

The analytical conditions were as follows, UPLC: column, Agilent SB-C18 (1.8 µm, 2.1 mm × 100 mm); the mobile phase consisted of solvent A, pure water (0.1% formic acid), and solvent B, acetonitrile (0.1% formic acid). Gradient program, 95:5 V/V (A:B) at 0 min, 5:95 V/V at 9 min, 5:95 V/V at 10 min, 95:5 V/V at 11.1 min, 95:5 V/V at 14 min. Flow velocity, 0.35 mL/min; Column oven, 40 ℃; Injection volume, 4 µL. The effluent was alternatively connected to an ESI-triple quadrupole-linear ion trap (QTRAP)-MS. LIT and triple quadrupole (QQQ) scans were acquired on a triple quadrupole-linear ion trap mass spectrometer (AB4500 Q TRAP UPLC/MS/MS System), equipped with an ESI Turbo Ion-Spray interface, operating in positive and negative ion mode and controlled by Analyst 1.6.3 software (AB Sciex, Framingham, MA, USA). The ESI source operation parameters were as follows: ion source, turbo spray; source temperature 550 ℃; ion spray voltage (IS) 5500 V (positive ion mode)/-4500 V (negative ion mode); ion source gas I (GSI), gas II (GSII), curtain gas (CUR) were set at 50, 60, and 25.0 psi, respectively; the collision gas (CAD) was high. Instrument tuning and mass calibration were performed with 10 and 100 µmol/L polypropylene glycol solutions in QQQ and LIT modes, respectively. QQQ scans were acquired as multiple reaction monitoring method (MRM) experiments with collision gas (nitrogen) set to medium. Declustering potential (DP) and Collision energy (CE) for individual MRM transitions were done with further DP and CE optimization. A specific set of MRM transitions were monitored for each sample according to the metabolites eluted within this period. Based on the METAWARE database v4.0 and metabolite information public database, the metabolites were annotated only if five indices (Q1, Q3, CE, DP, and Retention Time) were fully identical to both databases. The significant differentially accumulated metabolites (DAMs) were analyzed by the combination of the VIP value in the OPLS-DA model and fold change between the two samples. The screening criteria were as follow: (1) fold change 2 or fold change 0.5 and (2) VIP values of metabolites 1 [26].

2.5 Transcriptome Analysis

Total RNA was extracted from the frozen leaf samples using TRIzol reagent (Invitrogen, Carlsbad, CA, United States) following the manufacturer’s instructions and then subjected to quantification and qualification by agarose gel electrophoresis, an Agilent 2100 Bioanalyzer (Agilent Technologies, Palo Alto, CA, United States) and an RNA Nano 6000 Assay Kit of the Bioanalyzer 2100 system (Agilent Technologies, Palo Alto, CA, United States). Briefly, mRNA was purified from total RNA using oligo dT attached magnetic beads, and then first-strand cDNA was synthesized using hexamer and M-MuLV Reverse Transcriptase (RNase H-), and the second-strand cDNA was synthesized using DNA Polymerase I and RNase H. Finally, the amplified size-selected cDNA was purified (AMPure XP system) and the cDNA libraries were sequenced using the Illumina sequencing platform by Metware Biotechnology Co., Ltd. (Wuhan, China). Clean reads were filtered, mainly to remove row reads and low-quality (Q 20) reads with adapters using Fastp v0.19.3 (https://github.com/OpenGene/fastp), and the clean reads were then mapped to the reference genome downloaded using HISAT v2.1.0 software (Kim, D., Baltimore, MD, USA). Fragments per kilobase of transcript per million mapped reads (FPKM) were used as an index to estimate gene or transcript expression levels. The criteria for screening differentially expressed genes (DEGs) screening between each sample were absolute log2FoldChange 1 and corrected p-value < 0.05 [27]. Three replicates were performed for each sample. We then used the Swiss-Prot (http://www.geneontology.org/) and BLAST (http://www.genome.jp/kegg/), free online platforms for data analysis, for the GO enrichment and Kyoto Encyclopedia of Genes and Genomes (KEGG) pathway enrichment analysis of DEGs.

2.6 Transcriptome and Metabolism Conjoint Analysis

The DEGs and DAMs in the same group were mapped together to the KEGG pathway map and screened using a p < 0.05 to identify significant relationships. Correlation analysis was performed for the differentially detected and comparatively correlated transcription factors, enzymes, and metabolites in each sample with the criteria of p < 0.05 and Pearson’s r >0.7. The key modules related to the PA content in leaves were used for subsequent analysis.

2.7 Quantitative Real-Time Polymerase Chain Reaction Expression Analysis

Single-stranded cDNAs were synthesized from the RNAs using the PrimeScriptTM RT reagent Kit, and quantitative real-time PCR was performed using ViiA7 (Thermo Fisher Scientific, USA) and HieffTM qPCR SYBR Green Master Mix (Yisheng Biotechnology, Shanghai, China). Primers were designed by Bioruqi (Guangzhou, China) and synthesized by GENEWIZ (Suzhou, China). The AnActin gene (LOC114296039) was used as an internal reference, and the relative expression was calculated using the 2ΔCt method. The standard errors of the means among the replicates were calculated. All quantitative real-time polymerase chain reaction (qRT-PCR) analyses were performed in three biological replications, respectively. All primers used in this study are listed in Supplementary Table 2.

2.8 Statistical Analysis

The statistical significance of the difference between RL and GL in the physiological indices was tested by Duncan’s test using SPSS software (v17.0, IBM Corp., Chicago, IL, USA). The metabolite data and transcript expression were standardized to the Z score using TBtools software. We analyzed and compared the differences among the four sample groups (RL_young_vs._RL_old, GL_young_vs._GL_old, RL_young_vs._GL_young, RL_old_vs._GL_old). The correlation matrix using Pearson’s correlation with significance level was calculated and produced using the LinkET package (v0.0.5) in R Studio (v2022.07.1+554, RStudio, Inc., Boston, MA, USA).

3. Results and Discussion

The high-altitude growth region for A. nitida promotes the synthesis and accumulation of nitrogen-containing compounds and aromatic substances, with high protein and amino acid content in plants, rendering A. nitida favorable in taste. A purple-red A. nitida cultivar is popular among its peers for its unique red leaves and multi-stress tolerances. We investigated whether stress tolerance was associated with the red-leaf trait by analyzing a purple-red A. nitida cultivar ‘RL’ at two stages of development (young leaflets and mature leaves) and its green counterpart-‘GL’ as a control.

3.1 Colorimetric and Spectral Characteristics of Two A. nitida Varieties

First, we plotted the absolute color coordinates and differences between the two varieties by applying CIE Lab color space consisting of three metrics, L*: lightness (+brighter, –darker), a*: redness–greenness (+redder, –greener), and b*: yellowness–blueness (+yellower, –bluer). As shown in Supplementary Table 3, we observed distinct a* values between the two varieties, while neither L* nor b* values presented significant differences, reflecting the “redder” hue in RL.

3.2 Physiological Traits of Two A. nitida Varieties

We further evaluated the intensity of red-causing components by extracting total flavonoids from plant leaves, followed by spectrophotometric determination. As expected, the TFC of RL_young was significantly higher than that of GL and RL_old (Fig. 1b). Moreover, the TFC of the “old” leaf was reduced compared with that of the younger leaf, indicating a mild fading trend with leaf development. This result indicated that a higher content of flavonoids was predominantly related to the red hue in RL.

Enhanced soluble sugar content and ROS scavenger occurred commonly at the leaf behaving deeper color [28]. Moreover, we determined several physio-chemical indices of stress resistance, including SOD, CAT, and soluble sugar content (Fig. 1b). The samples similarly suffered the oxygen partial pressure in these four groups by quantifying the H2O2 concentration. Soluble sugar content slightly decreased in the old stage compared to that in the young stage, and the content in RL was comparatively and totally higher than that in GL. Secondly, the enzyme activities of SOD and CAT were significantly increased in RL, especially in the young stage.

As a result, the soluble sugar content and ROS scavenger levels, including SOD and CAT, increased in RL and were positively correlated with flavonoid content. Visual observation and colorimetric determination suggested that anthocyanin (ACN) belonging to flavonoids may act crucially at the leaf pigmentation, and the ACN content may contribute to abiotic damage resistance, consistent with previous studies that reported on low temperature, drought, salinity, and heavy-metal stresses [29]. However, the ACN contents in these four groups were similar but not significantly different. Whether ACN content contributes to the Adinandra nitida leaf color needs to be further confirmed. Next step, we would notarize that using metabolomic data analysis.

3.3 Identification of ‘Red’-Causing Metabolites in RL Using UPLC-MS/MS-Based Metabolome Profiling

The colorimetric and physio-chemical differences between RL and GL prompted us to investigate further the detailed metabolic data related to these traits. Thus, we performed Ultra performance liquid chromatography–tandem mass spectrometer (UPLC-MS/MS) based metabolome profile of RL and GL, focusing on differential pigments (see Materials and Methods).

First, principal component analysis (PCA) of the metabolite data (the normalized responses were used, accounting for 53.83% of the variation with a significance of 0.01) separated the two varieties in metabolite composition and content (Fig. 2a), indicating that leaf color differences existed within the RL and GL at the metabolite level.

Fig. 2.

Multivariate statistical analyses of the differences of metabolites in Adinandra nitida leaves. (a) Principal component analysis (PCA) of metabolite profiles. The x-axis represents the first principal component, and the y-axis represents the second principal component. (b) Venn diagrams of significantly upregulated and downregulated metabolites in four groups of Shiya tea leaves between different leaf colors (redness and greenness) and different developmental stages (young leaf and old leaf).

A total of 1079 distinct annotated metabolites were detected and classified into 11 main groups, including such detected anthocyanins and proanthocyanins (PAs) detected (cyanidin-3-O-glucoside, peonidin-3-O-glucoside, theaflavin, procyanidin A1, procyanidin A2, procyanidin A6, procyanidin B1, procyanidin B2, procyanidin B3, procyanidin B4, aesculitannin A, procyanidin C1, and procyanidin C2). However, the anthocyanins detected in this study (peonidin-3-O-glucoside and cyanidin-3-O-glucoside) expressed little difference. It is worth noting that the proanthocyanins found were all significantly different between RL and GL, likely contributing to ‘red’-hue due to their high enrichment in RL (Fig. 3 and Supplementary Tables 4,5). Phenolic acids and flavonoids were the two subclasses with the maximum number of relative upregulated metabolites in RL. Moreover, the upregulated organic acids were increased in old-stage RL since these compounds are one of the primary compositions in tissue formation [30].

Fig. 3.

Heatmap of metabolite expression profiles at different growth stages of red and green-colored Adinandra nitida leaves and the circle graph of percentage composition of the flavonoids category. The primary class, metabolite number, and percentage contained in the outer round correspond to the split sectors in the circular heatmap. The dendrograms in the third round denote the overall similarity of metabolite expression profiles by primary classes and the four groups. The proanthocyanins identified are shown in the bottom heatmap connected to the sectors by full lines. a, b, c, and d have achieved statistical significance at the 0.05 level, with p-values below 0.05.

We performed statistical tests to confirm key trait-related metabolites and screened metabolites with a VIP >1 and fold change 2 (up) or 0.5 (down) in RL compared to those in GL. Based on the screening threshold, secondary metabolites comprised 27.9% of the differential metabolites in the comparison group (RL_old_vs._GL_old) and 24.4% in the comparison group (RL_young_vs._GL_young) (Fig. 2b). Compared with these two comparisons, the flavonoids metabolites profiles significantly differed, such as flavonoid, dihydroflavone, dihydroflavonol, flavonols, flavanols, flavonoid carbonoside, and chalcones. Additionally, we also discovered some differential metabolites between these two comparisons (RL_young_vs._GL_young and RL_old_vs._GL_old) that could be categorized into tannins. The tannins differentially accumulated in RL were almost occupied by proanthocyanin (theaflavin, procyanidin A1, procyanidin A2, procyanidin A6, procyanidin B1, procyanidin B2, procyanidin B3, procyanidin B4, aesculitannin A, procyanidin C1 and procyanidin C2). To verify the PA abundance detected by UPLC-MS/MS, we also measured the PA content in these four groups. A significant enhancement existed in RL_young among these four groups (Fig. 3). Compared with RL_old, there were procyanidin C1 and procyanidin C2 differently accumulated in young leaflets of RL. These eleven proanthocyanins of metabolite profiles could be representative of the differential pigmentation between RL_young, RL_old, and GLs. As the materials could be condensed to proanthocyanins, catechin (CC) and epicatechin (ECC) also showed a great difference between different leaf colors (red and green). However, the contents of these two metabolites in RL_young and RL_old showed little difference from each other.

Taken together, the ‘red’ color of RL leaves potentially results from the oxidation of 11 PAs, amongst which procyanidin C1 and procyanidin C2 were specifically accumulated in young leaves resulting in their redder coloration. This result may be caused by the different capacities of polymerization of polymerase or oxidase since the proanthocyanins were condensed by CC and ECC. The same results were discovered in red rice (Oryza sativa), which deepened redness in rice caused by the polymeric structures that range from 2-mers to 14-mers [31]. As a natural ROS scavenger, PAs represent a group of condensed tannins [32] and not only render RL highly tolerant against oxidation-induced stresses, which is consistent with variations in the physio-chemical indices of the two varieties (Fig. 1b) but played an extensive health-promoting effect in our body.

3.4 Transcriptome Profiles of RL and GL and Their Functional Relations

The quality of the total RNA extracted is shown in Supplementary Table 6. The transcriptome profiles of RL and GL were acquired using Illumina NovaSeq 6000 to decipher the transcriptional regulation of DAMs between the two varieties relating to the ‘red’ trait. Three independent biological replicates per group were analyzed (12 samples), outputting more than 5.93 × 10⁸ clean reads, with over 70% mapped to the Camellia reference genome. In general, 8195 genes, including 7700 known genes and 495 novel genes, were generated from the RNA-Seq data in this study (Supplementary Table 7). We normalized the mapped reads number and the lengths of transcripts using the index of fragments per kilobase of transcript per million fragments mapped (FPKM) as the expression levels of each transcript for representing the expression levels of transcripts with the criteria of an adjusted p-value < 0.05 and a |log2FC| >1 for screening the DEGs (Fig. 4a and Supplementary Table 8).

Fig. 4.

Transcriptome data analysis in four groups of Adinandra nitida leaves and quantitative real-time polymerase chain reaction (qRT-PCR) verifying proanthocyanin biosynthesis-related genes. (a) Volcano plots of transcripts between different leaf colors at the same developmental stage. Transcripts with adjusted p-value < 0.05 were highlighted in red for upregulation (fold change >2) and in green for downregulation (fold change <–2). (b) Gene ontology (GO) classification of differentially expressed genes (DEGs) identified between different leaf colors at the same developmental stage. (c) Laccase (LAC) and peroxidase (POD) assays. Different lower-case letters indicate a significant difference (p < 0.05), and the same letter on columns indicates no significant difference according to Duncan’s test. Data represent the mean ± SD (n = 3). a, b, c, and d have achieved statistical significance at the 0.05 level, with p-values below 0.05. (d) Five genes annotated to the enzymes were selected randomly for qRT-PCR verification. Pearson’s analysis showed a good correlation between the RNA-seq and qRT-PCR data.

Gene Ontology (GO) functional enrichment analyses allotted 192 (in RL_young_vs._GL_young) and 258 (in RL_old_vs._GL_old) DEGs into biological processes (78.6% and 76.1%), molecular functions (86.7% and 84.0%), and cellular components (77.5% and 87.7%). In the biological processes term, genes associated with cellular processes were highly enriched. Additionally, most of the DEGs in molecular function terms of binding and catalytic activity were particularly highlighted, and the most abundant GO terms in the cellular component category were concentrated in the cellular anatomical entity (Fig. 4b and Supplementary Table 8).

Finally, the RNA-seq results were validated using qRT-PCR of five randomly chosen DEGs. The expression patterns of these genes obtained using qRT-PCR were consistent with those determined by RNA-seq (Fig. 4d).

3.5 Exploration of Red Coloration Associated Genes by Combined Analyses

We mapped the metabolic compounds and catalytic enzymes onto the pathway based on the Kyoto Encyclopedia of Genes and Genomes (KEGG) database, focusing on the flavonoid biosynthetic pathway, to perform an in-depth analysis of the DAMs and DEGs involved in the red discoloration mechanism. According to the KEGG-enrichment analysis, 94 (in RL_young_vs._GL_young) and 122 (in RL_old_vs._GL_old) unigenes were clustered into 101 and 111 KEGG pathways. Among these pathways, phenylalanine, tyrosine, and tryptophan biosynthesis pathways were significantly enriched, indicating that 3-dehydroshikimate was activated prior to flavonoid biosynthesis to provide vital precursors [33].

Structural genes involved in the flavonoid biosynthetic pathway aiming at proanthocyanin biosynthesis were identified. The predicted proteins encoded by genes included two anthocyanin reductases (LOC114259095, LOC114297899), five multidrug and toxic compound extrusion proteins (LOC114273949, LOC114288619, LOC114298825, LOC114300598, LOC114302652), three peroxidases (LOC114255969, LOC114264567, LOC114309410) and two laccases (LOC114278581, LOC114290795). In the ‘red’ color of leaves, the structural genes of three PODs (LOC114255969, LOC114264567, LOC114309410) and two LACs were significantly upregulated at RL_young with a verifiable measurement of POD and LAC activities (Fig. 4c), while two ANRs, five MATEs were expressed with no significant difference.

Synthesis of PAs begins with the generation of flavan-3-ol units (e.g., catechin and epicatechin). The key enzymes, LAR and ANR, convert leucocyanidins and anthocyanidins to catechin and epicatechin, respectively. Additionally, the two ANR structure genes detected in this study were significantly different between green leavf groups and red leaf groups, though they showed ordinarily inner RL groups. That is to say; the downregulated ANRs caused little or no PAs to exist in GL. This result has been identified similarly in Arabidopsis [34], grapevine [35], tea [36], and soybean [37].

Based on the co-expression analysis of differentially accumulated flavonoids and DEGs, we identified several catalytic enzymes involved in biosynthetic pathways to eleven PAs. The upregulation of genes encoding POD64 (LOC114309410) and LAC17 (LOC114290795) may result in a higher accumulation of proanthocyanins in RL, especially in RL_young (Fig. 5b and Supplementary Table 9). In the ‘red’ leaflets, the high expression level of peroxidases (PODs) and laccases (LACs) against RL_old could be explained by the fact that oxidative polymerization of PAs dimers (procyanidin) was catalyzed by these enzymes that were homologous to LAC15, POD2, and POD25 in Arabidopsis [38].
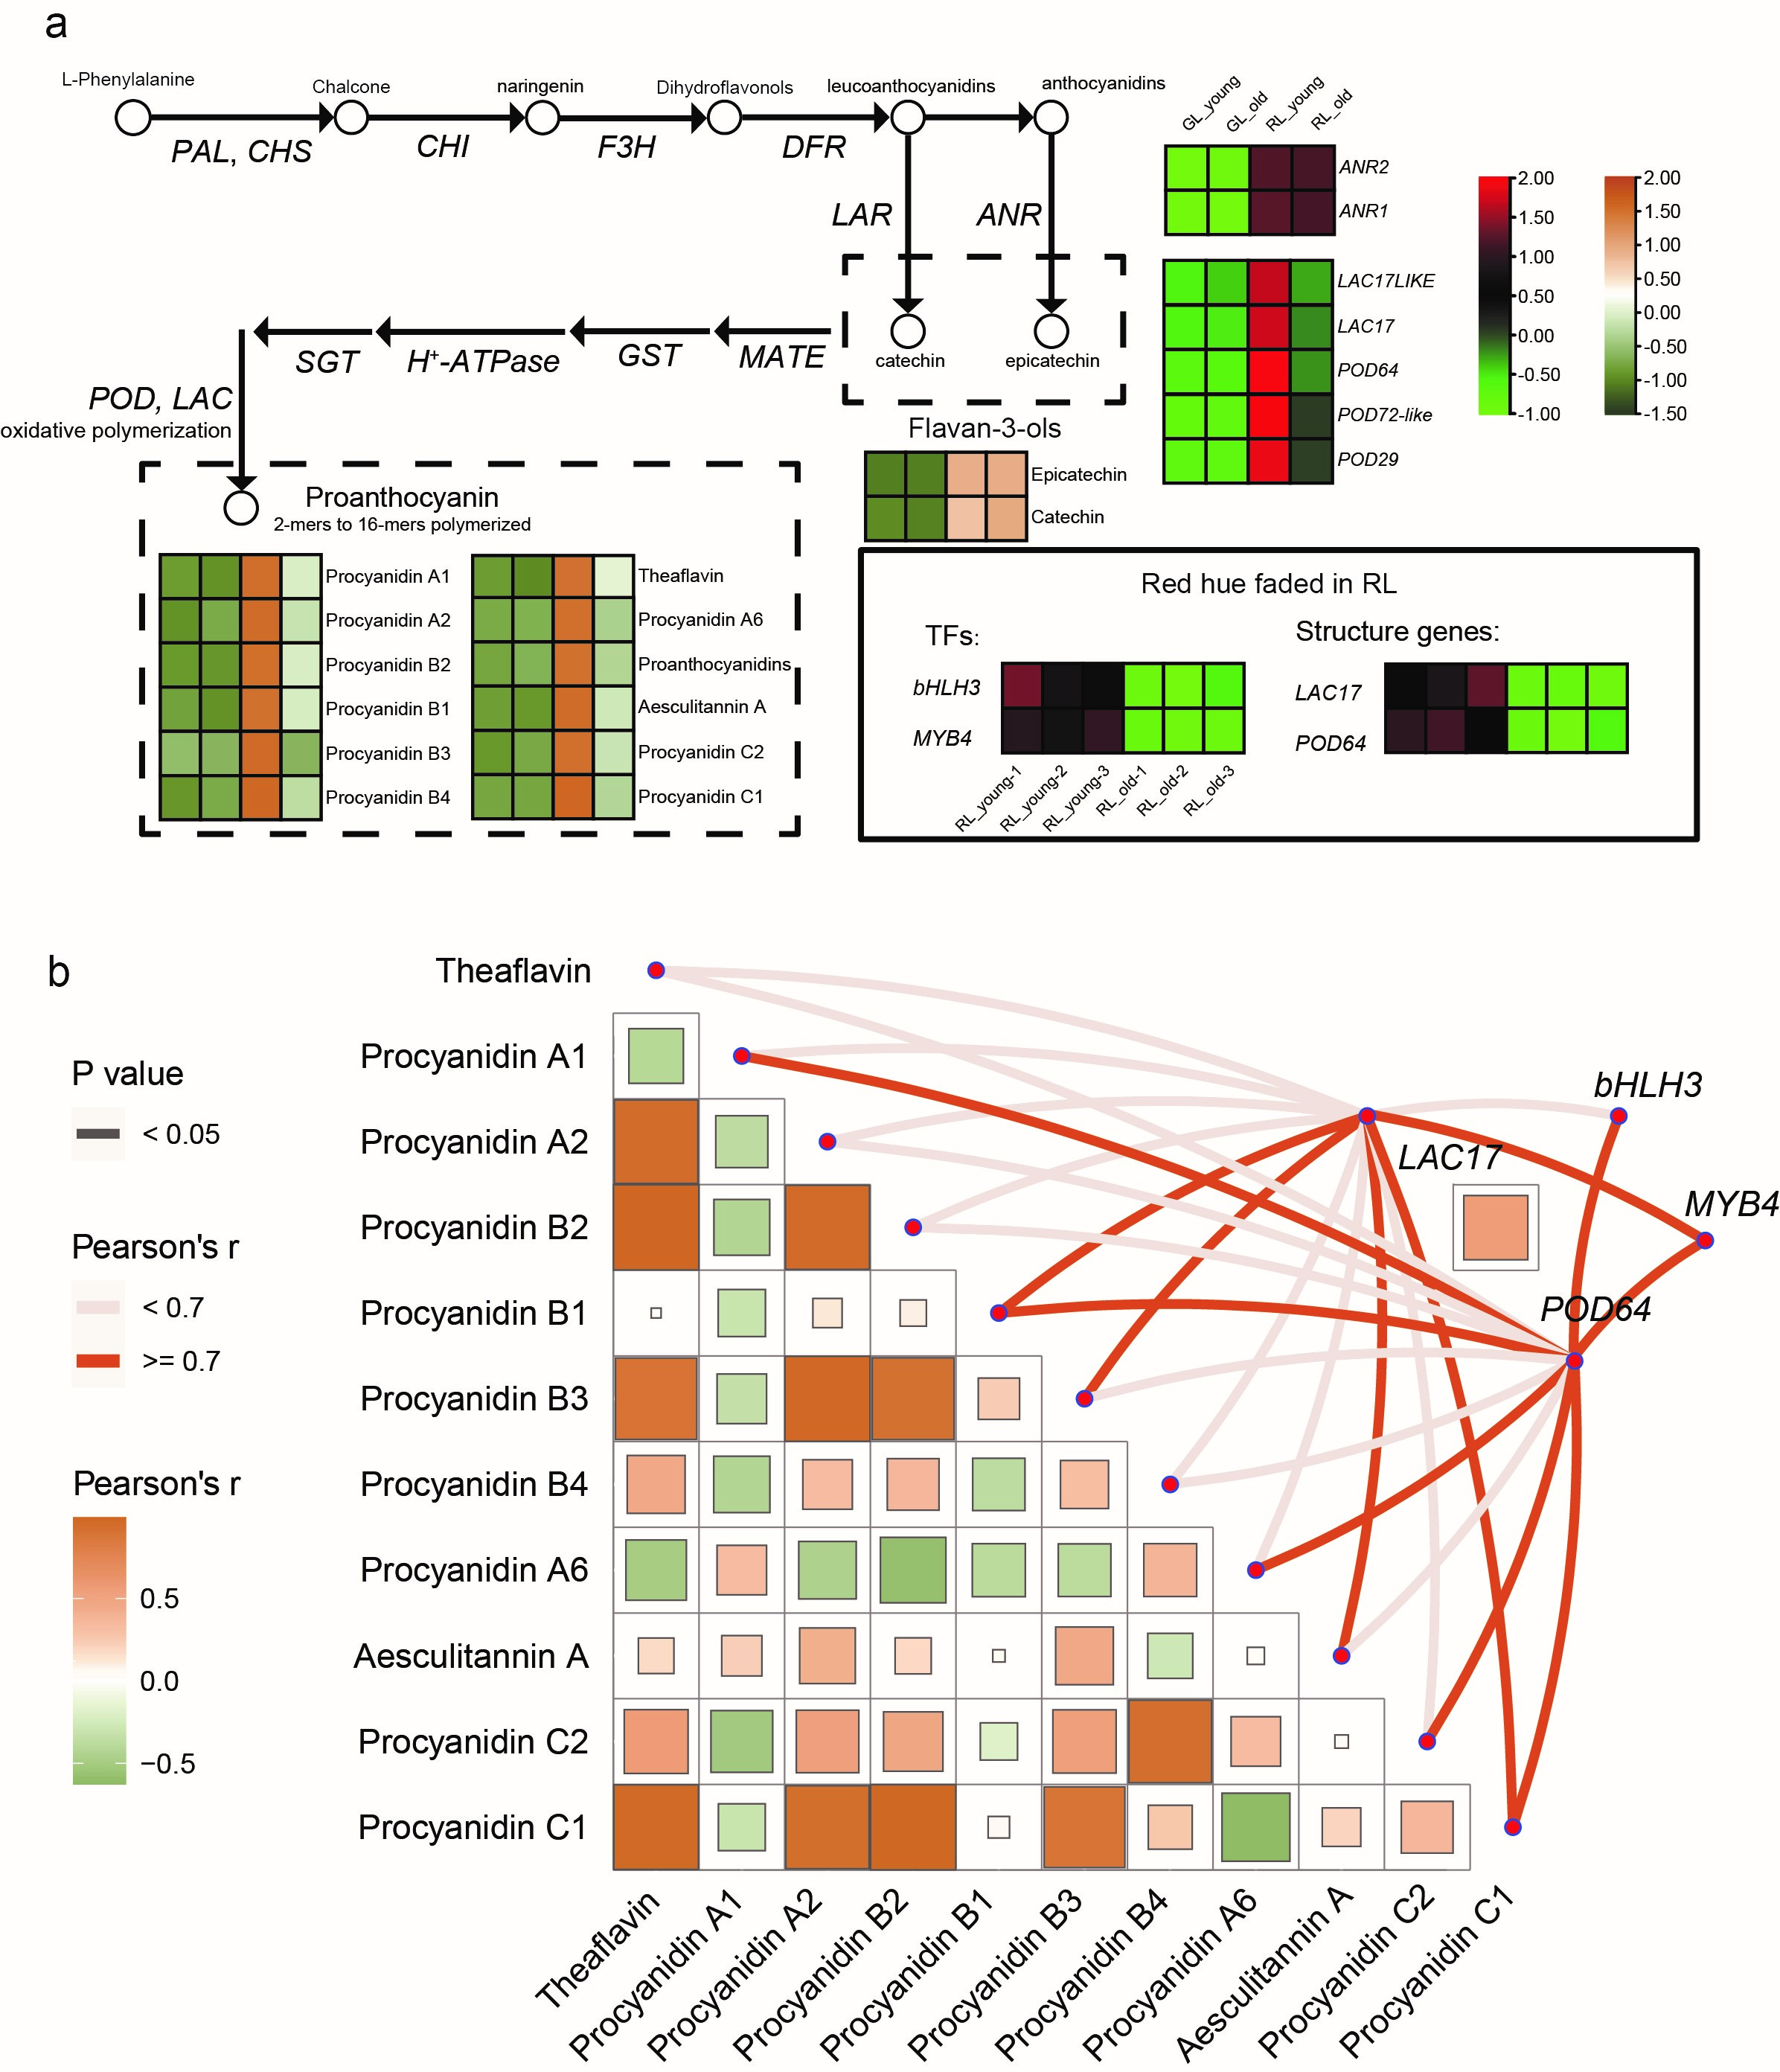
Fig. 5.

Simplified model of proanthocyanin biosynthesis pathway in Adinandra nitida and the correlation comparisons of metabolites, key enzymes, and transcription factors in proanthocyanin biosynthesis pathway at red leaves of Adinandra nitida for discoloration exploration. (a) Comparison of the differential metabolites and differential genes in anthocyanin biosynthesis pathway in four groups of leaves. The heatmaps show the expression pattern; the metabolite expression patterns were based on the Z-score in “brown - white - green”, and the gene expression patterns were based on the Z-score bar in “red - black - green”. (b) Pairwise comparisons of metabolites are shown, with a color gradient denoting Pearson’s correlation coefficients. The genes corresponding to the enzymes in this pathway were related to each metabolite by correlation and significance analysis. Edge width denotes the statistical significance based on p < 0.05, and edge color corresponds to Pearson’s r for the corresponding distance correlations.

Proanthocyanin biosynthesis is usually regulated by various transcription factors (TFs), particularly the MBW complex [39]. We further explored the TFs, including MYBs (MYB4, MYB61, MYB308, MYBCDC5, MYBCC, MYB3R-5, MYB-like 4, and MYBCD5) and bHLHs (bHLH1, bHLH3, bHLH130, bHLH104, and bHLH116), regulating flavonoids metabolism in RL by performing another co-expression network analysis to direct differentially expressed TFs toward flavonoids biosynthesis and polymerization closely related enzymes (CHI, LDOX, ANR, MATE, H+-ATPase, SGT, LAC, and POD) [40]. It was the downregulation of MYBs and bHLHs repressed several structural enzymes and affected the color pigmentation that faded indirectly [41]. In the family of MBW complex, the bHLH3 protein is the most obvious activating bHLH member since its expression is usually variable and positively correlates with flavonoid production [42]. Some researchers reported that the transcription factor bHLH3 activated expressions of genes in the flavonoid biosynthesis pathway [43]. In addition, studies have shown that MYB4 suppresses some MYB inhibitors to remove the inhibition of gene expression at the flavonoids biosynthesis pathway and also cooperates with other MYBs to maintain the balance in flavonoid biosynthesis [44, 45]. And the interaction between bHLH3 and MYB4 could positively regulate the proanthocyanidin synthesis and ensures that the plant accumulates desirable flavonoids [46]. We then screened two hub TFs encoding a tonoplast transporter into a highly correlated key module (r >0.7) (Fig. 5b). Among these TFs, MYB4 and bHLH3, which belong to the MBW family, were positively correlated with proanthocyanin biosynthesis in this study (Fig. 5a,b).

As did POD64 and LAC17, the synthesis of procyanidin C1 and C2 significantly correlated to the expressions quantity of POD64 and LAC17 (Fig. 5b), which could condense the catechin or epicatechin to a high degree of procyanidin polymerization products [47]. Multiple varieties of proanthocyanins possess essential roles in the growth and development of leaves and fruits [3]. Colorless PAs are converted to red-brown PA derivatives due to the oxidative polymerization of monomers by PODs and LACs [41]. Trimer procyanidin C1 and C2 contain a higher intensity of UV-Vis absorption than the lower polymerization degree of procyanidins like dimer procyanidin B-type, which suggests that the degree of procyanidin polymerization significantly influences the color-deepening phenomenon [30]. Therefore, the downregulation of these two catalysts (POD64 and LAC17) in old leaves was considered the driving factor for the decreasing trend in PA content (Fig. 5a). This result is common in other plants, including bilberries, persimmons, and blueberries [48]. However, several studies have indicated that partial PODs and LACs are responsible for the degradation of anthocyanins in Brunfelsia calycina and Pyrus bretschneideri [49].

In summary, PAs deemed as tannins causing red coloration in RL leaves were regulated by flavonoid biosynthesis pathways (ANR, LAC, MYB4, and bHLH3). The expression of the key gene ANR strongly influenced the flavan-3-ol accumulation in PA biosynthesis. That could be one of the key points resulting in the different leaf colors of Shiya tea varieties. An increased degree of catechin/epicatechin polymerization in the chromophore of PAs in RL could be induced by oxidative polymerase [50]. And higher polymerization degree of PAs may result in color deepening. The activities or the expressions of oxidative polymerases, POD64 and LAC17, were affected directly or indirectly by the polymerization of PAs.

4. Conclusions

To understand the altered metabolite compositions contributing to leaf coloration in red and green leaf tea, we associated significant changes in redness-related metabolites with the expression of structural genes involved in flavonoids biosynthesis pathway and associated TFs (bHLH3 and MYB4) at two stages of development of Adinandra nitida leaves. The accumulations of flavonoids and tannins, especially the increased accumulation of PAs in young stage of RL, were observed. Integrated with the selected enzyme genes and TFs, our results revealed that six structural genes found in proanthocyanin biosynthesis, two reductases (ANR), two oxidative polymerases (POD64, LAC17) and two TFs (bHLH3 and MYB4) related to biosynthesis and polymerization of proanthocyanins were associated with not only the difference of GL and RL but also the faded coloration in two RL groups (RL_young and RL_old). Among these genes, the enzymes (POD64 and LAC17) and TFs (bHLH3 and MYB4) were positively correlated to the accumulations of PAs in these two groups. Moreover, several oxidative polymerases were downregulated in the old stage of RL compared to its young stage, though the flavan-3-ol exhibits little difference in these two groups. Thus, these results provide explanations for the appearance of a red hue in RL and the faded red hue in the old stage of RL. This study provides a foundation for further research to investigate the PA biosynthesis regulatory networks via transcriptome and metabolome analysis in Adinandra nitida, offering insights into the regulatory mechanisms underlying beneficial metabolite accumulation in plants.

Abbreviations

ACNs, Anthocyanins; ANR, Anthocyanin Reductase; bHLH, Basic Helix-Loop-Helix; CAT, Catalase; CE, Collision Energy; CHI, Chalcone Isomerase; CUR, Curtain Gas; DAMs, Differentially Accumulated Metabolites; DEGs, Differentially Expressed Genes; DP, Declustering Potential; FPKM, Fragments Per Kilobase of Transcript Per Million Fragments Mapped; GL, Green leaf; GO, Gene Ontology; GST, Glutathione S-Transferase; GT, Glycosylation; KEGG, Kyoto Encyclopedia of Genes and Genomes; LAC, Laccase; LAR, Leucoanthocyanidin Reductase; LDOX, Leucoanthocyanidin Dioxygenase; MATE, Toxic Compound Extrusion Transporter; MRM, Multiple Reaction Monitoring method; MT, thylation; PAL, Phenylalanine Ammonialyase; PAs, Proanthocyanins; PCA, Principal Component Analysis; POD, Peroxidase; QQQ, Triple Quadrupole scans; qRT-PCR, Quantitative Real Time Polymerase Chain Reaction; QTRAP, Quadrupole-Linear Ion Trap; RL, Purple-red leaf; ROS, Reactive Oxygen Species; SGT, UDP-Glycosyltransferase superfamily protein; SOD, Superoxide Dismutase; TFs, Transcription factors; UFGT, UDP Glucose-Flavonoid 3-O-Glucosyl-Transferase; UPLC-MS/MS, Ultra performance liquid chromatography - tandem mass spectrometer; VIP, Variable Importance in Projection.

Availability of Data and Materials

The original contributions presented in the study are publicly available. This data can be found here: NCBI, SAMN32601060 - SAMN32601083.

Author Contributions

Conceptualization, YL, JAH, DZ and BZ; methodology, YL, JAH, DZ and BZ; validation, RH, YS and HS; formal analysis, RH, YS and HS; investigation, RH, YS, HS, WL, JXH and ZK; resources, WL, JXH and ZK; data curation, RH, YS and HS; writing—original draft preparation, RH, YS and HS; writing—review and editing, RH, YS, HS, WL, JXH, ZK, YL, JAH, DZ and BZ; visualization, YL, JAH. and DZ; supervision, BZ; project administration, DZ and BZ; funding acquisition, JAH, DZ and BZ. All authors contributed to editorial changes in the manuscript. All authors read and approved the final manuscript. All authors have participated sufficiently in the work and agreed to be accountable for all aspects of the work.

Ethics Approval and Consent to Participate

Shiya tea (Adinandra nitida) plants were used in this study. The purple-red leaf (RL) and green leaf (GL) varieties selected from Xinyi Academy of Forestry (Maoming, Gungdong, China)

Acknowledgment

We thank Wuhan Metware Biotechnology for assistance with metabolic data analysis.

Funding

This research was funded by the Provincial Natural Science Foundation of Guangdong, grant number 2021A1515110296, the Commercial Research Funds, grant number D12120260, and the Guangzhou Municipal Science and Technology Project, grant number 202002020028.

Conflict of Interest

The authors declare no conflict of interest.

References
[1]
Chen J, Zheng C, Ma J, Jiang C, Ercisli S, Yao M, et al. The chromosome-scale genome reveals the evolution and diversification after the recent tetraploidization event in tea plant. Horticulture Research. 2020; 7: 63.
[2]
Zhang X, Chen S, Shi L, Gong D, Zhang S, Zhao Q, et al. Haplotype-resolved genome assembly provides insights into evolutionary history of the tea plant Camellia sinensis. Nature Genetics. 2021; 53: 1250–1259.
[3]
Zhang Z, Feng X, Wang Y, Xu W, Huang K, Hu M, et al. Advances in research on functional genes of tea plant. Gene. 2019; 711: 143940.
[4]
Modder WWD, Amarakoon AMT. Tea and Health. Tea Research Institute: Talawakelle, Sri Lanka. 2002.
[5]
Yuan E, Liu B, Ning Z. Preparation and antioxidant activity of camellianin A from Adinandra nitida leaves. Journal of Food Processing and Preservation. 2008; 32: 785–797.
[6]
Jeganathan B, Punyasiri PA, Kottawa-Arachchi JD, Ranatunga MA, Abeysinghe IS, Gunasekare MT, et al. Genetic Variation of Flavonols Quercetin, Myricetin, and Kaempferol in the Sri Lankan Tea (Camellia sinensis L.) and Their Health-Promoting Aspects. International Journal of Food Science. 2016; 2016: 6057434.
[7]
Li S, Li N, Zhang Y, Wu J, Huang Y, Lin Q. Advance on the Chemical Component and Pharmacological Activity in Shiya tea. Chinese Traditional Patent Medicine. 2021; 43: 1280–1285. (In Chinese)
[8]
Maritim TK, Masand M, Seth R, Sharma RK. Transcriptional analysis reveals key insights into seasonal induced anthocyanin degradation and leaf color transition in purple tea (Camellia sinensis (L.) O. Kuntze). Scientific Reports. 2021; 11: 1244.
[9]
Wang S, Huang S, Yang J, Li Z, Zhang M, Fang Y, et al. Metabolite profiling of violet, white and pink flowers revealing flavonoids composition patterns in Rhododendron pulchrum Sweet. Journal of Biosciences. 2021; 46: 3.
[10]
Jeong ST, Goto-Yamamoto N, Hashizume K, Esaka M. Expression of the flavonoid 3′-hydroxylase and flavonoid 3′,5′-hydroxylase genes and flavonoid composition in grape (Vitis vinifera). Plant Science. 2006; 170: 61–69.
[11]
Li F, Deng X, Huang Z, Zhao Z, Li C, Song Q, et al. Integrated transcriptome and metabolome provide insights into flavonoid biosynthesis in ‘P113’, a new purple tea of Camellia tachangensis. Beverage Plant Research. 2023; 3: 1–11.
[12]
Li Y, Sun Z, Lu J, Jin Z, Li J. Integrated transcriptomics and metabolomics analysis provide insight into anthocyanin biosynthesis for sepal color formation in Heptacodium miconioides. Frontiers in Plant Science. 2023; 14: 1044581.
[13]
Guo J, Wu Y, Wang G, Wang T, Cao F. Integrated analysis of the transcriptome and metabolome in young and mature leaves of Ginkgo biloba L. Industrial Crops and Products. 2020; 143: 111906.
[14]
Toubiana D, Puzis R, Wen L, Sikron N, Kurmanbayeva A, Soltabayeva A, et al. Combined network analysis and machine learning allows the prediction of metabolic pathways from tomato metabolomics data. Communications Biology. 2019; 2: 214.
[15]
Chen X, Wang P, Zheng Y, Gu M, Lin X, Wang S, et al. Comparison of Metabolome and Transcriptome of Flavonoid Biosynthesis Pathway in a Purple-Leaf Tea Germplasm Jinmingzao and a Green-Leaf Tea Germplasm Huangdan reveals Their Relationship with Genetic Mechanisms of Color Formation. International Journal of Molecular Sciences. 2020; 21: 4167.
[16]
Beauchamp C, Fridovich I. Superoxide dismutase: Improved assays and an assay applicable to acrylamide gels. Analytical Biochemistry. 1971; 44: 276–287.
[17]
Wang H, Cui X, Zhao X, Gao S, Zhao J, and Yuan Z. Differences of Biochemical Constituents and Contents of Eight Cultivars Flowers of Camellia sinensis. Journal of Essential Oil Bearing Plants. 2015; 18: 320–328.
[18]
Şen FB, Bener M, Bekdeşer B, Apak R. Redox-based colorimetric sensing of H2O2 after removal of antioxidants with ABTS radical oxidation. Spectrochimica Acta Part A: Molecular and Biomolecular Spectroscopy. 2021; 248: 119266.
[19]
Shao D, Gao G, Abubakar AS, Hazaisi H, Chen P, Chen J, et al. Total Flavonoids Extracts of Apocynum L. from the Ili River Valley Region at Different Harvesting Periods and Bioactivity Analysis. Molecules. 2022; 27: 7343.
[20]
Zhang S, Chen Y, Zhao L, Li C, Yu J, Li T, et al. A novel NAC transcription factor, MdNAC42, regulates anthocyanin accumulation in red-fleshed apple by interacting with MdMYB10. Tree Physiology. 2020; 40: 413–423.
[21]
Knez Hrnčič M, Cör D, Kotnik P, Knez Ž. Extracts of White and Red Grape Skin and Rosehip Fruit: Phenolic Compounds and their Antioxidative Activity. Acta Chimica Slovenica. 2019; 66: 751–761.
[22]
Fioretto A, Papa S, Curcio E, Sorrentino G, Fuggi A. Enzyme dynamics on decomposing leaf litter of Cistus incanus and Myrtus communis in a Mediterranean ecosystem. Soil Biology and Biochemistry. 2000; 32: 1847–1855.
[23]
Onsa GH, bin Saari N, Selamat J, Bakar J. Purification and characterization of membrane-bound peroxidases from Metroxylon sagu. Food Chemistry. 2004; 85: 365–376.
[24]
Chen W, Gong L, Guo Z, Wang W, Zhang H, Liu X, et al. A Novel Integrated Method for Large-Scale Detection, Identification, and Quantification of Widely Targeted Metabolites: Application in the Study of Rice Metabolomics. Molecular Plant. 2013; 6: 1769–1780.
[25]
Xia X, Chen C, Yang L, Wang Y, Duan A, Wang D. Analysis of metabolites in young and mature Docynia delavayi (Franch.) Schneid leaves using UPLC-ESI-MS/MS. PeerJ. 2022; 10: e12844.
[26]
Zuo SM, Yu HD, Zhang W, Zhong Q, Chen W, Chen W, et al. Comparative Metabolomic Analysis of Dendrobium officinale under Different Cultivation Substrates. Metabolites. 2020; 10: 325.
[27]
Xu J, Fang M, Li Z, Zhang M, Liu X, Peng Y, et al. Third-Generation Sequencing Reveals LncRNA-Regulated HSP Genes in the Populus x canadensis Moench Heat Stress Response. Frontiers in Genetics. 2020; 11: 249.
[28]
Yadav B, Jogawat A, Rahman MS, Narayan OP. Secondary metabolites in the drought stress tolerance of crop plants: a review. Gene Reports. 2021; 23: 101040.
[29]
Hughes NM, Carpenter KL, Cannon JG. Estimating contribution of anthocyanin pigments to osmotic adjustment during winter leaf reddening. Journal of Plant Physiology. 2013; 170: 230–233.
[30]
Han N, Kim I, Kim J, Lee J. Tissue-specific distribution of primary and secondary metabolites of Baemoochae (×Brassicoraphanus) and its changes as a function of developmental stages. Food Research International. 2021; 150: 110796.
[31]
Hibi Y, Yanase E. Oxidation of Procyanidins with Various Degrees of Condensation: Influence on the Color-Deepening Phenomenon. Journal of Agricultural and Food Chemistry. 2019; 67: 4940–4946.
[32]
Yang J, Xiao Y. Grape Phytochemicals and Associated Health Benefits. Critical Reviews in Food Science and Nutrition. 2013; 53: 1202–1225.
[33]
Chen C, Chen H, Yang W, Li J, Tang W, Gong R. Transcriptomic and Metabolomic Analysis of Quality Changes during Sweet Cherry Fruit Development and Mining of Related Genes. International Journal of Molecular Sciences. 2022; 23: 7402.
[34]
Xie DY, Sharma SB, Paiva NL, Ferreira D, Dixon RA. Role of anthocyanidin reductase, encoded by BANYULS in plant flavonoid biosynthesis. Science. 2003; 299: 396-399.
[35]
Gagné S, Lacampagne S, Claisse O, Gény L. Leucoanthocyanidin reductase and anthocyanidin reductase gene expression and activity in flowers, young berries and skins of Vitis vinifera L. cv. Cabernet-Sauvignon during development. Plant Physiology and Biochemistry. 2009; 47: 282–290.
[36]
Singh K, Rani A, Paul A, Dutt S, Joshi R, Gulati A, et al. Differential display mediated cloning of anthocyanidin reductase gene from tea (Camellia sinensis) and its relationship with the concentration of epicatechins. Tree Physiology. 2009; 29: 837–846.
[37]
Kovinich N, Saleem A, Arnason JT, Miki B. Identification of two anthocyanidin reductase genes and three red-brown soybean accessions with reduced anthocyanidin reductase 1 mRNA, activity, and seed coat proanthocyanidin amounts. Journal of Agricultural and Food Chemistry. 2012; 60: 574–584.
[38]
Renard J, Martínez-Almonacid I, Sonntag A, Molina I, Moya-Cuevas J, Bissoli G, et al. PRX2 and PRX25, peroxidases regulated by COG1, are involved in seed longevity in Arabidopsis. Plant, Cell & Environment. 2020; 43: 315–326.
[39]
Chen L, Wang X, Cui L, Li Y, Liang Y, Wang S, et al. Transcriptome and metabolome analyses reveal anthocyanins pathways associated with fruit color changes in plum (Prunus salicina Lindl.). PeerJ. 2022; 10: e14413.
[40]
Wang Y, Hou Y, Wang J, Zhao H. Analyzing lignin biosynthesis pathways in rattan using improved co-expression networks of NACs and MYBs. BMC Plant Biology. 2022; 22: 411.
[41]
Wang Z, Du H, Zhai R, Song L, Ma F, Xu L. Transcriptome Analysis Reveals Candidate Genes Related to Color Fading of ‘Red Bartlett’ (Pyrus communis L.). Frontiers in Plant Science. 2017; 8: 455.
[42]
Zeng S, Wu M, Zou C, Liu X, Shen X, Hayward A, et al. Comparative analysis of anthocyanin biosynthesis during fruit development in two Lycium species. Physiologia Plantarum. 2014; 150: 505–516.
[43]
Ravaglia D, Espley RV, Henry-Kirk RA, Andreotti C, Ziosi V, Hellens RP, et al. Transcriptional regulation of flavonoid biosynthesis in nectarine (Prunus persica) by a set of R2R3 MYB transcription factors. BMC Plant Biology. 2013; 13: 68.
[44]
Fornalé S, Lopez E, Salazar-Henao JE, Fernández-Nohales P, Rigau J, Caparros-Ruiz D. AtMYB7, a New Player in the Regulation of UV-Sunscreens in Arabidopsis thaliana. Plant and Cell Physiology. 2014; 55: 507–516.
[45]
Yuan Y, Wu C, Liu Y, Yang J, Huang L. The Scutellaria baicalensis R2R3-MYB transcription factors modulates flavonoid biosynthesis by regulating GA metabolism in transgenic tobacco plants. PLoS ONE. 2013; 8: e77275.
[46]
Li H, Yang Z, Zeng Q, Wang S, Luo Y, Huang Y, et al. Abnormal expression of bHLH3 disrupts a flavonoid homeostasis network, causing differences in pigment composition among mulberry fruits. Horticulture Research. 2020; 7: 83.
[47]
Rohr GE, Meier B, Sticher O. Analysis of procyanidins. Studies in Natural Products Chemistry. 2000; 21: 497–570.
[48]
Wang C, Zhang M, Wu L, Wang F, Li L, Zhang S, et al. Qualitative and quantitative analysis of phenolic compounds in blueberries and protective effects on hydrogen peroxide‐induced cell injury. Journal of Separation Science. 2021; 44: 2837–2855.
[49]
Zipor G, Duarte P, Carqueijeiro I, Shahar L, Ovadia R, Teper-Bamnolker P, et al. In planta anthocyanin degradation by a vacuolar class III peroxidase in Brunfelsia calycina flowers. New Phytologist. 2015; 205: 653–665.
[50]
Uchimiya M, Ni X, Wang ML. Structure‐reactivity relationships between the fluorescent chromophores and antioxidant activity of grain and sweet sorghum seeds. Food Science and Nutrition. 2016; 4: 811–817.

Publisher’s Note: IMR Press stays neutral with regard to jurisdictional claims in published maps and institutional affiliations.

Share
Back to top