
- Academic Editor
Background: Fallopia aubertii (L. Henry) Holub is a perennial
semi-shrub with both ornamental and medicinal value. The mitochondrial genomes of
plants contain valuable genetic traits that can be utilized for the exploitation
of genetic resources. The parsing of F. aubertii mitochondrial genome
can provide insight into the role of mitochondria in plant growth and
development, metabolism regulation, evolution, and response to environmental
stress. Methods: In this study, we sequenced the mitochondrial genome of
F. aubertii using the Illumina NovaSeq 6000 platform and Nanopore
platform. We conducted a comprehensive analysis of the mitochondrial genome of
F. aubertii, which involved examining various aspects such as gene
composition, repetitive sequences, RNA editing sites, phylogeny, and organelle
genome homology. To achieve this, we employed several bioinformatics methods
including sequence alignment analysis, repetitive sequence analysis, phylogeny
analysis, and more. Results: The mitochondrial genome of F.
aubertii has 64 genes, including 34 protein-coding genes (PCGs), three rRNAs,
and 27 tRNAs. There were 77 short tandem repeat sequences detected in the
mitochondrial genome, five tandem repeat sequences identified by Tandem Repeats
Finder (TRF), and 50 scattered repeat sequences observed, including 22 forward
repeat sequences and 28 palindrome repeat sequences. A total of 367 RNA coding
sites were predicted in PCGs, with the highest number (33) found within
ccmB. Ka/Ks values estimated for mitochondrial genes of
F. aubertii and three closely related species representing
Caryophyllales were less than 1 for most of the genes. The maximum likelihood
evolutionary tree showed that F. aubertii and Nepenthes
The mitochondrial genome, which is circular or linear DNA [1, 2], usually contains dozens of genes that encode proteins and RNA molecules involved in the regulation of mitochondrial function and morphology. The primary function of mitochondria is the production of adenosine triphosphate (ATP), which provides energy to cells [3]. Mitochondrial DNA plays a crucial role in metabolic processes like respiration and photosynthesis, which have a direct or indirect impact on the growth and development of organisms [4]. However, mutations, deletions, or insertions in mitochondrial genes can alter this effect [5, 6, 7]. The parsing of higher plant mitochondrial genes can provide insight into the role of mitochondria in plant growth and development, metabolism regulation, and response to environmental stress [8, 9]. Similarly, the mitochondrial genome contains valuable information that can be utilized for the development of molecular markers, genetic engineering, and elucidation of the phylogenetic and evolutionary connections among plant species [10, 11].
Fallopia aubertii (L. Henry) Holub is a perennial semi-shrub or deciduous vine plant that is widely distributed in Asia, Europe, and North America [12, 13, 14]. It is a heliophilous plant with strong adaptability but is intolerant of shade or water-logging [15], and is commonly found on slopes, riverbanks, forest edges, and beaches. Regarding population ecology, F. aubertii is a relatively dispersed species that is malleable and adaptable to various environments. In recent years, researchers have studied the growth and development, genetic variation, chemical constituents, and pharmacodynamic effects of F. aubertii [14, 16, 17]. Our research team has isolated multiple compounds from F. aubertii, studying its anti-gout efficacy, and sequenced and annotated its chloroplast genome [18, 19, 20].
In this study, we utilize high-throughput sequencing technology and bioinformatics methods to analyze the mitochondrial genome features of F. aubertii. In addition, we reconstruct the phylogenetic relationships among F. aubertii and its closest relatives by using the mitochondrial genome sequence. The current study provides a scientific foundation and a point of reference for the exploitation and development of the species’ resources, as well as the preservation of its biological diversity.
The sample of F. aubertii was collected from the campus of Qinghai Minzu University in Qinghai, China (36.59
We used GetOrganelle v1.7.1 (Max Planck Institute of Molecular Plant Physiology, Munich, Germany) [21] to perform de novo assembly of the
mitochondrial genome. The mitochondrial genome of Bougainvillea
spectabilis (GenBank Accession Number: MW167296), a closely related species, was
used as the reference sequence. To select the potential mitochondrial reads, we
used BLAST searches against the mitogenome of B. spectabilis and the
GetOrganelle results from a pool of Illumina reads. The mitochondrial Illumina
reads were assembled into
Tandem repeat sequences in the genome were identified by Tandem Repeats Finder (TRF) [27] (https://tandem.bu.edu/trf/trf.html) with the following parameters: match +2, mismatch –7, indel –7. We reported only the repeats with scores greater than 50. Identification of short tandem repeat (STR) or simple sequence repeats (SSR) was performed using MISA v2.1 MISA (Leibniz Institute of Plant Genetics and Crop Plant Research, Stadt Seeland, Germany) [28] with the following parameters:1–10, 2–5, 3–4, 4–3, 5–3, 6–3. The REPuter online version [29] (https://bibiserv.cebitec.uni-bielefeld.de/reputer/) was used to search scattered repeats in the mitochondrial genome with the following parameters: hamming distance-3, maximum computed repeats-50, and minimal repeat size-8.
To predict the RNA-editing sites within the mitochondrial genes of F. aubertii the online PmtREP (http://www.genepioneer.com/) was used, with a threshold value of 0.2 for the mitochondrial sequences.
We applied the cloud platform (http://www.genepioneer.com/) to analyze the GC content of the F. aubertii mitochondrial coding sequence (CDS). To visualize the GC skew, we uploaded the CDS of F. aubertii to the online Proksee [30] tool and selected the “GC Content” and “GC Skew” tabs.
The ratio of nonsynonymous substitutions (Ka) to synonymous
substitutions (Ks) of protein-coding genes (PCGs) between F.
aubertii and three closely related species
(Nepenthes
A phylogenetic tree was constructed using the mitochondrial genome sequences of F. aubertii, Malania oleifera (Olacaceae, Santalales), and 15 other species from the order Caryophyllales, with M. oleifera used as an outgroup. We extracted the shared coding sequences from the 17 genomes mentioned above and used BLAST to identify homologous sequences. The resulting sequences were aligned using Mafft, and then concatenated. A trimming percentage of 0.7 was set using the trim function to remove any poorly aligned bases. The maximum likelihood phylogenetic tree was constructed, and the substitution model GTR+F+R3 was selected for the analysis using MEGA 7 [34]. The phylogenetic tree’s step values were determined for each branch by performing 1000 spontaneous replicate analyses.
A BLAST search was conducted between the mitochondrial and chloroplast genomes of F. aubertii to identify homologous regions. The resulting homologous segments were then compared and analyzed for sequence similarity, number of protein-coding genes, length, and composition of intergenic regions.
The second-generation sequencing platform yielded a data set of 4645.7 Mb of raw reads and 4432 Mb of clean reads, whereas the third-generation sequencing platform generated 21,993 reads with a total size of 67 Mb.
The genome (NCBI accession number: MW664926.1) obtained in this study is a circular DNA molecule with a length of 350,156 bp (Fig. 1), and a GC content of 44.73%. The base composition of the mitochondrial genome is asymmetric, and the coding and non-coding regions’ base composition, size, and proportion are shown in Table 1. The GC content in tRNA and rRNA is relatively high, accounting for 0.59% and 1.47% of the mitochondrial genome sequence, respectively.
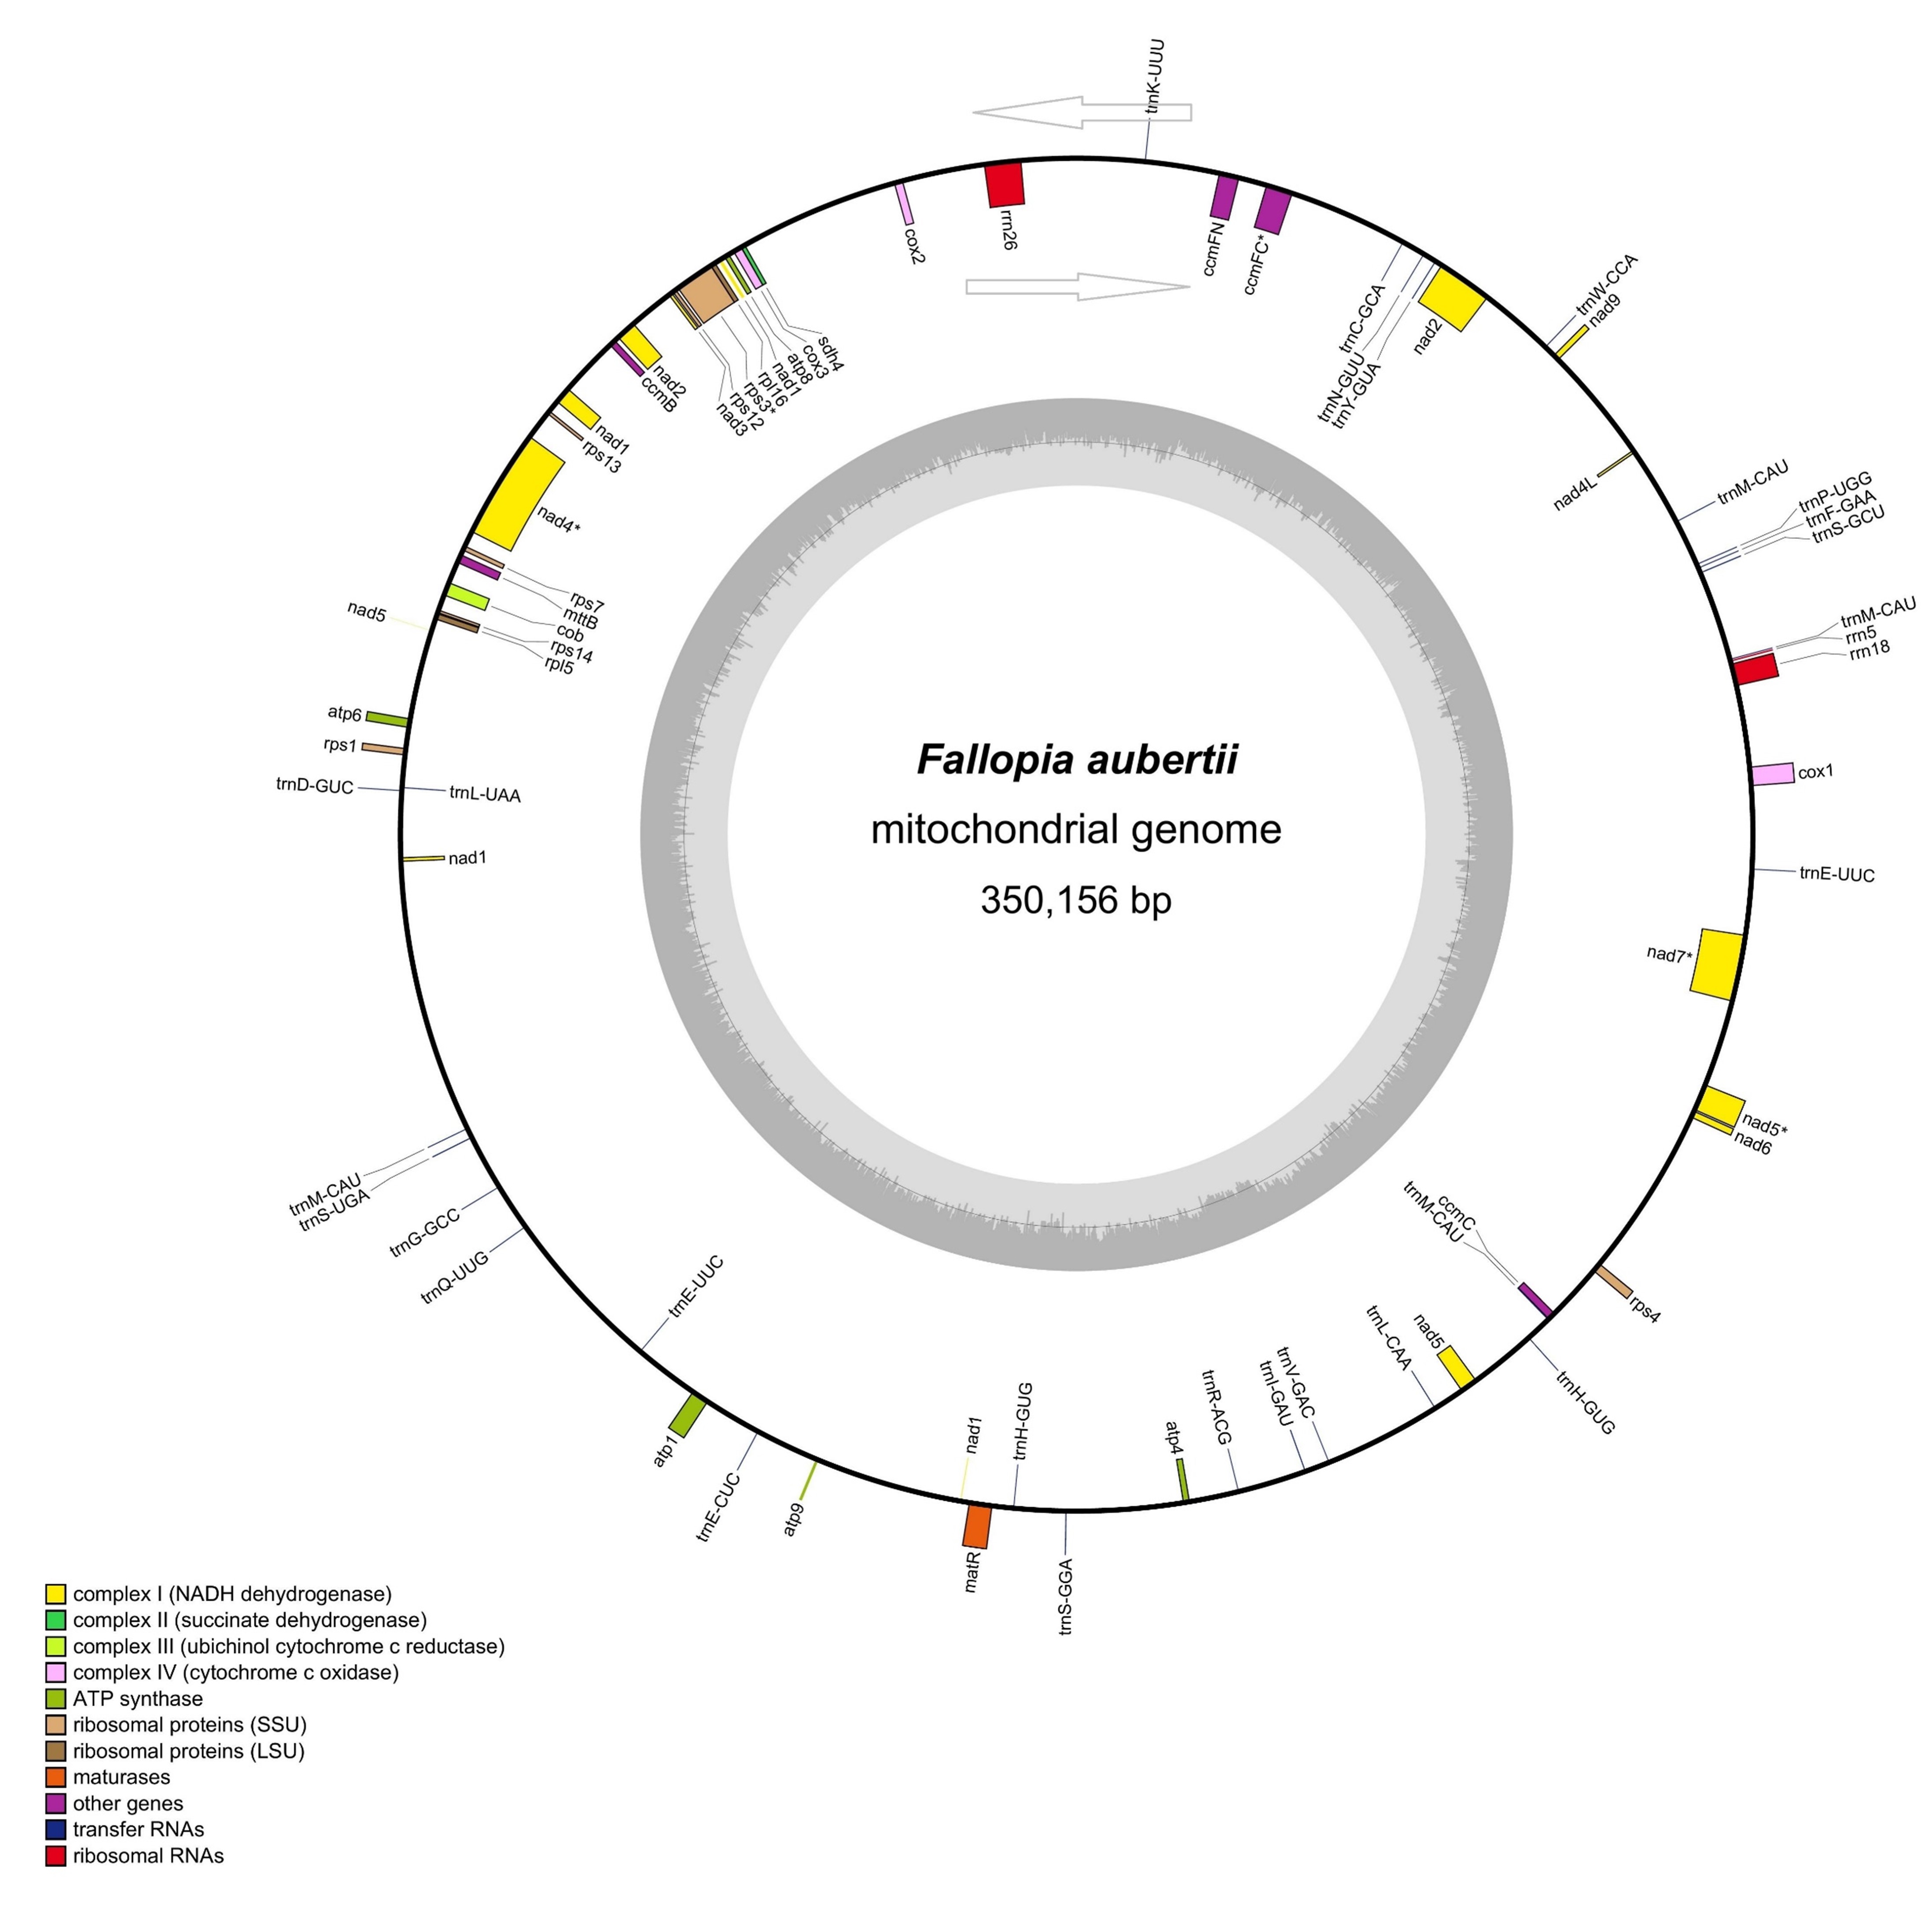 Fig. 1.
A circular map of the F. aubertii mt genome. The counterclockwise genes are located on the outer side of the loop, whereas the clockwise genes are located on the inner side of the circle. The diagram shows the names of the contained genes. Colors are used to represent the different functional groups of genes. The grey circles inside represent GC content. The asterisks (*) represent intron-containing genes.
| Feature | A (%) | T (%) | G (%) | C (%) | GC (%) | Size (bp) | Proportion in Genome (%) |
| Genome | 27.69 | 27.58 | 22.2 | 22.53 | 44.73 | 350,156 | 100 |
| CDS | 26.64 | 31.39 | 21.39 | 20.58 | 41.97 | 30,276 | 8.65 |
| Cis-spliced intron | 25.64 | 23.14 | 26.94 | 24.27 | 51.22 | 22,868 | 6.53 |
| tRNA | 23.05 | 26.34 | 28.28 | 22.32 | 50.61 | 2065 | 0.59 |
| rRNA | 26.18 | 22.41 | 28.82 | 22.59 | 51.41 | 5153 | 1.47 |
| Non-coding region | 27.85 | 27.81 | 22.08 | 22.26 | 44.34 | 289,955 | 82.81 |
Note: CDS: coding sequence.
The F. aubertii mitochondrial genome contains 64 genes, including 34 PCGs, three rRNAs, and 27 tRNAs (Table 2). Out of the 34 protein-coding genes, only five (ccmFC, rps3, nad4, nad5, and nad7) contain introns and were categorized as cis-splice genes (Fig. 2). We examined 27 tRNA genes and determined that they can transport 17 standard amino acids. The length of tRNA ranged from 71 bp to 88 bp, with a length of 1816 bp in total. Among these genes, multicopy genes were found for trnE-UUC, trnH-GUG, and trnM-CAU. Additionally, we predicted the secondary structures of tRNAs (Fig. 3). All genes except for tRNA-Leu, tRNA-Ser, and tRNA-Tyr were predicted to have typical cloverleaf structures, and the base mismatches were mostly G-U. The mitochondrial genome contains three different tRNAs, each with different anticodons that specifically transport serine (Ser). These results are of great significance for further study of the function and stability of tRNA.
| Group of genes | Gene name |
| ATP synthase | atp1, atp4, atp6, atp8, atp9 |
| Cytochrome c biogenesis | ccmB, ccmC, ccmFC*, ccmFN |
| Ubiquinol cytochrome c reductase | cob |
| Cytochrome c oxidase | cox1, cox2, cox3 |
| Maturases | matR |
| Transport membrane protein | mttB |
| NADH dehydrogenase | nad1****, nad2****, nad3, nad4***, nad4L, nad5****, nad6, nad7****, nad9 |
| Ribosomal proteins (LSU) | rpl16, rpl5 |
| Ribosomal proteins (SSU) | rps1, rps12, rps13, rps14, rps3*, rps4, rps7 |
| Succinate dehydrogenase | sdh4 |
| Ribosomal RNAs | rrn18, rrn26, rrn5 |
| Transfer RNAs | trnC-GCA, trnD-GUC, trnE-CUC, trnE-UUC (2), trnF-GAA, trnG-GCC, trnH-GUG (2), trnI-GAU, trnK-UUU, trnL-CAA, trnL-UAA, trnM-CAU (4), trnN-GUU, trnP-UGG, trnQ-UUG, trnR-ACG, trnS-GCU, trnS-GGA, trnS-UGA, trnV-GAC, trnW-CCA, trnY-GUA |
Notes: *: intron number. The number of asterisks (*) refers to the number of introns. The number in brackets next to the gene name indicates the number of copies of multi-copy genes.
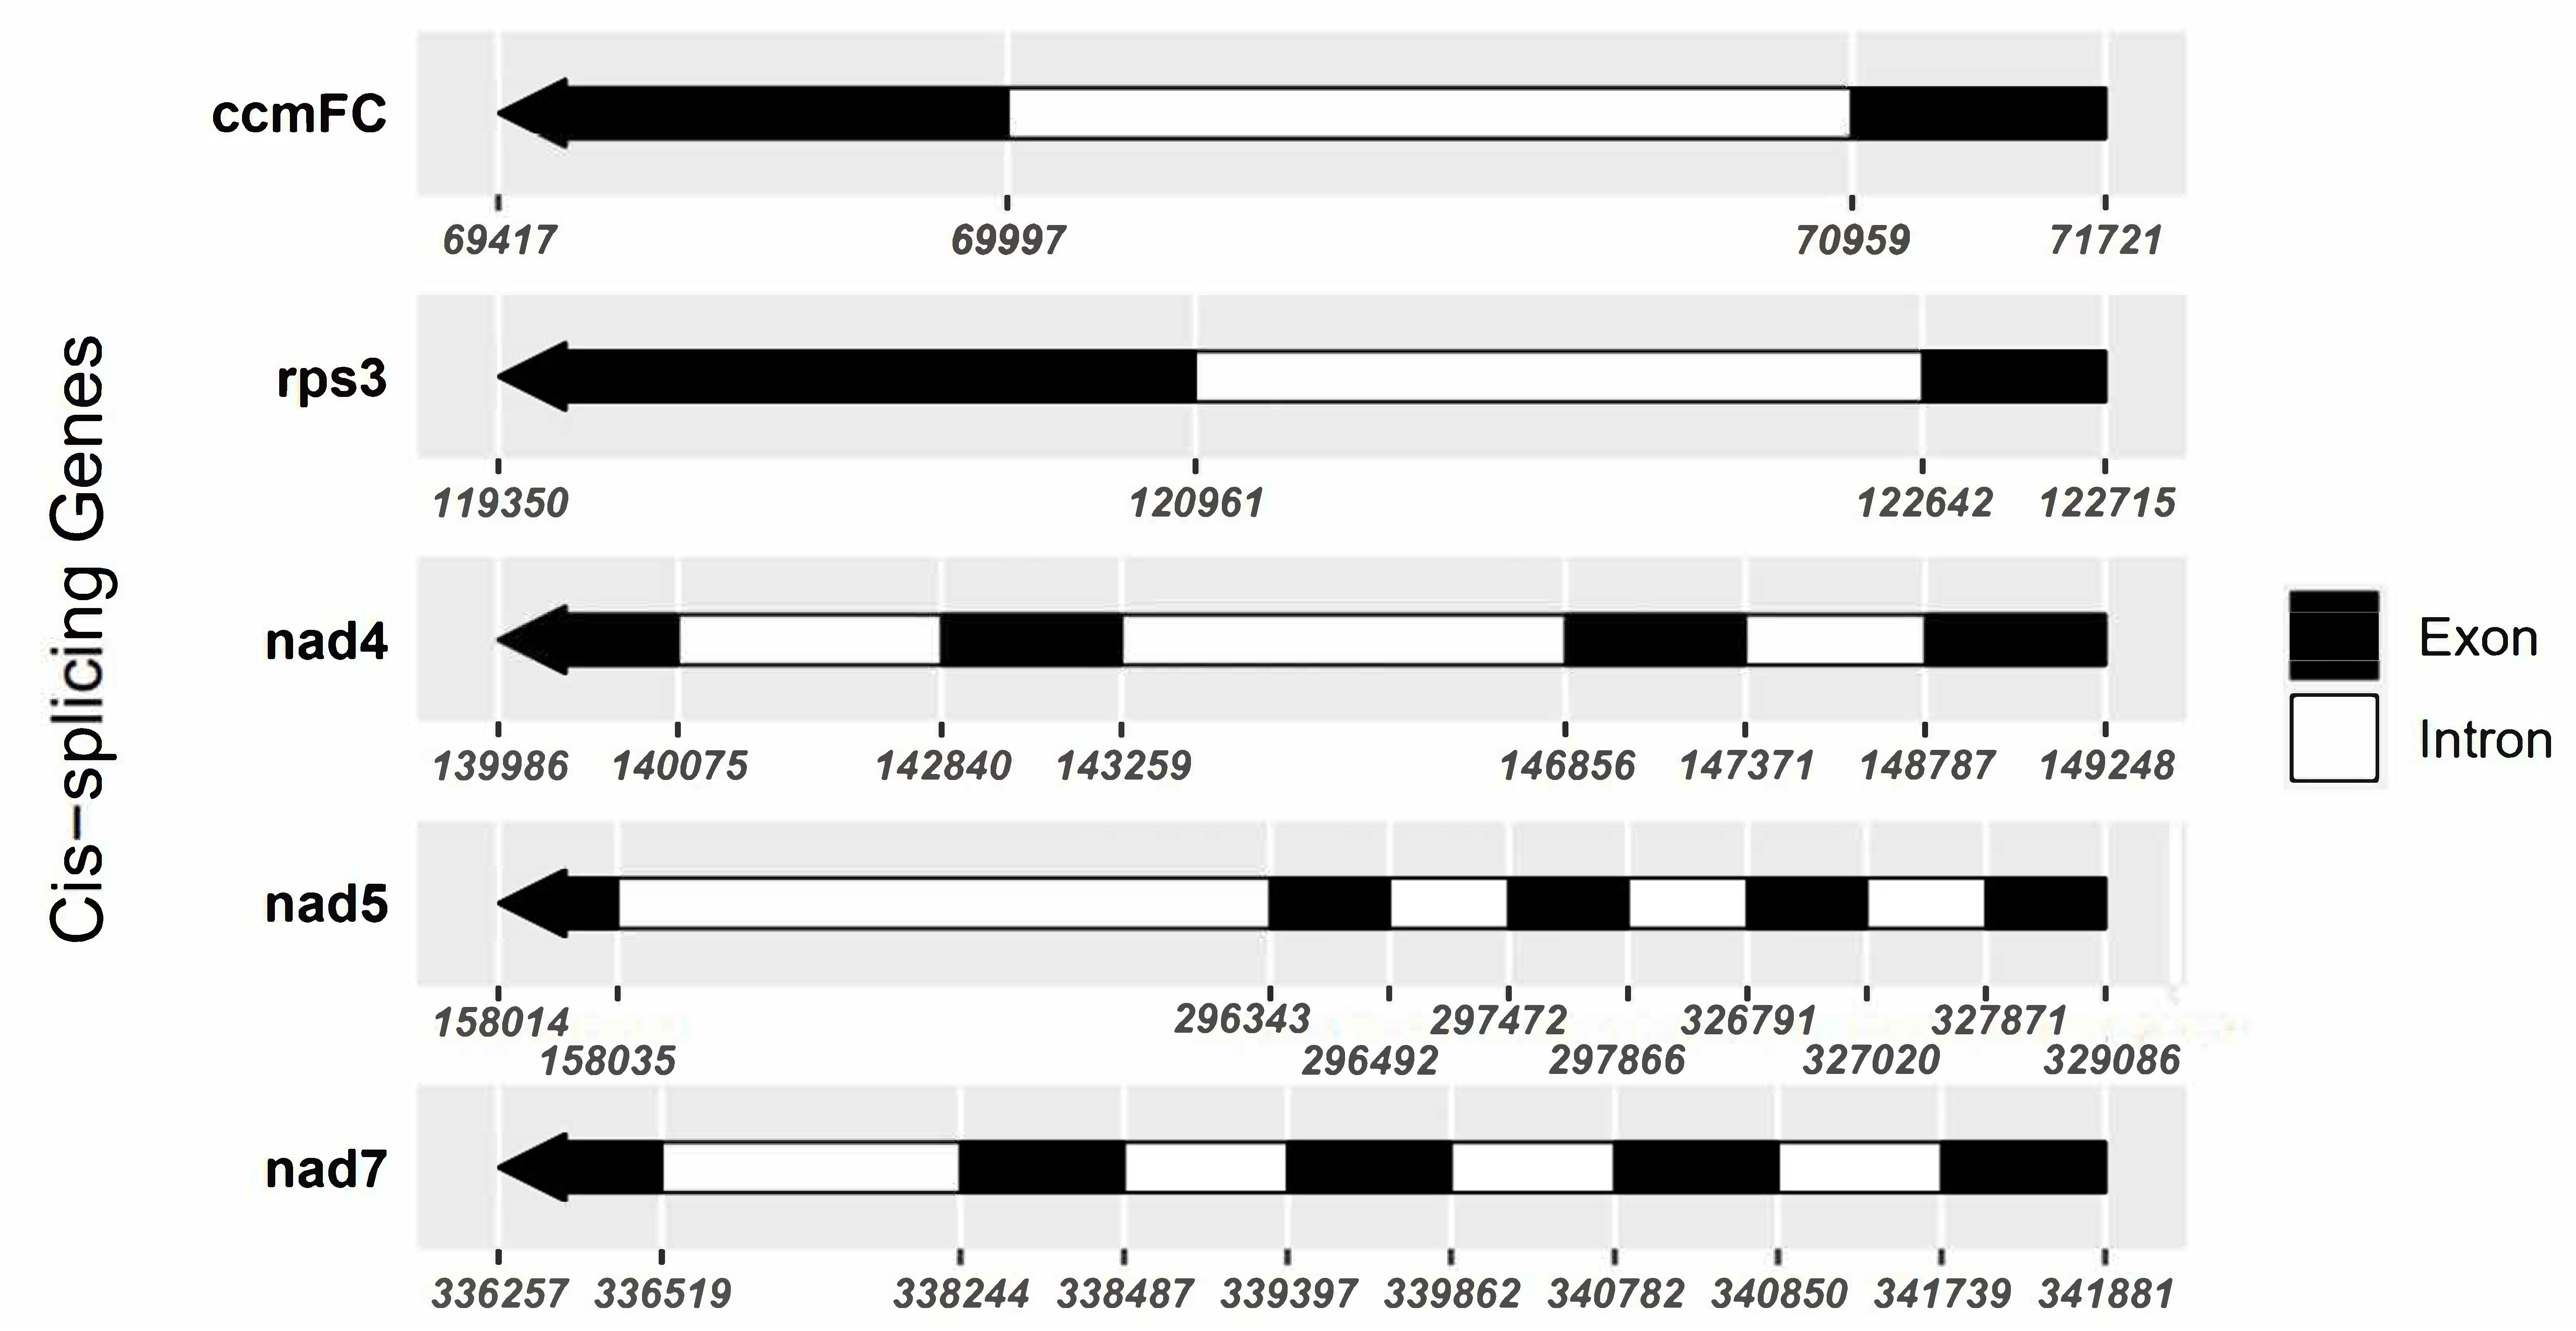 Fig. 2.
Schematic map of the cis-splicing genes. Black blocks represent exons, and white blocks represent introns. The numbers beneath the protein-coding genes indicate the locations of introns and exons. One intron is present in both ccmFC and rps3. Three introns are in nad4 and four in nad5 and nad7.
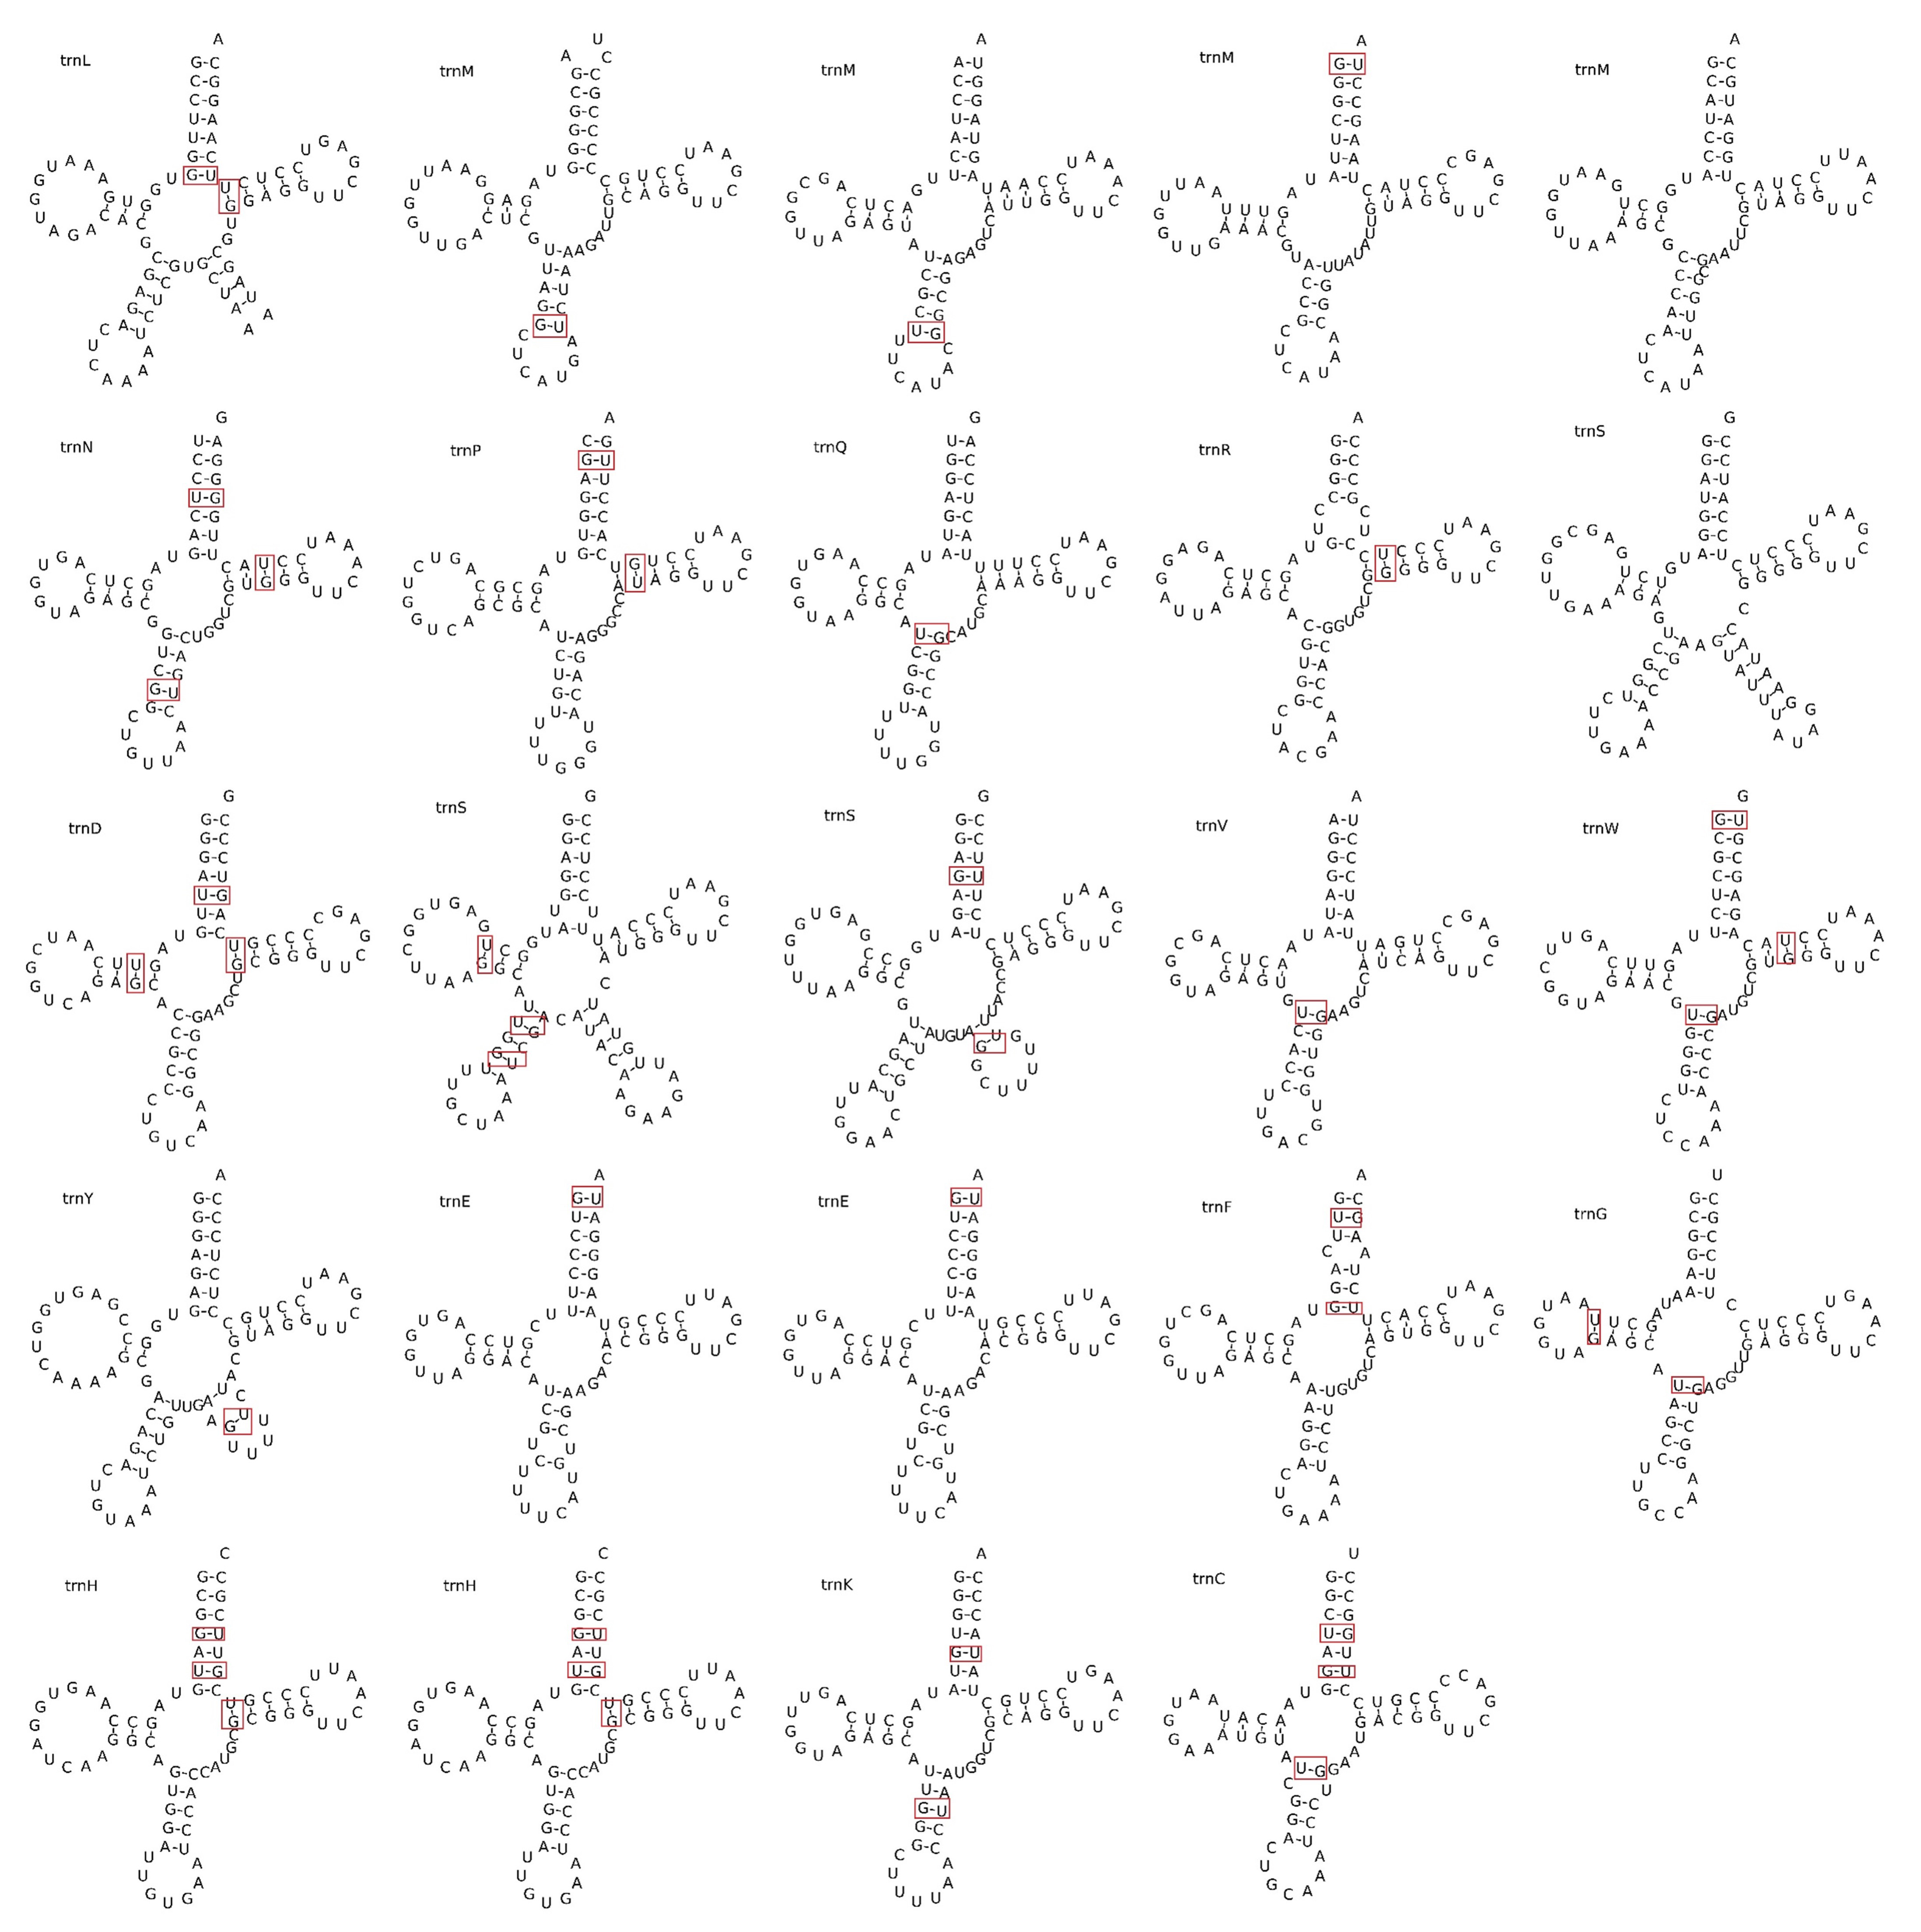 Fig. 3.
tRNA secondary structure prediction. Twenty-four tRNA secondary structures were identified in the mitochondrial genome of F. aubertii. The top left of the structure is the amino acid abbreviation letter. Base mismatches exist, usually U-C base mismatches. The mismatched bases are marked in red boxes.
Repetitive sequences can serve as genome-specific genetic markers for phylogenetic relationships among species. STRs show a high degree of polymorphism and are commonly used as molecular markers for genetic diversity studies and germplasm characteristics, identification, and selection. In the analysis of STR in the mitochondrial genome of F. aubertii, 77 STR loci were detected. There are 28 single nucleotide motifs, 16 dinucleotide motifs, seven trinucleotide motifs, 22 tetranucleotide motifs, and four pentanucleotide motifs. No hexanucleotide motifs were detected (Table 3). Additionally, five long tandem repeat sequences were detected by TRF software in the mitochondrial genome of F. aubertii (Table 4).
| Motif | Number | Proportion (%) |
| Mononucleotide | 28 | 36.4 |
| Dinucleotide | 16 | 20.8 |
| Trinucleotide | 7 | 9.1 |
| Tetranucleotide | 22 | 28.5 |
| Pentanucleotide | 4 | 5.2 |
| Total | 77 | 100 |
| Indices | Period size of the repeat | Copy number | Consensus size | Percent of matches | Percent of indels | A | C | G | T | Entropy |
| 48,505–48,551 | 20 | 2.2 | 22 | 81 | 11 | 29 | 25 | 21 | 23 | 1.99 |
| 93,390–93,432 | 18 | 2.4 | 18 | 81 | 18 | 34 | 25 | 20 | 18 | 1.96 |
| 119,178–119,223 | 24 | 1.9 | 24 | 90 | 0 | 28 | 21 | 21 | 28 | 1.99 |
| 276,633–276,698 | 32 | 2.1 | 32 | 94 | 0 | 27 | 9 | 22 | 40 | 1.84 |
| 289,717–289,760 | 21 | 2.1 | 21 | 91 | 0 | 36 | 15 | 20 | 27 | 1.93 |
Scattered repetitive sequences are crucial in the study of gene mutation, genome origin and evolution, and species formation [35]. In this study, a total of 50 scattered repeats were identified in the mitochondrial genome of F. aubertii, consisting of 22 forward repeats and 28 palindromic repeats. No reverse repeats, or complementary repeats were detected. The longest identified repeat sequence was 5272 bp, whereas most of the repeats were 50–200 bp in length (Fig. 4).
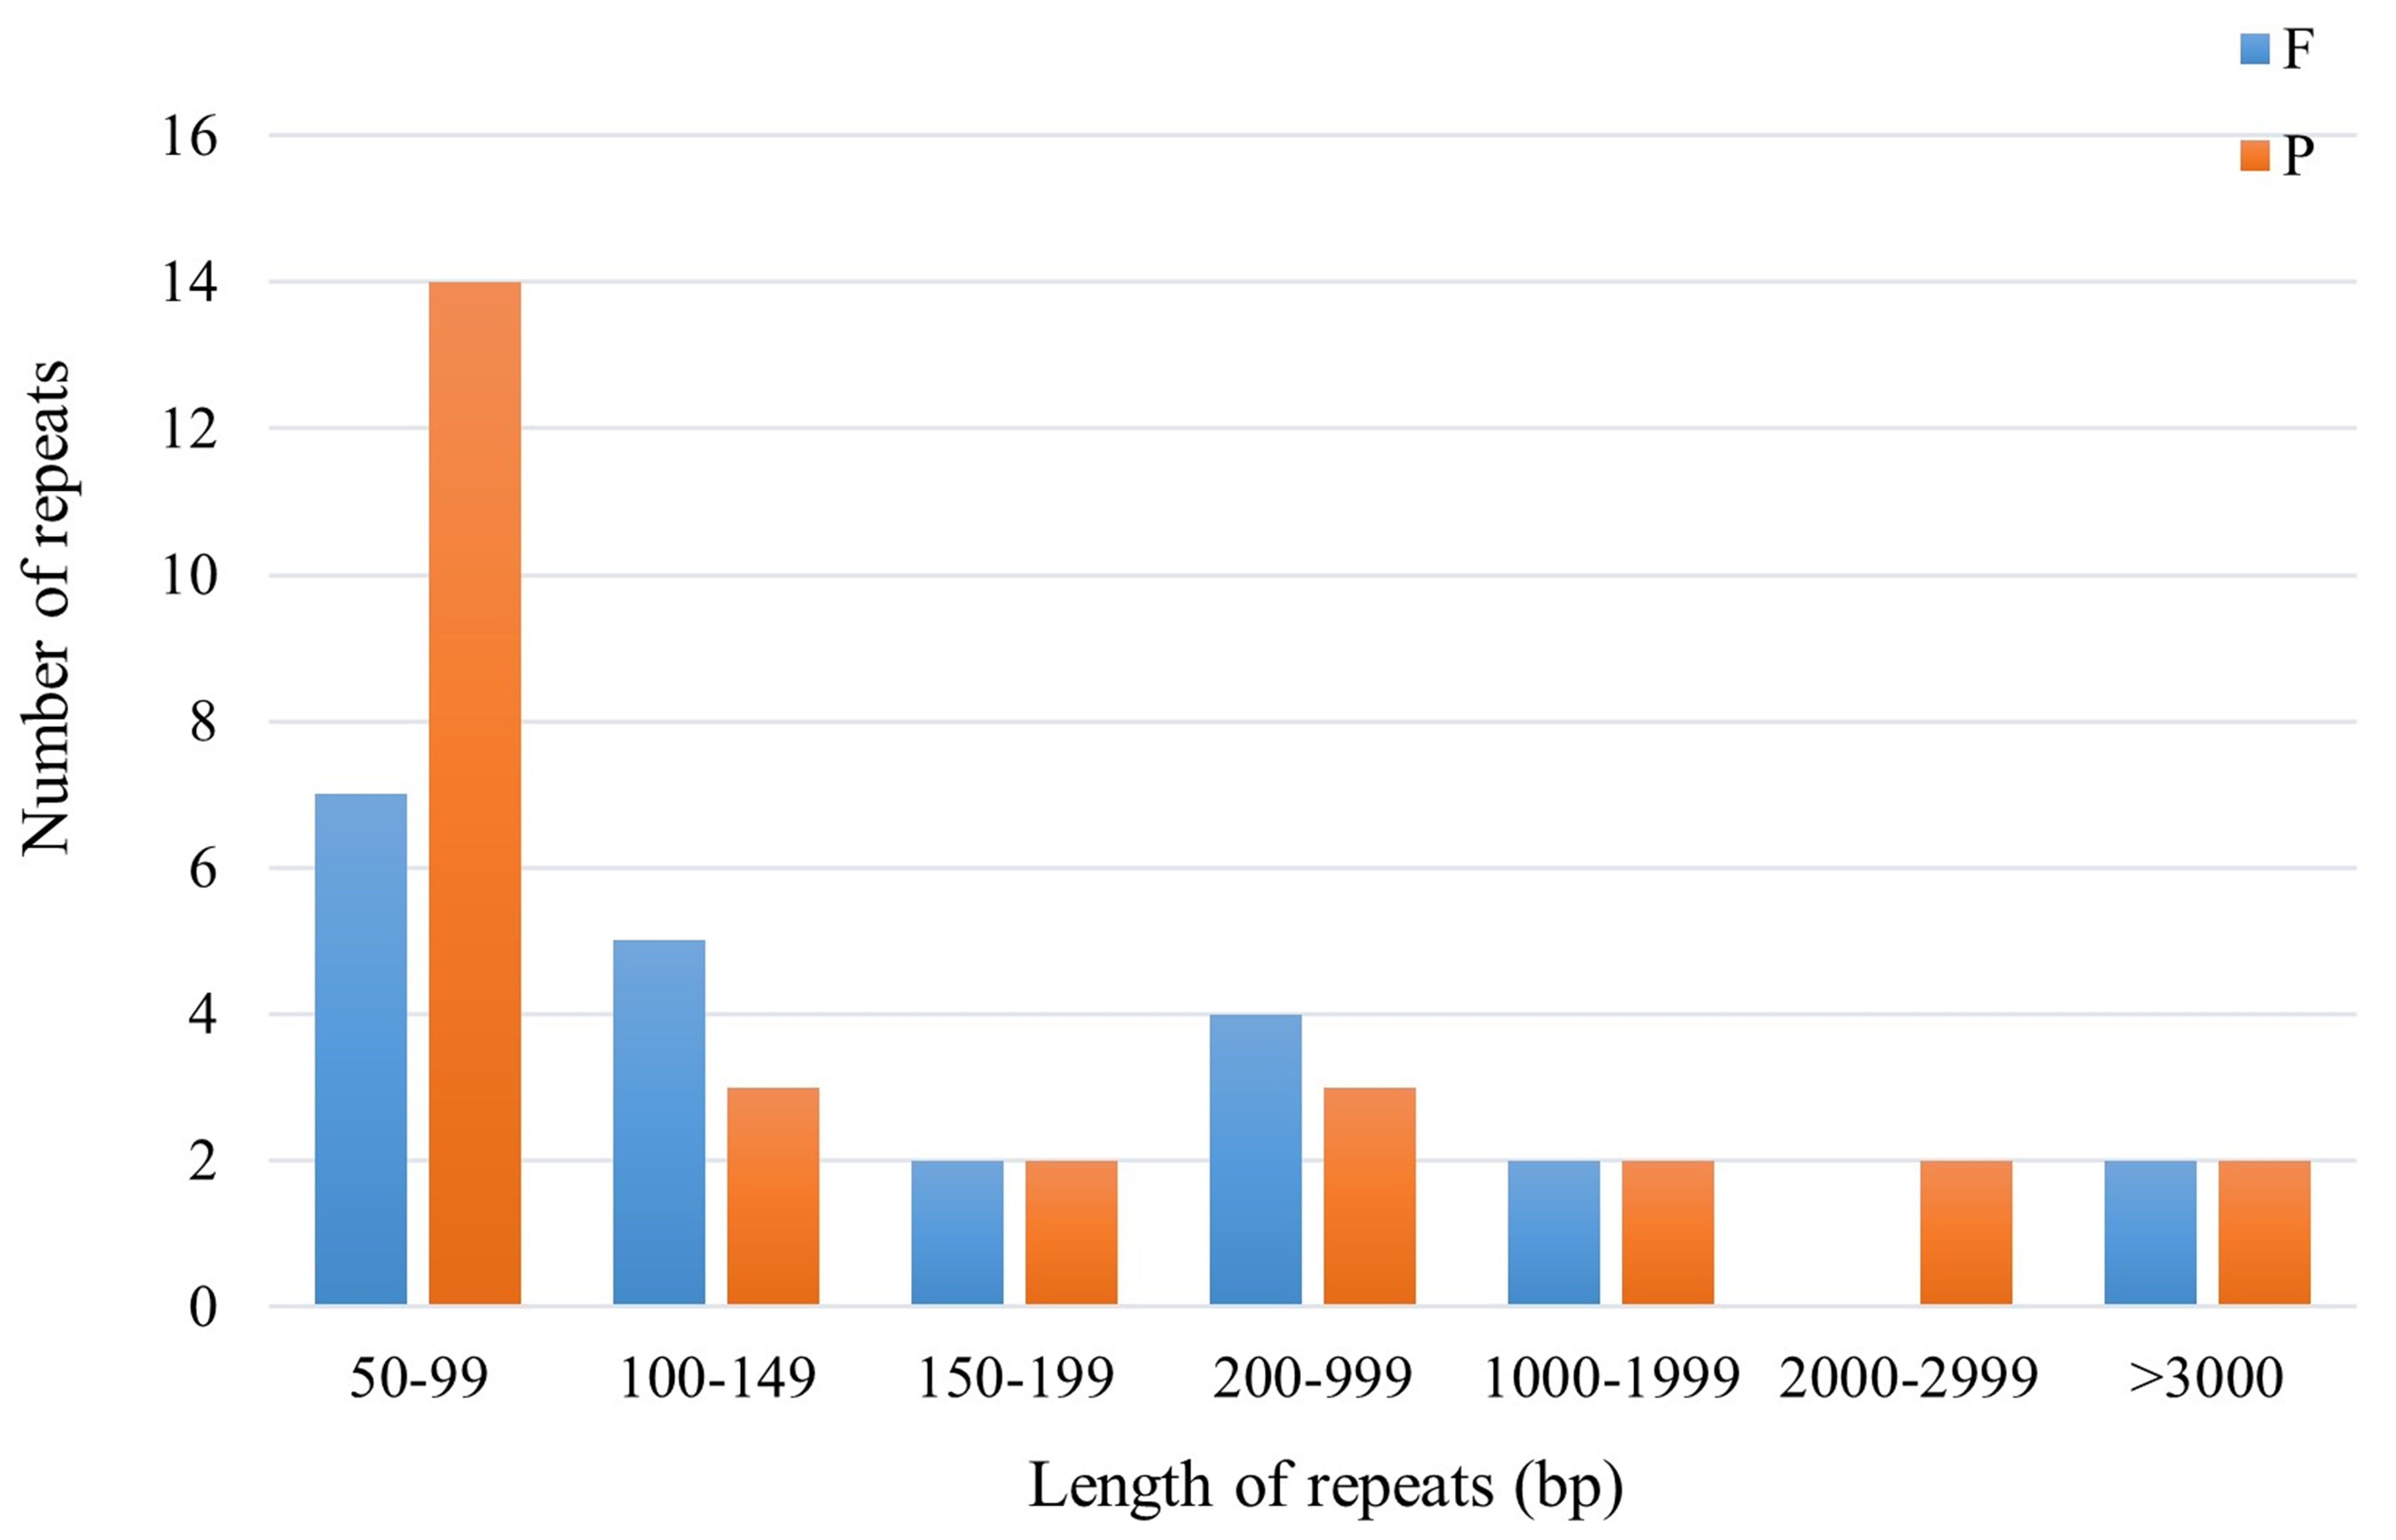 Fig. 4.
Scattered repeats of F. aubertii mt genome. Different types of repeats are represented by different colors, blue represents forward repeats and orange represents palindromic repeats. The height of the colored bar represents the number of sequences. No scattered repeats in the length range of 2000–2999 bp were found.
The prediction of RNA editing sites in the mitochondrial genome coding genes of F. aubertii resulted in a total of 367 sites in 30 genes (Fig. 5). Among them, ccmB and nad4 contained the majority of RNA editing sites, with ccmB containing most of them (33 sites), accounting for 8.99% of the total RNA editing sites. The atp8 had the fewest RNA editing sites, accounting for only 0.27% of the total number of sites. The results showed that 7.9% of hydrophobic amino acids were converted to hydrophilic amino acids, 49.86% of hydrophilic amino acids were converted into hydrophobic amino acids, and 42.24% of hydrophobic amino acids remained unchanged (Table 5). RNA editing sites were C to T conversion, and the first base of the codon accounted for 32.0% of the editing sites, whereas the second base accounted for 68.0%. Some RNA editing sites may result in the formation of stop codons, but we did not identify such phenomena in the mitochondrial genome of F. aubertii. Furthermore, the proportion of amino acid conversion to leucine after RNA editing was the largest, accounting for 46.59%.
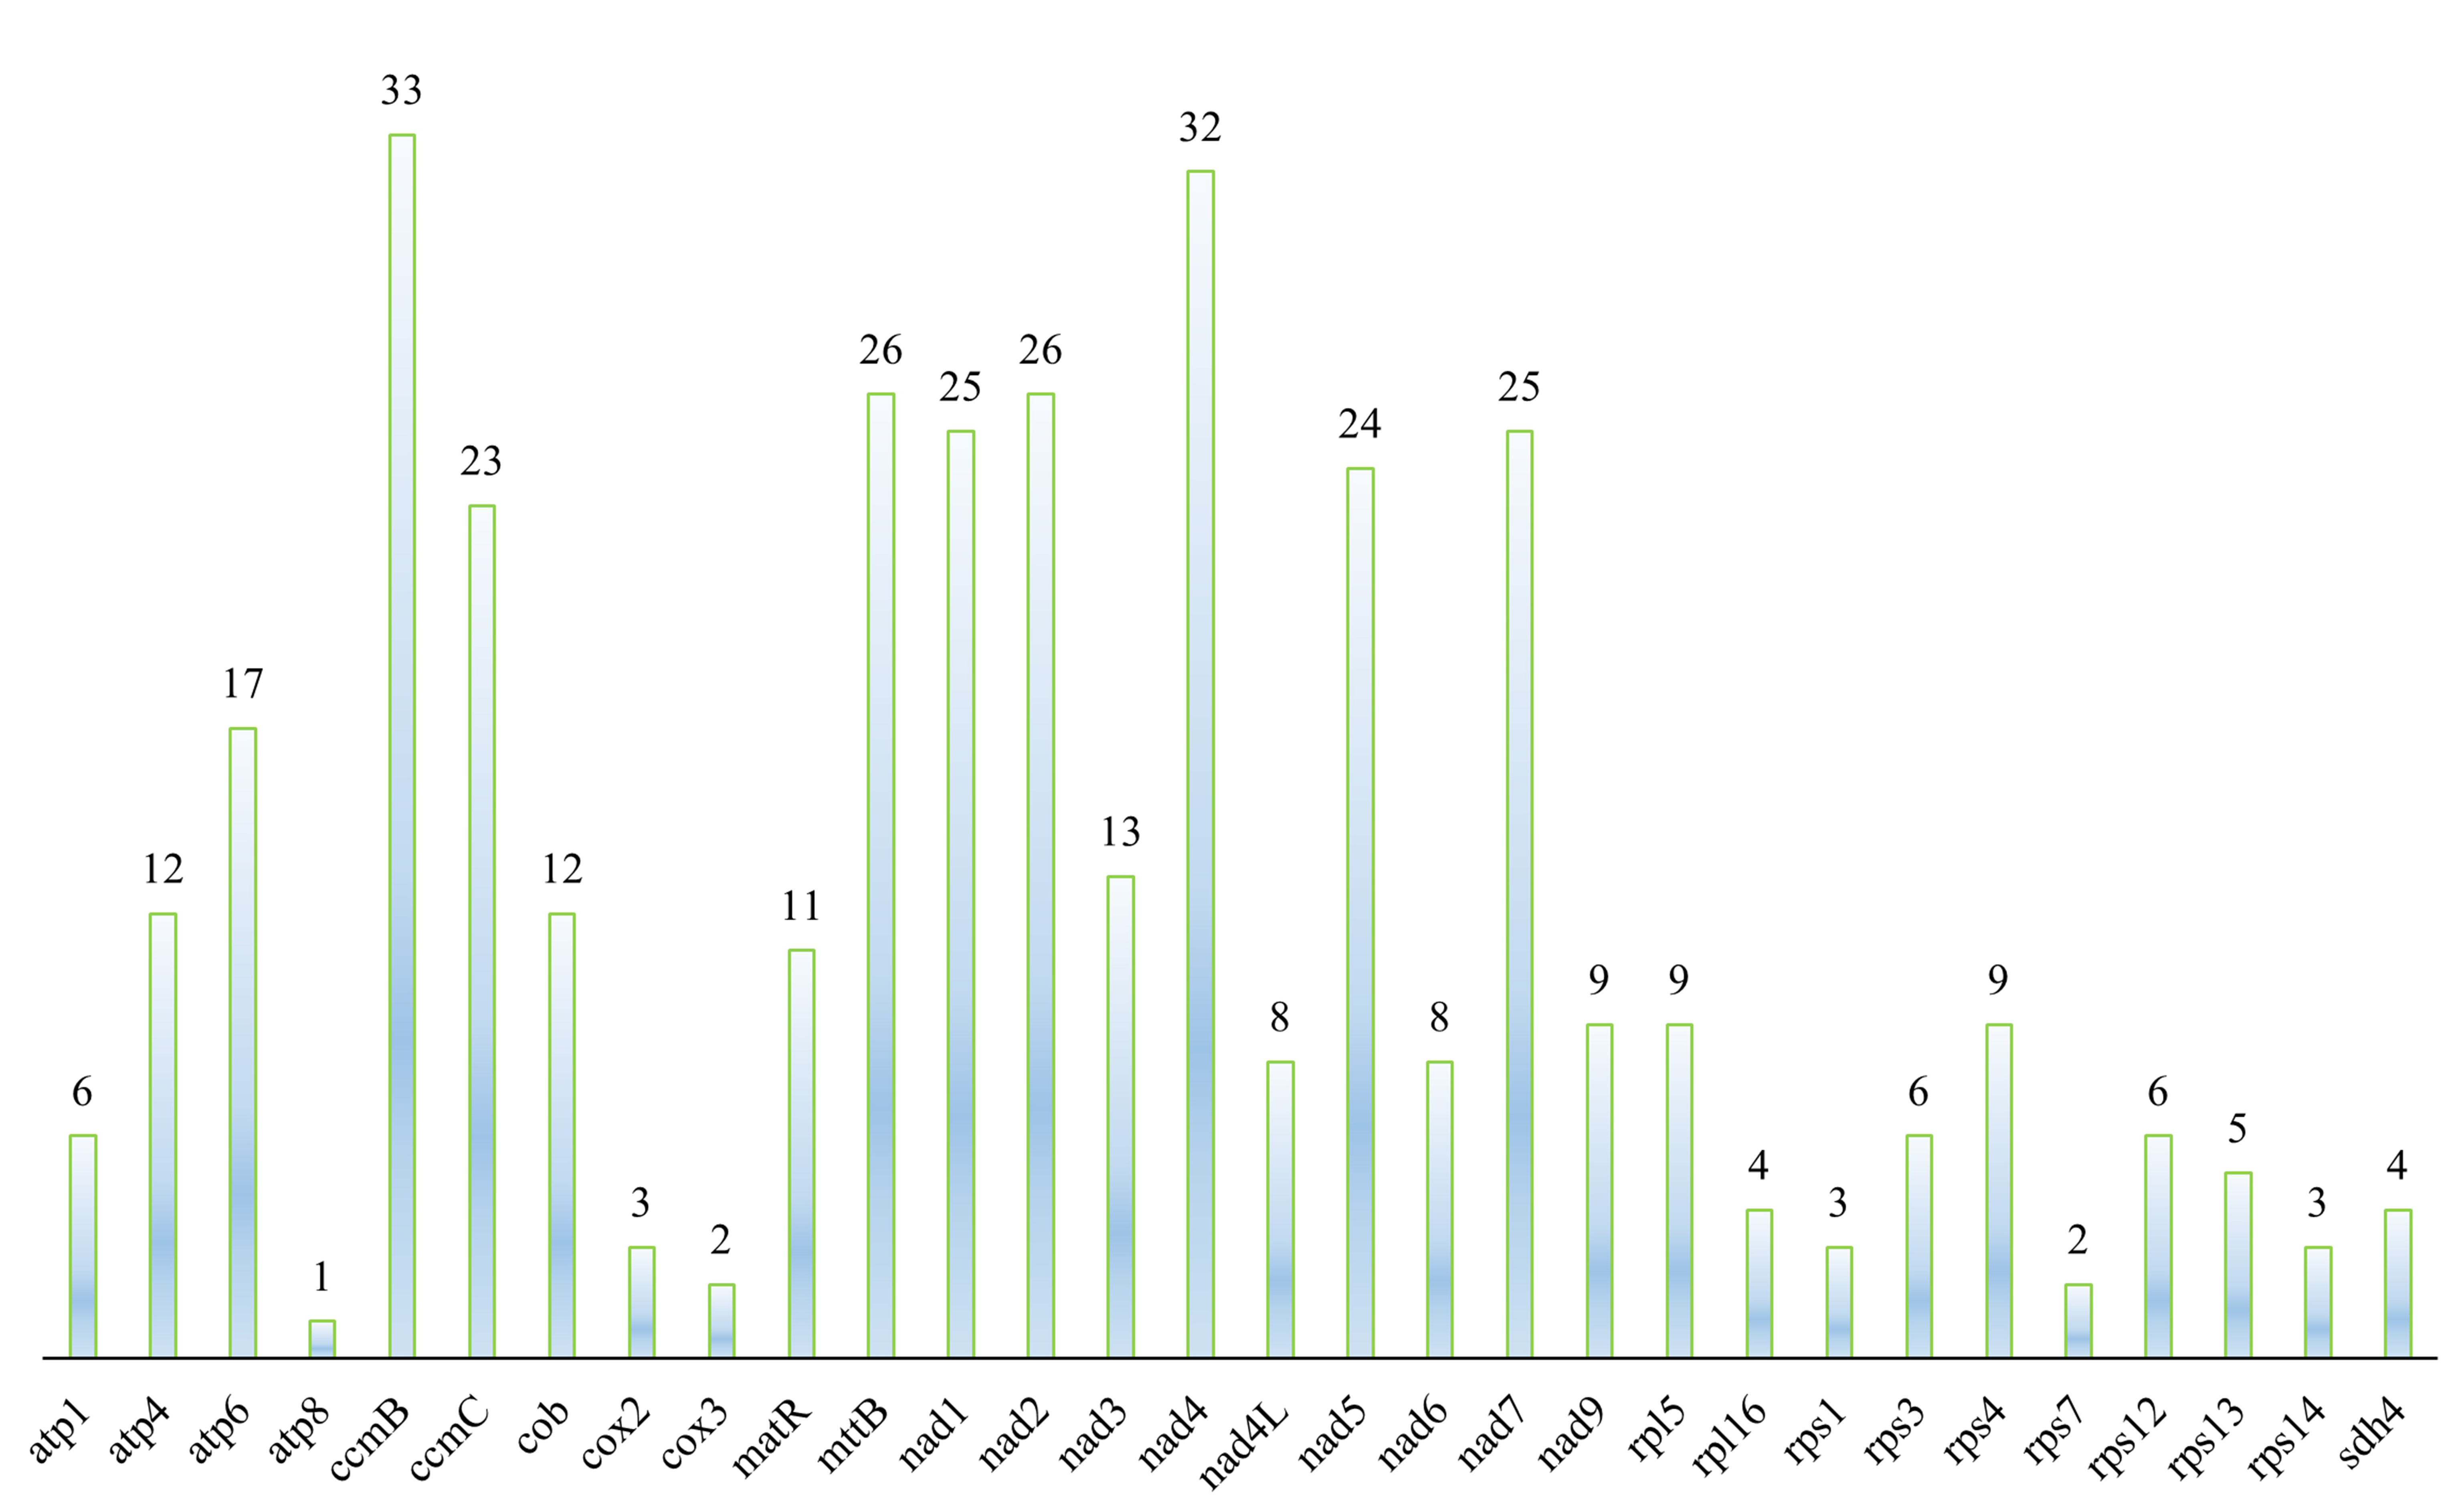 Fig. 5.
Distribution of RNA editing sites in F. aubertii mt protein-coding genes (PCGs). RNA editing sites in 30 coding genes in F. aubertii were predicted. There are no RNA editing sites in cox1, ccmFC, ccmFN, or atp9. The horizontal axis is the protein-coding gene, and the number on the top of the color bar refers to the number of predicted RNA editing sites.
| Type | RNA-editing | Number | Percentage (%) |
| Hydrophobic | CCA (P) |
31 | 28.07 |
| CCC (P) |
3 | ||
| CCG (P) |
26 | ||
| CCT (P) |
18 | ||
| CCC (P) |
6 | ||
| CCT (P) |
2 | ||
| GCT (A) |
1 | ||
| GCG (A) |
2 | ||
| GCA (A) |
2 | ||
| CTT (L) |
9 | ||
| CTC (L) |
3 | ||
| Hydrophilic | CAT (H) |
15 | 14.17 |
| CAC (H) |
6 | ||
| CGT (R) |
23 | ||
| CGC (R) |
8 | ||
| Hydrophobic-hydrophilic | CCT (P) |
14 | 7.90 |
| CCG (P) |
6 | ||
| CCC (P) |
4 | ||
| CCA (P) |
5 | ||
| Hydrophilic-hydrophobic | CGG (R) |
19 | 49.86 |
| TCT (S) |
28 | ||
| TCC (S) |
25 | ||
| TCG (S) |
37 | ||
| TCA (S) |
56 | ||
| ACT (T) |
4 | ||
| ACC (T) |
6 | ||
| ACG (T) |
8 |
The CDS of F. aubertii were analyzed to determine the GC content of each gene and calculate the average GC content (Table 6). The nad5 gene was the longest, possibly due to its introns. The GC content varied across PCGs, with matR gene having the highest GC content (51.5%) and the GC content of the nad4L being the lowest (34.65%). The AT skew average value was negative, and 13 genes had positive AT skew. Visual analysis of GC skew showed that 22 genes with positive GC skew had higher G-base content than C-base content, and 12 genes with negative GC skew and high C-base content (Fig. 6). Caryophyllales plants, including F. aubertii, had a mitochondrial genome size range of 247 Kb–509 Kb, with an average GC content of about 44% (Table 7).
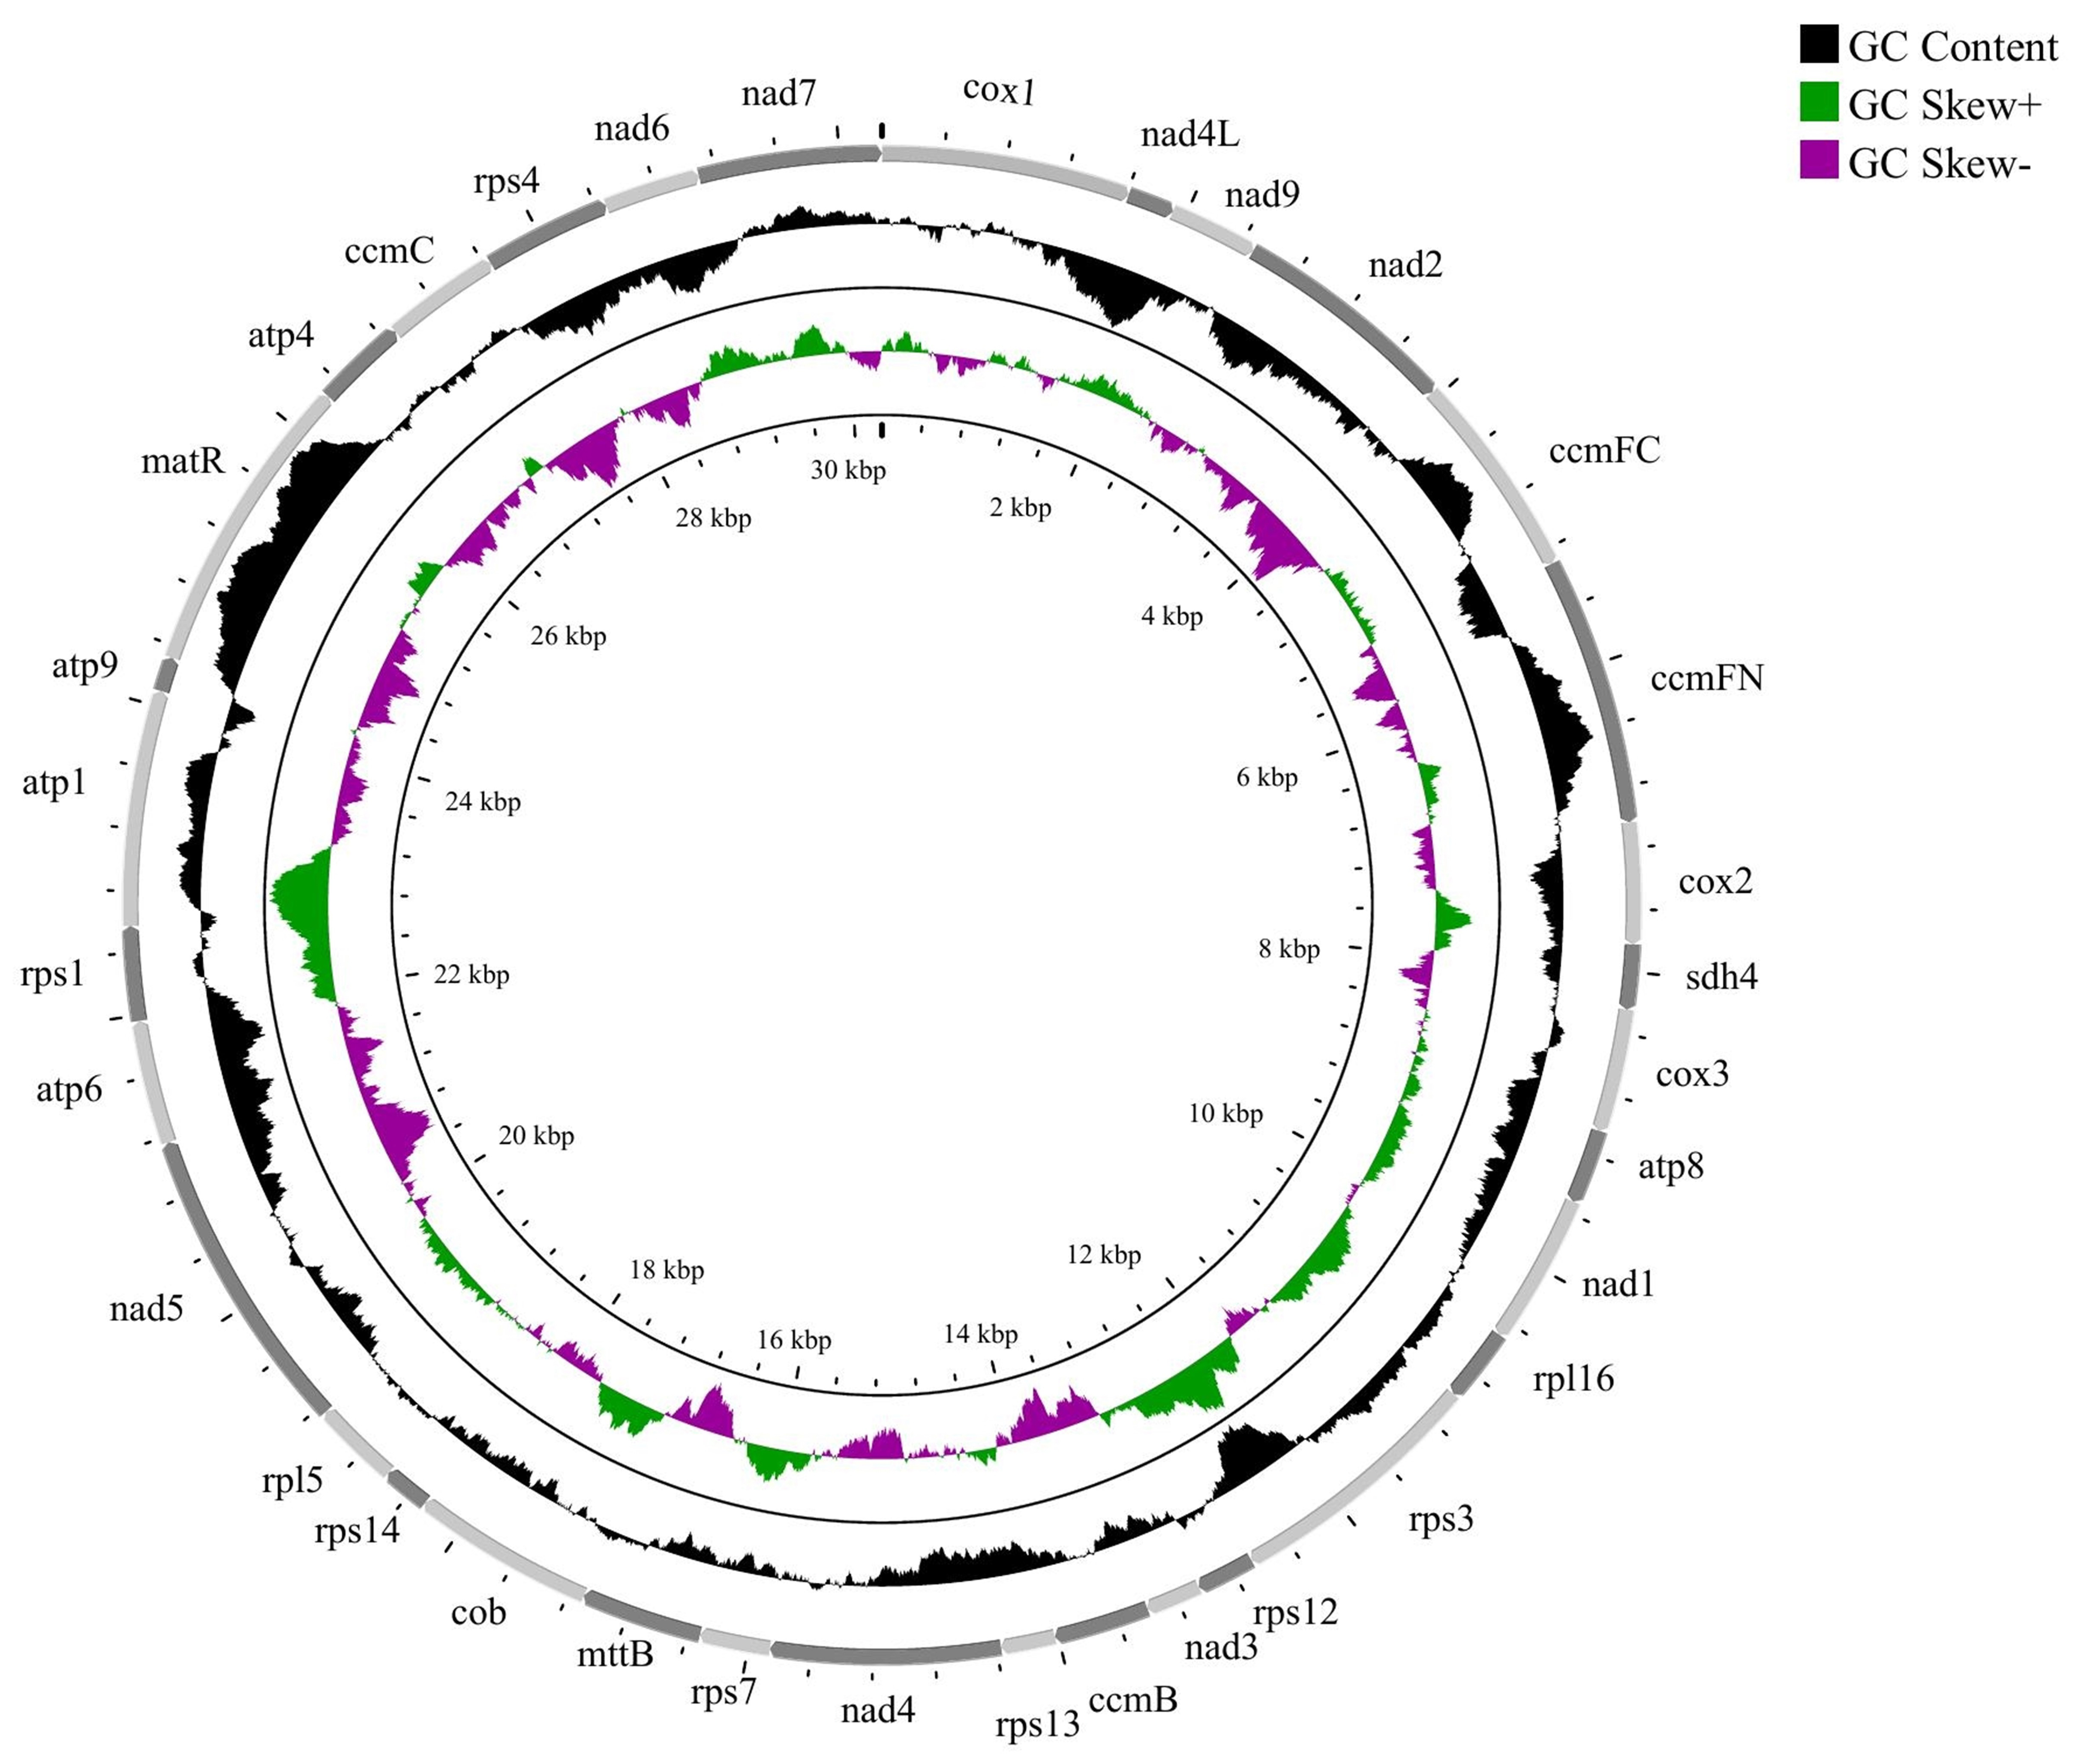 Fig. 6.
GC skew of F. aubertii mt CDS. The outermost circle represents the coding area of a gene, the innermost circle represents the variation in GC content across the genome, and the innermost circle represents the GC skew, where green represents skew+ and purple represents skew-.
| Genes | Length | GC1 | GC2 | GC3 | GC all | AT skew | GC skew |
| cox1 | 1611 | 46 | 41.15 | 36.87 | 41.34 | –0.17 | 0.02 |
| nad4L | 303 | 37.62 | 36.63 | 29.7 | 34.65 | –0.24 | 0.1 |
| nad9 | 573 | 49.74 | 40.31 | 31.41 | 40.49 | 0.01 | 0.07 |
| nad2 | 1467 | 40.9 | 42.74 | 32.72 | 38.79 | –0.21 | –0.05 |
| ccmFC | 1344 | 48.21 | 43.53 | 42.63 | 44.79 | –0.07 | 0.01 |
| ccmFN | 1740 | 49.66 | 46.55 | 40.52 | 45.57 | –0.16 | –0.01 |
| cox2 | 783 | 51.72 | 36.4 | 30.65 | 39.59 | –0.08 | 0.03 |
| sdh4 | 420 | 42.14 | 34.29 | 42.14 | 39.52 | –0.09 | –0.02 |
| cox3 | 798 | 50.75 | 41.73 | 33.08 | 41.85 | –0.26 | 0.07 |
| atp8 | 483 | 35.4 | 37.27 | 41.61 | 38.1 | –0.02 | 0.03 |
| nad1 | 978 | 53.99 | 41.1 | 28.83 | 41.31 | –0.17 | 0.03 |
| rpl16 | 480 | 49.38 | 53.12 | 31.87 | 44.79 | 0.09 | 0.18 |
| rps3 | 1686 | 41.46 | 40.57 | 40.93 | 40.98 | 0.12 | 0.11 |
| rps12 | 378 | 53.97 | 48.41 | 30.95 | 44.44 | 0.21 | 0.11 |
| nad3 | 357 | 42.02 | 42.86 | 35.29 | 40.06 | –0.3 | –0.01 |
| ccmB | 621 | 44.44 | 44.44 | 33.82 | 40.9 | –0.25 | –0.17 |
| rps13 | 351 | 49.57 | 39.32 | 26.5 | 38.46 | 0.15 | 0.14 |
| nad4 | 1488 | 44.76 | 40.73 | 35.08 | 40.19 | –0.19 | –0.03 |
| rps7 | 456 | 48.03 | 38.16 | 36.18 | 40.79 | 0.12 | 0.2 |
| mttB | 786 | 42.37 | 40.46 | 42.75 | 41.86 | –0.2 | –0.04 |
| cob | 1182 | 49.49 | 41.12 | 30.96 | 40.52 | –0.22 | 0.03 |
| rps14 | 303 | 42.57 | 46.53 | 33.66 | 40.92 | –0.02 | 0.08 |
| rpl5 | 561 | 50.27 | 37.97 | 40.64 | 42.96 | 0.1 | 0.02 |
| nad5 | 2013 | 43.37 | 43.07 | 33.68 | 40.04 | –0.23 | –0.01 |
| atp6 | 801 | 44.19 | 35.21 | 30.34 | 36.58 | –0.18 | –0.06 |
| rps1 | 612 | 44.61 | 39.71 | 42.65 | 42.32 | 0.06 | 0.14 |
| atp1 | 1524 | 57.28 | 41.54 | 33.66 | 44.16 | 0.06 | 0.07 |
| atp9 | 225 | 48 | 42.67 | 37.33 | 42.67 | –0.22 | 0.08 |
| matR | 1965 | 52.67 | 44.43 | 57.4 | 51.5 | 0.13 | –0.03 |
| atp4 | 597 | 47.24 | 41.71 | 36.18 | 41.71 | 0.02 | 0.03 |
| ccmC | 753 | 46.22 | 44.62 | 34.26 | 41.7 | –0.21 | –0.1 |
| rps4 | 828 | 41.3 | 38.77 | 34.78 | 38.29 | 0.14 | –0.05 |
| nad6 | 624 | 41.83 | 37.02 | 35.58 | 38.14 | –0.15 | 0.08 |
| nad7 | 1185 | 55.7 | 43.8 | 32.66 | 44.05 | 0.02 | 0.05 |
| All | 30,276 | 47.24 | 41.78 | 36.9 | 41.97 | –0.08 | 0.02 |
| Species | Accession number | Category | Genome size | GC |
| Fallopia aubertii | MW664926.1 | Polygonaceae | 350,156 | 44.73 |
| Nepenthes |
MH798871.1 | Nepenthaceae | 520,764 | 44.17 |
| Alternanthera philoxeroides | MN166292.1 | Amaranthaceae | 283,258 | 44.07 |
| Spinacia oleracea | NC_035618.1 | Amaranthaceae | 329,613 | 43.41 |
| Beta macrocarpa | NC_015994.1 | Amaranthaceae | 385,220 | 43.89 |
| Beta vulgaris | NC_015099.1 | Amaranthaceae | 364,950 | 43.91 |
| Chenopodium quinoa | MK182703.1 | Amaranthaceae | 315,003 | 43.83 |
| Suaeda glauca | MW561632.1 | Amaranthaceae | 474,330 | 44.07 |
| Bougainvillea spectabilis | MW167296.1 | Nyctaginaceae | 343,746 | 44.06 |
| Mirabilis jalapa | NC_056991.1 | Nyctaginaceae | 267,334 | 44.75 |
| Mirabilis himalaica | NC_048974.1 | Nyctaginaceae | 346,363 | 44.65 |
| Agrostemma githago | MW553037.1 | Caryophyllaceae | 262,903 | 44.66 |
| Silene latifolia | HM562727.1 | Caryophyllaceae | 253,413 | 42.56 |
| Pereskia aculeata | ON496936.1 | Cactaceae | 515,187 | 44.05 |
| Sesuvium portulacastrum | MN683736.1 | Aizoaceae | 392,221 | 44.16 |
| Tetragonia tetragonoides | MW971440.1 | Aizoaceae | 347,227 | 43.84 |
Comparing the Ka and Ks in homologous genes during evolution is essential for the study of gene functions and evolutionary relationships across species, as well as for exploring issues such as adaptation and genetic diversity of plant communities. The Ka/Ks ratios of 34 PCGs in the mitochondrial genomes of F. aubertii, N. ventrata, A. githago, and T. tetragonoides were analyzed (Fig. 7). Among these 34 genes, the rsp16 gene had a zero Ka/Ks value. Overall, four of the 34 genes had Ka/Ks values greater than one, indicating that these four genes were under positive selective pressure during evolution, which included nad4. rps13, rps1 and ccmFN. The remaining genes had values of Ka/Ks less than 1, which implies purifying selection and relative conservation.
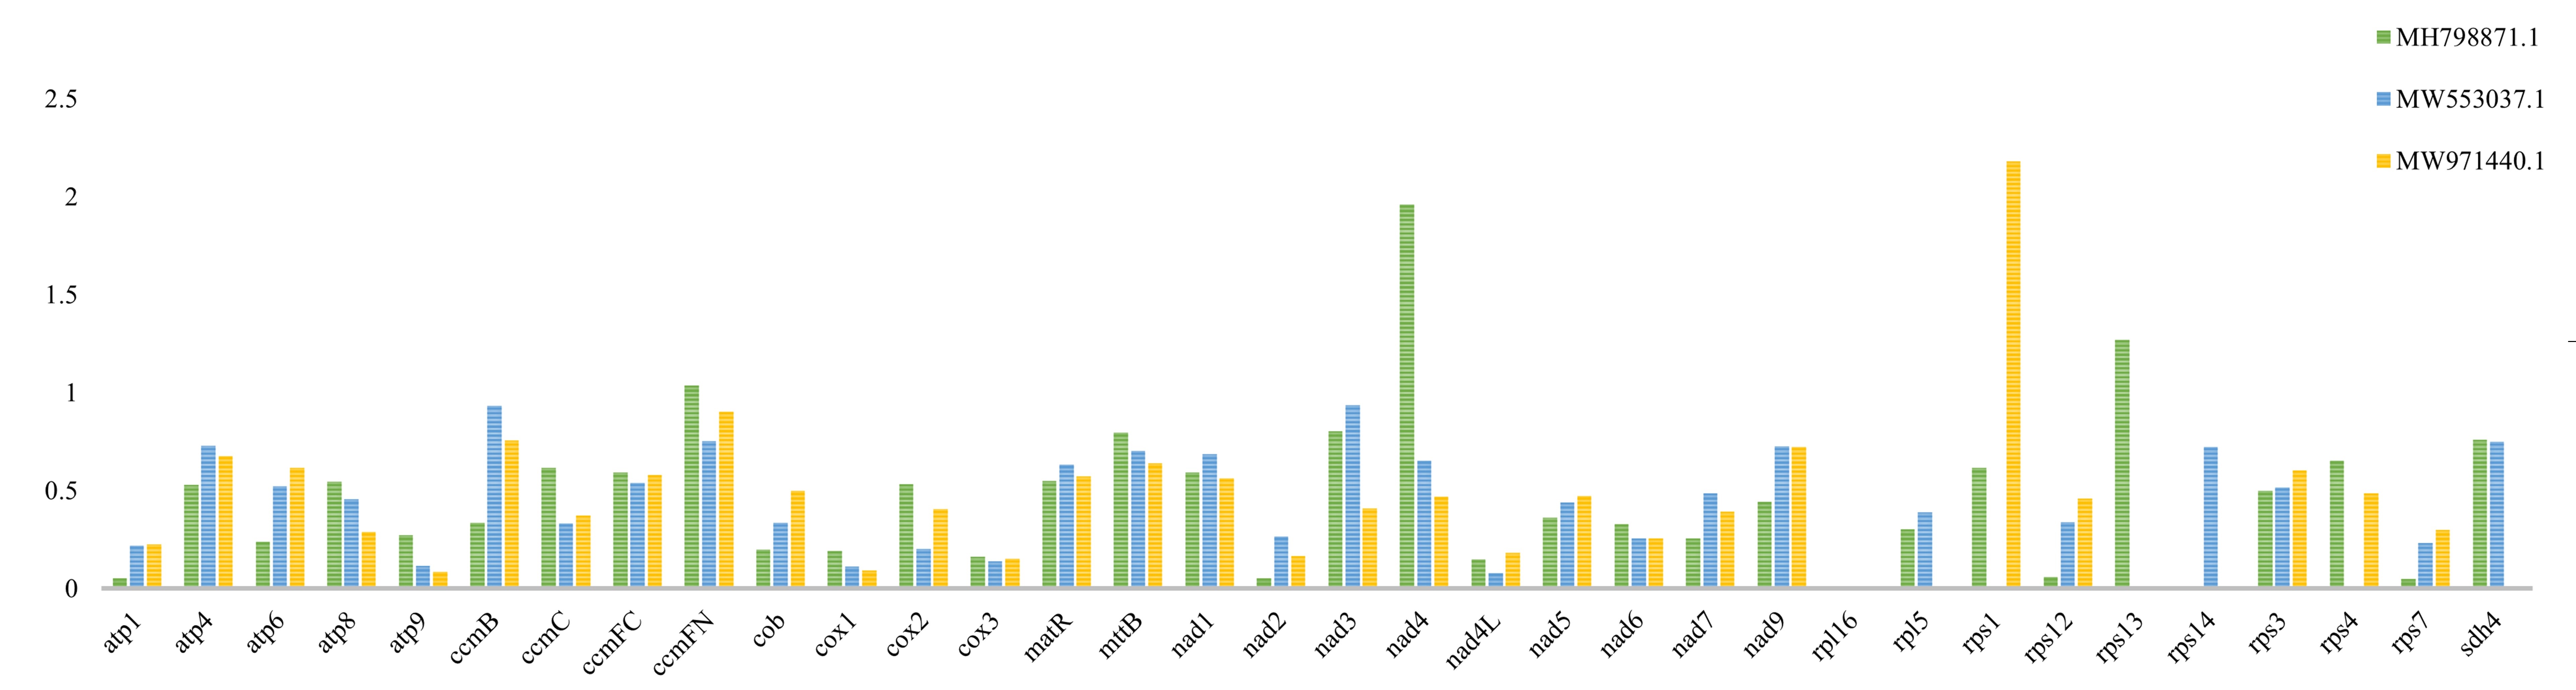 Fig. 7.
Ka/Ks values of the PCGs. The mitochondrial protein-encoding genes of F. aubertii were compared with N. ventrata (MH798871.1), A. githago (MW553037.1), and T. tetragonoides (MW971440.1), respectively, for Ka/Ks analysis. The three closely related species contain protein-coding genes different from those in F. aubertii, so the Ka/Ks values of some genes in the figure are 0.
To better understand the phylogenetic position of F. aubertii, 16 plant mitogenomes from the NCBI database were downloaded (Table 7). The phylogenetic tree showed that most branch nodes had high support values above 99%, and species from the same family were grouped together, indicating high result reliability (Fig. 8). The phylogenetic tree also strongly demonstrated that F. aubertii and the N. ventrata clustered into one clade with a 92% bootstrap value (Fig. 7). Caryophyllales plants were further divided into two subgroups [36, 37]. The F. aubertii and the N. ventrata were non-core taxa of Caryophyllales, and other species belonged to the core group of Caryophyllales.
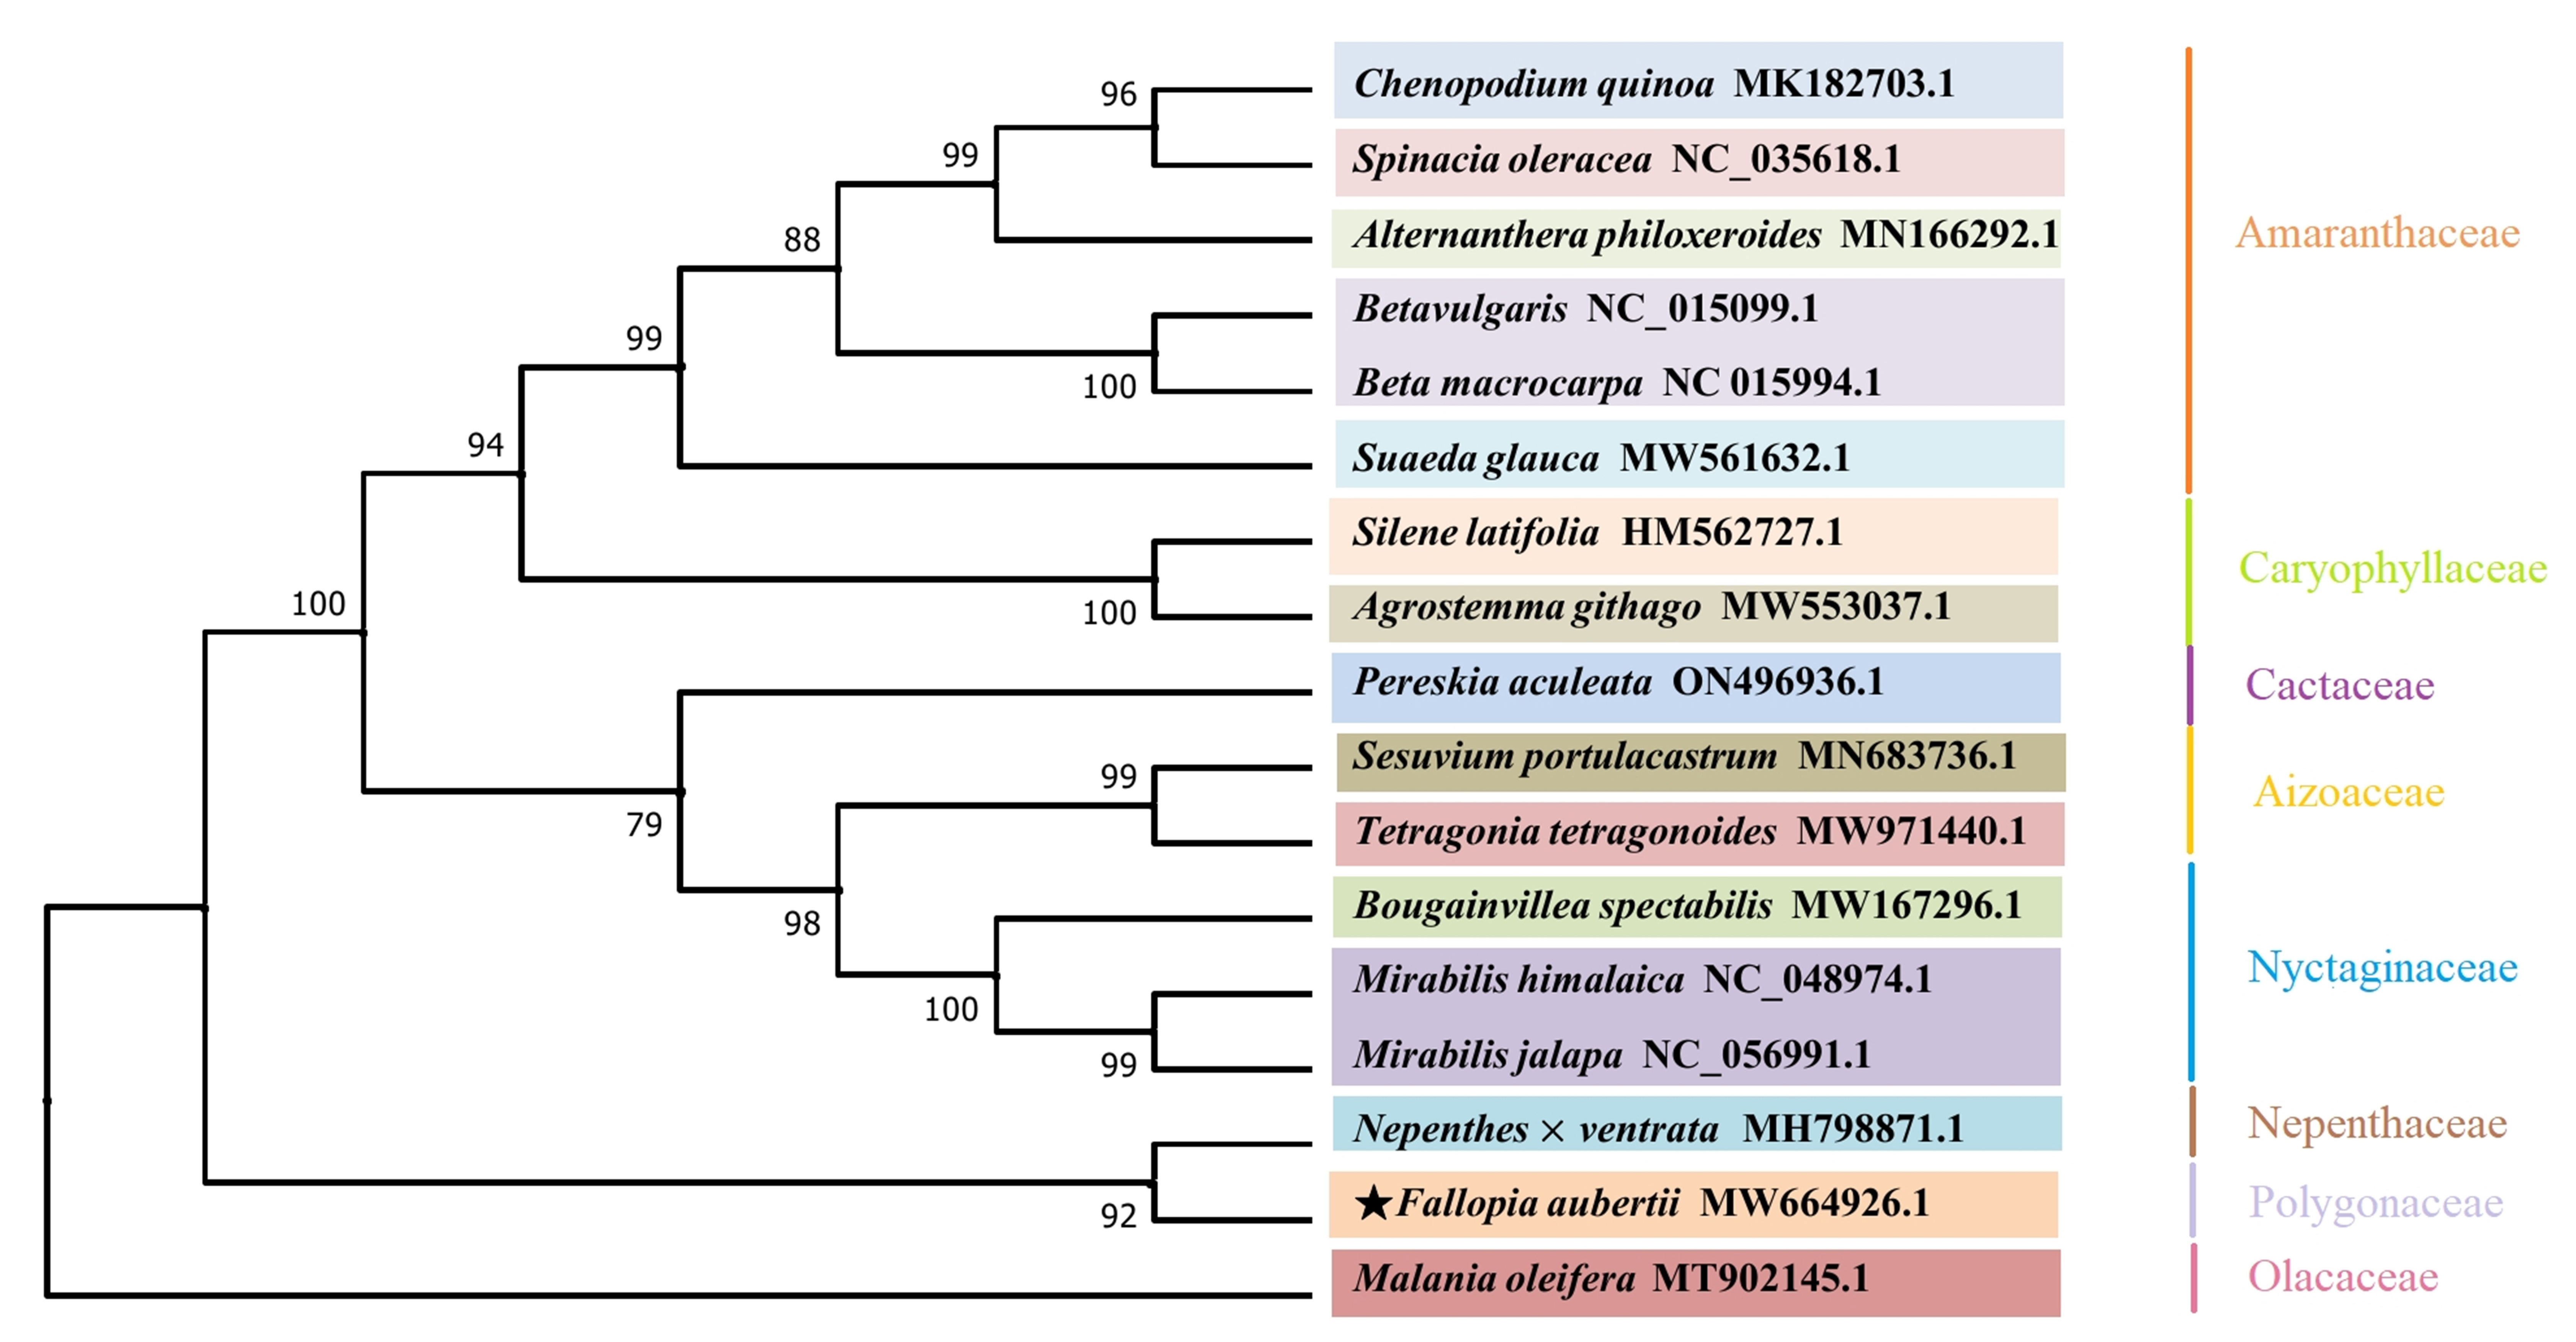 Fig. 8.
A phylogenetic tree of 17 species. Reconstruction of phylogenetic relationships was based on the shared CDS using the maximum likelihood model with M. oleifera (Olacaceae) as an outgroup. F. aubertii is indicated using the star icon. The plants grouped together are marked according to the family.
By analyzing the homology of chloroplast and mitochondrial genomes, we can deeply explore their evolutionary history and their roles in evolution. Fifty-eight homologous fragments were observed in the organellar genome of F. aubertii, with a total length of 47,757 bp, accounting for 29.2% and 13.6% of the chloroplast and mitochondrial genomes, respectively. There were 14 homologous genes in the mitochondrial genome, including trnW-CCA, trnV-GAC, trnS-GGA, trnR-ACG, trnN-GUU, trnM-CAU, trnL-CAA, trnI-GAU, trnH-GUG, trnD-GUC, trnA-UGC, rrn26, rrn18, and ccmC(Table 8).
| Sequence | Chloroplast genome | Mitochondrial genome | Identity | ||
| Gene | Sequence position (bp) | Gene | Sequence position (bp) | ||
| 1 | trnR-ACG, rrn5, rrn4.5, rrn23, trnA-UGC, trnI-GAU, rrn16, trnV-GAC, rps7 | 138,146–149,356 | trnR-ACG, trnA-UGC, trnI-GAU, trnV-GAC | 275,594–286,804 | 100 |
| 2 | rps7, trnV-GAC, rrn16, trnI-GAU, trnA-UGC, rrn23, rrn4.5, rrn5, trnR-ACG | 100,317–111,527 | trnR-ACG, trnA-UGC, trnI-GAU, trnV-GAC | 286,804–275,594 | 100 |
| 3 | ycf2, trnL-CAA, ndhB | 90,089–98,017 | trnL-CAA | 286,794–294,720 | 99 |
| 4 | trnL-CAA, ycf2, ndhB | 151,656–159,584 | trnL-CAA | 294,720–286,794 | 99 |
| 5 | rps19, rpl2, rpl23, trnM-CAU | 87,280–89,471 | trnM-CAU, ccmC | 303,457–305,648 | 100 |
| 6 | trnI-CAU, rpl23, rpl2 | 160,202–162,393 | trnM-CAU, ccmC | 305,648–303,457 | 100 |
| 7 | psbA | 206–937 | / | 15,690–14,968 | 94 |
| 8 | trnH-GUG | 1–217 | trnH-GUG | 303,456–303,240 | 100 |
| 9 | rbcL | 58,741–58,955 | / | 241,189–240,975 | 97 |
| 10 | trnW-CCA | 68,795–68,976 | trnW-CCA | 44,932–44,752 | 90 |
| 11 | rrn23 | 139,746–139,869 | / | 109,167–109,290 | 95 |
| 12 | rrn23 | 109,804–109,927 | / | 109,290–109,167 | 95 |
| 13 | trnD-GUC | 31,665–31,802 | trnD-GUC | 171,543–171,407 | 92 |
| 14 | trnS-GGA | 47,519–47,611 | trnS-GGA | 261,692–261,784 | 96 |
| 15 | trnH-GUG | 2–78 | trnH-GUG | 257,385–257,461 | 100 |
| 16 | rrn16 | 104,286–104,394 | rrn18 | 13,207–13,315 | 92 |
| 17 | rrn16 | 145,279–145,387 | rrn18 | 13,315–13,207 | 92 |
| 18 | petG | 68,653–68,737 | / | 45,085–45,001 | 95 |
| 19 | rrn23 | 139,686–139,933 | rrn26 | 92,350–92,597 | 81 |
| 20 | rrn23 | 109,740–109,987 | rrn27 | 92,597–92,350 | 81 |
| 21 | trnN-GUU | 111,672–111,750 | trnN-GUU | 57,454–57,532 | 96 |
| 22 | trnN-GUU | 137,923–138,001 | trnN-GUU | 57,532–574,54 | 96 |
| 23 | / | 205–263 | / | 303,197–303,255 | 100 |
| 24 | trnM-CAU | 54,431–54,505 | trnM-CAU | 200,075–200,149 | 94 |
| 25 | rrn16 | 103,420–103,478 | / | 2162–2220 | 100 |
| 26 | rrn16 | 146,195–146,253 | / | 2220–2162 | 100 |
| 27 | rrn16 | 103,730–103,815 | rrn18 | 12,655–12,740 | 91 |
| 28 | rrn16 | 145,858–145,943 | rrn18 | 12,740–12,655 | 91 |
| 29 | rrn23 | 140,317–140,410 | rrn26 | 92,965–93,058 | 87 |
| 30 | rrn23 | 109,263–109,356 | rrn26 | 93,058–92,965 | 87 |
| 31 | psbD, psbC | 35,865–35,965 | / | 256,992–257,092 | 86 |
| 32 | trnP-UGG | 69,203–69,251 | / | 44,659–44,611 | 97 |
| 33 | ycf3 | 46,462–46,537 | / | 260,822–260,897 | 88 |
| 34 | ndhA | 128,336–128,377 | / | 285,575–285,534 | 97 |
| 35 | rrn16 | 104,701–104,818 | rrn18 | 13,950–14,066 | 83 |
| 36 | rrn16 | 144,855–144,972 | rrn18 | 14,066–13,950 | 83 |
| 37 | rrn16 | 104,580–104,649 | rrn18 | 13,830–13,899 | 88 |
| 38 | rrn16 | 145,024–145,093 | rrn18 | 13,899–13,830 | 88 |
| 39 | rrn23 | 140,568–140,612 | / | 93,214–93,258 | 95 |
| 40 | rrn23 | 109,061–109,105 | / | 93,258–93,214 | 95 |
| 41 | rpl2 | 87,768–87,803 | / | 101,974–102,009 | 100 |
| 42 | rpl2 | 161,870–161,905 | / | 102,009–101,974 | 100 |
| 43 | rrn16 | 103,910–103,981 | rrn18 | 12,837–12,908 | 87 |
| 44 | rrn16 | 145,692–145,763 | rrn18 | 12,908–12,837 | 87 |
| 45 | ycf3 | 45,725–45,763 | / | 285,573–285,535 | 97 |
| 46 | / | 46,265–46,315 | / | 260,632–260,682 | 92 |
| 47 | rrn16 | 104,451–104,525 | rrn18 | 13,371–13,445 | 86 |
| 48 | rrn16 | 145,148–145,222 | rrn18 | 13,445–13,371 | 86 |
| 49 | psbA | 248–285 | / | 303,209–303,272 | 97 |
| 50 | / | 68,036–68,103 | / | 19,391–19,458 | 86 |
| 51 | rrn23 | 141,817–141,862 | rrn26 | 94,788–94,833 | 91 |
| 52 | rrn23 | 107,811–107,856 | rrn26 | 94,833–94,788 | 91 |
| 53 | rrn16 | 103,467–103,523 | rrn18 | 12,351–12,407 | 87 |
| 54 | rrn16 | 146,150–146,206 | rrn18 | 12,407–12,351 | 87 |
| 55 | trnS-GCU | 8666–8693 | trnS-GGA | 261,781–261,754 | 100 |
| 56 | rpoC1 | 22,600–22,627 | / | 110,671–110,698 | 100 |
| 57 | rrn16 | 104,889–104,920 | rrn18 | 14,184–14,215 | 96 |
| 58 | rrn16 | 144,753–144,784 | rrn18 | 14,215–14,184 | 96 |
Note: “/” indicates no gene at the locus.
Analyzing mitochondrial genes can lead to the optimization of plant growth characteristics at the genetic level, thus increasing yield and enhancing plant adaptation to the environment, which is essential for agricultural production and food safety [38, 39, 40, 41]. The study of genome size and GC content is crucial for understanding plant evolution and adaptability, as they greatly influence traits such as morphology, physiology, and biochemistry of plants [42]. The size of angiosperm mitochondrial genomes is usually 200–800 Kb [43], and the entire length of F. aubertii mitochondrial genome is 350,156 bp with a GC content of 44.73%, which is similar to other Caryophyllales plants [44, 45]. Research on genome size and GC content can provide important insights into plants’ genetic characteristics and biological functions [46] and form the scientific basis for applications such as plant breeding and biotechnology [47, 48].
Repeat sequences are essential for gene expression and regulation [49]. They are the main driving force for gene diversification and evolution [50]—the present study identified STRs, long tandem repeats, and scattered repeats. A total of 77 STR loci, five long tandem repeats, and 50 scattered repeat sequences were detected by analyzing the F. aubertii mitochondrial genome repeats. Repetitive sequences play an important role in the processes of insertion, deletion, and other rearrangements that may occur within the mitochondrial genome [51]. Mitochondrial repetitive sequences have been widely used in plant genetic improvement and molecular marker-assisted breeding [52, 53]. Analysis of the mitochondrial repeat sequences of F. aubertii has helped us to gain insights into the organelle sequences, genetic diversity, and other relevant features of the plant, which are essential for species conservation and germplasm identification [54].
RNA editing is a type of genetic variation event in RNA post-transcriptional modification, which is crucial for maintaining the stability of gene expression [55, 56]. Compared with DNA editing, RNA editing can respond more quickly to external stimuli or environmental changes, thereby adapting to the needs of survivors [57]. The diversity and complexity of RNA function, as well as its impact on gene expression and regulation, can be better understood by exploring the location and type of RNA editing, leading to further study into RNA function and regulatory mechanisms [58]. In this study, the RNA editing sites in the mitochondrial genome of F. aubertii were mainly C to T conversions, with the second base of the codon being the most frequently changed. The proportion of amino acid conversion to leucine was the largest, accounting for 46.59%. Leucine is the main amino acid produced after editing, similar to RNA editing results in higher angiosperms [59].
To understand the various selection pressures that took place during the
evolution of the gene and to determine whether a gene has undergone rapid
evolution, Ka/Ks analysis can be used [60]. In addition to predicting
protein structure and function, Ka/Ks analysis can be used to research
the gene families’ functional diversity and evolutionary pathways [61]. When the
value of Ka/Ks
In this study, a maximum likelihood phylogenetic tree was constructed based on the shared mitochondrial CDSs. The F. aubertii and the N. ventrata formed a sister clade indicating a closer relationship between them, and agreed with previous research [62, 65]. In the evolution of the chloroplast genome system in Caryophyllales, Polygonaceae plants are also closely related to Nepenthaceae plants [66, 67, 68]. Our study provides a scientific basis for further studies on the phylogeny of the Caryophyllales.
There is a horizontal transfer of genes between organelle genomes [69]. We made a comparison of the mitochondrial and chloroplast genomes of F. aubertii. Some genes were found to be similar, and these genes were highly homologous. Between the chloroplast and mitochondrial genomes of F. aubertii, there were 58 homologous segments and 14 homologous genes, including 11 tRNAs, two ribosomal protein genes, and a gene for cytochrome c biogenesis (ccmC). In angiosperms, tRNA genes are frequently transferred from the chloroplast genome to the mitochondrial genome [70, 71]. The homology of chloroplast and mitochondrial genomes is an important research direction in biology and evolution. By studying the functional activity of migrating genes, we have gained a greater understanding of species evolution [72].
In this study, we provided a comprehensive analysis of the mitochondrial genome
of F. aubertii. The genome was found to have a circular structure with a
length of 350,156 bp and a GC content of 44.73%. The genome contains 64 genes,
including 34 protein-coding genes, three rRNAs, and 27 tRNAs. Analyses of repeat
sequences revealed the presence of short tandem repeats, long tandem repeats, and
scattered repeats in the mitochondrial genome of F. aubertii. RNA editing sites
were predicted, and the majority of editing events involved the conversion of C
to T, with leucine being the most frequently converted amino acid. Analysis of
the Ka/Ks ratios indicated that most mitochondrial genes in F. aubertii
have undergone negative selection, whereas four genes (rps1,
nad4, rps13, and ccmFN) showed evidence of positive
selection. Phylogenetic analysis revealed that F. aubertii and
Nepenthes
This study provides valuable information on the mitochondrial genome of F. aubertii and serves as a reference for future molecular studies and the exploitation of genetic resources in this species. The findings contribute to the identification and improvement of valuable plant traits and highlight the significance of mitochondrial genomes in plant evolution and adaptation.
The datasets used and/or analyzed during the current study can be obtained from the corresponding authors upon reasonable request. The raw data for the mitochondrial genomes sequencing is available on the website https://www.ncbi.nlm.nih.gov/sra/ under the reference number SRX10859887. Additionally, the mitochondrial genome itself is available on the website https://www.ncbi.nlm.nih.gov/genbank/ under the reference number MW167296.
XZ performed the research, analyzed the data, and wrote the manuscript; JLW and YCL conceptualized and designed the study and reviewed the manuscript. All authors contributed to editorial changes in the manuscript. All authors read and approved the final manuscript. All authors have participated sufficiently in the work and agreed to be accountable for all aspects of the work.
Not applicable.
Not applicable.
This research was funded by Natural Science Foundation of Qinghai Province Science and Technology Department (Grant No. 2019-ZJ-915) and Foundation of Qinghai Minzu University (Grant No. 2022-JYQN-002, 2021XJG17).
The authors declare no conflict of interest.
Publisher’s Note: IMR Press stays neutral with regard to jurisdictional claims in published maps and institutional affiliations.