


 , Pengcheng Xi 2,3, Alexander MacLean 2, Adrian Florea 4, Stéphane Tremblay 3, Sonny Kohli 5, Alexander Wong 2,6
1 Digital Technologies Research Centre, National Research Council Canada, Montreal, QC H3T 2B2, Canada
2 Department of Systems Design Engineering, University of Waterloo, Waterloo, ON N2L 3G1, Canada
3 Digital Technologies Research Centre, National Research Council Canada, Ottawa, ON K1K 2E1, Canada
4 Department of Emergency Medicine, McGill University, Montreal, QC H4A 3J1, Canada
5 Oakville Trafalgar Memorial Hospital, McMaster University, Oakville, ON L6M 0L8, Canada
6 Waterloo Artificial Intelligence Institute, Waterloo, ON N2L 3G1, Canada
Academic Editor: Xudong Huang
Abstract
Background: The Coronavirus Disease 2019 (COVID-19) pandemic continues to have a devastating effect on the health and well-being of the global population. Apart from the global health crises, the pandemic has also caused significant economic and financial difficulties and socio-physiological implications. Effective screening, triage, treatment planning, and prognostication of outcome play a key role in controlling the pandemic. Recent studies have highlighted the role of point-of-care ultrasound imaging for COVID-19 screening and prognosis, particularly given that it is non-invasive, globally available, and easy-to-sanitize. COVIDx-US Dataset: Motivated by these attributes and the promise of artificial intelligence tools to aid clinicians, we introduce COVIDx-US, an open-access benchmark dataset of COVID-19 related ultrasound imaging data. The COVIDx-US dataset was curated from multiple data sources and its current version, i.e., v1.5., consists of 173 ultrasound videos and 21,570 processed images across 147 patients with COVID-19 infection, non-COVID-19 infection, other lung diseases/conditions, as well as normal control cases. Conclusions: The COVIDx-US dataset was released as part of a large open-source initiative, the COVID-Net initiative, and will be continuously growing, as more data sources become available. To the best of the authors’ knowledge, COVIDx-US is the first and largest open-access fully-curated benchmark lung ultrasound imaging dataset that contains a standardized and unified lung ultrasound score per video file, providing better interpretation while enabling other research avenues such as severity assessment. In addition, the dataset is reproducible, easy-to-use, and easy-to-scale thanks to the well-documented modular design.
Keywords
- ultrasound imaging
- curated dataset
- open-access
- COVID-19
- artificial intelligence
The novel Coronavirus Disease 2019 (COVID-19), which appeared first in December 2019 and was caused by severe acute respiratory syndrome coronavirus 2 (SARS-CoV-2), led to a pandemic of severe and deadly respiratory illness, affecting human lives and well-being. The SARS-CoV-2 virus, now observed in different variants, can emerge in various forms and levels of severity, ranging from asymptomatic infection to an acute illness with organ failure risk and death [1]. Despite the rapid evolution and emergence, the scientific community has dynamically and actively responded to the disease spread, changing research priorities according to the needs [2]. However, the rapid growth of confirmed cases over several waves of a pandemic highlights the importance of effective screening and risk stratification of infected patients as a means to minimize spread and identify those that need a higher level of care [3]. The reliable and effective identification of infected patients with a low rate of false negatives contributes to controlling the disease transmission rate and mitigating the spread of the virus. A low false-positive rate is also desirable to not quarantine and treat people unnecessarily, removing burdens from the healthcare system as well as the society [4].
The reverse transcription-polymerase chain reaction (RT-PCR) test, performed on biological samples taken from the patient, is the main screening method used for COVID-19 detection [5]. Although RT-PCR is used in many countries, it requires a long complicated manual processing [3] which is a huge disadvantage for an effective fight against the pandemic. Moreover, there is no consensus about the sensitivity of RT-PCR testing, with highly variable rates reported in the literature [6, 7, 8]. These obstacles are compounded by a lack of necessary equipment and expertise to perform this test in many countries, an issue that also leads to improper management of infected patients [9]. Finally, RT-PCR tests do not provide additional information that supports clinical decision-making with respect to the triage of infected patients, treatment options, and predictions of patient outcomes that may assist in resource allocation. Therefore, finding complementary solutions for COVID-19 screening and alternative solutions for risk stratification and treatment planning has attracted the attention of the scientific community.
Radiography is an alternative imaging method utilized for COVID-19 screening and risk stratification. This modality entails an acute care physician and a radiologist visually inspecting radiographic images, e.g., chest X-ray (CXR) or computed tomography (CT) scans, to find indicators that are associated with SARS-CoV-2 viral infection, and that may assess the severity of infection. Biomedical imaging can accelerate diagnostic and prognostic decision-making processes by facilitating rapid assessment of patient condition and severity, as well as guiding the ordering of subsequent tests, if necessary [10]. It was reported in recent studies that patients infected with COVID-19 present abnormalities in their chest radiography images [11, 12]. Additionally, some studies observed a higher sensitivity of CT scans for COVID-19 detection in their examined cohort compared to RT-PCR [7, 13].
Although radiography examination is confirmed as a potential complementary method for conventional diagnostic techniques such as RT-PCR [10], some studies even suggest that it could be used as a primary COVID-19 screening tool in epidemic areas [13]. To this end, CT imaging is known to provide greater image detail and is considered the gold standard for pneumonia detection [14]. It has also been shown to be effective for screening [7, 13, 15]. However, CXR imaging remains the first-line examination [10], especially in resource-limited and heavily-infected areas, mainly due to its lower cost, high availability, accessibility, and potential for rapid triaging of patients suspected of the infection [3]. Furthermore, CXR imaging has been demonstrated to be effective for both screening [3] and risk stratification [16].
As an established method for monitoring and detecting pneumonia [17], lung point-of-care ultrasound (POCUS) is an emerging imaging modality that is receiving growing attention from the scientific community in recent years [18]. Due to its many desirable properties, i.e., high portability, non-ionizing radiation nature, and being used as the preferred lung infection diagnosis and prognosis method in resource-limited settings/environments, e.g., in emergency rooms or developing countries [19], POCUS is showing considerable promise as an alternative imaging solution to CXR as the first-line screening approach [20, 21], and tool that aids in prognostication [22].
Unfortunately, the literature on the applicability of POCUS for COVID-19 screening and prognosis assessment remains scarce. However, it is suggested that lung ultrasound (LUS) can play a key role in the context of the COVID-19 epidemic [10, 23, 24]. Changes in lung structure, such as pleural and interstitial thickening, are identifiable on LUS and help to detect viral pulmonary infection in the early stages [25]. For COVID-19 screening, recent studies reported identifiable lesions in the bilateral lower lobes and abnormalities in bilateral B-lines on LUS as the main attributes of the disease [26, 27]. The LUS findings in other diseases, e.g., influenza virus pneumonia, together with current clinical evidence, suggest that pneumonia patterns of consolidation in viral diseases are characteristic, and LUS has a high potential for evaluating early lung-infected patients in various settings, including at home, patient triage, the intensive care unit, and for monitoring treatment effects [23]. Furthermore, studies have also found POCUS to be applicable for predicting mortality and whether a patient is in need of intensive care admission [22].
Artificial-intelligence (AI) powered decision support systems, mostly based on deep neural network architectures, have shown exemplary performance in many computer vision problems in healthcare [28, 29]. By extracting complex hidden patterns in images, deep learning (DL) techniques may find relationships/patterns that are not instantly available to human analysis [30]. Although the number of scientific papers about using AI on POCUS for COVID-19 screening/severity assessment/analysis is continuously growing (e.g., [31, 32, 33, 34]), compared to CXR and CT, lung ultrasound deep learning studies are comparably limited due to the lack of well-established, organized, carefully labelled LUS datasets [35]. Motivated by recent open-source efforts of the research community in the fight against COVID-19 and to support alternative screening, risk stratification, and treatment planning solutions powered by AI and advanced analytics, we introduce COVIDx-US, an open-access benchmark dataset of ultrasound imaging data that was carefully curated from multiple sources and integrated systematically specifically for facilitating the building and evaluation of AI-driven analytics algorithms and models. Another publicly available LUS dataset comprising 200+ videos and ~60 images (as of November 2021 on their GitHub repository) built for classifying COVID-19 cases is the work of Born and his colleagues [10]. As one of the main contributions of our work, in COVIDx-US we offer a systematic framework for data curation, data processing, and data validation to dataset creation for creating a unified, standardized POCUS dataset. We also tried our best to design our systematic framework to be very easy-to-use and easy-to-scale, even for users without deep computer science/programming knowledge. The current version of the COVIDx-US dataset comprises 173 ultrasound videos, all verified and graded by our clinician, and 21,570 processed ultrasound images, extracted from the videos of 147 patients diagnosed with COVID-19 infection, non-COVID-19 infection, other lung diseases/conditions, as well as normal control patients. We would like to highlight that the labels/diagnoses were retrieved from the nine original data sources, using all the data available to them at the time of diagnosis, and we did not label the files ourselves solely based on the observation in the US files. The “non-COVID-19” class contains videos/images of patients with lung infections caused by bacteria, fungi, or viruses other than the SARS-CoV-2 virus. The most representative infection in the “non-COVID-19” category in our dataset is pneumonia. The “Other” category, on the other hand, contains ultrasound videos/images of patients with other lung diseases and conditions such as chronic obstructive pulmonary disease (COPD), pneumothorax, and hemothorax. The COVIDx-US dataset was released as part of a large open-source initiative, the COVID-Net initiative [15, 16], and will be continuously growing, as more data sources become available. To the best of the authors’ knowledge, in addition to being reproducible, easy-to-use, and easy-to-scale thanks to the modular well-documented design of COVID-US, it is the largest publicly available LUS dataset to date that provides a standardized human “gold standard” lung ultrasound score per video file, on an ordinal scale of 0–3, that could be used in research projects for severity assessment/classification. The score with the lowest value (0) represents normal lung while higher values represent worsening pathology.
The COVIDx-US dataset continues to grow as new POCUS imaging data is continuously curated and added as part of the broader initiative. All versions of the dataset will be made publicly available. Although this study represents the current snapshot of the dataset in terms of coverage, all the steps, including the data collection and processing pipeline that are introduced in this section in detail, will remain similar in the upcoming versions. Fig. 1 shows the flow of processes and the steps taken to generate the COVIDx-US dataset.
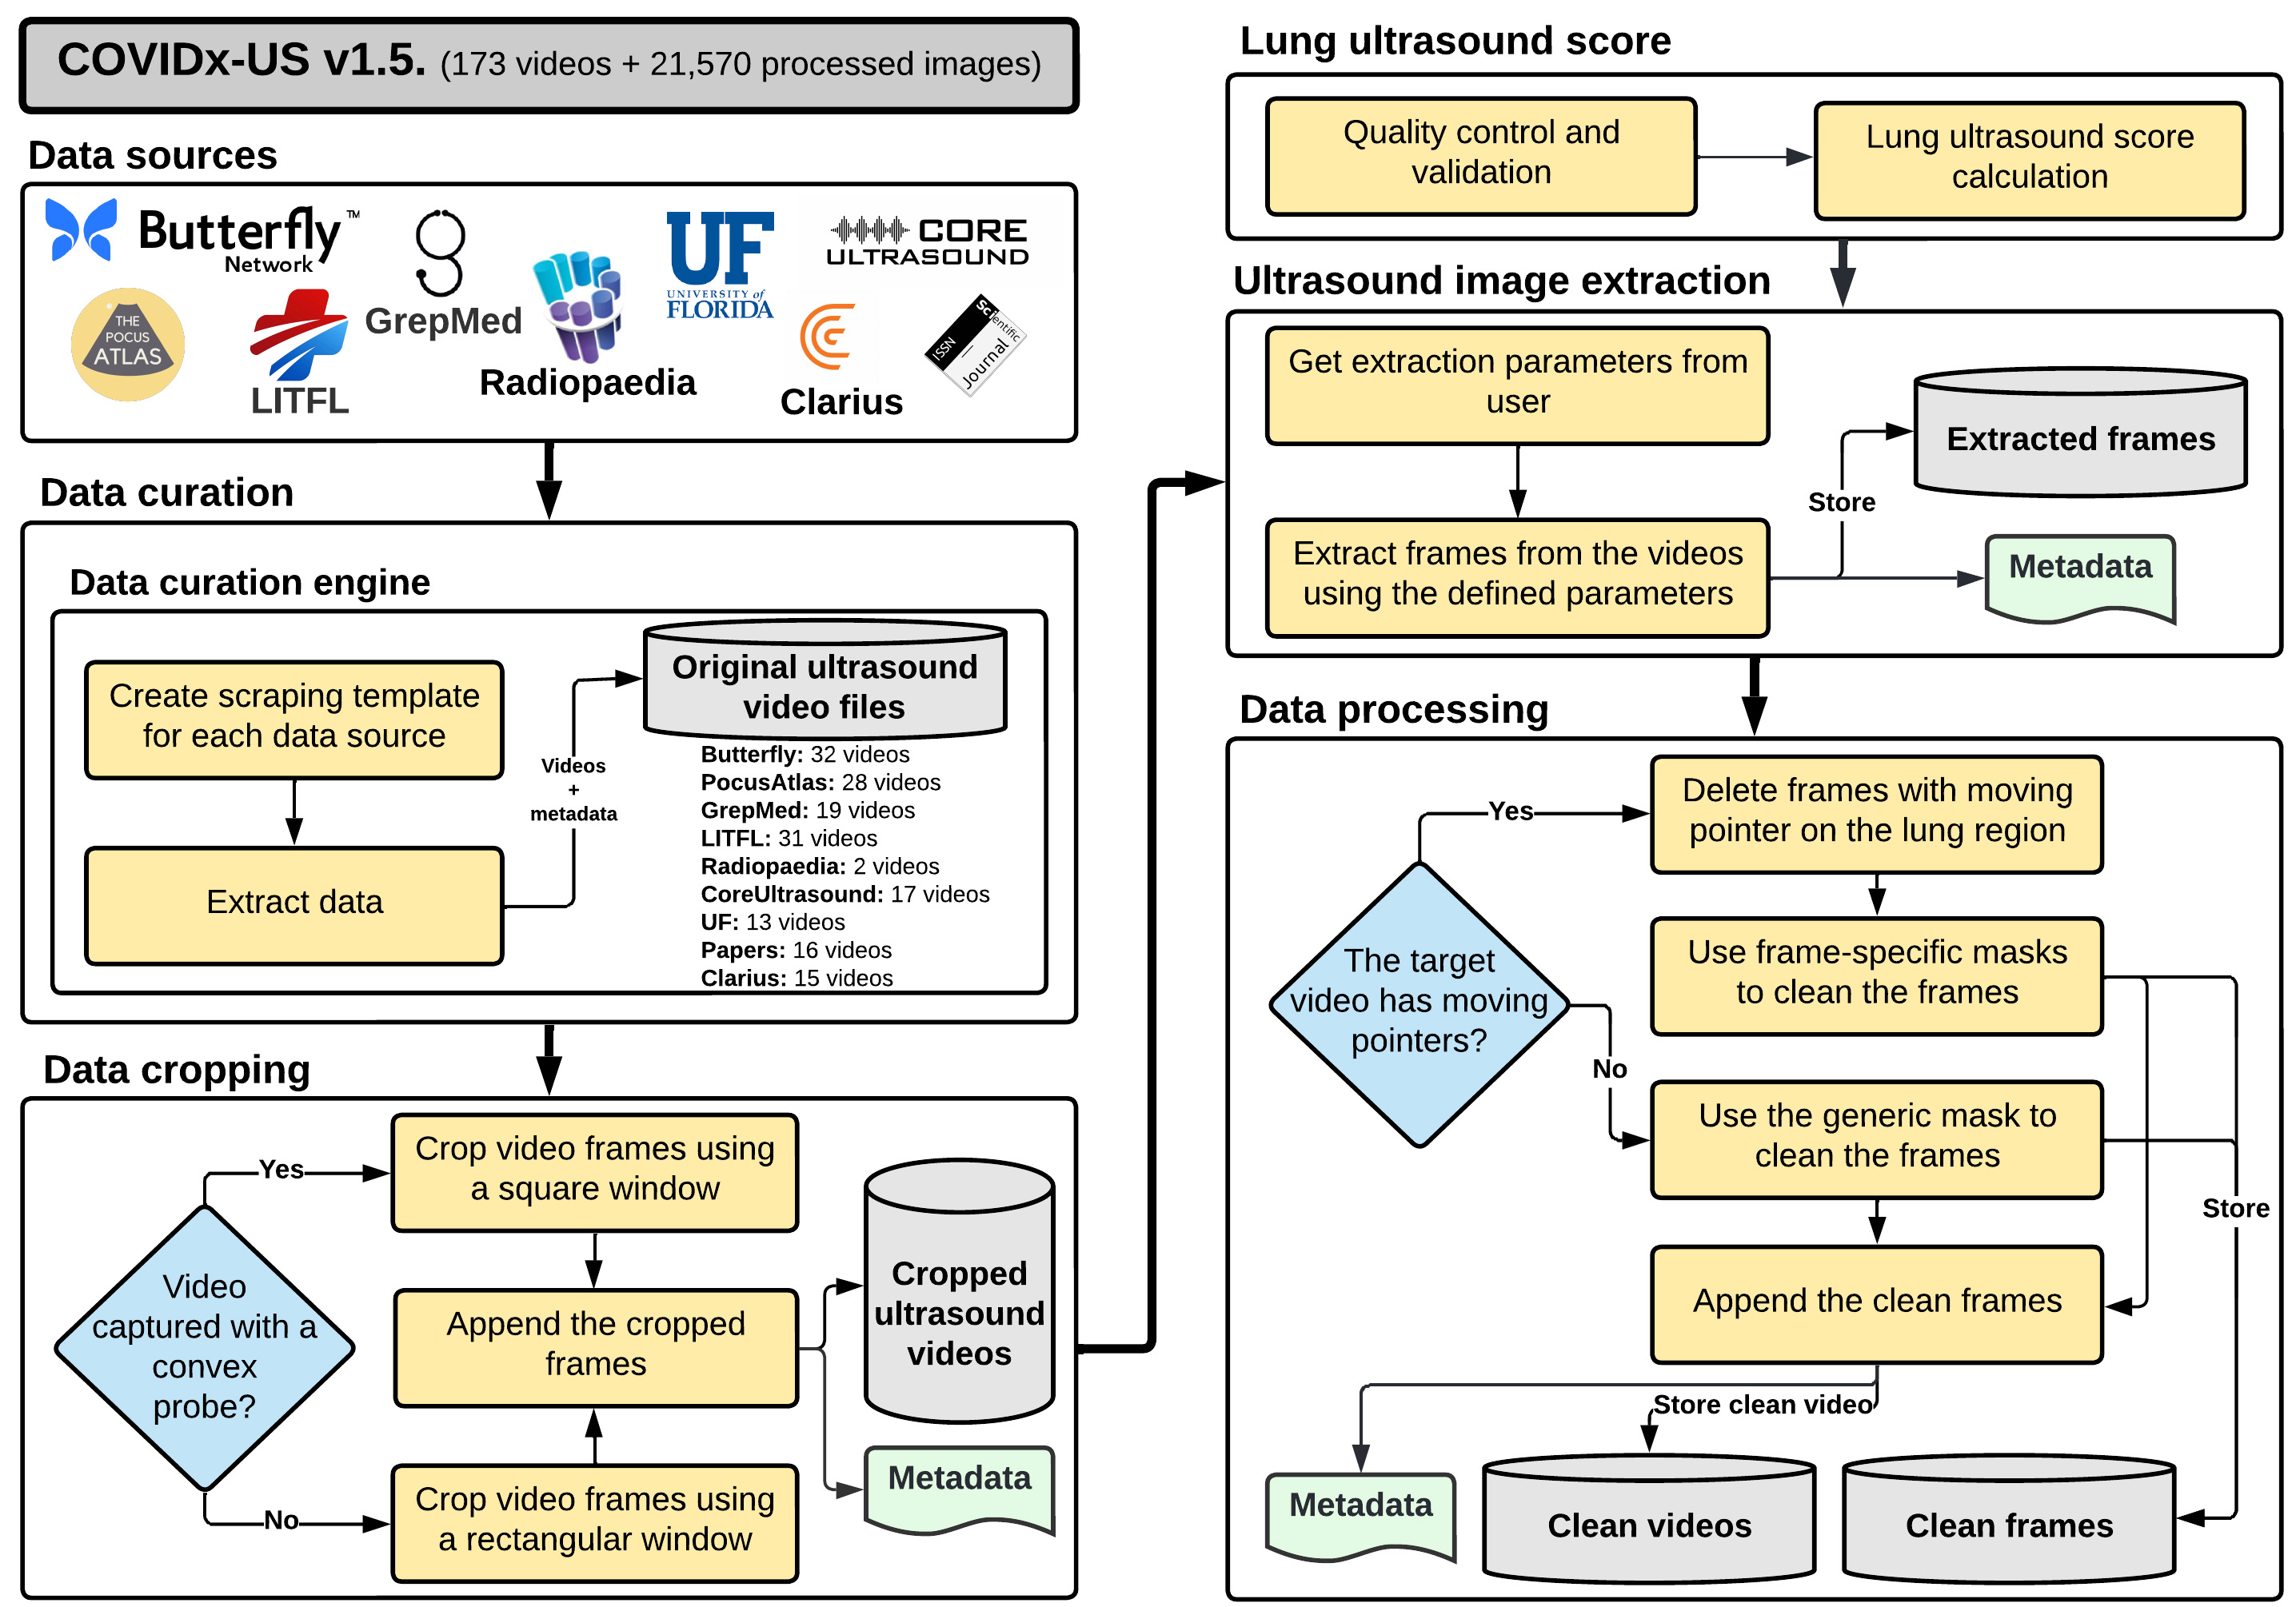 Fig. 1.
The conceptual flow of COVIDx-US dataset integration. The current version of COVIDx-US contains 173 ultrasound videos and 21,570 processed ultrasound images, extracted from the video files, from the following nine data sources: (1) Butterfly Network, (2) GrepMed, (3) The POCUS Atlas, (4) LITFL, (5) Radiopaedia, (6) Core Ultrasound, (7) University of Florida, (8) Clarius, and (9) scientific publications. No original data from the mentioned data sources are hosted on the COVIDx-US repository. Using the COVIDx-US scripts, original ultrasound videos are extracted from these data sources, are stored on the user’s local device, and are then curated and integrated systematically in a unified and organized structure.
The COVIDx-US dataset is heterogeneous in nature, containing ultrasound imaging data of various characteristics, e.g., convex and linear US probes, from multiple sources. The current version, i.e., COVIDx-US v1.5., curates ultrasound video data of four categories, i.e., COVID-19 infection, non-COVID-19 infection (e.g., bacterial infection, non-SARS-CoV-2 viral infection), other lung diseases/conditions (e.g., chronic obstructive pulmonary disease (COPD), pneumothorax, hemothorax, bad nasogastric tube placement, collapsed lung, congenital lobar overinflation, pulmonary contusion, subcutaneous emphysema), and normal control, from nine different sources: (1) The POCUS Atlas (TPA), (2) GrepMed (GM), (3) Butterfly Network (BN), (4) Life in the Fast Lane (LITFL), (5) Radiopaedia (RP), (6) Core Ultrasound (CU), (7) University of Florida (UF), (8) Clarius (CL), and (9) data collected from scientific publications that had lung ultrasound videos available and distributed as part of the publications. The POCUS Atlas is a collaborative education platform for sharing ultrasound education. GrepMed is an open-access medical image and video repository. Butterfly Network is a health-tech company that developed a technology to miniaturize ultrasounds and launched a portable ultrasound device. LITFL is a repository of emergency and critical care education materials. Radiopaedia is an open-edit educational platform that contains a radiology encyclopedia and imaging case repository. Core Ultrasound also contains ultrasound education materials including courses, clip banks, and podcasts. The University of Florida is a public university in the United States that has a teaching hospital, i.e., UF Health Shands Hospital. For UF videos, we collected lung ultrasound training videos that were publicly available on UF’s Department of Anesthesiology webpage. Clarius company is a provider of portable ultrasound machines and scanners. Table 1 shows the distribution of the LUS video files per data source in the current version of the dataset, i.e., COVIDx-US v1.5. The COVID-19 US video files account for 38% of the data. No original data are hosted on the COVIDx-US repository and we rather provide scripts to collect, process, and integrate data from the above-mentioned data sources on end users’ devices. As seen in Table 1, TPA, LITFL, and RP provide data via a Creative Commons license. Data collected from scientific publications are provided via a Creative Commons license as well. For GM, BN, CU, UF, and CL we could not find licensing information on their websites. However, all those video files have been publicly made available on the respective websites. For example, video files collected from Clarius, as announced on their website (please see this link), are public resources shared by their users who are medical doctors. Users are recommended to verify with the mentioned data sources whether their desired usage is permitted. Also, users may refer to the provided metadata on the COVIDx-US repository for more details about the video files including the license. We would like to highlight again that no original data from the nine targeted data sources are hosted on the COVIDx-US repository.
| Data source | License | COVID-19 | Non-COVID-19 | Normal | Other | Total |
| TPA | CC BY-NC 4.0 | 17 (26%) | 6 (19%) | 5 (18%) | 0 (0%) | 28 (16%) |
| GM | — | 8 (12%) | 8 (26%) | 3 (11%) | 0 (0%) | 19 (11%) |
| BN | — | 30 (45%) | 0 (0%) | 2 (7%) | 0 (0%) | 32 (18%) |
| LITFL | CC BY-NC-SA 4.0 | 0 (0%) | 11 (35%) | 3 (11%) | 17 (35%) | 31 (18%) |
| RP | CC BY-NC-SA 3.0 | 0 (0%) | 1 (3%) | 1 (4%) | 0 (0%) | 5 (3%) |
| CU | — | 1 (1%) | 3 (10%) | 1 (4%) | 12 (25%) | 17 (10%) |
| UF | — | 0 (0%) | 0 (0%) | 6 (21%) | 7 (15%) | 13 (8%) |
| CL | — | 3 (5%) | 2 (6%) | 3 (11%) | 7 (15%) | 15 (9%) |
| Paper | CC BY 4.0 | 7 (11%) | 0 (0%) | 4 (14%) | 5 (10%) | 16 (9%) |
| Numbers in parentheses represent percentages per column, rounded up without a decimal. The sum of the percentages may not add up to 100 due to rounding. | ||||||
Fig. 2 shows sample ultrasound frames captured from the ultrasound video recordings in the COVIDx-US dataset. The examples are processed by the COVIDx-US scripts. These few examples illustrate the diversity of ultrasound imaging data in the dataset. The choice of the nine different data sources and the heterogeneity in the structure and format of their hosted videos resulted in a highly diverse set of videos and images in the COVIDx-US dataset that is key to the generalizability of the AI-driven solutions/models that are built/trained on the COVIDx-US dataset. Additionally, this non-homogeneous set of data points could provide researchers with more flexibility in their research projects via filtering in/out data points based on their research objectives. We will continuously grow the dataset by adding more data points and/or data sources.
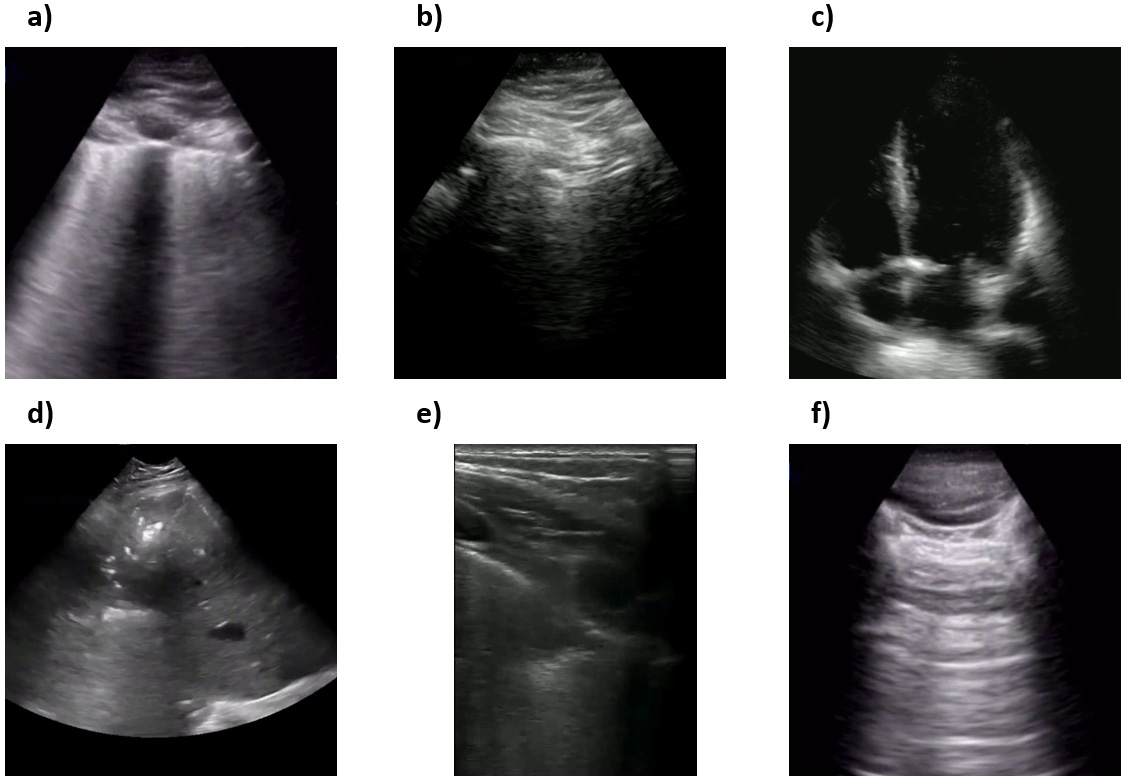 Fig. 2.
Sample ultrasound frames captured from the curated ultrasound video recordings in the COVIDx-US dataset. (a), (b), and (c) COVID-19 positive cases, (d) and (e) non-COVID-19 infection cases, (f) a normal control case. The dataset comprises 173 ultrasound videos, collected and curated systematically from nine different data sources, and 21,570 carefully curated ultrasound images in the current version.
COVIDx-US v1.5. provides 173 ultrasound videos and 21,570 processed images of 147 patients categorized into (1) COVID-19 infection, (2) non-COVID-19 infection, (3) patients suffering from other lung diseases/conditions such as pneumothorax and lung collapse, and (4) normal control cases. The dataset comes with a diverse set of metadata from ultrasound video file properties to patient demographics and symptoms. In this section, we review a few of them that are related to patients/diseases/conditions. Please refer to the “Data Records” section or COVIDx-US GitHub repository for more information on data records and metadata. Fig. 3 shows the gender distribution per curated ultrasound video. Out of 173 US video files collected, the patient’s gender is available for 47 (27%) ultrasound videos. Among all the categories, the least information about patients’ gender is available for the COVID-19 infection category.
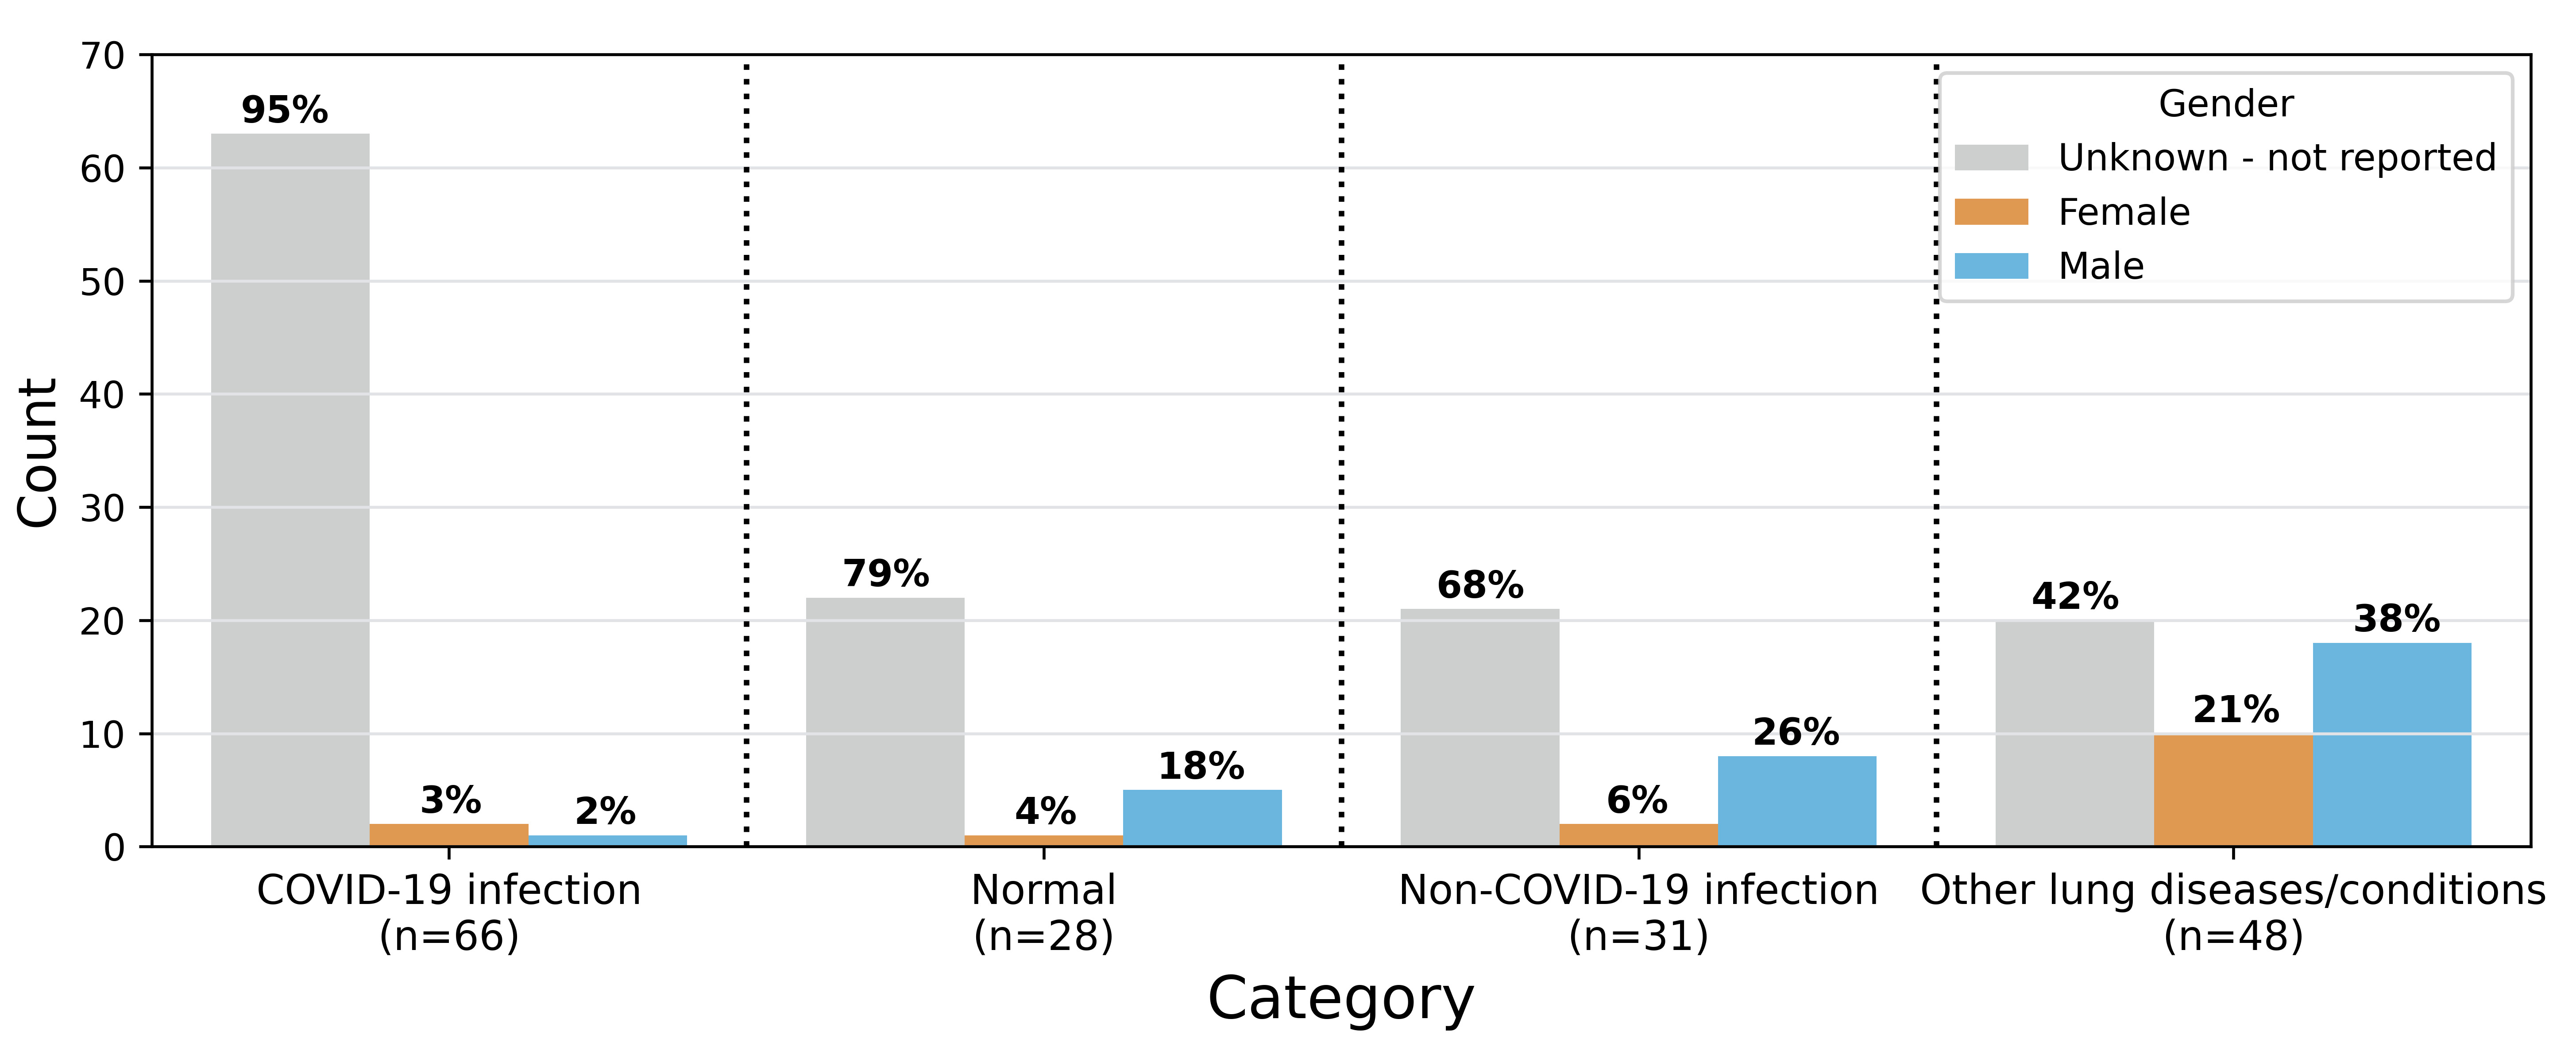 Fig. 3.
Gender distribution per curated ultrasound video (n = 173). The numbers in parentheses under each category represent the number of video files in that category. Values on the bar show proportion of video files for that specific gender in the given category. The sum of the percentages for the normal and other lung diseases categories exceeds 100 due to rounding.
Fig. 4 shows the distribution of LUS artifacts, i.e., the existence of A- and B-lines, as well as other lung features/clinical signs such as consolidations, irregular pleural line, air bronchograms, and (sub)pleural effusion, in COVIDx-US. Numbers in parentheses under each category represent the total number of US video files under the given category for which at least one of the above-mentioned metadata is available.
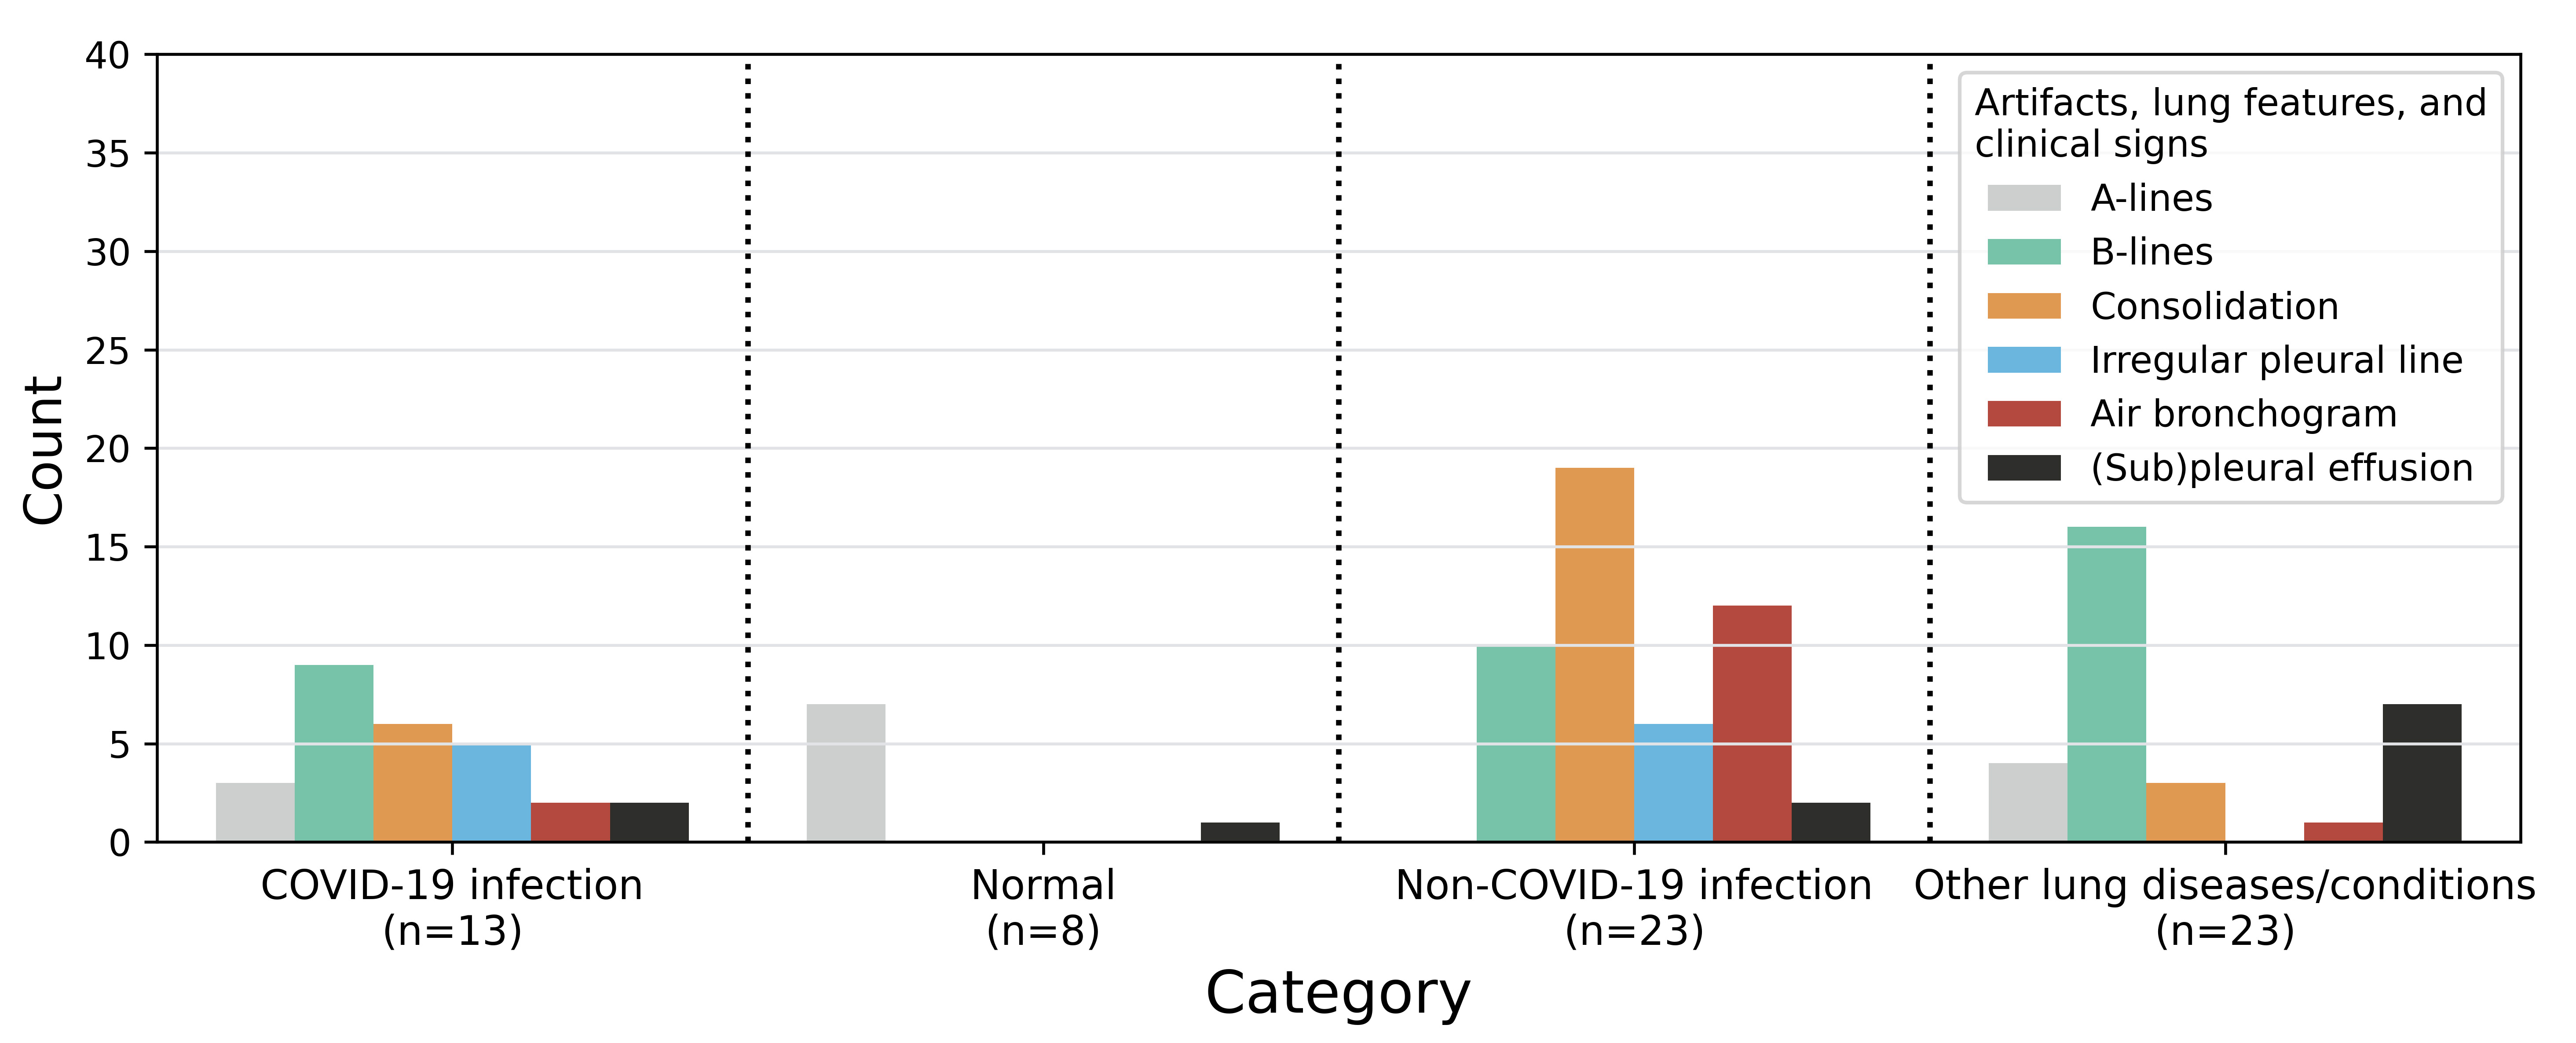 Fig. 4.
Distribution of lung ultrasound artifacts, i.e., A- and B-lines, as well as other lung features/clinical signs in COVIDx-US. The numbers in parentheses under each category represent the total number of US video files under the given category for which information about the listed artifacts and clinical signs is available.
Fig. 5 shows the distribution of five symptoms, i.e., fever, cough, pain, respiratory problems, and asymptomatic, observed in the patients in COVIDx-US. Numbers in parentheses under each category represent the total number of US video files under the given category for which symptoms information is available.
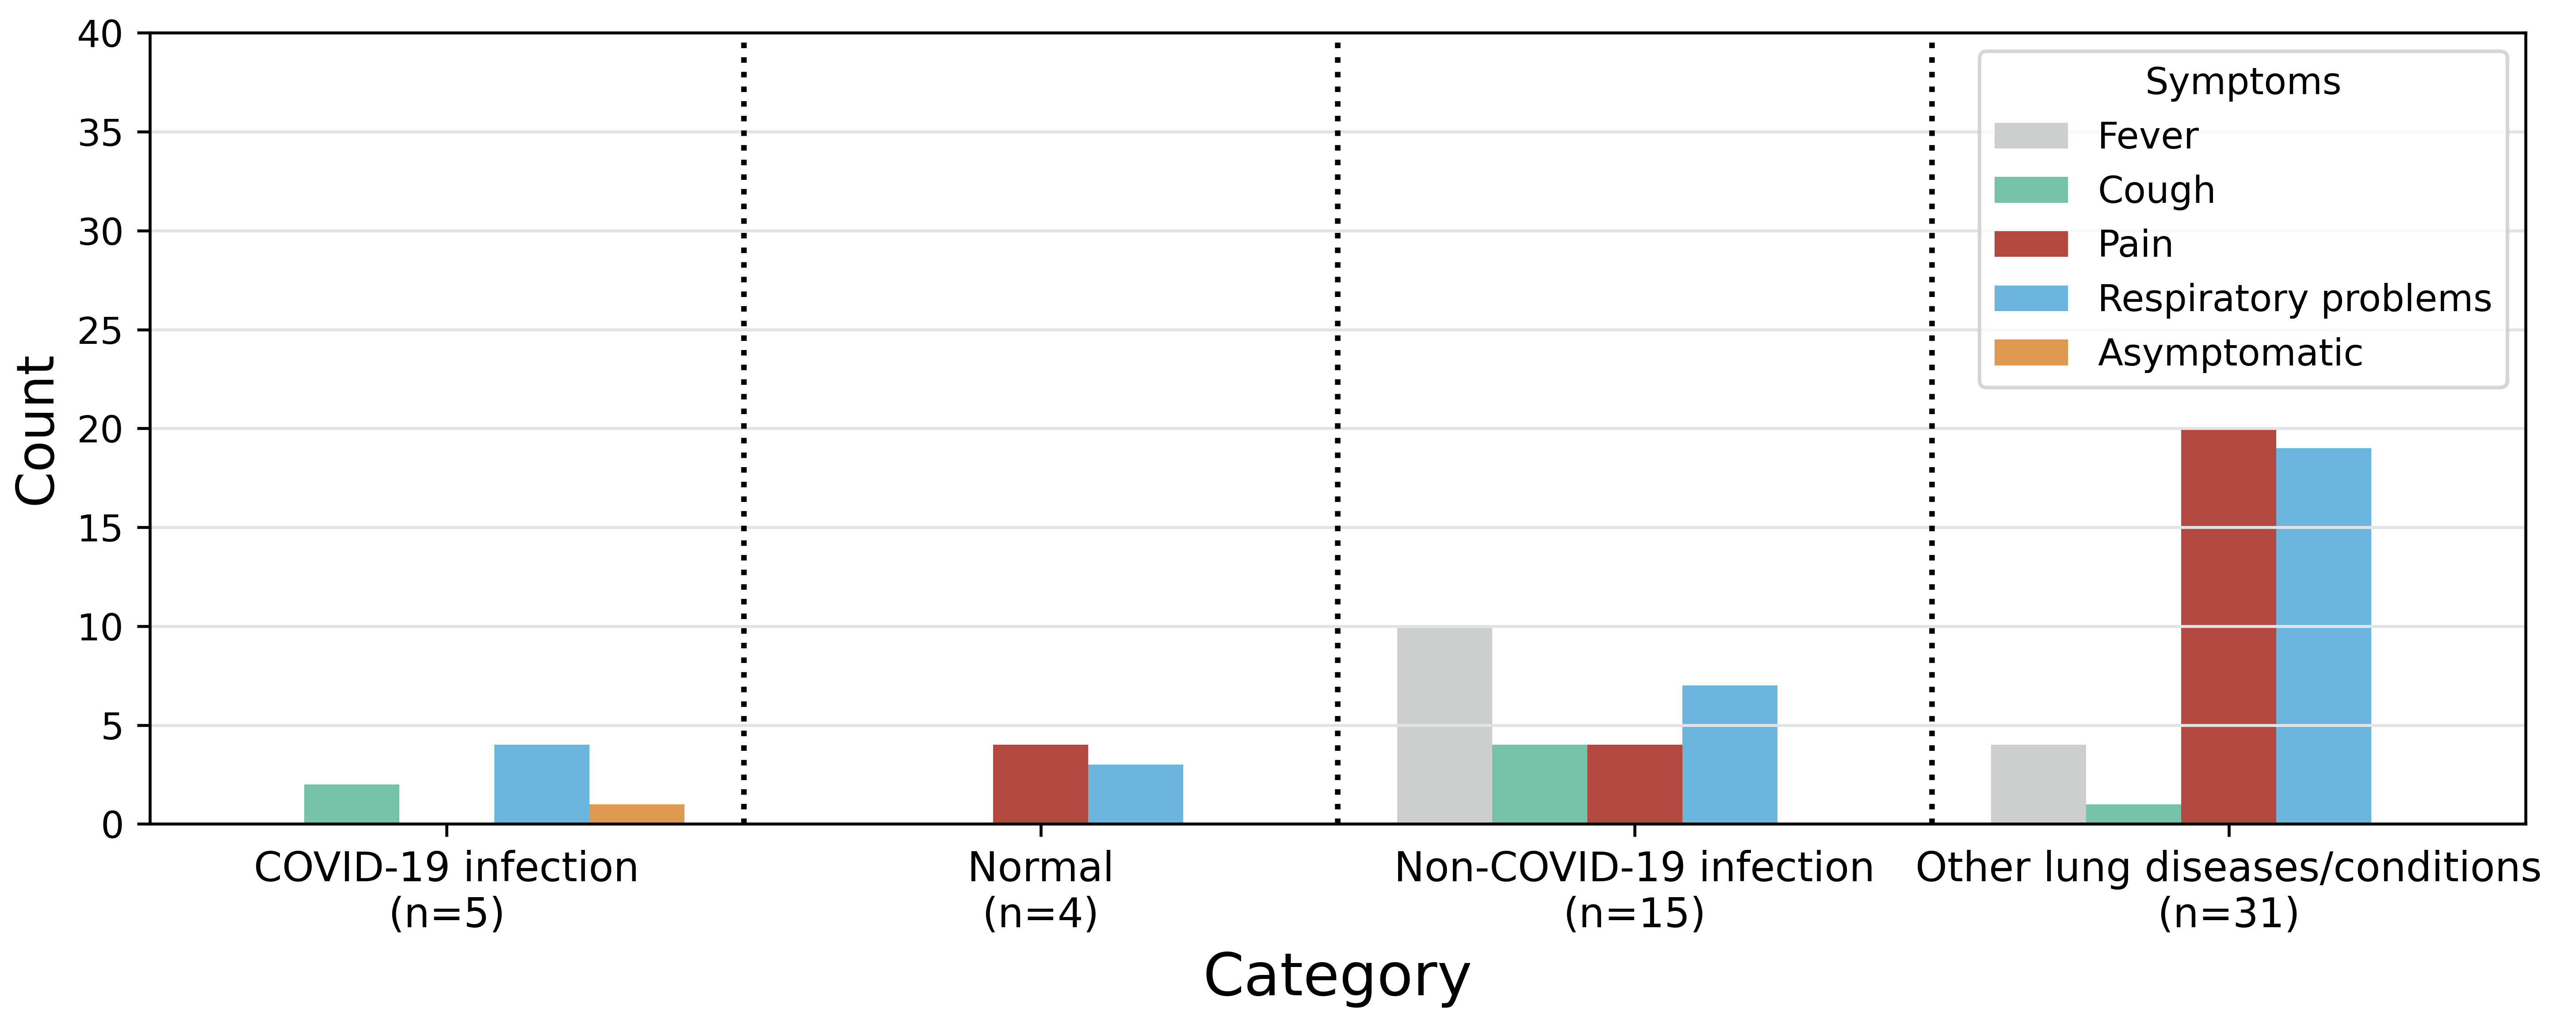 Fig. 5.
Distribution of symptoms per category in COVIDx-US. The numbers in parentheses under each category represent the number of US video files under the given category for which symptom information is available.
The data were curated from nine data sources, each with a different structure. To support reproducibility and ease of use, we developed data curation engines, personalized for each of the target data sources, to automatically curate lung POCUS video recordings as well as associated metadata from the target data sources and to integrate them locally in a unified, organized structure. No original data is hosted in the COVIDx-US repository and the data is rather curated and integrated locally via our publicly released COVIDx-US scripts and the parameters set by the user. The metadata provides information on the video files, e.g., dimension and framerate, along with their category, i.e., COVID-19, non-COVID-19, other lung diseases/conditions, or normal control. The scripts are designed to be highly extensible such that more data sources can be added to the pipeline, supporting the scalability of the dataset. The scripts are made available to the general public as part of each release of the dataset.
The curated data contains video recordings captured with linear or convex US probes (n = 39 and 134, respectively) that are the most common probes used in medical settings. This provides users with higher flexibility to filter in the video files based on the probe types, if required. It also enables higher generalizability of the models that are trained on the COVIDx-US dataset by covering data of different types. Fig. 6 shows examples of linear and convex US images, i.e., single snapshots of the respective video recordings. The linear probe has a flat array and appearance and provides images of higher resolution but with less tissue penetration. Convex probes, also called curved linear probes, provide a deeper and a wider view and are mostly used for abdominal scans [36]. The original data, collected from multiple sources, were noisy in some cases, containing additional information embedded in the ultrasound videos, such as measure bars, symbols, or text (Fig. 6a). We initially processed the collected videos and cropped them to remove these (often peripheral) noises from the data.
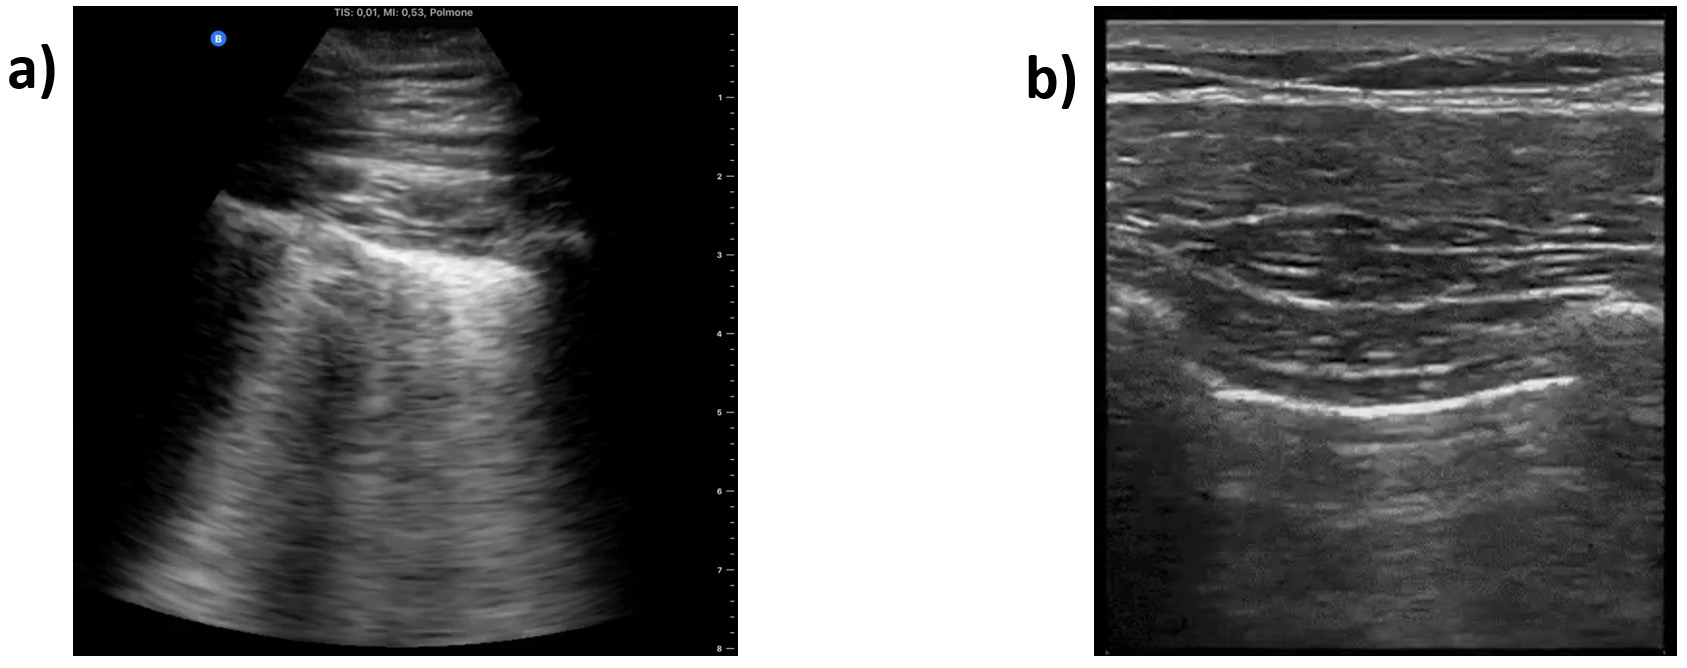 Fig. 6.
Sample frame of an ultrasound video. (a) Captured with a convex. (b) Captured with a linear probe.
To do data cropping, we treated convex and linear US video files separately. For the convex and linear US video files, we used square and rectangular windows to crop the frames, respectively. We used rectangular windows for linear US video files to include a larger portion of the original file in the processed video file. Publicly available processing scripts are released as part of COVIDx-US to automatically perform data cropping on the benchmark dataset. The parameters of the square and rectangular windows can be modified by the end-user, if desired. However, using the default parameters for the defined windows will remove artifacts such as bars and texts visible on the side or top of the collected US video files. The output of this step is a video file containing frames that were processed using the above-mentioned cropping process, along with a metadata file that includes information about the video file properties such as dimension and framerate, as well as the type of artifacts observed, e.g., static symbols or moving pointers. The cropped files are stored locally by the provided processing scripts.
As mentioned in the previous sections, the videos were curated from multiple data sources, hence, their properties differ. To ensure maximum flexibility of the COVIDx-US dataset and as part of each release, we provide end users with highly flexible data processing scripts, allowing them to extract frames from the initially processed video files based on their research objectives and requirements, using a set of parameters as follows:
• The maximum number of frames to extract from each video.
• Extract frames from either all classes or a subset of classes from the set of [‘COVID-19’, ‘Non-COVID-19’, ‘Other’, ‘Normal’].
• Extract frames from either all data sources, i.e., [‘BN’, ‘GM’, ‘LITFL’, ‘TPA’, ‘RP’, ‘CU’, ‘UF’, ‘CL’, ‘Paper’] or a subset of them.
• Extract frames from all videos or those captured with a specific probe, i.e., convex or linear.
We set the default parameters to extract all frames from all videos. Using the defined parameters, the frames are extracted from the videos and stored locally.
After extracting frames from the videos and using the metadata file from the data cropping stage, the frames are further processed as follows:
(1) Videos with moving pointers are identified.
(2) If the video contains a moving pointer:
(a) Delete frames with a moving pointer on the lung region.
(b) For the remaining frames, generate and store a frame-specific mask.
(3) If the video does not contain a moving pointer:
(a) Make a generic mask (suitable for all the extracted frames) and store it.
(4) Use the generated masks to process the frames, removing the remaining artifacts.
The generated masks are provided as part of the COVIDx-US release. Using the generated masks, we leveraged the in-painting technique introduced by Bertalmio and colleagues [37] to remove the remaining peripheral artifacts from the frames by replacing bad marks, i.e., pixels in the masked regions, with their neighbouring pixels. The clean frames as well as the clean video file, generated by appending the clean frames, are stored locally on the user’s device. Fig. 7 shows an example of a US frame, the mask generated for this specific frame, and the final clean frame obtained by applying the mask to the original frame.
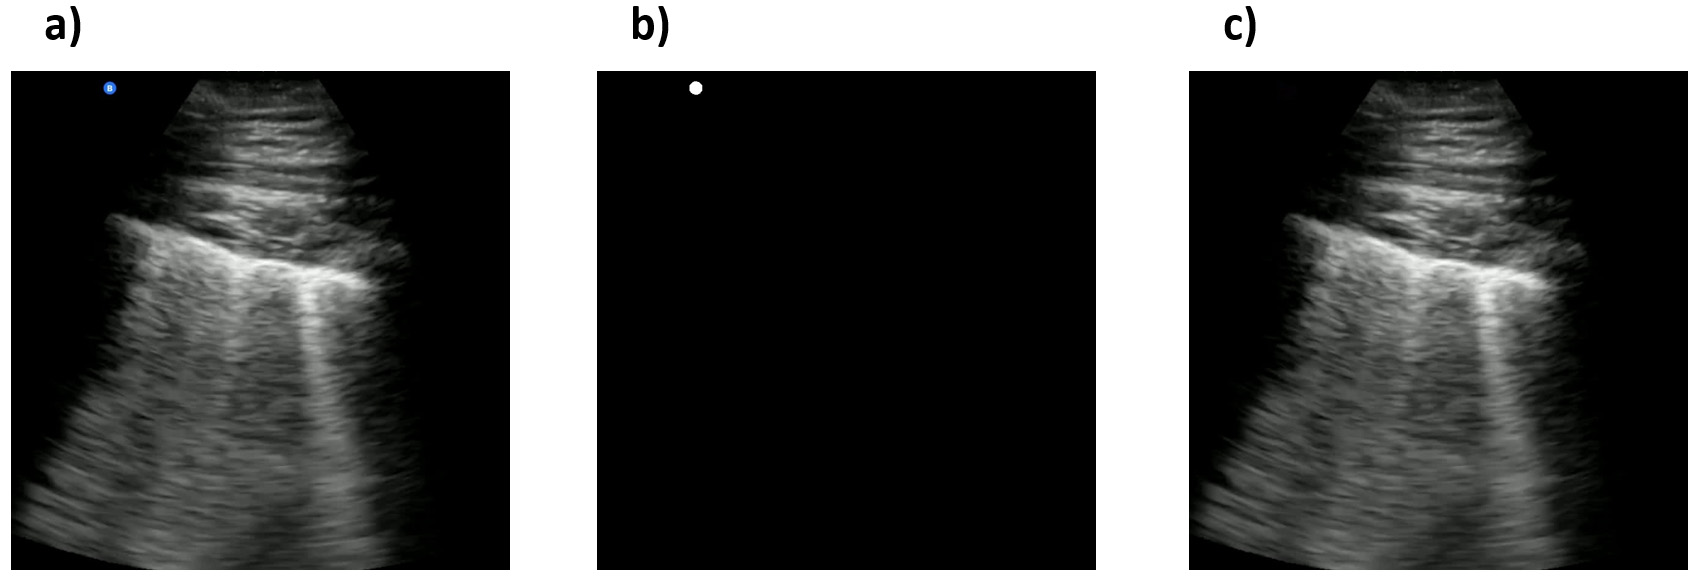 Fig. 7.
Examples of an ultrasound original frame, a mask, and the clean processed frame in the COVIDx-US dataset. (a) A sample frame with a blue symbol on the top-left of the image. (b) The generated mask for the frame. (c) The clean frame resulted from applying the generated mask to the original frame.
The COVIDx-US benchmark dataset is available to the general public at the NRC COVIDx-US GitHub repository. The repository also includes the generated masks and metadata. The dataset has been constantly growing, releasing five versions of the dataset to date (May 2022). The current version of the dataset contains 173 processed and clean ultrasound videos, divided into 66 videos of COVID-19 infected patients, 31 videos of non-COVID-19 infected patients, 48 videos of patients with other lung diseases/conditions, and 28 videos of normal patients, along with 21,570 ultrasound images extracted from the clean video files (using default parameters), divided into 8312 images of COVID-19, 4142 images of non-COVID-19, 6235 images of patients with other diseases/conditions, and 2881 images of normal patients. As mentioned in the ultrasound image extraction section, users can extract frames from the US videos according to their projects’ objectives and requirements, using the codes provided and by setting their own parameters. This makes the COVIDx-US dataset highly flexible for various research objectives. Meanwhile, the modular design of the scripts allows adding/removing data sources, if required.
Running the scripts provided in COVIDx-US will extract original videos from BN, GM, TPA, LITFL, RP, CU, UF, CL, and a set of scientific publications, and will store them locally on the user’s device in the “/data/video/original” folder. The cropped videos are stored locally in the “/data/video/cropped” folder, the clean videos in the “/data/video/clean” folder, and the clean images in the “/data/image/clean” folder. Please see the Appendix for a detailed list of video files included in COVIDx-US v1.5. along with their properties and the number of frames extracted using the default parameters. Complementary information about the file properties can be found in the metadata files located in the “/utils” folder in the COVIDx-US GitHub repository. Users may refer to the data dictionary file located in the “/utils” folder for detailed information/description of all the metadata files. The original video files extracted from the nine above-mentioned data sources are named such that the filename contains information on the source and class of the video file. This naming convention was respected for all the other generated data such as clean videos and images.
COVIDx-US collects, curates, and integrates ultrasound video files from various data sources, labelled by different labellers. This might have an impact on the integrity of COVIDx-US data. To mitigate this risk, ensure reproducibility, and provide researchers with a standardized severity score, our contributing clinician (A.F.) reviewed, classified, and graded all the ultrasound video files in COVIDx-US v1.5. (n = 173). We based our scoring system on the approach proposed by Soldati et al. [38] but modified certain criteria within each score. The number of B-lines to consider a lung area as containing interstitial syndrome which is an alteration in the lung parenchyma between air and fluid filled areas that are not normally present without pathology, has been established as 3 or more by international consensus [39]. Furthermore, several studies looking to assess the use of the lung ultrasound score (LUSS) for predicting disease severity in COVID-19 patients have used the criterion of 3 B-lines or more as well as a cut-off for the consolidation size [40, 41]. Therefore, the score by Soldati et al. [38] was modified to reflect evidence appearing recently in the literature that assesses disease severity both in hospitalized and intensive care unit (ICU) patients as suggested by the mentioned studies. Also, we have eliminated from score 2, “more than 3 B-lines” as coalescing B-lines assumes the presence of multiple B-lines altogether.
Our contributing clinician (A.F.) is an Assistant Professor in the Department of Emergency Medicine and the ultrasound co-director for undergraduate medical students at McGill University. He is practicing Emergency Medicine full-time at Saint Mary’s Hospital in Montreal. For 173 ultrasound video files in COVIDx-US v1.5., a score was assigned that classifies findings on an ordinal scale of 0–3 as follows:
• Score 0: Normal pleura with A-lines.
• Score 1: (1) More than 2 B-lines are visible, and (2) irregular thick pleura is seen.
• Score 2: Coalescing B lines, white lung, small subpleural
consolidations (
• Score 3: White lung more than 50% of pleural length,
subpleural consolidations (
Fig. 8 shows the distribution of lung ultrasound scores in COVIDx-US v1.5.
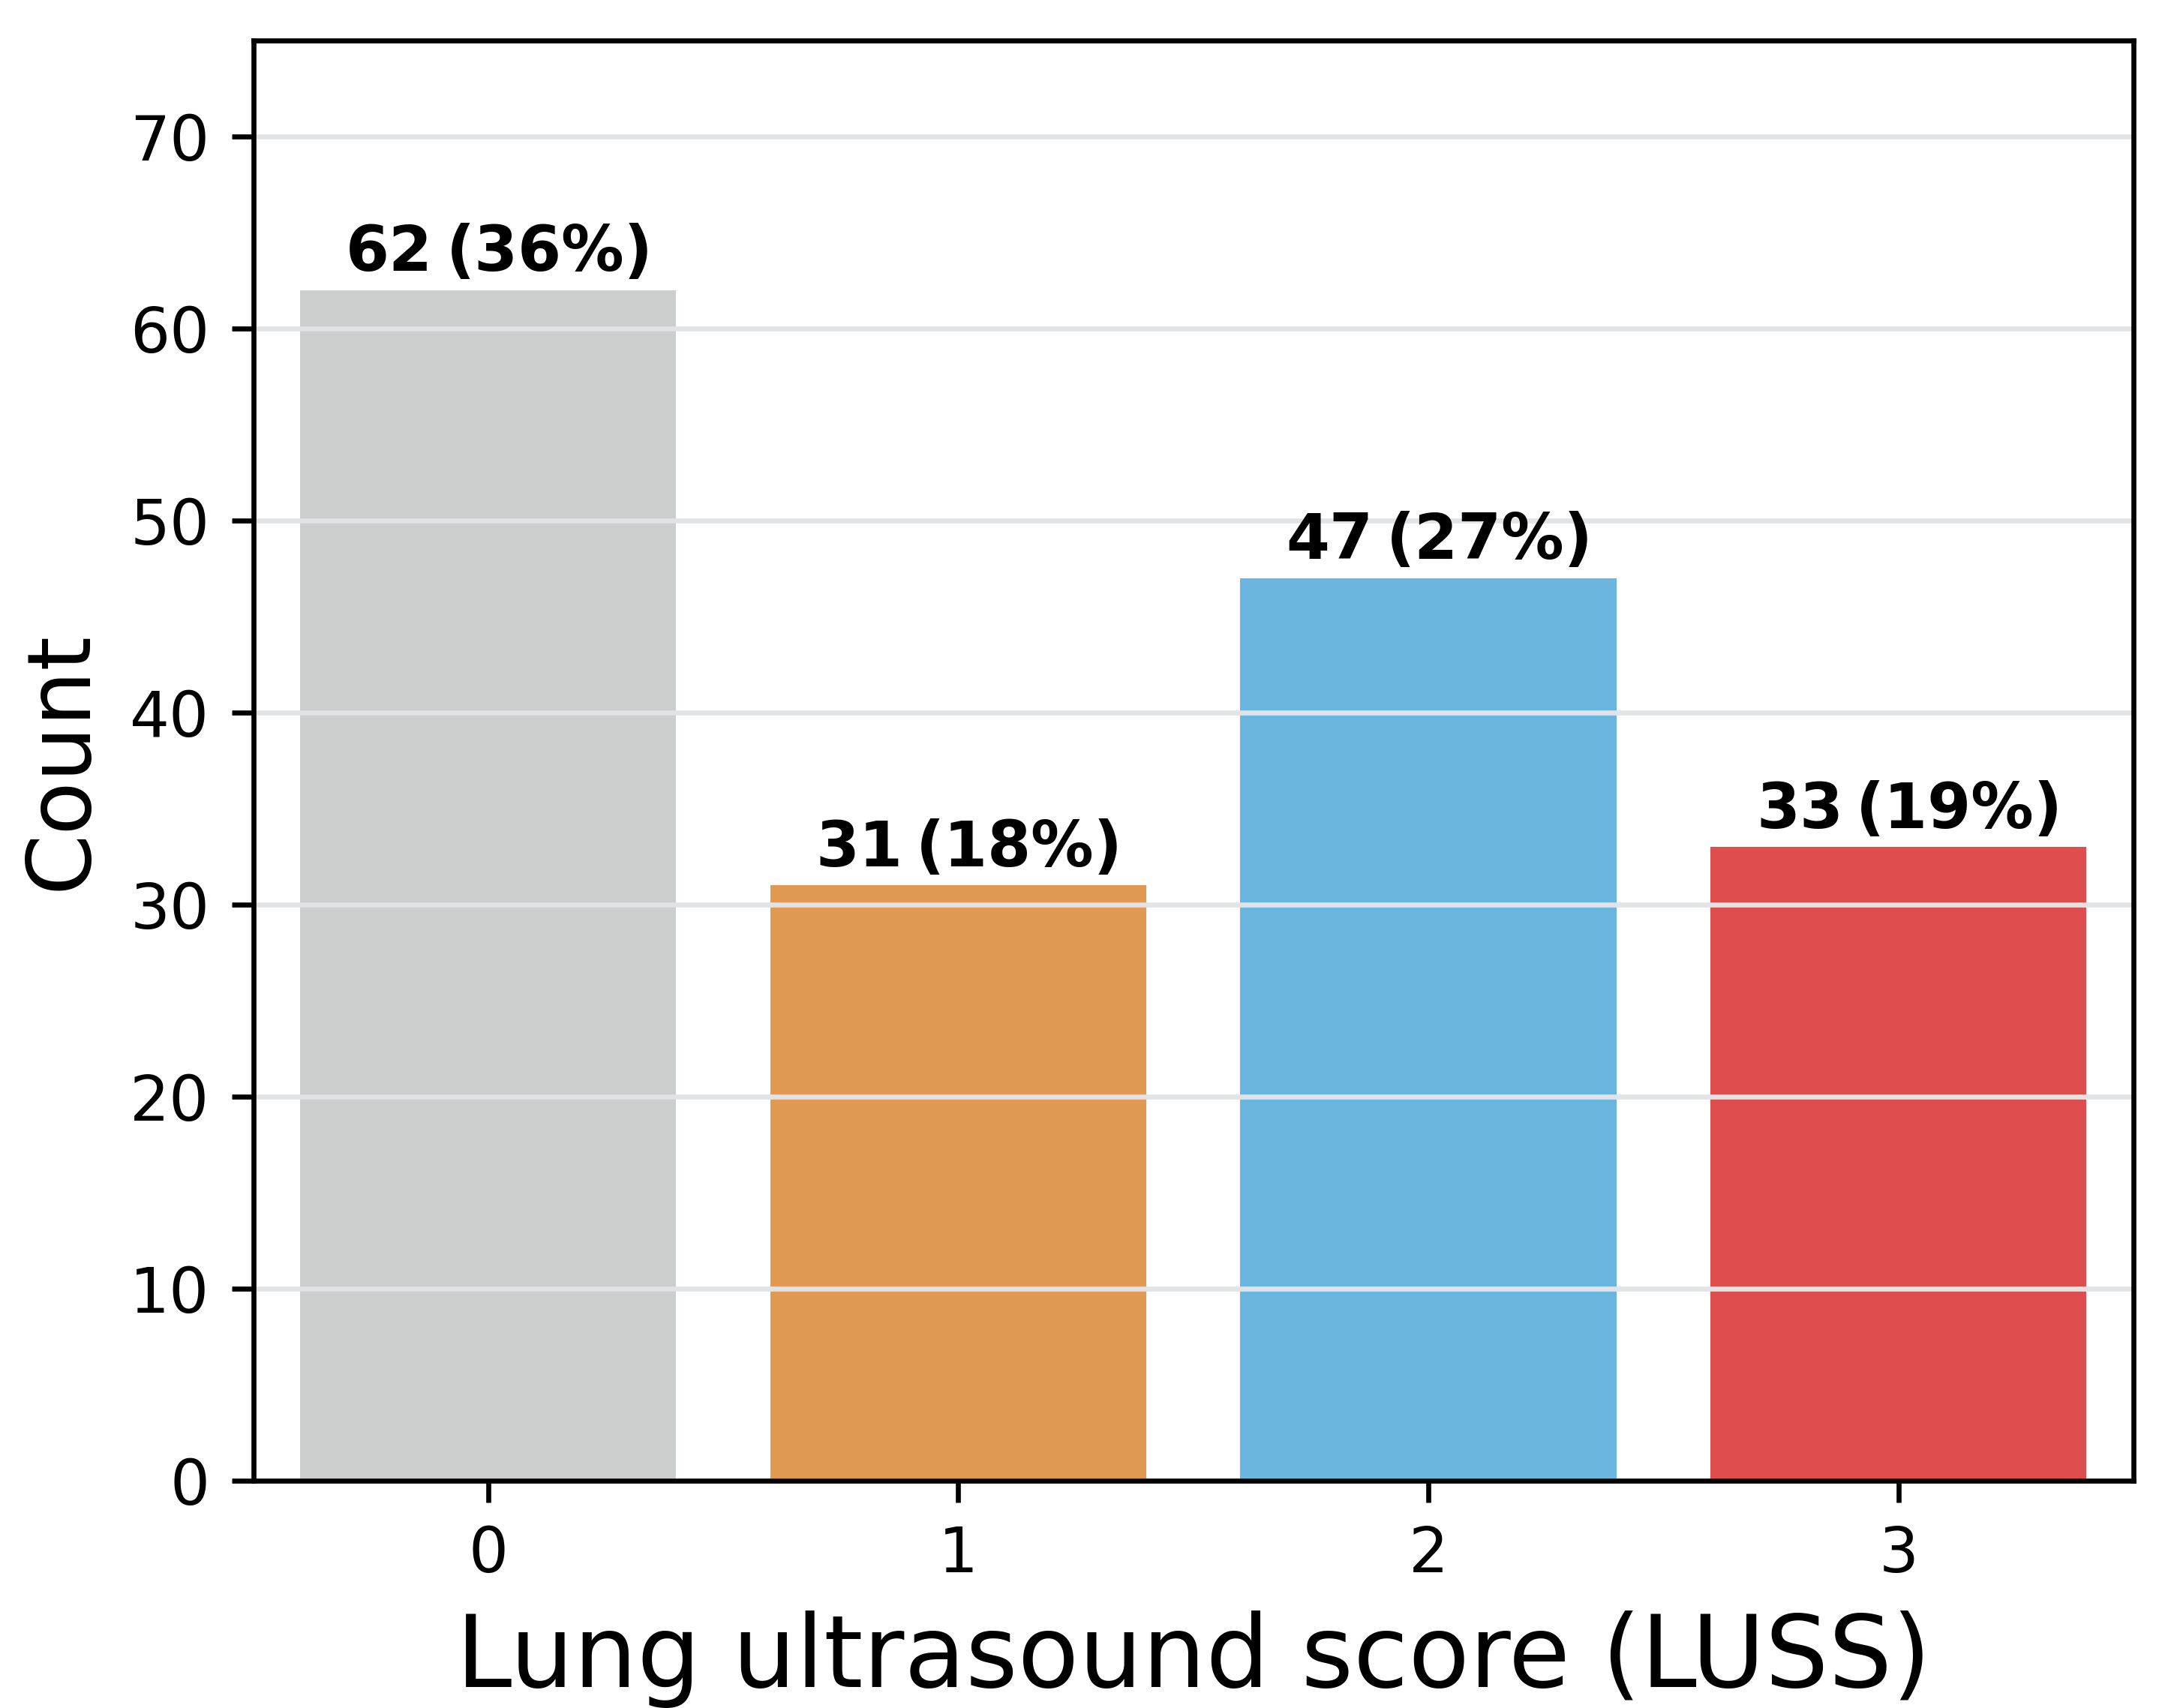 Fig. 8.
Distribution of the lung ultrasound score in COVIDx-US, graded by our contributing clinician.
Although ultrasound findings such as B-lines, confluent B-lines, consolidations, and pleural irregularity are easily identifiable in COVID-19 patients, the interpretation of their clinical significance poses a challenge at the bedside. In order to produce a more systematic recording and interpretation of these findings, the LUSS was described and suggested as a potential standardization tool [38]. The LUSS has been demonstrated to correlate with the need for ICU [22, 41] or hospital admission [42] and an increased hospital length of stay [43]. These indicators could assist hospital or government managers in the planning and allocation of scarce medical resources. Moreover, the LUSS has been used to identify the development of ventilator-associated pneumonia in ICU patients [40] and thus had a direct impact on their medical management. Although studies assessing the LUSS in the prediction of mortality have been mixed [22, 40, 43], the potential to incorporate this new quantified assessment into more complex prediction models would be a promising avenue for further research.
The current version of COVIDx-US is curated from nine data sources and contains data of different types and characteristics. The scripts provided will perform the processes necessary to clean the collected POCUS videos, extract frames, and store them locally on the user’s device. But, they do not validate the analyses performed and published by the research community using COVIDx-US data. As COVIDx-US will be continuously growing, feedback provided by researchers will be used in the next versions of COVIDx-US to perform additional processes/reviews. Such feedback may be addressed to ashkan.ebadi@nrc-cnrc.gc.ca.
In order to validate the quality of images in the COVIDx-US dataset and ensure the existence of markers in the processed ultrasound images, our contributing clinician (S.K.) reviewed a randomly selected set of images and reported his findings and observations. Our contributing clinician (S.K.) is a practicing Internal Medicine and ICU specialist, certified in both specialties by the Royal College of Physicians of Canada. Fig. 9 shows three select images of COVID-19 positive cases, as examples, that were reviewed. The summary of our expert clinician’s report is as follows.
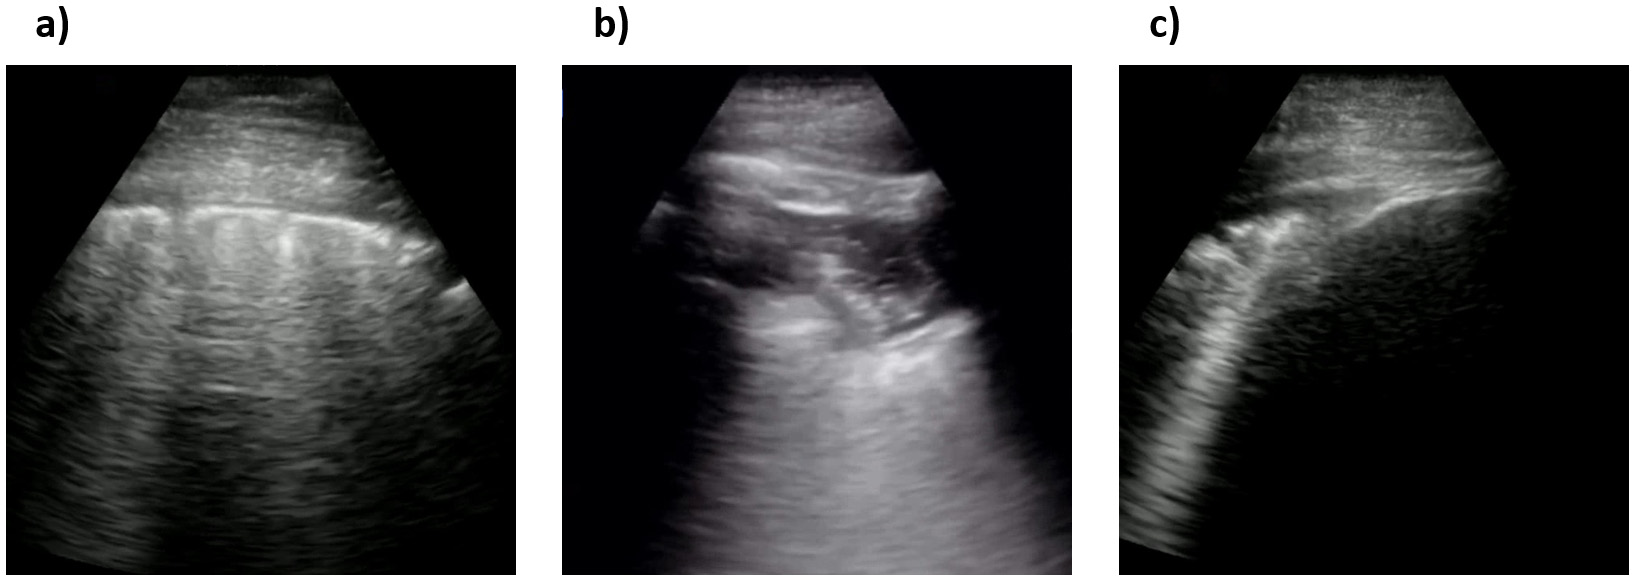 Fig. 9.
Sample processed ultrasound images, reviewed and reported on by our contributing clinician. (a), (b) and (c) are all confirmed COVID-19 positive cases.
Case 1 (Fig. 9a). Our contributing clinician observed multiple pleural irregularities, including pleural thickening and the presence of sub-pleural consolidations which have been previously described as markers of COVID-19 disease severity [44]. These findings, together with the observed B-line profile, are indicative of a moderate to severe pulmonary disease.
Case 2 (Fig. 9b). This is an image of lung pleura in short depth. Our clinical expert observed abnormalities and irregularities in the pleura as it is thickened and “shredded” with hypoechoic signals suggesting consolidations and air bronchograms. Although a deeper view to assess for B-lines would be more optimal, these findings together suggest moderate airspace disease, most commonly on the basis of pneumonia.
Case 3 (Fig. 9c). This appears to be an image of lung pleura at depth
of ~5
Our expert clinician findings and observations confirmed the existence of identifiers and indicators of disease in the COVIDx-US dataset. AI-powered analytics solutions can exploit such indicators and patterns to monitor and classify COVID-19 cases. Based on our contributing clinician’s evolving experience, LUS has significant utility in the management of COVID-19 patients with respiratory symptoms. As a safe, rapid, reproducible, low-cost, and highly informative tool for assessing the severity of lung involvement, early studies suggest that it can be used to inform triage and treatment decisions [45]. To this end, several published LUS-based protocols are now undergoing validation in prospective clinical trials [46, 47]. Furthermore, several groups are now evaluating the potential utility of LUS in other settings, including the ICU where it could be used to track disease progression, and to evaluate patient candidacy and clinical response to various interventions including ventilator weaning, prone positioning, and lung recruitment maneuvers in patients with acute respiratory distress syndrome (ARDS) [40].
The known limitations of this modality include the observation that LUS findings are not necessarily specific to COVID-19. Moreover, they have yet to be proven as reliable markers of clinical outcome in appropriately sized clinical studies. The deployment of LUS in COVID-19 also requires strict infection control measures. Lastly, LUS requires significant operator training and experience before it can be used in the management of potentially unstable patients, or in those with suspected infectious syndromes. AI-driven solutions can aid clinicians with the screening process of COVID-19 patients, reducing the pressure on healthcare systems and healthcare providers.
We are constantly searching for more data, therefore, the COVIDx-US will be growing over time as more data sources become available. Since the initial release of the COVIDx-US dataset in January 2021 we have released five versions, regularly increasing the size of the dataset, adding more metadata, and collecting data from more publicly available data sources, going from 93 ultrasound videos collected from 4 sources in the first version to 173 videos collected from 9 data sources in the latest version, all verified and graded by our contributing clinician (A.F.). We recommend that users check the COVIDx-US repository frequently, for the latest version of data and scripts. The data collection and processing pipeline is coded in Python (version 3.6.12). Users are provided with a Python notebook including all the steps required to collect, process, and integrate data, as described in the manuscript. The provided scripts are well-documented allowing users to modify parameters for frame extraction from ultrasound videos, based on their research objectives and requirements, if required.
Our goal is to encourage broad adoption and contribution to this initiative. The COVIDx-US dataset is an open-source open-access initiative under the terms of the GNU Affero General Public License 3.0. All the codes and materials, e.g., metadata and masks, necessary to reproduce the COVIDx-US dataset, as described and explained in this manuscript, are available to the general public at https://github.com/nrc-cnrc/COVID-US/, accessible with no restrictions. The scripts were coded in Python programming language (version 3.6.12), using pandas 1.1.3, selenium 3.141.0, and requests 2.24.0 libraries.
To the best of the authors’ knowledge, COVIDx-US is the first and largest open-access “fully-curated” benchmark LUS imaging dataset that contains a unified and standardized human lung ultrasound score. The dataset can be used in AI research for use cases such as classifying COVID-19 cases and assessing the severity of the disease. We would like to highlight that the dataset is not envisioned to be used to build fully-automated AI-enabled diagnostic solutions. This reproducible, easy-to-use, and easy-to-scale dataset benefits from a well-documented modular design, created specifically for tackling AI challenges and facilitating the building and evaluation of AI-driven analytics solutions to help clinicians with the screening process of COVID-19 patients, reducing the pressure on healthcare systems and healthcare providers.
One of the main contributions of our work is a systematic framework for data curation, data processing, and data validation to dataset creation for creating a unified, standardized POCUS dataset. We also tried our best to design our systematic framework to be very easy-to-use and easy-to-scale, even for users without deep computer science/programming knowledge, and hope the availability of this framework will contribute to the community by making it easier to scale and expand such datasets in a semi-automated manner. Finally, the COVIDx-US contains a unified and standardized human lung ultrasound score that could not only be used for further validation/evaluation of the algorithms/models trained on the dataset but also enables more AI-driven analytics research directions.
Motivated by recent open-source research efforts in the fight against COVID-19 and to support alternative screening, risk stratification, and treatment planning solutions powered by AI and advanced analytics, in this manuscript, we introduced COVIDx-US, an open-access benchmark dataset of ultrasound imaging data that was carefully curated from nine data sources and integrated systematically specifically for facilitating the building and evaluation of AI-driven analytics algorithms and models. One may note that the LUS patterns are unspecific and are not able to differentiate COVID-19 pneumonia with other pathologies and diagnosis of COVID-19 may not be possible by only exploiting LUS data. Therefore, users are encouraged to use the COVIDx-US dataset to build AI-powered solutions able to estimate lung conditions based on LUS patterns. The COVIDx-US comes with a wide range of metadata per video file, from patient demographics and symptoms to a standardized and unified lung ultrasound score. The dataset will grow regularly as more data sources become available. Users are encouraged to check the COVIDx-US repository frequently, for the latest version of the dataset.
Although the COVIDx-US has created a rich archive of clinically relevant imaging for AI applications by including collected and integrated data from multiple sources that were publicly available on different platforms/portals, this imaging dataset does not include the original DICOM files. This is an important limitation, as DICOM (Digital Imaging and Communications in Medicine) is an established standard used by most clinical institutions [48], and is superior to other types of digital images, e.g., JPEG, that are commonly used by the computer science research/community. We believe that clinical data such as hospital admission or the need for invasive ventilation could be used to validate the correlation between the LUSS classification and clinical outcomes. In addition, one may note that pneumonia patterns of consolidation in viral diseases are characteristic; however, US alone cannot distinguish between different pathogens at this stage. Each single lung zone analyzed independently is not specific enough for a COVID-19 diagnosis and clinical elements are still necessary to confirm the presence of the disease. Since COVIDx-US integrates multiple publicly available data sources, there is no guarantee that all the collected data followed the same capturing procedure as we did not have access to such information. Obtaining a complete 12 lung zone ultrasound for each patient would permit to calculate a total LUSS which is a better reflection of an individual’s clinical state and possible outcomes compared to the clinical information obtained from the scanning of a single lung zone. Our data set does not allow us at the current time to carry out such comparisons. As a future direction, the team is now working on a protocol for a new study to capture ultrasound images/videos in a standardized manner from a set of consented participants. This would minimize the possible impact of different LUS imaging protocols on the built AI models [49]. To this end, we welcome all researchers, institutes, and hospitals who would like to contribute data, in any format. Please contact the corresponding author in this regard.
Clinical phenotypes of disease presentation have changed with the appearance of
multiple SARS COV-2 variants as well as with the massive vaccine uptake into the
population. It is possible that lung involvement in COVID-19 disease could change
to a milder spectrum in this population and as such the use of lung ultrasound
would be less relevant in prioritizing the need for admission. The distribution
of LUSS would also likely skew to scores of 0 or 1 as milder disease would be
present. However, LUS could still be used to monitor for worsening disease in
those patients who are admitted based on local medical protocols. Despite all the
advantages of POCUS devices, e.g., high portability, accessibility, and
ease-of-use, interpreting ultrasound images and videos is a challenging task
(even for radiologists) that requires well-defined instructions to standardize
the interpretation [38]. Given the need for expert radiologists for interpreting
POCUS examinations and the scarcity of them, especially in resource-limited
regions, AI-powered solutions can accelerate the screening process. We
believe
accurate AI-driven solutions can be built on the digital images provided in the
COVIDx-US dataset. In our very recent study [50], we built and introduced a
highly efficient, self-attention deep convolutional neural network model using
COVIDx-US v1.3. The model that is highly tailored for COVID-19 screening achieved
an AUC of over 0.98 while achieving 353
AI, artificial intelligence; DL, deep learning; RT-PCR, reverse transcription-polymerase chain reaction; CXR, chest x-ray; CT, computed tomography; POCUS, point-of-care ultrasound; ARDS, acute respiratory distress syndrome; LUS, lung ultrasound; LUSS, lung ultrasound score; TPA, the pocus atlas; GM, grepmed; BN, butterfly network; LITFL, life in the fast lane; RP, radiopaedia; CU, core ultrasound; UF, University of Florida; Paper, scientific publications; CL, clarius.
AW and AE designed and conceptualized the work and the pipeline. AE and AM implemented the pipeline. AE collected the data. AE and AM processed the data. AF reviewed the video files and provided the lung ultrasound score. SK and AF performed clinical validation. AE, AM, PX, ST and AW performed technical validation. AE, AM, AF and SK performed quality control. All authors wrote and reviewed the manuscript.
The study has received ethics clearance from the University of Waterloo (42235). Written informed consent was not required from the patients to participate in this study as COVIDx-US integrates data from public data sources that are available on the web and no data was directly collected from patients, as part of this study.
The authors would like to offer their special thanks to Mr. Patrick Paul (National Research Council Canada) for his help and support during this project.
This research received no external funding.
The authors declare no conflict of interest.
Table 2 shows the list of ultrasound video files included in COVIDx-US v1.5. as well as their properties and the number of frames extracted using the default parameters. You may find below the description of the abbreviations used in the table header:
• Src: Data source.
• Prb: Probe type.
• Org. dimension: Dimension of the original file.
• Fnl. dimension: Dimension of the final processed file.
• #Fr: Number of frames.
| No | Filename | Type | Src | Prb | Class | Org. dimension | Fnl. dimension | #Fr |
| 1 | 1_butterfly_covid | Mp4 | BN | Con | COVID-19 | 880 |
820 |
64 |
| 2 | 2_butterfly_covid | Mp4 | BN | Con | COVID-19 | 720 |
624 |
158 |
| 3 | 3_butterfly_covid | Mp4 | BN | Con | COVID-19 | 1928 |
1055 |
90 |
| 4 | 4_butterfly_covid | Mp4 | BN | Con | COVID-19 | 880 |
820 |
108 |
| 5 | 6_butterfly_covid | Mp4 | BN | Con | COVID-19 | 720 |
642 |
169 |
| 6 | 7_butterfly_covid | Mp4 | BN | Con | COVID-19 | 880 |
820 |
125 |
| 7 | 8_butterfly_covid | Mp4 | BN | Con | COVID-19 | 880 |
820 |
109 |
| 8 | 9_butterfly_covid | Mp4 | BN | Con | COVID-19 | 1928 |
1055 |
80 |
| 9 | 10_butterfly_covid | Mp4 | BN | Con | COVID-19 | 736 |
640 |
147 |
| 10 | 11_butterfly_covid | Mp4 | BN | Con | COVID-19 | 624 |
544 |
114 |
| 11 | 12_butterfly_covid | Mp4 | BN | Con | COVID-19 | 880 |
820 |
111 |
| 12 | 13_butterfly_covid | Mp4 | BN | Con | COVID-19 | 880 |
820 |
91 |
| 13 | 14_butterfly_covid | Mp4 | BN | Con | COVID-19 | 880 |
820 |
103 |
| 14 | 15_butterfly_covid | Mp4 | BN | Con | COVID-19 | 1928 |
1055 |
87 |
| 15 | 16_butterfly_covid | Mp4 | BN | Con | COVID-19 | 720 |
634 |
202 |
| 16 | 17_butterfly_covid | Mp4 | BN | Con | COVID-19 | 1928 |
1055 |
76 |
| 17 | 18_butterfly_covid | Mp4 | BN | Con | COVID-19 | 880 |
820 |
101 |
| 18 | 19_butterfly_covid | Mp4 | BN | Con | COVID-19 | 880 |
820 |
81 |
| 19 | 20_butterfly_normal | Mp4 | BN | Con | Normal | 720 |
594 |
142 |
| 20 | 21_butterfly_normal | Mp4 | BN | Con | Normal | 880 |
820 |
99 |
| 21 | 23_grepmed_pneumonia | Mp4 | GM | Lin | Non-COVID-19 | 816 |
408 |
252 |
| 22 | 24_grepmed_covid | Mp4 | GM | Con | COVID-19 | 960 |
500 |
225 |
| 23 | 25_grepmed_pneumonia | Mp4 | GM | Con | Non-COVID-19 | 1280 |
665 |
300 |
| 24 | 26_grepmed_covid | Mp4 | GM | Con | COVID-19 | 720 |
382 |
70 |
| 25 | 27_grepmed_pneumonia | Mp4 | GM | Con | Non-COVID-19 | 480 |
345 |
91 |
| 26 | 28_grepmed_normal | Mp4 | GM | Lin | Normal | 302 |
302 |
39 |
| 27 | 29_grepmed_covid | Mp4 | GM | Lin | COVID-19 | 600 |
315 |
75 |
| 28 | 30_grepmed_covid | Mp4 | GM | Con | COVID-19 | 800 |
625 |
69 |
| 29 | 31_grepmed_covid | Mp4 | GM | Con | COVID-19 | 720 |
608 |
365 |
| 30 | 32_grepmed_pneumonia | Mp4 | GM | Lin | Non-COVID-19 | 816 |
300 |
302 |
| 31 | 33_grepmed_covid | Mp4 | GM | Lin | COVID-19 | 960 |
435 |
116 |
| 32 | 34_grepmed_pneumonia | Mp4 | GM | Con | Non-COVID-19 | 800 |
550 |
458 |
| 33 | 35_grepmed_covid | Mp4 | GM | Con | COVID-19 | 720 |
595 |
361 |
| 34 | 36_grepmed_normal | Mp4 | GM | Con | Normal | 720 |
540 |
85 |
| 35 | 37_grepmed_pneumonia | Mp4 | GM | Con | Non-COVID-19 | 962 |
653 |
187 |
| 36 | 38_grepmed_pneumonia | Mp4 | GM | Con | Non-COVID-19 | 800 |
540 |
300 |
| 37 | 39_grepmed_normal | Mp4 | GM | Lin | Normal | 1280 |
600 |
157 |
| 38 | 41_grepmed_pneumonia | Mp4 | GM | Con | Non-COVID-19 | 600 |
386 |
151 |
| 39 | 42_grepmed_covid | Mp4 | GM | Con | COVID-19 | 640 |
435 |
159 |
| 40 | 43_litfl_pneumonia | Mp4 | LITFL | Con | Non-COVID-19 | 720 |
540 |
115 |
| 41 | 49_pocusatlas_covid | Gif | TPA | Con | COVID-19 | 600 |
282 |
76 |
| 42 | 50_pocusatlas_covid | Gif | TPA | Con | COVID-19 | 600 |
282 |
83 |
| 43 | 51_pocusatlas_covid | Gif | TPA | Con | COVID-19 | 600 |
528 |
40 |
| 44 | 52_pocusatlas_covid | Gif | TPA | Con | COVID-19 | 600 |
528 |
40 |
| 45 | 53_pocusatlas_covid | Gif | TPA | Con | COVID-19 | 598 |
400 |
41 |
| 46 | 54_pocusatlas_covid | Gif | TPA | Con | COVID-19 | 590 |
420 |
39 |
| 47 | 55_pocusatlas_covid | Gif | TPA | Lin | COVID-19 | 600 |
315 |
75 |
| 48 | 56_pocusatlas_covid | Gif | TPA | Con | COVID-19 | 600 |
410 |
30 |
| 49 | 57_pocusatlas_covid | Gif | TPA | Lin | COVID-19 | 493 |
265 |
32 |
| 50 | 58_pocusatlas_covid | Gif | TPA | Con | COVID-19 | 600 |
450 |
30 |
| 51 | 60_pocusatlas_covid | Gif | TPA | Con | COVID-19 | 600 |
384 |
30 |
| 52 | 61_pocusatlas_covid | Gif | TPA | Con | COVID-19 | 600 |
472 |
21 |
| 53 | 62_pocusatlas_normal | Gif | TPA | Con | Normal | 492 |
376 |
60 |
| 54 | 63_pocusatlas_covid | Gif | TPA | Lin | COVID-19 | 440 |
318 |
137 |
| 55 | 64_pocusatlas_pneumonia | Gif | TPA | Con | Non-COVID-19 | 394 |
348 |
59 |
| 56 | 66_pocusatlas_covid | Gif | TPA | Con | COVID-19 | 309 |
299 |
41 |
| 57 | 67_pocusatlas_covid | Gif | TPA | Lin | COVID-19 | 299 |
299 |
183 |
| 58 | 68_pocusatlas_pneumonia | Gif | TPA | Con | Non-COVID-19 | 282 |
282 |
30 |
| 59 | 69_pocusatlas_pneumonia | Gif | TPA | Con | Non-COVID-19 | 600 |
440 |
40 |
| 60 | 70_pocusatlas_pneumonia | Gif | TPA | Con | Non-COVID-19 | 324 |
249 |
30 |
| 61 | 71_pocusatlas_normal | Gif | TPA | Con | Normal | 600 |
450 |
59 |
| 62 | 73_pocusatlas_covid | Gif | TPA | Con | COVID-19 | 439 |
407 |
46 |
| 63 | 74_pocusatlas_covid | Gif | TPA | Con | COVID-19 | 463 |
463 |
46 |
| 64 | 76_pocusatlas_normal | Gif | TPA | Con | Normal | 600 |
338 |
60 |
| 65 | 77_pocusatlas_normal | Gif | TPA | Con | Normal | 237 |
237 |
60 |
| 66 | 78_pocusatlas_normal | Gif | TPA | Lin | Normal | 480 |
260 |
109 |
| 67 | 79_pocusatlas_pneumonia | Gif | TPA | Con | Non-COVID-19 | 442 |
309 |
31 |
| 68 | 80_pocusatlas_pneumonia | Gif | TPA | Con | Non-COVID-19 | 198 |
197 |
30 |
| 69 | 81_butterfly_covid | Mp4 | BN | Con | COVID-19 | 760 |
656 |
243 |
| 70 | 82_butterfly_covid | Mp4 | BN | Con | COVID-19 | 760 |
656 |
52 |
| 71 | 83_butterfly_covid | Mp4 | BN | Con | COVID-19 | 632 |
558 |
76 |
| 72 | 84_butterfly_covid | Mp4 | BN | Con | COVID-19 | 624 |
544 |
114 |
| 73 | 86_butterfly_covid | Mp4 | BN | Con | COVID-19 | 760 |
656 |
287 |
| 74 | 87_butterfly_covid | Mp4 | BN | Con | COVID-19 | 736 |
640 |
177 |
| 75 | 88_butterfly_covid | Mp4 | BN | Con | COVID-19 | 760 |
658 |
107 |
| 76 | 89_butterfly_covid | Mp4 | BN | Con | COVID-19 | 736 |
640 |
179 |
| 77 | 90_butterfly_covid | Mp4 | BN | Con | COVID-19 | 760 |
656 |
145 |
| 78 | 92_butterfly_covid | Mp4 | BN | Con | COVID-19 | 736 |
642 |
113 |
| 79 | 93_butterfly_covid | Mp4 | BN | Con | COVID-19 | 736 |
642 |
109 |
| 80 | 94_butterfly_covid | Mp4 | BN | Con | COVID-19 | 760 |
658 |
300 |
| 81 | 95_litfl_other | Mp4 | LITFL | Lin | Other | 480 |
360 |
45 |
| 82 | 96_litfl_other | Mp4 | LITFL | Lin | Other | 480 |
360 |
42 |
| 83 | 100_litfl_other | Mp4 | LITFL | Con | Other | 480 |
360 |
46 |
| 84 | 108_litfl_other | Mp4 | LITFL | Con | Other | 480 |
360 |
43 |
| 85 | 114_litfl_other | Mp4 | LITFL | Con | Other | 480 |
360 |
46 |
| 86 | 115_litfl_other | Mp4 | LITFL | Con | Other | 480 |
360 |
28 |
| 87 | 122_litfl_pneumonia | Mp4 | LITFL | Con | Non-COVID-19 | 480 |
360 |
42 |
| 88 | 123_litfl_pneumonia | Mp4 | LITFL | Con | Non-COVID-19 | 480 |
360 |
36 |
| 89 | 124_litfl_pneumonia | Mp4 | LITFL | Lin | Non-COVID-19 | 480 |
355 |
36 |
| 90 | 127_litfl_pneumonia | Mp4 | LITFL | Con | Non-COVID-19 | 480 |
360 |
24 |
| 91 | 128_litfl_pneumonia | Mp4 | LITFL | Con | Non-COVID-19 | 480 |
360 |
32 |
| 92 | 129_litfl_pneumonia | Mp4 | LITFL | Con | Non-COVID-19 | 480 |
360 |
25 |
| 93 | 130_litfl_pneumonia | Mp4 | LITFL | Con | Non-COVID-19 | 480 |
360 |
41 |
| 94 | 131_litfl_pneumonia | Mp4 | LITFL | Con | Non-COVID-19 | 480 |
360 |
26 |
| 95 | 132_litfl_pneumonia | Mp4 | LITFL | Con | Non-COVID-19 | 480 |
360 |
27 |
| 96 | 133_litfl_other | Mp4 | LITFL | Lin | Other | 480 |
360 |
46 |
| 97 | 134_litfl_other | Mp4 | LITFL | Lin | Other | 480 |
355 |
46 |
| 98 | 135_litfl_normal | Mp4 | LITFL | Lin | Normal | 480 |
360 |
36 |
| 99 | 136_litfl_other | Mp4 | LITFL | Lin | Other | 480 |
360 |
36 |
| 100 | 137_litfl_other | Mp4 | LITFL | Lin | Other | 480 |
330 |
46 |
| 101 | 138_litfl_normal | Mp4 | LITFL | Lin | Normal | 480 |
360 |
46 |
| 102 | 139_litfl_normal | Mp4 | LITFL | Lin | Normal | 480 |
384 |
26 |
| 103 | 140_litfl_other | Mp4 | LITFL | Lin | Other | 480 |
365 |
27 |
| 104 | 142_litfl_other | Mp4 | LITFL | Lin | Other | 480 |
340 |
34 |
| 105 | 143_litfl_other | Mp4 | LITFL | Lin | Other | 480 |
360 |
38 |
| 106 | 144_litfl_other | Mp4 | LITFL | Lin | Other | 480 |
360 |
46 |
| 107 | 145_litfl_other | Mp4 | LITFL | Con | Other | 480 |
360 |
45 |
| 108 | 146_litfl_other | Mp4 | LITFL | Con | Other | 480 |
360 |
45 |
| 109 | 150_litfl_other | Mp4 | LITFL | Con | Other | 480 |
360 |
28 |
| 110 | 151_litfl_pneumonia | Mp4 | LITFL | Con | Non-COVID-19 | 480 |
360 |
42 |
| 111 | 152_radio_normal | Mp4 | RP | Con | Normal | 314 |
270 |
131 |
| 112 | 153_radio_pneumonia | Mp4 | RP | Con | Non-COVID-19 | 338 |
306 |
223 |
| 113 | 158_core_pneumonia | Mp4 | CU | Con | Non-COVID-19 | 1920 |
730 |
181 |
| 114 | 159_core_other | Mp4 | CU | Con | Other | 1920 |
925 |
180 |
| 115 | 160_core_other | Mp4 | CU | Con | Other | 1920 |
995 |
180 |
| 116 | 161_core_other | Mp4 | CU | Lin | Other | 1920 |
1010 |
224 |
| 117 | 162_core_other | Mp4 | CU | Lin | Other | 1920 |
900 |
224 |
| 118 | 163_core_other | Mp4 | CU | Con | Other | 792 |
470 |
182 |
| 119 | 164_core_normal | Mp4 | CU | Lin | Normal | 792 |
465 |
150 |
| 120 | 165_core_other | Mp4 | CU | Lin | Other | 792 |
460 |
179 |
| 121 | 166_core_other | Mp4 | CU | Con | Other | 792 |
470 |
181 |
| 122 | 167_core_other | Mp4 | CU | Lin | Other | 792 |
460 |
121 |
| 123 | 168_core_other | Mp4 | CU | Lin | Other | 792 |
460 |
181 |
| 124 | 169_core_other | Mp4 | CU | Con | Other | 792 |
470 |
180 |
| 125 | 170_core_pneumonia | Mp4 | CU | Con | Non-COVID-19 | 792 |
470 |
182 |
| 126 | 171_core_pneumonia | Mp4 | CU | Lin | Non-COVID-19 | 792 |
460 |
179 |
| 127 | 172_core_other | Mp4 | CU | Con | Other | 792 |
470 |
167 |
| 128 | 173_core_other | Mp4 | CU | Lin | Other | 792 |
420 |
150 |
| 129 | 174_core_covid | Mp4 | CU | Con | COVID-19 | 1920 |
800 |
77 |
| 130 | 175_uf_normal | Mp4 | UF | Con | Normal | 800 |
480 |
38 |
| 131 | 176_uf_normal | Wmv | UF | Con | Normal | 800 |
512 |
38 |
| 132 | 177_uf_normal | Wmv | UF | Con | Normal | 800 |
528 |
38 |
| 133 | 178_uf_other | Mp4 | UF | Con | Other | 1276 |
1276 |
407 |
| 134 | 179_uf_other | Wmv | UF | Con | Other | 800 |
528 |
407 |
| 135 | 180_uf_normal | Wmv | UF | Con | Normal | 800 |
528 |
77 |
| 136 | 181_uf_other | Wmv | UF | Con | Other | 800 |
528 |
77 |
| 137 | 185_uf_other | Mp4 | UF | Con | Other | 800 |
528 |
48 |
| 138 | 186_uf_other | Wmv | UF | Con | Other | 800 |
528 |
48 |
| 139 | 187_uf_other | Mp4 | UF | Lin | Other | 480 |
296 |
44 |
| 140 | 190_uf_normal | Wmv | UF | Con | Normal | 800 |
528 |
102 |
| 141 | 191_uf_normal | Wmv | UF | Con | Normal | 800 |
543 |
102 |
| 142 | 192_uf_other | Mp4 | UF | Lin | Other | 800 |
545 |
44 |
| 143 | 199_paper_covid | Mp4 | Paper | Con | COVID-19 | 640 |
466 |
209 |
| 144 | 200_paper_covid | Avi | Paper | Con | COVID-19 | 640 |
466 |
65 |
| 145 | 201_paper_covid | Mov | Paper | Con | COVID-19 | 1068 |
680 |
65 |
| 146 | 202_paper_covid | Mov | Paper | Con | COVID-19 | 1068 |
680 |
65 |
| 147 | 203_paper_covid | Mov | Paper | Con | COVID-19 | 1068 |
680 |
65 |
| 148 | 204_paper_covid | Mov | Paper | Con | COVID-19 | 1068 |
680 |
65 |
| 149 | 205_paper_covid | Mov | Paper | Con | COVID-19 | 1068 |
680 |
65 |
| 150 | 206_paper_normal | Mp4 | Paper | Con | Normal | 800 |
600 |
120 |
| 151 | 207_paper_normal | Mp4 | Paper | Lin | Normal | 800 |
600 |
117 |
| 152 | 208_paper_normal | Mp4 | Paper | Lin | Normal | 428 |
418 |
90 |
| 153 | 209_paper_other | Mp4 | Paper | Lin | Other | 800 |
250 |
117 |
| 154 | 212_paper_other | Mp4 | Paper | Con | Other | 800 |
600 |
119 |
| 155 | 213_paper_other | Mp4 | Paper | Con | Other | 800 |
600 |
121 |
| 156 | 215_paper_other | Mp4 | Paper | Con | Other | 800 |
600 |
120 |
| 157 | 217_clarius_normal | Mp4 | CL | Con | Normal | 886 |
886 |
241 |
| 158 | 218_clarius_covid | Gif | CL | Con | COVID-19 | 600 |
400 |
104 |
| 159 | 219_clarius_covid | Gif | CL | Lin | COVID-19 | 600 |
600 |
32 |
| 160 | 220_clarius_covid | Gif | CL | Con | COVID-19 | 600 |
400 |
118 |
| 161 | 222_clarius_other | Mp4 | CL | Con | Other | 436 |
436 |
74 |
| 162 | 223_clarius_other | Mp4 | CL | Con | Other | 436 |
436 |
74 |
| 163 | 224_clarius_normal | Mp4 | CL | Con | Normal | 436 |
436 |
74 |
| 164 | 225_clarius_other | Mp4 | CL | Con | Other | 436 |
436 |
74 |
| 165 | 226_clarius_other | Mp4 | CL | Con | Other | 554 |
554 |
481 |
| 166 | 227_clarius_other | Mp4 | CL | Con | Other | 554 |
554 |
481 |
| 167 | 228_clarius_other | Mp4 | CL | Con | Other | 554 |
554 |
481 |
| 168 | 229_clarius_pneumonia | Mp4 | CL | Con | Non-COVID-19 | 800 |
458 |
188 |
| 169 | 231_clarius_pneumonia | Mp4 | CL | Con | Non-COVID-19 | 800 |
458 |
482 |
| 170 | 236_clarius_normal | Mp4 | CL | Con | Normal | 800 |
482 |
365 |
| 171 | 238_clarius_other | Mp4 | CL | Con | Other | 552 |
552 |
75 |
| 172 | 239_paper_normal | Avi | Paper | Con | Normal | 720 |
512 |
75 |
| 173 | 243_paper_other | Avi | Paper | Con | Other | 720 |
512 |
252 |
References
Publisher’s Note: IMR Press stays neutral with regard to jurisdictional claims in published maps and institutional affiliations.