
Academic Editors: Guoyao Wu and Graham Pawelec
The purpose of this review is to consider the distinct possibility that dietary
non-bound and protein-bound amino acids are not bioequivalent in broiler
chickens. Usually, with conservative inclusions of a limited number of non-bound
(synthetic, crystalline, feed-grade) amino acids in standard broiler diets,
bioequivalency would not be an issue. However, reduced-crude protein (CP) broiler
diets demand substantial inclusions of an extended range of non-bound amino acids
to meet amino acid requirements. A standard diet may contain 5.0 g/kg non-bound
amino acids, but a reduced-CP diet may contain up to 50 g/kg and this relative
abundance skews the balance of non-bound to protein-bound amino acids and
substantial proportions of certain amino acids are present in diets as non-bound
entities. Importantly, tangible reductions in dietary CP, for example from 210 to
160 g/kg, usually both compromise broiler growth performance and increase fat
deposition. Compromised growth performance is more evident in wheat- than
maize-based diets but, paradoxically, fat deposition is more apparent in
maize-based diets. The inability of birds to accommodate tangible dietary CP
reductions appears to stem partially from the lack of bioequivalency between
non-bound and protein-bound amino acids because of the differentials in
intestinal uptake rates. Also, reduced-CP broiler diets generate perturbations in
apparent amino acid digestibility coefficients which compound the fact that
intestinal uptakes of non-bound acid acids are more rapid, and occur more
anteriorly in the small intestine, than protein-bound amino acids. The likelihood
is that greater proportions of non-bound amino acids transit the enterocytes of
the gut mucosa without entering anabolic and/or catabolic pathways to gain entry
to the portal circulation. This culminates in post-enteral amino acid imbalances
and postprandial oxidation of surplus amino acids which involves deamination of
amino acids and elevations in plasma ammonia (NH
The global demand for chicken-meat is increasing. Globally, poultry meat is
expected to represent 41% of all the protein from meat sources in 2030 and
exceed the 34% share for pig meat, 20% for beef and 5% for sheep meat [1]. In
Australia, the 46.9 kg per capita chicken-meat consumption in 2021/22 is clearly
superior to pork (27.7 kg), beef (19.1 kg) and lamb (5.5 kg) with a 47.3% market
share [2]. To meet this high consumption, Australian broiler operations processed
678 million birds and produced 1.295 million tonnes of chicken-meat in 2021/22
[2]. It is relevant that poultry has the best conversion rate of feed to human
food and the smallest environmental footprint in terms of energy and water use
per kg meat produced amongst terrestrial animals [3]. Accordingly, it has been
predicted that chicken-meat production generated 7.1% of greenhouse gas
emissions (as CO
Thus, the importance of sustainable chicken-meat production is clearly visible. The development and acceptance of reduced-crude protein (CP) diets for broiler chickens would certainly promote more sustainable chicken-meat production [7], but it is also a highly challenging mission [8]. Usually, reductions in dietary CP are achieved by increasing feed grain inclusions, typically maize or wheat, at the expense of soybean meal and targeted amino acid requirements are then met by inclusions of a range of non-bound (synthetic, crystalline) amino acids. When average values are taken from the three studies [9, 10, 11], dietary CP was reduced from 206 to 162 g/kg, non-bound amino acid inclusions were increased from 5.3 to 22.8 g/kg. Collectively, the 44 g/kg dietary CP reduction depressed weight gain by 2.40% (1913 versus 1960 g/bird), compromised FCR by 4.92% (1.600 versus 1.525) and increased relative abdominal fat-pad weights by 71.4% (13.44 versus 7.84 g/kg). However, the 44 g/kg dietary CP reduction generated a 48.2% decline in soybean meal inclusions from 330 g/kg to 171 g/kg, which illustrates the potential reduced-CP broiler diets hold for diminishing the dependence of the global chicken-meat industry on, in many countries, imported soybean meal. A reduced dependence on soybean meal by the global chicken-meat industry would attenuate neotropical deforestation in South America to harvest soybeans [12], which would be an additional environmental advantage.
The advantages of reduced-CP broiler diets are not restricted to a diminished
requirement for soybean meal. They extend to reductions in nitrogen (N) excretion
and ammonia (NH
Dietary CP of either maize- or wheat-based diets were reduced in a stepwise manner from 222 to 165 g/kg in Chrystal et al. [19]. Consequently, non-bound amino acid inclusions increased from 7.23 to 38.49 g/kg in maize-based diets but from 7.50 to 49.39 g/kg in wheat-based diets. This marked difference is due to the higher protein content of wheat. The performance of birds offered reduced-CP, maize-based diets was clearly superior to their wheat-based counterparts and in this, and several other of our studies, there are indications that non-bound amino acid inclusions may become excessive and compromise growth performance. Synthetic and crystalline (or non-bound) amino acids may be regarded as alternatives to soybean meal [20], but there appears to be an implicit assumption that protein-bound amino acids in protein meals and feed grains and non-bound amino acids are bioequivalent; our contention is that this may not be the case. This contention is supported, albeit in pigs [21], as it was reported that non-bound lysine and threonine are absorbed more rapidly than protein-bound lysine and threonine in pigs fed once daily, based on the net portal plasma concentrations of these amino acids. Also, plasma amino acid responses in human subjects following ingestion of either protein-bound amino acids (cottage cheese) or an equivalent blend of 15 non-bound amino acids have been compared [22]. Plasma amino acid concentrations derived from non-bound amino acids were both higher and peaked in a shorter post-prandial time interval than protein-bound amino acids. Therefore, the purpose of this review is to consider the bioequivalence of amino acids in diets for broiler chickens, as a better comprehension of this issue could accelerate the development and acceptance of reduced-CP broiler diets.
Amino acid requirements for broiler chickens are routinely expressed as ‘ideal amino acid ratios’ (or ‘ideal protein ratios’) where the requirements for digestible amino acids are expressed as ratios relative to lysine (100). The most comprehensive recommendation for ideal amino acid ratios has been documented by Wu [23] as it covers both essential and the so-called non-essential amino acids. Perhaps the first recommendation was advanced by Dean and Scott [24] and, over the intervening 50 years, the biggest increases across the essential amino acids apply to histidine, threonine and arginine when the two sets of recommendations are compared. Diligent research has been devoted to the complex task of identifying individual amino acid requirements for broiler chickens, which is ongoing. This quest has been reviewed [25], where ten sets of ideal amino acid ratios are documented. However, relative to pigs, amino acid requirements may be complicated by feathering in poultry. Feathers accounted for 9.7% of the bodyweight of 21 day-old male broilers [26] and serine, glycine and proline were the most prevalent amino acids in the 931 g/kg protein content of feathers [27]. The partitioning of amino acids towards either feathering or skeletal muscle deposition becomes a complicating factor [28].
The use of ideal amino acid ratios is an integral part of the least-cost formulation of diets for broiler chickens; nevertheless, there are few reported studies where different sets of ideal amino acid ratios have been compared. However, three comparative studies [29, 30, 31] have been identified and all three studies reported tangible differences in growth performance in response to the various ratios investigated. There is the real possibility that ideal amino acid ratios that are appropriate in standard protein diets are not equally suitable in reduced-CP diets. In a fourth comparison [32], two sets of ideal protein ratios (Ratios A and B) were compared in broilers offered wheat-based diets with CP contents of either 210 or 180 g/kg from 14 to 35 days post-hatch. A treatment interaction (p = 0.007) was observed for FCR. Ratio B was superior in 210 g/kg CP diets as it supported a 4.17% (1.424 versus 1.486) more efficient FCR, whereas Ratio A supported an advantage in FCR of 3.19% (1.580 versus 1.632) in 180 g/kg CP diets. Similar treatment interactions were observed for weight gain (p = 0.039) and relative fat-pad weights (p = 0.022). These outcomes are a clear indication that the ideal amino acid ratio in a reduced-CP diet is almost certainly not appropriate for a standard protein diet and highlights the issue of the bioequivalence of amino acids and their capacity to meet requirements satisfactorily.
The apparent digestibility coefficients of amino acids merit consideration because dietary CP reductions generate perturbations in apparent digestibility coefficients and the likelihood is that this aspect has been overlooked in the quest to develop reduced-CP diets. Moreover, these fluctuations in digestibilities effectively impact on the bioequivalence of amino acids. Therefore, the impacts of dietary CP reductions in amino acid digestibility assays from nine broiler studies completed in Australia based on either maize-based or wheat-based diets are summarised in Tables 1a,1b, (Ref. [9, 10, 11, 19, 33]) and 2a,2b, (Ref. [19, 27, 34, 35, 36]), respectively, where substantial variations are clearly evident.
| Reference | Moss et al. [33] | Chrystal et al. [9] | Chrystal et al. [10] | Chrystal et al. [11] | Chrystal et al. [19] | ||||||||||
| CP (g/kg) | 213 | 172 | Diff. | 210 | 165 | Diff. | 200 | 156 | Diff. | 208 | 165 | Diff. | 222 | 165 | Diff. |
| Amino acid | |||||||||||||||
| Arginine | 0.873 | 0.809 | –7.33 | 0.819 | 0.862 | 5.25 | 0.857 | 0.925 | 7.93 | 0.883 | 0.875 | –0.91 | 0.849 | 0.899 | 5.89 |
| Histidine | 0.839 | 0.768 | –8.46 | 0.781 | 0.813 | 4.10 | 0.793 | 0.820 | 3.40 | 0.818 | 0.787 | –3.79 | 0.809 | 0.849 | 4.94 |
| Isoleucine | 0.835 | 0.743 | –11.02 | 0.731 | 0.806 | 10.26 | 0.797 | 0.866 | 8.66 | 0.785 | 0.809 | 3.06 | 0.785 | 0.696 | –11.34 |
| Leucine | 0.827 | 0.733 | –11.37 | 0.744 | 0.798 | 7.26 | 0.802 | 0.837 | 4.36 | 0.804 | 0.791 | –1.62 | 0.803 | 0.853 | 6.23 |
| Lysine | 0.849 | 0.809 | –4.71 | 0.784 | 0.830 | 5.87 | 0.808 | 0.858 | 6.19 | 0.836 | 0.845 | 1.08 | 0.808 | 0.747 | –7.55 |
| Methionine | 0.921 | 0.895 | –2.82 | 0.844 | 0.878 | 4.03 | 0.669 | 0.811 | 21.23 | 0.803 | 0.841 | 4.73 | 0.885 | 0.887 | 0.23 |
| Phenylalanine | 0.834 | 0.742 | –11.03 | 0.771 | 0.802 | 4.02 | 0.787 | 0.800 | 1.65 | 0.843 | 0.773 | –8.30 | |||
| Threonine | 0.751 | 0.696 | –7.32 | 0.699 | 0.766 | 9.59 | 0.665 | 0.770 | 15.79 | 0.718 | 0.739 | 2.92 | 0.709 | 0.818 | 15.37 |
| Tryptophan | 0.728 | 0.769 | 5.63 | ||||||||||||
| Valine | 0.815 | 0.730 | –10.43 | 0.724 | 0.802 | 10.77 | 0.763 | 0.838 | 9.83 | 0.775 | 0.798 | 2.97 | 0.777 | 0.716 | –7.85 |
| Alanine | 0.780 | 0.727 | –6.79 | 0.705 | 0.755 | 7.09 | 0.753 | 0.781 | 3.72 | 0.765 | 0.758 | –0.92 | 0.777 | 0.817 | 5.15 |
| Asp + Asn | 0.764 | 0.649 | –15.05 | 0.732 | 0.752 | 2.73 | 0.733 | 0.736 | 0.41 | 0.779 | 0.733 | –5.91 | 0.760 | 0.515 | –32.24 |
| Cysteine | 0.573 | 0.490 | –14.49 | 0.665 | 0.732 | 10.08 | 0.599 | 0.666 | 11.19 | 0.686 | 0.654 | –4.66 | |||
| Glu + Gln | 0.848 | 0.783 | –7.67 | 0.791 | 0.822 | 3.92 | 0.826 | 0.833 | 0.85 | 0.844 | 0.816 | –3.32 | 0.834 | 0.845 | 1.32 |
| Glycine | 0.757 | 0.690 | –8.55 | 0.686 | 0.707 | 3.06 | 0.694 | 0.691 | –0.43 | 0.742 | 0.687 | –7.41 | 0.746 | 0.661 | –11.39 |
| Proline | 0.794 | 0.746 | –6.05 | 0.741 | 0.789 | 6.48 | 0.756 | 0.779 | 3.04 | 0.807 | 0.776 | –3.84 | 0.794 | 0.812 | 2.27 |
| Serine | 0.750 | 0.730 | –2.67 | 0.706 | 0.739 | 4.67 | 0.730 | 0.738 | 1.10 | 0.784 | 0.729 | –7.02 | 0.744 | 0.707 | –4.97 |
| Tyrosine | |||||||||||||||
| Mean | 0.801 | 0.734 | –8.36 | 0.744 | 0.790 | 6.18 | 0.752 | 0.797 | 5.98 | 0.789 | 0.776 | –1.65 | 0.795 | 0.773 | –2.77 |
| Reference | Mean values | Individual percentage responses | ||||
| CP (g/kg) | 210.6 | 164.6 | Response (%) | Minimum | Maximum | Range |
| Amino acid | ||||||
| Arginine | 0.856 | 0.874 | 2.08 | –7.33 | 7.93 | 15.26 |
| Histidine | 0.808 | 0.807 | –0.07 | –8.46 | 4.94 | 13.40 |
| Isoleucine | 0.787 | 0.784 | –0.33 | –11.34 | 10.26 | 21.60 |
| Leucine | 0.796 | 0.802 | 0.80 | –11.37 | 7.26 | 18.63 |
| Lysine | 0.817 | 0.818 | 0.10 | –7.55 | 6.19 | 13.74 |
| Methionine | 0.824 | 0.862 | 4.61 | –2.82 | 21.23 | 24.05 |
| Phenylalanine | 0.809 | 0.779 | –3.65 | –11.03 | 4.02 | 15.05 |
| Threonine | 0.708 | 0.758 | 6.97 | –7.23 | 15.79 | 23.02 |
| Tryptophan | 0.728 | 0.769 | 5.63 | |||
| Valine | 0.771 | 0.777 | 0.78 | –10.43 | 10.77 | 21.20 |
| Alanine | 0.756 | 0.768 | 1.53 | –6.79 | 7.09 | 13.88 |
| Asp + Asn | 0.754 | 0.677 | –10.16 | –32.24 | 2.73 | 34.97 |
| Cysteine | 0.631 | 0.636 | 0.75 | –14.49 | 11.19 | 25.68 |
| Glu + Gln | 0.829 | 0.820 | –1.06 | –7.67 | 3.92 | 11.59 |
| Glycine | 0.725 | 0.687 | –5.21 | –11.39 | 3.06 | 14.45 |
| Proline | 0.778 | 0.780 | 0.26 | –6.05 | 6.48 | 12.53 |
| Serine | 0.743 | 0.729 | –1.91 | –4.97 | 4.67 | 9.64 |
| Tyrosine | ||||||
| Mean | 0.772 | 0.772 | 0.00 | –10.07 | 7.97 | 18.04 |
| Reference | Hilliar et al. [34] | Hilliar et al. [35] |
Hilliar et al. [35] |
Greenhalgh et al. [27] | Yin et al. [36] | ||||||||||
| CP (g/kg) | 227 | 191 | Diff. | 220 | 170 | Diff. | 220 | 170 | Diff. | 215 | 197.5 | Diff. | 215 | 165 | Diff. |
| Amino acid | |||||||||||||||
| Arginine | 0.90 | 0.88 | –2.22 | 0.909 | 0.921 | 1.32 | 0.872 | 0.925 | 6.08 | 0.829 | 0.857 | 3.38 | 0.803 | 0.809 | 0.75 |
| Histidine | 0.86 | 0.82 | –4.65 | 0.805 | 0.844 | –0.71 | 0.777 | 0.862 | 10.94 | 0.744 | 0.804 | 8.06 | 0.741 | 0.695 | –6.21 |
| Isoleucine | 0.85 | 0.83 | –2.35 | 0.857 | 0.879 | 2.57 | 0.802 | 0.890 | 10.97 | 0.743 | 0.801 | 7.84 | 0.752 | 0.768 | 2.13 |
| Leucine | 0.86 | 0.82 | –4.65 | 0.845 | 0.851 | 0.71 | 0.767 | 0.862 | 12.39 | 0.748 | 0.800 | 6.95 | 0.744 | 0.763 | 2.55 |
| Lysine | 0.89 | 0.88 | –1.12 | 0.888 | 0.902 | 1.58 | 0.834 | 0.900 | 7.91 | 0.746 | 0.781 | 4.69 | 0.766 | 0.775 | 1.17 |
| Methionine | 0.94 | 0.93 | –1.06 | 0.927 | 0.941 | 1.51 | 0.892 | 0.940 | 5.38 | 0.796 | 0.834 | 4.77 | 0.881 | 0.892 | 1.25 |
| Phenylalanine | 0.87 | 0.83 | –4.60 | 0.857 | 0.895 | 4.43 | 0.801 | 0.910 | 16.61 | 0.769 | 0.819 | 6.50 | 0.764 | 0.680 | –10.99 |
| Threonine | 0.83 | 0.78 | –6.02 | 0.807 | 0.820 | 1.61 | 0.731 | 0.837 | 14.50 | 0.640 | 0.731 | 14.22 | 0.675 | 0.687 | 1.78 |
| Tryptophan | |||||||||||||||
| Valine | 0.84 | 0.82 | –2.38 | 0.845 | 0.863 | 2.13 | 0.779 | 0.875 | 12.32 | 0.710 | 0.787 | 10.85 | 0.713 | 0.726 | 1.82 |
| Alanine | 0.84 | 0.78 | –7.14 | 0.802 | 0.742 | –7.48 | 0.698 | 0.745 | 6.73 | 0.689 | 0.743 | 7.84 | 0.687 | 0.596 | –13.25 |
| Asp + Asn | 0.82 | 0.82 | 0.00 | 0.808 | 0.745 | –7.80 | 0.726 | 0.724 | –0.28 | 0.718 | 0.760 | 5.85 | 0.697 | 0.594 | –14.78 |
| Cysteine | 0.77 | 0.71 | –7.79 | 0.724 | 0.721 | –0.41 | 0.680 | 0.802 | 17.94 | ||||||
| Glu + Gln | 0.90 | 0.89 | –1.11 | 0.893 | 0.881 | –1.34 | 0.844 | 0.921 | 9.12 | 0.817 | 0.867 | 6.12 | 0.813 | 0.810 | –0.37 |
| Glycine | 0.81 | 0.75 | –7.41 | 0.795 | 0.729 | –8.30 | 0.723 | 0.764 | 5.67 | 0.674 | 0.746 | 10.68 | 0.689 | 0.631 | –8.42 |
| Proline | 0.86 | 0.84 | –2.33 | 0.864 | 0.838 | –3.01 | 0.805 | 0.871 | 8.20 | 0.757 | 0.831 | 9.78 | 0.773 | 0.769 | –0.52 |
| Serine | 0.83 | 0.78 | –6.02 | 0.817 | 0.752 | –7.96 | 0.751 | 0.786 | 4.66 | 0.714 | 0.774 | 8.40 | 0.723 | 0.651 | –9.96 |
| Tyrosine | 0.753 | 0.777 | 3.19 | 0.711 | 0.633 | –10.97 | |||||||||
| Mean | 0.854 | 0.823 | –3.63 | 0.843 | 0.833 | –1.19 | 0.780 | 0.851 | 9.10 | 0.740 | 0.795 | 7.43 | 0.746 | 0.717 | –3.89 |
| Reference | Chrystal et al. [19] | Mean values | Individual percentage responses | ||||||
| CP (g/kg) | 222 | 165 | Diff. | 213.2 | 176.4 | Response (%) | Minimum | Maximum | Range |
| Amino acid | |||||||||
| Arginine | 0.835 | 0.906 | 8.50 | 0.858 | 0.883 | 2.91 | –2.22 | 8.50 | 10.72 |
| Histidine | 0.803 | 0.870 | 8.34 | 0.796 | 0.816 | 2.51 | –6.21 | 10.94 | 17.15 |
| Isoleucine | 0.666 | 0.622 | –6.61 | 0.778 | 0.798 | 2.57 | –6.61 | 10.97 | 17.58 |
| Leucine | 0.789 | 0.883 | 11.91 | 0.792 | 0.830 | 4.75 | –4.65 | 12.39 | 17.04 |
| Lysine | 0.754 | 0.711 | –5.70 | 0.813 | 0.825 | 1.46 | –5.70 | 7.91 | 13.61 |
| Methionine | 0.887 | 0.947 | 6.76 | 0.887 | 0.914 | 3.02 | –1.06 | 6.76 | 7.82 |
| Phenylalanine | 0.773 | 0.604 | –21.86 | 0.806 | 0.790 | –1.99 | –21.86 | 16.61 | 38.47 |
| Threonine | 0.740 | 0.847 | 14.46 | 0.737 | 0.784 | 6.31 | –6.02 | 14.50 | 20.52 |
| Tryptophan | |||||||||
| Valine | 0.690 | 0.663 | –3.91 | 0.763 | 0.789 | 3.43 | –3.91 | 12.32 | 16.23 |
| Alanine | 0.751 | 0.732 | –2.53 | 0.745 | 0.723 | –2.89 | –13.25 | 7.84 | 21.09 |
| Asp + Asn | 0.671 | 0.250 | –62.74 | 0.740 | 0.649 | –12.32 | –62.74 | 5.85 | 68.59 |
| Cysteine | 0.725 | 0.744 | 2.71 | –7.79 | 17.94 | 25.73 | |||
| Glu + Gln | 0.833 | 0.880 | 5.64 | 0.850 | 0.875 | 2.92 | –1.34 | 6.12 | 7.46 |
| Glycine | 0.661 | 0.607 | –8.17 | 0.725 | 0.705 | –2.87 | –8.42 | 10.68 | 19.10 |
| Proline | 0.805 | 0.855 | 6.21 | 0.811 | 0.834 | 2.88 | –3.01 | 9.78 | 12.79 |
| Serine | 0.712 | 0.657 | –7.72 | 0.758 | 0.733 | –3.23 | –9.96 | 8.40 | 18.36 |
| Tyrosine | 0.732 | 0.705 | –3.69 | –10.97 | 3.19 | 14.87 | |||
| Mean | 0.758 | 0.736 | –2.90 | 0.783 | 0.788 | 0.64 | –10.34 | 10.08 | 20.42 |
In maize-based diets, as shown in Table 1a,1b, improvements in average apparent ileal digestibility coefficients of amino acids in maize-based diets pursuant to dietary CP reductions of 6.18% (range of individual responses: 2.73 to 10.8%) and 5.98% (range: –0.43 to 21.2%) were reported in [9] and [10], respectively. In contrast, the average response declined by 1.65% (range: –7.02 to 4.73%) in [11] and by 2.77% (range: –32.2 to 15.4%) in [19]. There was an overall reduction of 8.36% (range: –15.1 to –2.67%) in [33]; however, in this study the diets contained large quantities of starch and it was unequivocally demonstrated that there was competition for intestinal uptakes between starch/glucose and amino acids, as discussed below.
In wheat-based diets, as shown in Table 2a,2b, improvements in average apparent ileal amino acid digestibility coefficients of amino acids of 9.10% (range: –0.28 to 17.9%) and 7.73% (range 3.19 to 14.2%) were reported in [35] and [27] respectively. In contrast, average digestibility coefficients were depressed by 2.90% (range: –62.7 to 14.5%) in [19], by 3.63% (range: –7.79 to 0.00%) in [34] and by 3.89% (range: –14.8 to 2.55%) in [36]. Also, Hilliar et al. [35] reported a decline of –1.19% (range: –8.30 to 4.43%) in birds at 21 days post-hatch, which differs from the 9.10% positive response recorded in the same study at 35 days post-hatch.
As can be gleaned from tabulated outcomes, reductions in dietary CP levels generate extremely variable responses in apparent ileal amino acid digestibility coefficients. The accuracy of amino acid digestibility assays in broilers offered reduced-CP diets is called into question as the properties of standard and tangibly reduced-CP diets are vastly different, which challenges the precision of the four inputs on which apparent digestibility coefficient calculations are based. It is problematic if the passage rates of protein-bound amino acids, non-bound amino acids and inert dietary markers along the digestive tract are sufficiently similar given the differences in solubility and particle size coupled with digesta retention in the crop and gizzard and episodes of reverse peristalsis [37].
Increases in digestibilities of certain amino acids (particularly lysine, methionine, threonine, arginine) may be attributed to the notional 100% digestibility of non-bound amino acids [38], coupled with their high inclusions in reduced-CP diets. In addition, diminished endogenous amino acid flows would enhance apparent amino acid digestibilities. Reduced-CP diets may ameliorate endogenous flows when data generated by Ravindran et al. [39] is considered. These researchers reduced the CP of broiler diets from 198 to 48 g/kg by reducing inclusions of enzyme-hydrolysed casein from 200 to 50 g/kg. There reductions were associated with a decline in the sum of endogenous amino acids of 33.8% (235 versus 355 mg/g DM). Presumably, secretions of pepsin, trypsin and the balance of endogenous proteolytic enzymes would be moderated in birds offered reduced-CP diets but may be offset by hypersecretions of pancreatic amylase given the increased starch concentrations in reduced-CP diets.
Explanations for decreases in amino acid digestibilities following reductions in dietary CP are not as straightforward and yet in the 11 sets of observations tabulated decreases outnumber increases in amino acid digestibilities. Amino acid concentrations in distal ileal digesta are key determinants of digestibility and amino acids may or may not be of dietary origin. In fact, ‘non-dietary’ amino acids are comprised of both endogenous and microbial amino acids; a distinction that is not always drawn. However, in pigs offered protein-free diets, Miner-Williams et al. [40] found that when total endogenous ileal digesta flow was corrected for microbial amino acids, they comprised 19.8% (63.6 versus 321.6 mg/g digesta DM) as opposed to 80.2% (258.0 versus 321.6 mg/g digesta DM) of ‘actual’ endogenous amino acids.
Endogenous amino acids may be re-absorbed along the small intestine, but the amino acid constituents of mucin are essentially non-digestible and are not re-absorbed [41]. Threonine and serine are the principal amino acids in avian mucin [42] and their responses ranged from –7.72 to 15.37% and from –9.96 to 8.40%, respectively in Tables 1a,1b,2a,2b. The broad amplitudes of these ranges could reflect variations in mucin secretion. In common with mucin, microbial amino acids are not re-absorbed. Interestingly, the small intestinal gut microbiota is dominated by Lactobacilli in broiler chickens as they comprise 83% of the total microflora [43], an estimate confirmed in [44]. Thus, any proliferation of Lactobacilli along the small intestine would be expected to compromise apparent ileal amino acid digestibility coefficients. Interestingly, De Cesare et al. [45] found that reductions in dietary CP increased Lactobacilli in the caecal microbiota of broiler chickens, which presumably applies to small intestinal microbiota to some extent.
Estimates of the relative proportions of dietary, endogenous and microbial amino acids in distal ileal digesta may be made from the mathematical model developed by Duvaux et al. [46]. In a recent, as yet unpublished study [47], birds were offered maize- or wheat-based diets with CP contents of 220 and 180 g/kg. Overall, 47.9% of amino acids in distal ileal digesta were estimated to be derived from the diet, 23.8% from endogenous amino acids and 28.6% were of microbial origin. However, the transition from 220 to and 180 g/kg CP in wheat-based diets increased the proportion of microbial amino acids in ileal digesta by a factor of 1.32, from 29.2% to 38.6%. In contrast, the same transition in maize-based diets increased the microbial amino acid proportion by a more modest factor of 1.10, from 22.1% to 24.4%. Instructively, proportions of microbial amino acids in ileal digest were negatively correlated to apparent ileal digestibility coefficients of all 16 amino acids assessed to highly significant extents across all eight dietary treatments.
The difference in microbial amino acid proportions suggests that the higher gut viscosities in wheat- than maize-based diets, generated by higher soluble non-starch polysaccharides (NSP) concentrations in wheat, facilitated the proliferation of Lactobacilli along the small intestine and elevated the proportion on microbial amino acids in ileal digesta to the detriment of apparent digestibility coefficients. Munyaka et al. [44] recorded higher gut viscosities in birds offered wheat-based diets, irrespective of NSP-degrading enzyme inclusions, than maize-based diets. The suggestion that increased gut viscosities are associated with increases in gut microbiota is supported by [48] where it was reported that broilers offered rye-based diets, the more ‘viscous’ cereal grain, had greater ileal anaerobe counts by two or three logarithmic cycles than maize-based diets. Also, Choct et al. [49] concluded that soluble NSP increased small intestinal fermentation, which is partly responsible for their anti-nutritive effects. Also, dietary cereals producing high intestinal viscosities have been shown to increase bacterial activity in the small intestine [50].
Curiously, there does not appear to be an explanation for the increased Lactobacilli abundance in the large intestine following dietary CP reductions in [46]. However, Lactobacilli are found where carbohydrate containing substrates are readily available including intestinal mucosa [51] and these bacteria rare capable of degrading indigestible polysaccharides [52]. This raises the possibility that the higher carbohydrate concentrations, which are invariably present in reduced-CP diets, may be responsible for any increases in the small intestinal gut microflora of which Lactobacilli are major constituents. This should not be taken to imply that small intestinal microbiota are the only factor contributing to the perturbations in apparent amino acid digestibility coefficients in birds offered reduced-CP diets but do they merit closer attention.
Our definition of digestive dynamics is broader than perhaps implied. Digestive dynamics may be considered as a four-tiered sequence of events initiated by the digestion of protein in the gut lumen and followed by the intestinal uptakes of oligopeptides and monomeric amino acids. The transit of amino acids across the enterocytes of the gut mucosa is the third phase and the fourth, post-enteral phase may result in the incorporation of amino acids into protein or, alternatively, amino acids may fulfil a multiplicity of functional roles [53] and an additional metabolic fate is that surplus amino acids are deaminated [54]. The postprandial kinetics of dietary amino acids derived from soy or milk protein ingestion in human subjects were investigated by Bos et al. [55]. These researchers concluded that differences in metabolic postprandial fates of amino acids may be attributed to differences in digestion kinetics between protein sources. Therefore, it is necessary to consider the different digestive dynamics of protein-bound, oligopeptides and non-bound amino acids.
Amino acids may be present in poultry diets and in the small intestine as protein-bound amino acids, oligopeptides or non-bound amino acids. However, the digestive dynamics of these three categories of are quite different. Indeed, methionine as an oligopeptide was shown to be more effective in the recovery of malnourished rats than non-bound methionine or protein-bound methionine in soy protein [56]. The incorporation of amino acids into protein, or protein accretion, is dependent on the harmonious availability of the appropriate blend of amino acids and the provision of energy (derived mainly from glucose) at sites of protein synthesis [57, 58]. As implied, the digestion dynamics of protein/amino acids should not be considered in isolation from those of starch/glucose because of the interactions that take place in broiler chickens offered practical diets [59]; nevertheless, the focus of this review is the bioequivalence of amino acids.
In standard broiler diets, protein-bound amino acids are usually derived from soybean, Canola and other protein meals and cereal grains including maize, wheat and, to lesser extents, barley and sorghum. The amino acid digestibilities of these feedstuffs are well established, which may be impacted by a range of anti-nutritive factors including phytate and soluble NSP. The effects of both can be counteracted by exogenous enzymes and, indeed, exogenous phytase can have profound effects on the digestive dynamics of protein-bound amino acids. Phytase (500 FTU/kg) has been shown to increase average apparent digestibility coefficients of 16 amino acids by 49.7% (0.720 versus 0.481) in the proximal jejunum in broilers offered maize-based diets [60]. The implication is that phytase triggered a ‘proximal shift’ in the site of intestinal uptakes of essentially protein-bound amino acids. Moreover, there are indications that rapidly absorbed protein-bound amino acids will advantage broiler growth performance and influence the post-enteral availability of amino acids [61]. An initial assessment of amino acid digestive dynamics derived from protein-rich feedstuffs for poultry has been completed [62] and the generation of more, similar data should be a priority.
Oligopeptides are defined as di- and tri-peptides; importantly, the majority of amino acids are absorbed as oligopeptides as opposed to monomeric amino acids [63]. Moreover, the likelihood is that intestinal uptakes of oligopeptides, principally via the PepT-1 transporter [64], are more rapid and efficient than monomeric amino acids [65, 66]. An early demonstration found that when glycine was administered as a dipeptide in humans, 30 minute post-prandial glycine plasma levels were 94.7% higher (4.40 versus 2.26 mg/100 mL) than monomeric glycine [67]. More recently, it was reported that peptides derived from soy 11S globulin were more rapidly and efficiently absorbed in adult males than soy 11S globulin protein or a corresponding mixture of monomeric amino acids [68].
The dipeptide, carnosine (
Non-bound (synthetic, crystalline, feed-grade) amino acids are alternative ‘protein’ sources to soybean meal and other relevant feedstuffs in broiler diets [20]. However, an important distinction in that intestinal uptakes of non-bound amino acids are more rapid than protein-bound amino acids because prior protein digestion in the gut lumen is not required [75]. This was demonstrated decades ago; specifically, with methionine in rats [76] and subsequently with lysine and threonine in pigs [21].
The digestion rates of protein-bound of 13 amino acids in conventional
sorghum-based diets were determined by Liu et al. [77], as shown in Fig. 1. The mean digestion rate was 2.35
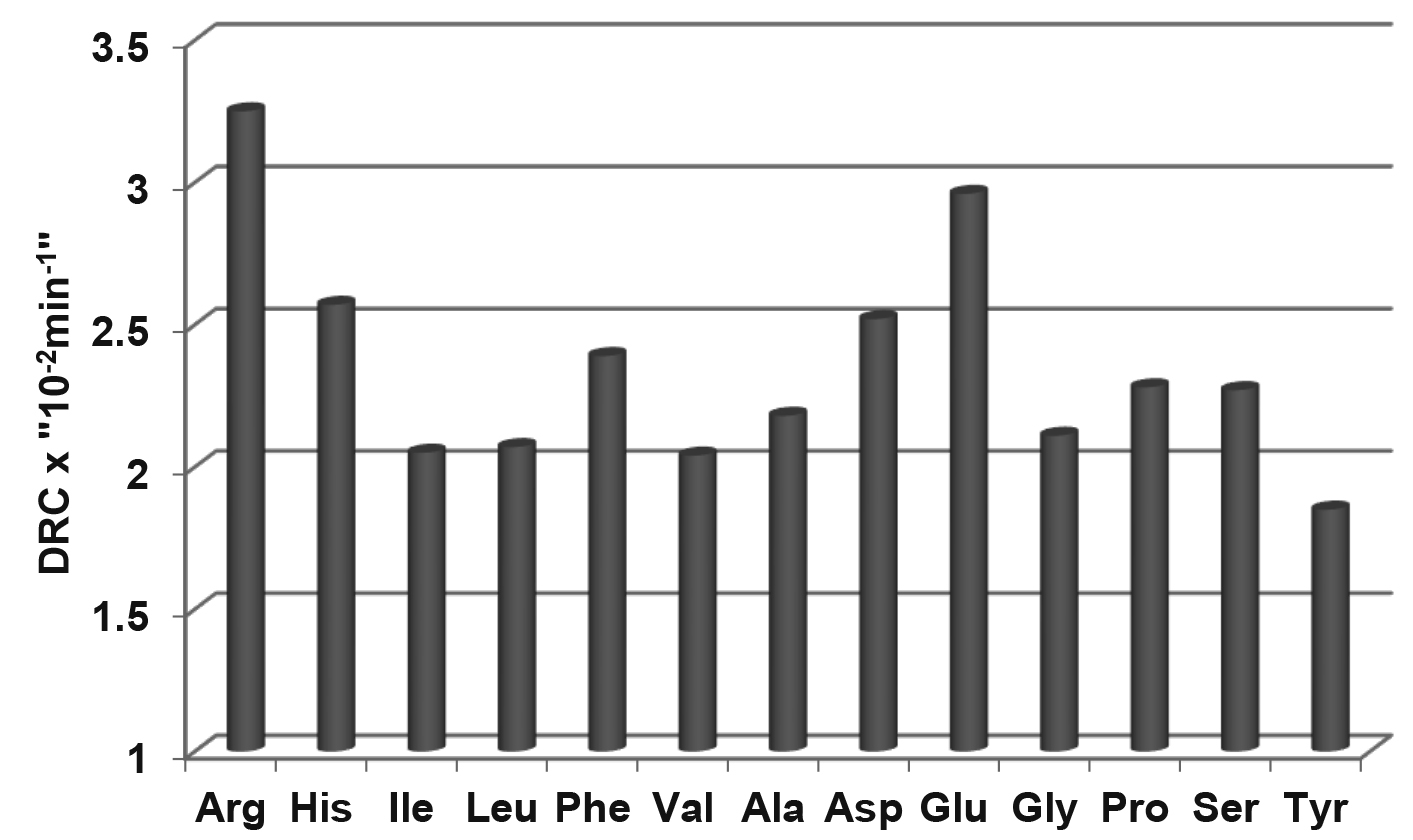 Fig. 1.
The digestion rate constants
(DRC
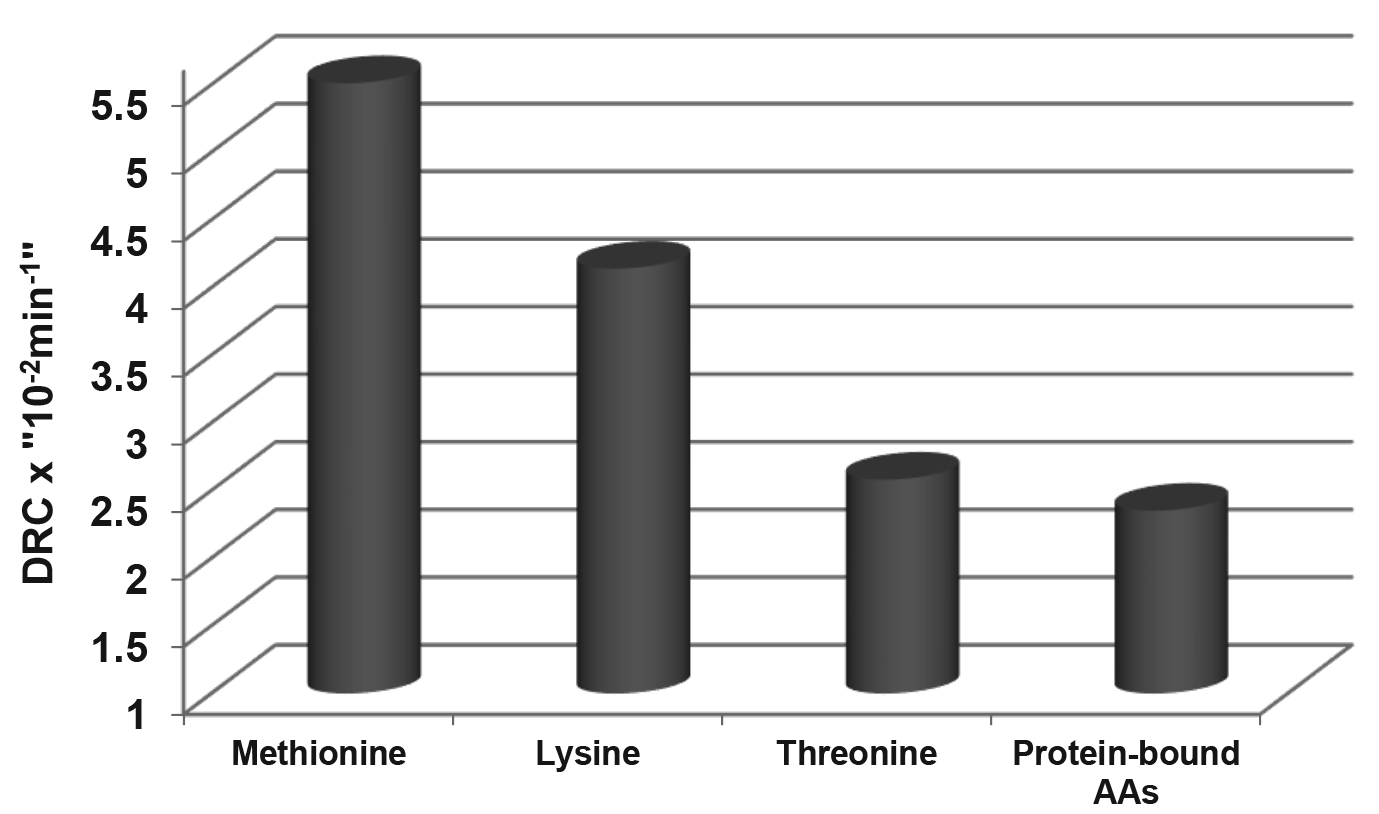 Fig. 2.
The digestion rate constants
(DRC
Given these disparities, it is worth exploring the possibility of enteric coating one or more monomeric amino acids so that their intestinal uptake rates are retarded. Advanced oral delivery technologies facilitating the protection and absorption of protein and peptide molecules are available [78]. Moreover, it has been reported that both encapsulated lysine and methionine were more effectively utilised in poultry than as standard, non-bound entities [79].
The amino acid exchanges are discussed as four sub-sections. These include (i) intestinal uptakes of monomeric amino acids and oligopeptides, (ii) the transition of amino acids across the gut mucosa, (iii) the post-enteral metabolism of amino acids and protein accretion and specific consideration is given to (iv) the branched-chain amino acids: isoleucine, leucine and valine.
The intestinal uptakes of monomeric amino acids take place via an array of
Na
Intestinal uptakes of glucose and amino acids via Na
The addition of lysine HCl to increase the dietary lysine concentrations from 10.0 to 11.8 g/kg in broiler diets has been shown to increase significantly the apparent ileal digestibility of lysine per se but also the digestibility of seven additional amino acids: isoleucine, methionine, phenylalanine, valine, aspartic acid, glutamic acid, tyrosine [91]. The average digestibility of the eight amino acids involved increased by 3.91% (0.824 versus 0.793) and of lysine per se by 5.42% (0.837 versus 0.794). This was attributed to dietary lysine enrichment up-regulating lysine transport systems with over-lapping amino acid specificities along the small intestine, based on data generated by Torras-Llort et al. [92]. That the moderate dietary addition of one non-bound amino acid generated significant differences in the digestibilities of seven other amino acids raises the question as to the magnitude of the impact generated by tangible additions of a range of non-bound amino acids in reduced-CP diets.
There is also evidence that competition for intestinal uptakes amongst di- and tri-peptides via the oligopeptide transporter, PepT-1, take place. A glycine-leucine dipeptide has been shown to depress absorption of a glycine-glycine dipeptide via partially or totally competitive inhibition in human subjects [93]. This evidence for competition between monomeric amino acids and oligopeptides for intestinal uptakes only complicates determinations of apparent amino acid digestibility coefficients as discussed in Section 3.
The visceral tissues, including the intestinal mucosa, pancreas and spleen, have
high metabolic rates and the contribution of portal drained viscera to whole body
energy expenditure is substantial and dietary amino acids are a major source of
mucosal energy generation in pigs [94]. The majority of absorbed glutamic acid
(95%), aspartic acid (95%) and glutamine (70%) are catabolised in the gut
mucosa and do not enter the portal circulation in pigs, and probably other
mammalian species [95]. This also applies to proline (40%) and the
branched-chain amino acids (35–40%) to lesser extents. However, very little is
known about the catabolism of amino acids or alternative energy substrates by the
gut mucosa in broiler chickens, which has a considerable bearing on their
bioequivalency. Watford et al. [96] concluded that glucose, glutamine
and glutamate are the preferred energy substrates in avian enterocytes and this
outcome was confirmed by Porteous [97], who found that glucose, glutamine and
glutamate were the only individual substrates to stimulate respiration in
intestinal brush-border cells of broiler chickens. There is the implication that
a ‘catabolic ratio’ exists in avian enterocytes between glucose and amino acids
(predominantly glutamate/glutamine) as substrates for energy provision but the
extent that the balance of amino acids are catabolised is not known. In rats,
glucose and glutamine provided similar proportions of energy to enterocytes in
the gut mucosa [98]. This is consistent with the ‘catabolic ratio’ principle,
although there are much higher rates of respiration in the gut mucosa or chickens
than rats [97]. In respect of additional amino acids undergoing catabolism, it is
pertinent that Stoll et al. [99] reported that catabolism dominated the
first-pass intestinal metabolism of essential amino acids in young pigs and that
catabolism of amino acids within enterocytes was quantitatively greater than
amino acid anabolism or incorporation into mucosal protein. Catabolism of amino
acids could result from decarboxylation or deamination and in the second reaction
the amino group is removed and converted to ammonia (NH
The pigs were fitted with arterial, venous, portal and gastric catheters plus an
ultrasonic portal blood flow probe to determine the net portal NH
A similar outcome was reported in the second study [33] in which free amino acid concentrations in the portal circulation were determined in birds were offered maize-based diets with specified CP contents of 213 and 178 g/kg from 7 to 28 days post-hatch. The reduction in dietary CP resulted in an increase in non-bound amino acids from 3.54 g/kg (lysine, methionine, threonine) to 10.90 g/kg (lysine, methionine, threonine, isoleucine, valine, arginine). Across these amino acids, collective portal concentrations increased by 33.7% (333 versus 249 mg/mL) following the dietary CP reduction. However, the collective increase for the balance of ten protein-bound amino acids was a more modest 5.28% (738 versus 701 mg/mL).
In the third study [36], free amino acid concentrations in portal plasma in
birds offered 215 and 165 g/kg CP, wheat-based diets were determined. Increases
in portal concentration following the dietary CP reduction were confined to
lysine with an increase of 33.7% (51.6 versus 38.6
The consistent contrasts in these three studies suggest that non-bound amino acids are more likely to gain access to the portal circulation than their protein-bound counterparts. That non-bound amino acids enter anabolic and/or catabolic pathways within enterocytes to lesser extents may be due to their more rapid intestinal uptake rates and proximal sites of absorption in the small intestine where more starch/glucose is available as an alternative energy substrate.
The entries of amino acids into the portal and, via the liver, systemic
circulations are fragmented by their digestibilities, rates of intestinal uptakes
and transitions across the gut mucosa which promotes the likelihood of
post-enteral amino acid imbalances [101]. Consideration was given to the
short-term dynamics in amino acid metabolism in this context by Schreurs
et al. [102], who proposed that circulating free amino acids could be
either incorporated into protein or undergo metabolic degradation. “Postprandial
oxidative losses” was the description given to the second fate and was quite
extensively evaluated by Victor Schreurs and his colleagues. The
[
Catabolism of amino acids can involve deamination with the release of ammonia
(NH
Several poultry studies [115, 116, 117] have associated increased NH
Protein accretion, or net protein synthesis, is the difference between protein deposition and protein degradation mainly in skeletal muscles and this protein turnover is a dynamic, continuous process [118]. The rapid accumulation of breast-muscle protein in rapidly growing chicks is due to a marked decrease in the fractional rate of degradation rather than increases in deposition fractional rates [119]. The dynamic nature of protein turnover in skeletal muscle is illustrated in the Urdaneta-Rincon and Leeson [120] study. These researchers examined protein turnover in Pectoralis major in 21-day-old broiler chickens offered fourteen diets with graded levels of lysine and crude protein. The absolute synthesis and breakdown rates of protein were determined and the differences represents net protein synthesis or accretion. Absolute protein synthesis averaged 626 mg/day, protein breakdown averaged 321 mg/day and net protein synthesis averaged 304 mg/day. Moreover, increasing net protein synthesis rates appeared to be quadratically associated with improvements in FCR.
Protein synthesis demands energy as an input of 5.35 kJ is required for the synthesis of one gram of protein [121] and is more energy demanding than protein degradation [122]. As concluded by Moughan [56], protein synthesis efficiency is markedly influenced by the harmonious provision of amino acids and non-amino energy supplying compounds (essentially glucose) to sites of protein synthesis. This emphasises the importance of starch-protein digestive dynamics [123]; however, this topic is peripheral to the remit of this review. The amino acid composition of breast and thigh meat, the two critical portions of the carcass, have been determined [124] and, clearly, the full complement of essential and non-essential amino acids must be made available at sites of protein synthesis to maximise protein accretion which underscores the importance of amino acid bioequivalency. have been studied by 14C02 breath tests, according
As discussed, protein-bound, branched-chain amino acids (BCAA), isoleucine,
leucine and valine, are slowly absorbed along the avian small intestine because
of their hydrophobicity [77]. As a result, their dietary inclusions as non-bound
amino acids generate larger than normal differentials in intestinal uptake rates.
In a recent, as yet unpublished, study [125], elevated BCAA levels were assessed
in 187.5 g/kg CP broiler diets based on wheat, sorghum or a wheat-sorghum blend
from 7 to 28 days post-hatch. A feed grain by BCAA treatment interaction
(p
In [125], leucine inclusions were elevated from 105 to 150 relative to lysine (100) without and with elevations in isoleucine (65 to 75) and valine (75 to 85) to meet the possibility of BCAA antagonisms. In diets with all three elevations, sorghum-based diets contained 4.93 g/kg non-bound leucine with a balance of 35.81 g/kg non-bound amino acids and wheat-based diets contained 9.12 g/kg non-bound leucine and 45.04 g/kg non-bound amino acids, both in 187.5 g/kg CP diets. Clearly, there are differences in these respects; however, if non-bound and protein-bound amino acids were bioequivalent the remarkable outcome of a 9.26% increase in weight gain in birds offered sorghum-based diets as opposed to a 9.49% decrease with wheat-based diets would not have been likely.
Leucine is usually included in broiler diets at 109 relative to lysine and positive responses to elevated leucine levels in maize-based, broiler diets have been reported [126, 127]. When leucine plasma and intracellular levels exceed requirements for protein accretion, leucine can stimulate protein synthesis by activating the mechanistic target of rapamycin (mTOR) to promote protein deposition and suppress protein degradation [128, 129]. It appears that this may have taken place in sorghum-based diets but not in wheat-based diets. In addition to inherent differences between the two feed grains, one possible contributing factor may have been higher levels of post-prandial oxidation of non-bound leucine (and other amino acids) in birds offered wheat-based diets. The kinetics of radioactively labelled leucine in human subjects was investigated by Metges et al. [130]. These researchers found that resulting from oxidation of non-bound leucine, protein-bound leucine (in casein) was more efficiently used for protein synthesis during the absorptive phase than a casein-equivalent intake of non-bound amino acids. They also concluded that the form in which leucine is consumed affects its immediate metabolic fate and retention in the body. Thus, the outcomes of the Greenhalgh et al. [125] study support the concept that non-bound and protein-bound amino acids are not bioequivalent, as forecast in [131] and this may particularly apply to branched-chain amino acids.
A considerable amount of data has been examined which supports the argument that
non-bound and protein-bound amino acids should not be considered to be
bioequivalent. The case is made that the digestive dynamics of amino acids do
impact on the bioequivalence of amino acids in broiler chickens and,
fundamentally, the genesis of this impact is the differential in intestinal
uptake rates. This finding is of extreme relevance to the successful development
of reduced-CP broiler diets. Indeed, there is the implication that non-bound
amino acids may be effectively “lost” to postprandial oxidation and this
possibility should be investigated specifically in broiler chickens. Also, the
concept of ‘NH
Our contention is that non-bound and protein-bound amino acids are not bioequivalent; the fundamental genesis of which is the differential in their rates of intestinal uptakes. Intestinal uptakes of non-bound amino acids are more rapid, which may result in post-enteral amino acid imbalances. Reduced-CP broiler diets contain high inclusions non-bound amino acids and their development is almost certainly being thwarted by this disparity in amino acid bioequivalence.
All four authors contributed to the compilation of this review and participated in some of the underlying cited research to varying extents, particularly PVC. PHS proposed the concept of this review which was written mainly by PHS and SPM and SYL was responsible for the final editing of the manuscript.
Not applicable.
The authors wish to acknowledge the support and encouragement of their wonderful colleagues in the Poultry Research Foundation and the support and guidance from Australian Research Council, AgriFutures Australia Chicken Meat and Evonik Operations GmbH.
This research received no external funding.
The authors declare no conflict of interest.