
Through lateral transfer, extra-cellular vesicles (EVs) transport their DNA, miRNA, mRNA and proteins such as enzymes mediating drug resistance, transporters as well as growth factors to neighboring cells. By virtue of this horizontal transfer, EVs potentially regulate cell growth, migration, angiogenesis and metastasis and increase tissue permeability in cancer. Furthermore, EVs regulate immune factors and allow the tumor cells to evade immune recognition and cell death. To explore if the proteomes of exosomes support functional transfer of cancer hallmarks, in this meta-analysis, we compared EVs and whole cell proteomes from the NCI-60 human tumor cell line panel. We observed a subgroup of proteins in each cancer hallmark signature as highly abundant and consistently expressed in EVs from all cell lines. Among these were oncoproteins frequently targeted in cancer therapies whose presence on EVs could potentially render therapies less effective by serving as decoys.
Carcinogenesis involves sequential steps including early steps of gene mutations that lead to genome instability and increased growth. Genome instability brings about more heterogeneity and rapid evolution of new cancer cell properties. These new properties involve epithelial-mesenchymal transition (EMT), ability to enter (intravasation) and exit blood circulation (extravasation), dormant survival in a distant organ, and capacity to establish a micro-environment favoring further growth of the tumor (1). Over the years, cancer research has provided evidence that tumor development is a multi-step process in the transformation of a normal cell into a malignant derivative. This process was comprehensively schematized, by Hanahan and Weinberg, into six acquired capabilities of cancer cells, constituting the well-established hallmarks of cancer (2): 1. Cancer cells adopt alternative ways to self-sustain proliferation, for example; cell proliferation depends on extracellular stimulus transmitted to the cell by interactions of transmembrane receptors and signaling molecules (growth factors, extracellular matrix components and cell-cell adhesion molecules). Transmembrane receptors responsive to proliferative signals are deregulated in cancer cells and often drive tumor progression through increased tyrosine kinase activity (3). 2. Simultaneously, to sustaining proliferation, cancer cells acquire the capacity to evade apoptosis. Tissue homeostasis is tightly regulated by the elimination of non-healthy cells originating from infectious and non-infectious insults, a potential cause of oncogenic lesions. In such cases, impairment of tumor suppressors’ activity enables altered cells to escape apoptosis by acting upon inhibitors of apoptosis. 3. Oncogene signaling can drive angiogenic regulators involved in perpetuating the sprouting of new vessels to provide nutrition to the growing tumor. 4. Activation of invasion and metastasis enables the tumor to spread. 5. Evasion of growth suppression by bystander cells such as fibroblasts and endothelial cells. 6. Enabling replicative immortality equipping the cancer cells to overcome the Hayflick limit. More recently, a substantial body of evidence drove the authors to pinpoint new capabilities as emerging hallmarks of cancer. These capabilities relate to the involvement of the immune system as a perpetuator of an inflammatory environment before tumor development and during its establishment. They further include the selective advantage of cancer cells enabled by certain mutant genotypes, categorized as evading immune destruction and reprogramming energy metabolism (1). Malignant cells survival implies that at some point immune surveillance fail to eliminate nascent transformed cells. Several mechanisms are described to be involved in immune invasion, namely the release and uptake of extracellular vesicles (EVs) from tumor cells into the surrounding microenvironment. EVs constitute a heterogeneous vesicle population of different sizes, biogenesis and origin.
Recently, EVs, which include exosomes, microvesicles from the plasma membrane and apoptotic bodies, have attracted attention in cancer research. Exosomes are small lipid bilayer-enclosed nano-sized vesicles of endocytic origin. Essentially, all cells secrete exosomes either constitutively or upon external stimulation. The literature reports presence of exosomes in all body fluids. For example, evidence of exosomes in blood (4), urine (5), saliva (6), and bronchoalveolar lavage (7, 8) exists. Exosomes are 30–120 nm EVs, with a density range of 1.13–1.19 g/mL (9). Cells also release microvesicles from the plasma membrane. The size distribution of the microvesicles from the plasma membrane overlaps with the size distribution of exosomes. The plasma membrane microvesicles are in general larger than exosomes and the size distribution of plasma membrane microvesicles is broader than exosomes (Figure 1). Apoptotic bodies formed in cells during programmed cell death also display a larger size distribution than exosomes (Figure 1). Methodologies for reliable characterization and classification of vesicle types are in an early phase and consequently there is a lack of standards for exosome isolation. Therefore, we apply the term ‘EV’ to include all types of extracellular vesicles to prevent flawed interpretation of the data. Previous studies mostly define EVs´ functional role as: 1) ways to release toxic or non-essential biomolecules and 2) facilitate communication among neighboring and distant cells. EVs transmit functional signals under physiological and diseases condition presumably by horizontal transfer of metabolites, DNA, RNA and proteins. For example, in normal physiology, EVs mediate immune modulation, cell-cell communication within the brain, induce apoptosis in neighboring healthy cells in the heart during stress and promote regenerative potential of stem cells (10). EVs are also involved in cancer and inflammatory diseases. For instance, immune cells increase release of EVs following cognate T-cell interactions (11-13) and genotoxic stress in tumor cells increases EV secretion (14). Stromal and tumor-derived exosomes (TDE) promote cancer onset, progression and metastasis. Previous in vitro studies demonstrated EV mediated promotion of tumor growth (15). EV integrins can integrate into plasma membrane of remote organs and thereby promote organ specific metastasis (16). Additionally, multiple in vitro and clinical studies demonstrate a role of EVs in cancer drug resistance (17-19). Furthermore, EVs constitute a source of potential biomarkers for cancer diagnosis and prognosis.
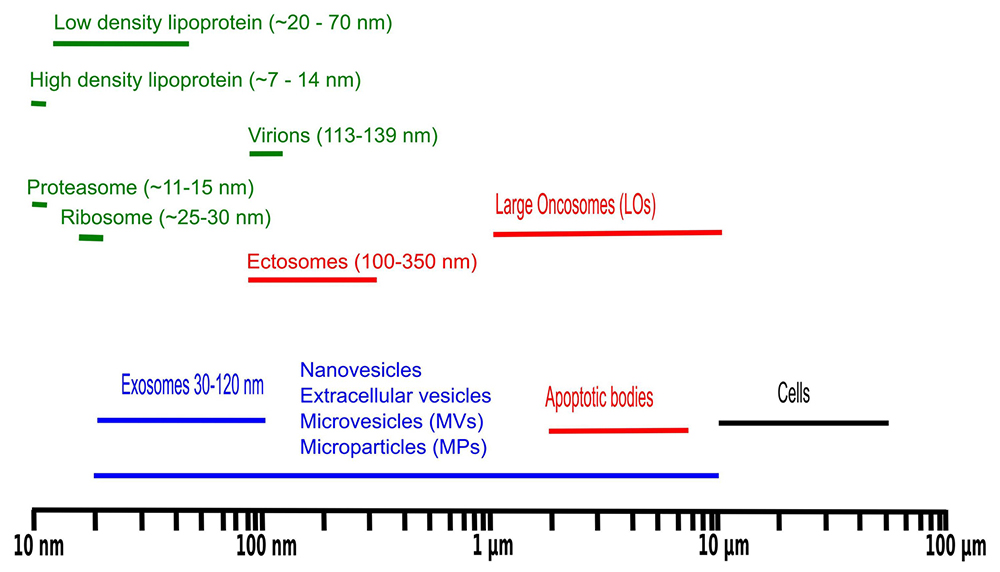 Figure 1
Size distribution of biomolecular particles frequently observed in liquid biopsies.
There are multiple advantages of targeting EVs for biomarker profiling. For example, the composition of EVs reflects the contents of cell of origin (20). Liquid biopsies are, in general, a rich source of EVs. Additionally, liquid biopsies are typically extracted by minimally invasive medical procedures allowing sampling from healthy controls and in some cases longitudinal sampling is possible. EV enrichment from samples is a simple procedure and EVs contain most of the cellular contents in terms of DNA, RNA, proteins and metabolites. Finally, for proteomics profiling EVs permit a greater depth of the proteome coverage because of lack of abundant plasma proteins such as albumin and hemoglobin. Given that EVs from liquid biopsies are regularly obtained by differential centrifugation followed by sucrose cushion, it is relevant to investigate which potential bioparticles might co-purify (Figure 1).
Despite high interest in the cancer hallmarks and EVs, investigation of large-scale quantitative proteomics data sets of cancer cells and EVs for enrichment of signatures associated with cancer hallmarks is lacking. Our main interest is investigation of EV proteins as diagnostic and prognostic biomarkers for cancer. The presence of proteins associated with cancer hallmarks in EVs to a similar extent as in the cellular proteome supports the investigation of EV proteins as biomarkers for cancer. Furthermore, the presence of cancer hallmark proteins in EVs opens the possibility for transfer of proteins’ function and oncogenic properties through EV cellular communication. Therefore, cancer hallmark proteins in EVs might have implications in cancer therapies as well.
Given the advantages of EV protein profiling in clinical biopsies, we ask if current cancer EV proteomics data support the presence of cancer hallmark proteins in EVs and how the overall level of these proteins compares with the level in the corresponding cancer cells. To draw comparisons between the proteome of cancer cells and derived tumor microvesicles, the present study addresses four of the six proposed hallmarks of cancer (2), namely sustaining proliferative signaling, resisting cell death, inducing angiogenesis and activating invasion and metastasis. We performed functional enrichment analysis of the proteomes of whole cancer cell and derived tumor extracellular vesicles from the NCI-60 human tumor cell line panel (21, 22). We argue that the large data sets provided by Hurwitz et al (22) contain adequate information to justify a complementary analysis.
For comparative analysis, publicly available proteome data from the NCI-60 human tumor cell line panel deposited in the PRIDE database, namely whole cell proteome (project reference PXD005940, PXD005942 and PXD005946) and EVs proteome (project reference PXD005479) (21, 22) were extracted and reanalysed. The protein identifications provided in the original studies were maintained in the present analysis. However, the proteins were quantified again by using intensity based absolute quantitation (iBAQ) values. iBAQ were estimated from the sum of significant assigned peptides to a given protein and length normalized by the expected observable tryptic peptides of the longest protein isoform. Whole cell proteome quantitative data was obtained by merging the data obtained on the kinome and the kinome depleted proteome. Additionally, protein isoforms were collapsed onto the corresponding genes. Protein expression values from EVs and whole cell proteome data were obtained independently although using comparable protein preparation methods and MS analysis (21, 22). Therefore, the protein abundance values were scaled to the interval zero to one to facilitate comparison between EV and full cellular proteome. The scaled values are easy to interpret in terms of overall abundance in EVs and cells. Hurwitz et al (22) applied spectral counting rather than iBAQ for expression and comparative analysis. The advantage of iBAQ is a larger dynamic range and the values are normalized according to protein length, allowing rough comparison between different protein expression values in addition to comparing expression across samples for specific proteins. The advantage of spectral counting is a more confident link between the expression values and the identified proteins. Comparing Figure 2 with the results presented by Hurwitz et al (22), we conclude that iBAQ indeed provide a larger dynamic range than spectral counting.
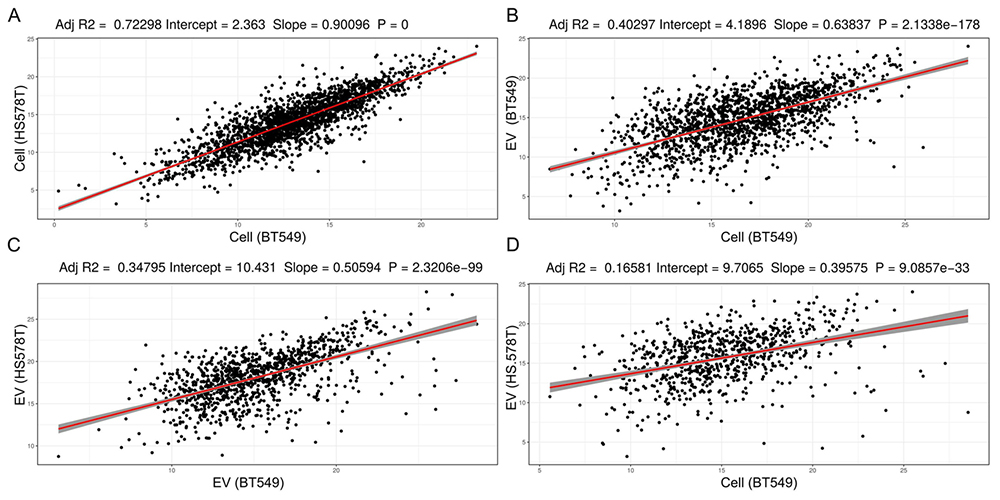 Figure 2
Comparison of iBAQ protein expression values obtained from the proteome analysis of whole cell extracts and EVs from two breast cancer cell lines, BT549 and HS578T. In A) Whole cell extracts of BT549 versus HS578T, B) Whole cell extract of BT549 versus EVs from BT549, C) EVs from BT549 versus HS578T, and D) Whole cell extract of BT549 versus EVs from HS578T.
FDA approved drugs targeting the discussed proteins were extracted from the DrugBank database that is a comprehensive, freely accessible, online database containing information on drugs and drug targets. As DrugBank is both a bioinformatics and a cheminformatics resource, it combines detailed drug (i.e. chemical, pharmacological and pharmaceutical) data with comprehensive drug target (i.e. sequence, structure, and pathway) information (https://www.drugbank.ca/).
The protein cancer hallmark signatures were extracted using UniProt signatures except from the angiogenesis signature which was defined based on GO: 0001525. The depicted proteins in the heatmaps are intersects between the specific signature and all identified proteins in either the cellular or EV proteome. All the scaled iBAQ values, copy number alterations and mutations for the protein signatures are provided in supplemental table available for download (https://drive.google.com/open?id=1UPofTZT_VB2R8QD2rKPrUqDodZO3LdeL). All data were integrated, analyzed and plotted in the statistical programming language R. FactoMineR (23) was used for PCA analysis and heatmaps were plotted using ComplexHeatmap (24).
iBAQ expression values estimated from the two breast cancer cell lines BT549 and HS578T correlates strongly with a significant slope of ~0.9, Pvalue = 0. The protein expression values from BT549 cells and BT549 EVs also correlate significantly but not as strong as the cellular proteome from two different breast cancer cell lines (comparing Figure 2A and 2B). Principal component based variable correlation plot from all EVs and cellular protein iBAQ values, indicate that all proteome data sets correlate positively (Figure 3). Protein iBAQ values vary more for EVs than for cellular data as shown by the more spread out variable correlation in PCA space (Figure 3). The overall protein expression values for leukemia correlate better for both exosomes and cellular data than from cell lines of other tissue origins. For most tissue groups the points are more spread out than for the leukemia cell lines (Figure 3). The difference in correlation and the higher variability for EV data versus raw cellular data suggests that there is some form of protein selection for secretion into EVs as previously claimed for miRNA (25). Though, for miRNA evidence for non-selective sorting of EVs cargo also exists (26). The correlation in Figure 2B is considerably stronger than in Figure 2D supporting the hypothesis that EV proteomes reflect the proteome of the cell origins. One of the big questions in cancer EV research is whether EVs from liquid biopsies possess the ability to predict site of primary tumor. Nevertheless, the real scenario, where EVs from different cell origins contribute to the EV pool, is considerably more complex than data obtained here for isolated cell lines. Comparison of Figure 2A and 2C suggests that the EV proteome is more heterogeneous than the cellular proteome because of the increased variability and overall large difference in absolute iBAQ values for EVs. This might also be explained by the fact that cells secret EVs at different levels consequently making it harder to technically reproduce EV protein estimation across the cell lines.
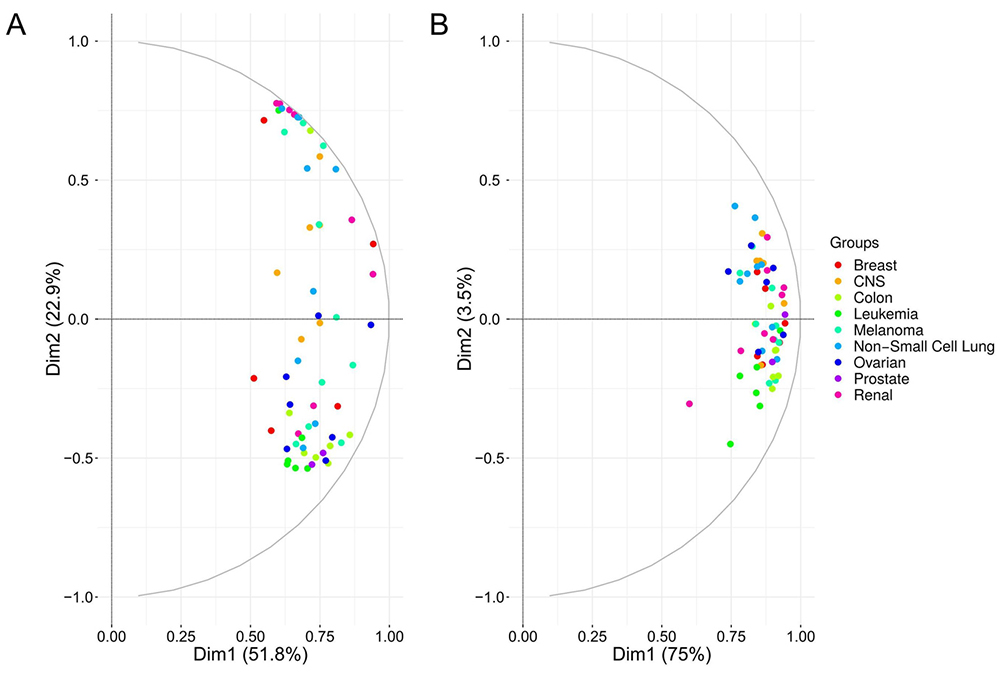 Figure 3
Principal component based variable correlation plot from A) exosome and B) whole cell extract iBAQ protein expression values.
The total number of EV and cellular proteins identified across all cell lines, in the two NCI60 data sets, are 6015 versus 6561 proteins after collapsing the protein isoforms onto the corresponding genes. If we assume that the full human genome encodes 19350 proteins annotated in HGNC database, then the identification levels correspond to 31% and 34% coverage for exosomes and raw cellular extract from the NCI cell lines, respectively. This level of coverage is as expected less than the 50% estimate for mRNA coverage. EVs are 100 to 1000 times smaller than cells in terms of diameter (106-109 times smaller in terms of volume), yet the EV proteome complexity appears to be of the same level as the proteome from raw cell extracts (Figure 1). The size of a typical globular protein monomer is 3-6 nm. If we assume an average protein diameter of 5 nm and EV diameter of 100 nm then the volume of the EV is around 8000 times larger than the average protein. This size estimation questions if all identified proteins from EV preparations are of EV origin. As with all other enrichment methods there are contaminants from other biological entities especially those with a similar size distribution as EVs. In addition, to the biological entities in Figure 1, extracellular protein aggregates and extracellular proteins with affinity for EV surface can co-purify with EVs. The original study (22) obtained the EV data without proteolysis of extracellular proteins, and therefore aggregated extracellular proteins or proteins binding the surface of EVs might have been co-enriched. Furthermore, we for example typically detect bacterial proteins, as low abundant proteins based on iBAQ values, in EVs from liquid biopsies from lung. Nonetheless, the contaminating proteins from other entities are typically detected as low abundant proteins. Given the relatively small size of EVs, it is reasonable to expect that EV proteomes are highly heterogeneous and constantly changing over time, to explain the high complexity of the identified EV proteome. For example, different EV enrichment methodologies enrich different EV populations adding to the bulk EV proteome complexity (27).
Unique tissue-specific membrane proteins identified from EVs can be used for immune purification from body fluids coupled with MS to identify unique signatures of tissue type specific EVs. Furthermore, the detection of cancer cells in a liquid biopsy diagnoses a patient with cancer without the physician knowing the origin or organ location of the primary tumor. Therefore, one of the big questions concerning EV biomarker research is if EVs from liquid biopsies can predict tissue origin of the primary tumor. Hurwitz et al (22) also addressed this question by enumerating the number of unique proteins from EVs divided into groups based on tumor tissue of origin and found that leukemia proteome contains the highest number of unique proteins compared to EVs from other tissue types. Figure 4 below compares the number of unique proteins from EVs, cells and their intersection after grouping of the 60 cell lines into tissue of origin. Tables 1-3 provide the unique gene symbols encoding the proteins grouped into tissues obtained from EVs, cellular proteome and their intersection.
| Tissue type | Gene names |
|---|---|
| Breast cancer cell lines | SBNO1, RAB36, IL33, TNFRSF1A, ACKR3, SOX6, AKIRIN2, SECTM1, ARRDC3, MARK4, EMC6, NPDC1, GNAT3, LZTS3, DCN, LRRC32, TMEM119, FAM180A, ANKUB1, TRIM75P, FBP2, TGM5, NMT2, LYPD3, LARGE, PIGR, LTF, RPS6KB1, NPY1R, LMOD1, CXCL12, SEMA3F, ITPK1, EFNB3, RNF43, ZNF687, INTS4, SELO, PUS3, YBX2, CST4, ZNF622, HIST1H2AA, ERVV-2, SERPINA6, TGFB3, GRPR, SPA17, LRRC9, LURAP1L, KCTD6, C3orf49, MAP6D1, WBP1L |
| Central Nervous System cancer cell lines | KIT, DPYSL4, PDE8B, PTHLH, ALOX12, PTN, GRK5, GNG11, LRRC17, PIK3R3, RSPH6A, TPST1, TECTA, REP15, ADAT1, BCE1, PSG9, LYPD1, ADAMTS16, SLC38A3, THUMPD2, TTYH1, PIPOX, RECK, HLA-DPB1, PTPRD, MOG, CADM4, RAB7B, MAP7D2, STK25, CD274 |
| Colon cancer cell lines | WFS1, RHOBTB3, FUT3, NTSR1, CHN2, LGALS4, FAM3B, PAK1, BAAT, GRB7, PDK3, SHB, RABL6, ENTPD8, SAMD5, ANO1, NAPEPLD, CCDC129, MBOAT2, UBE2R2, UNC5CL, ATOH7, CLRN3, KLK6, OTUB2, MYO15B, TSPAN32, TPPP3, SORBS1, EPB41L4B, BLOC1S4, ARHGAP26, B3GNT3, USH1C, CAPN6, SCG5, CCL5, TROAP, PIK3R2, MYZAP, HYAL2, RANBP10, UBR2, OR5P3, ASXL3, CPNE7, WNT16, ANKRD61, PIP5K1C, UBB, GJB2, ATP12A, PDE1A, OLR1, ARHGAP5, JOSD1, BRWD3, RPLP0P6, GNPDA2, APIP, PABPC3, PAK6, GDE1, GINS2, BRD4, F5, MAD2L1BP, TAF9B, CTCFL, TMEM54, THOC3, HIST1H2BL, UTP23, CTNNA3, OSM, KCNQ1, KRTCAP3, TTC38, ULBP2, SCLY, REG4, SMAP, LILRA6, HEXIM1, CEACAM8, CNN1, C21orf59, CPLX2, ACBD7, RNASEH2C, PHYHIPL, SERAC1, MED10, FXYD6, ETNK1, CTNNBIP1, PPP4R2, UBP1, TNFRSF10D, MED13 |
| Leukemia cell lines | TUBAL3, GEMIN2, ITM2A, SH2D1A, HUS1, SLIT1, SASH3, S1PR4, CD8A, CD3D, ITGB2, MPO, CTSG, CD7, CD28, CD37, HCLS1, CD53, DGKA, CD1C, CD6, KIR3DL2, JAK3, CASP6, HBG1, RUNX1, SLC18A2, NFYC, NCAPH, RHOH, ARHGAP15, SPIN3, LAIR1, TRAT1, C16orf54, MTSS1L, PXK, P2RY8, ERI1, GPC2, FAM101B, MZB1, SFT2D1, SLC7A3, ELMO1, HMHA1, SEMA4D, ATP2A3, TMIGD2, RMI2, IL17RA, HHIP, PPP1R16B, SLC39A3, GNB1L, SEMA4A, SMARCAD1, SLA2, TMEM206, PARVG, ZCCHC3, INTS9, FANCI, TERF2IP, SIT1, PTGDR2, NCF1, LINC00587, TYROBP, CYBB, ELANE, PRG2, BPI, AZU1, FCAR, PRTN3, CCR1, GPR183, LSP1, SERPINB8, DHX8, CLEC12A, GKAP1, ATP8B4, CD101, RPAP1, PAPOLB, LRFN1, CDC45, CRCP, WDHD1, HBD, HBE1, GYPA, PRKCB, MYL4, GNAT2, KDELR1, LIG3, HBG2, ZBED6, RHAG, PPP1R8, MLLT11, PPIL2, PUM1, GSE1, YOD1, TRPT1, NOSTRIN, PAF1, SMG8, NSUN6, SREK1, DUS3L, LTV1, UBAC1, RBM42, CINP, ANKZF1, BMP2K, FBXL12, ASH2L, ANAPC5, GTF3C4, MAPRE3, FBXO7, ITGB7, CD1B, GSTM4, TLE3, TAF10, UBAP2, EDC3, KRTAP3-3, MAGEB5, POLE4, CCND2, CRYBB1, TNFRSF17, ACTL8, RRP8, GZMB, IRF5, MED1, GNN, TIFA, IMP4, FBXL18, SH2D2A, IL26, ALK |
| Melanoma cell lines | MT-ND5, CLDN8, CLDN10, CAMK2B, EGFL8, FAF1, WNT6, TYRP1, PMEL, TNNT3, EMP3, CCL20, PAPPA, ADCY4, HAS2, ABCA2, GREB1L, ZNF407, LYRM4, DLL3, TFEB, ENTPD1, SHROOM2, VASH1, TRPV4, KBTBD4, SERPINA3, RLBP1, FMOD, MIA, CARD16, FAM210A, FGFBP2, GLT8D2, ZRANB3, NDNF, SLC38A4, DNTTIP1, HLA-DRB4, ASB9, CDK10, PLA1A, PIK3AP1, PRICKLE2, ACOX3, HTRA2, PHF14, AP3S2, MRPS5, CCDC57, COL5A1-AS1, FCRLA, LINC00523, ZFAND4, PRG4, TRABD, TPPP, SERPINF1, CTSK, SPRYD4, TOP1MT, WFDC1, PRR12, PIK3CG, GPR119, SNED1, ZNF480 |
| Non-Small Cell Lung cancer cell lines | FGA, SEMG1, ITIH2, CLDN6, CDR2, FGL1, NPTX1, PLBD1, SMARCD3, TSPAN33, TSPYL5, MMP28, ANG, HPGD, ANGPTL1, LCAT, CKM, GPD1, GPX3, PBLD, THBS4, ACADSB, SULT1E1, MFAP4, S100A12, AOX1, SPP2, SFRP4, ADAMTS13, PGAM4, TTL, B3GALT6, PBX4, ALDH8A1, PLA2G2D, KRT87P, OLFM2, F10, C8B, SFTPB, COL10A1, ADAMTSL5, PHF10, OLFM1, NME2P1, STK16, GDPD3, ERGIC2, TAGLN3, DSCR4, SETBP1, PCDH12, AGPAT5, CSAD, DAB1, GJA5, RAB3C, PLXNA4, TNNC1, TUBA3E, DNAI2, HSPB7 |
| Ovarian cancer cell lines | CCDC169, LEFTY1, TNFRSF11B, UQCRFS1P1, BMP7, BMP6, HYAL1, COBLL1, SLC39A4, LGI2, NELL2, FUOM, LRRD1, RNF13, MGRN1, TMEM127, GFPT2, S1PR2, IL6R, F2R, CLCN5, FAM189B, CD83, TPRN, RFTN2, OTUD7B, MFSD12, LPCAT2, SESTD1, TPRA1, ZDHHC14, MYOCD, DEPTOR, GDPD5, SNX33, SLC9A6, GUCD1, CEP41, TMEM138, TMEM9B, SLC17A5, MIOS, NEU3, ARHGAP32, UPK3BL, UPK1B, CALCA, CALCB, NPR3, DDI2, DIRAS2, KIF13A, TMEM100, EI24, RBMXL2, DGAT1, ZFPL1, PTGS1, FAM50A, TMEM184A, HEATR3, GPR149, ITFG1, ACBD6, UPK3B, OSBPL11, TPK1, TMEM38A, LCMT1, STRIP2, SMIM22, KCNAB3, CFI, ADRA2A, PLA2G16, LY6D, LYPD2, GSPT2, ABCC12, PTPRH, SLC52A3, AHR, GLUD2, PREX2, ANKRD13A, CHAC2, DHRS2, MYL10 |
| Prostate cancer cell lines | TRBC2, CAPN9, MSMP, UTS2B, MYOZ2 |
| Renal cancer cell lines | C1QL1, PTGDS, CCBE1, FOXN4, GAL3ST1, MPHOSPH10, TLR3, KIF5C, COQ9, PEX14, MT-ND1, MT-ND4, NR3C1, FECH, CPT2, TBXAS1, GGCX, CRAT, MRPS15, MXRA7, BCL2L1, STIM1, MLF2, ETFDH, GLYR1, IFI44L, NHLRC3, ACBD5, SLC27A4, TMEM65, APOOL, SYVN1, GPR180, COMTD1, DOLPP1, LEPREL1, MFN1, MICU2, SLC39A11, GHDC, CNEP1R1, POGLUT1, UBAC2, CCDC54, NUP35, IFI44, TOMM6, CCDC127, TAMM41, DNAJA3, PTCD3, ZFR, TMEM68, TMEM209, MGME1, MRPL45, TMEM120A, LMAN2L, HSD3B7, GHITM, ALG2, ABCB8, CLN6, SDHAF2, BCS1L, POLDIP2, MRPS2, BCL2, LIPA, TNFAIP6, HOGA1, CBR4, LRRN4, OSCP1, HSD17B8, GALNT14, ASIC4, EPHA8, DUSP2, HDAC3, CXCL6 |
| Tissue type | Gene name |
|---|---|
| Breast cancer cell lines | ATP2B2;SECTM1;SPON2;FLJ44635;ACTA2;TMEM245;FBLN1;FBLIM1;GRK5;GRHL2;LIN37;CHD1;CLN8;IFITM2;CDK11A;SEMA3D;ATXN2;RTEL1;CTAGE1;AKIRIN2;TAF8;APBA3;DPY19L2;AGR3;GIPC3;BNIPL;TTC39A |
| Central Nervous System cancer cell lines | MRPL16;DKK3;NIP7;BIRC2;TRA2A;PURA;RPL35A;VAT1L;C7orf50;ZNF532;OR2Z1;RPL36;TIMP3;ASB1;RPL15;CHTOP;CTNND1;EPHA3;ENSA;ZNF813;LRRC15;PAK6;IFI6;HSPB7;CDC42EP3;PIPOX;SCUBE3;CHI3L1;SGCB;FGF1;SIRT2;CBLB;MOG;SLC6A8;PBX1;MICA;DEPDC1B;LYPD1 |
| Colon cancer cell lines | ARHGAP26;LGALS4;FABP1;MUC13;SAYSD1;KLK6;HNF1A;B3GALT5;PLXNA4;AZGP1;PRUNE1;UGT1A10;AKR1C4;PCK1;AKR7A3;SDCBP2;TMEM62;RBP2;CALML4;BCL2L15;TTC39B;TRPM4;HNF4A;FAM122B;NPAT;ZBBX;TOX3;SERPINB3;ASPRV1;ACTR3B;WDR74;SYF2;UGT1A8;VSIG2;GRK4;TNFAIP8L3;SAMD12;TMEM139;FAM207A;ZFPM1;PHYHIPL;GLS2;SYN1;NAA40;FGD5;GPN2;XPA;SF1;ZNF732 |
| Leukemia cell lines | WAS;TRAT1;CD3E;IKZF1;GRAP;CD7;RCSD1;RHOH;CD1B;S1PR4;ALOX5AP;NCKAP1L;PTPRCAP;SMIM24;CD5;HCLS1;GRAP2;SH2D1A;RILPL2;MZB1;GIMAP1;ARHGAP15;CXCR4;ARNT;JAK3;PRKCB;ITGAL;SKAP1;SIVA1;KIR3DL2;PSD4;FLI1;HACE1;CCDC28B;LAIR1;BIN2;SAMSN1;LDB1;PAXIP1;CD4;ARV1;SERPINB10;TYROBP;AZU1;SKAP2;PRTN3;ELANE;NCF4;H2AFY;PLEK;SEPT6;JPT2;PRAM1;BPI;SESN2;ARHGAP6;HOXB9;RNF138;HEMGN;ANKRD10;SLITRK3;DUSP22;CCND2;CRYBB1;PTPN18;PVALB;MYO5A;GPD1;ITGB7;ABHD3;ANKRD46 |
| Melanoma cell lines | MAFF;PAGE2;ZNF616;UGT1A5;ALKBH6;PDHA2;NAGS;GRM7;SNX10;SLC16A6;ZBTB21;PRRX1;EDARADD;RHBDD3;NFYA;NATD1;BCL2A1;CKMT2;FCER1G;TRPV4;GOLGA7B;OGDHL;MICAL1;LIN28A;UBXN8;ID4;KIF2B;FOLR1;SIK3;TMEM8A;SMARCD3;PLA1A;ENTPD1;P2RX7;EYA4;PPFIBP2;DNER;PODXL2;ANGEL2;OMA1;LRRN4CL;EFHC2;ABCD2;CLCN2;SDC3;AGMO;C1QTNF3 |
| Non-Small Cell Lung cancer cell lines | SNAP25;CYP24A1;PRKCE;CLDN2;CTSV;EIF5A2;TFPI2;HSD3B7;C1QTNF6;C2orf54;RPAIN;C1S;SNX19;PSG5;TMEM14B;PDCD1LG2;FDXR;SLC22A5;CCDC80;DDX46;DERL3;GLYR1;SPRR3;PPM1L;CYP4F3;KLHL32;TUBB1;MAP4K4;PTGS2;NR0B1;TNFRSF10A;SLC39A8;RAB3C;GJA5;SCARA5;UBA52;EPHA5;ATP2A1;SEMA3A;PPP1R9B;EMB;CCNY;EIF4E3;LTV1;ZNF713;ZNF695 |
| Ovarian cancer cell lines | PYROXD2;CEACAM5;MUC4;PCDH1;OXTR;DPH3;TMEM138;FAM89B;SETD9;AMN1;PNMT |
| Prostate cancer cell lines | SLC18A2;CPM;ATP6V1B1;HECTD1;GPN3;REG4;ZNF784;KIF4B;PKIA;RRAGB;PEMT;RNF115;HAUS7 |
| Renal cancer cell lines | TNFSF10;ENPEP;TPST2;PNISR;LRRN4;TMEM14A;PDZK1IP1;C1QL1;GBP2;HAVCR1;RARRES2;PLG;SHISA2;KCNIP1;LOXL4;MYLK;ERC2;HNF1B;ABLIM3;RELB;PYROXD1;MT1M;KMO;TCAF2;DKK1;PLCXD3;BPIFA1;SDS;BPIFB1;SEC31A;CLEC4E;CD200;C12orf75 |
| Tissue type | #Exosomes | #Cellular | #Intersect | Intersect gene names |
|---|---|---|---|---|
| Breast cancer cell lines | 54 | 27 | 4 | LGALS4;KLK6;ARHGAP26;PHYHIPL |
| Central Nervous System cancer cell lines | 32 | 38 | 3 | LYPD1;PIPOX;MOG |
| Colon cancer cell lines | 100 | 49 | 0 | |
| Leukemia cell lines | 152 | 71 | 2 | C1QL1;LRRN4 |
| Melanoma cell lines | 67 | 47 | 3 | ENTPD1;TRPV4;PLA1A |
| Non-Small Cell Lung cancer cell lines | 62 | 46 | 21 | SH2D1A;S1PR4;CD7;HCLS1;KIR3DL2;JAK3;RHOH; |
| Ovarian cancer cell lines | 88 | 11 | 1 | TMEM138 |
| Prostate cancer cell lines | 5 | 13 | 2 | AKIRIN2;SECTM1 |
| Renal cancer cell lines | 81 | 33 | 2 | GJA5;RAB3C |
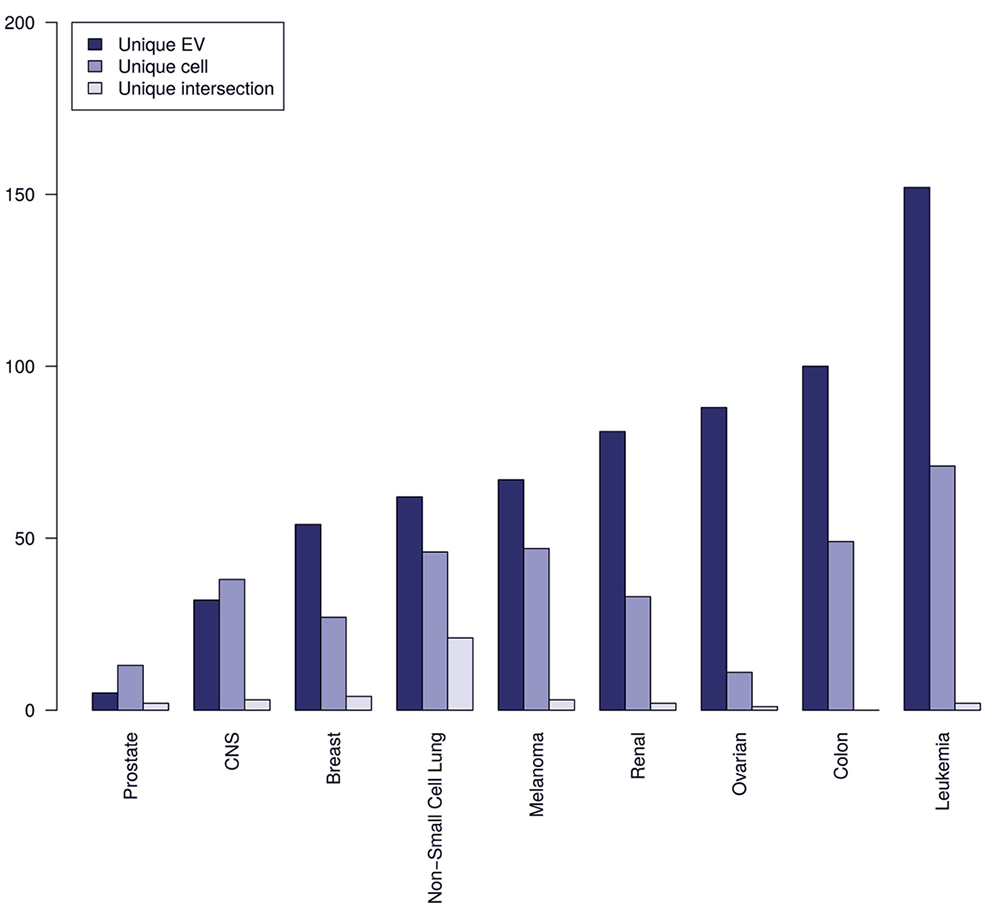 Figure 4
Comparison of the number of unique proteins from EVs, whole cell extracts, and their intersection based on grouping of the 60 cancer cell lines into tissue of origin.
Interestingly, EV proteomes, for the current analyzed data sets, provide more unique proteins than the full cellular proteomes with the only exception of data from prostate and CNS cell lines. We additionally observe that a smaller subset of unique tissue specific markers co-occurs for both raw cell extracts and EVs, providing stronger evidence that these intersect subsets of proteins are tissue specific. Non-Small cell lung cancer has the biggest intersect of unique proteins from raw extract and EVs making a good argument for clinically testing EVs potential for predicting tissue of primary tumor origin in non-small cell lung cancer. Non-small cell lung cancer is also the most prevalent histological type of lung cancer. Overall, in terms of predicting tissue of origin of primary tumor the above results look promising. Caveats include the fact that this picture might change when more cancer cell lines are included and that liquid biopsies from patients also contains EVs from stromal and immune cells, which could obscure the specificity in predicting tissue of origin of primary tumor. Currently, there is a need for membrane markers for specific subpopulations of EVs from different cell types in the microenvironment. Nevertheless, a previous study (28) describes antibody staining and membrane markers for the following cell types: 1) erythrocyte - CD235a; 2) lymphocyte - CD3, CD4 and CD8; 3) neutrophil/granulocyte - CD66b and CD66e; 4) monocyte - CD14; 5) platelet - CD41, CD42, CD61 and 6) endothelial cell - CD105, CD144 and CD62.
EVs have raised the interest in cancer biomarker discovery, as vesicles are ubiquitous in body fluids, and can potentially be a source of biomarkers for diagnosis, prognosis and disease management, using minimal invasive methods. EVs contain functional characteristics of secretory cells; therefore, it is relevant to access if EVs carry proteome traits of the cancer hallmarks. To validate this assumption, we have compared the proteomes of cellular and derived EVs of the NCI-60 cell line panel, focusing on protein families associated with biological processes involved in proliferation, apoptosis, angiogenesis and invasion and metastasis. Overall, we found similar number of cancer hallmark signature associated proteins identified for EVs and cells (Figure 5). The fractions of identified cancer hallmark associated proteins were between ~23-63%. Nevertheless, differences in significant enrichment were observed for the signatures belonging to protoonco genes, EMT and angiogenesis. The significance of enrichment was higher for EVs than cells for protoonco genes, EMT and angiogenesis. The factors in ubiquitin proteasome system (UPS) are known to be up regulated in cancer and therefore they were also investigated. All components for functional UPS system were identified in both EVs and cells. All proteasome factors annotated in UniProt except from PSMA8 and PSMB11 were identified. An interesting question is if the proteasome factors are internal or externally bound to exosomes. The fraction of DUBs and E1, E2 and E3 ligases identified in cells were higher than in EVs. The overall high similarity between cellular proteome and EVs in Figure 5 was based on identified proteins across all cell lines. Next, we explored if detailed expression values for the proteins associated to each of the cancer hallmarks display high similarity as well.
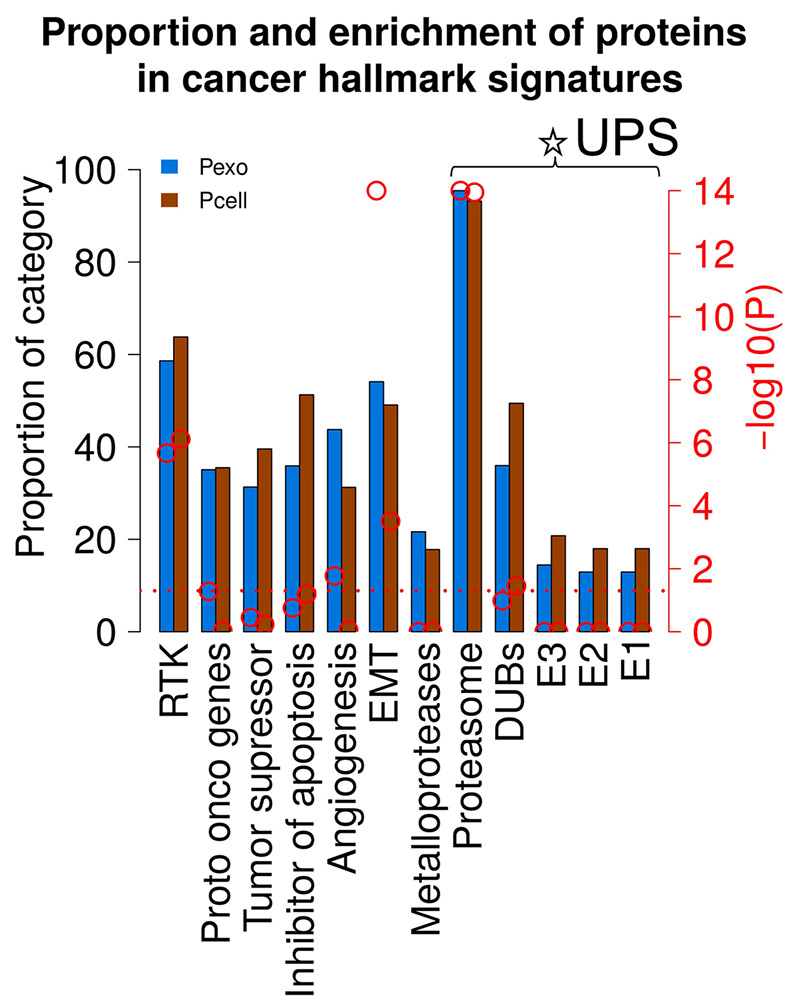 Figure 5
Comparison of functional enrichment analysis of cancer hallmark signatures results in cells versus EVs. Proportion of proteins identified in cancer hallmark associated protein signatures are indicated blue (EVs) and brown (cells) columns and by the left axis. Red circles and right axis indicate –log10 P value obtained from functional enrichment analysis. Red horizontal dashed line indicates P value of 0.05.
The protein family of receptor tyrosine kinases (RTK) activates intracellular signaling pathways, upon extracellular stimuli such as proliferative signaling, comprising of oncoproteins and tumor suppressors as key components. Abnormal RTK activation in human cancers result in altered activity, expression, subcellular localization and regulation, via autocrine activation, chromosomal translocations, RTK overexpression, and gain-of-function mutations. Abnormalities in RTKs are also linked to pre-cancer diseases such as inflammation or in later processes of cancer development like angiogenesis. RTKs are one of the preferred targets for cancer drug development. Therefore, it is of extreme relevance to investigate if RTKs expression in EVs can prevent binding of RTKs inhibitors to their targets in the cells by acting as decoys, leading to ineffective treatment. FDA has approved several small-molecule inhibitors and monoclonal antibodies by targeting RTKs for cancer therapy. The key drugs include Imatinib (against PDGFR, KIT, Abl, Arg), Sorafenib (against Raf, VEGFR, PDGFR, Flt3, KIT) and Lapatinib (against EGFR, ErbB2). In general, proteins belonging to protein families such as receptor tyrosine kinases (RTKs), oncoproteins and phosphorylated proteins possess the potential to transfer signals resulting in cell proliferation. A truncated and oncogenic form of the epidermal growth factor receptor (EGFR), known as EGFRvIII, transfers tumorigenic activity through MVs in gliomas (29). RTKs often serve as anti-cancer drug targets and a previous study demonstrated that e.g. CD20 targets, excessively secreted in EVs, shield the CD20 cellular target on cancer cells (16). We consequently investigate which RTKs are abundant in the EVs derived from the NCI 60 cell lines (Figure 6).
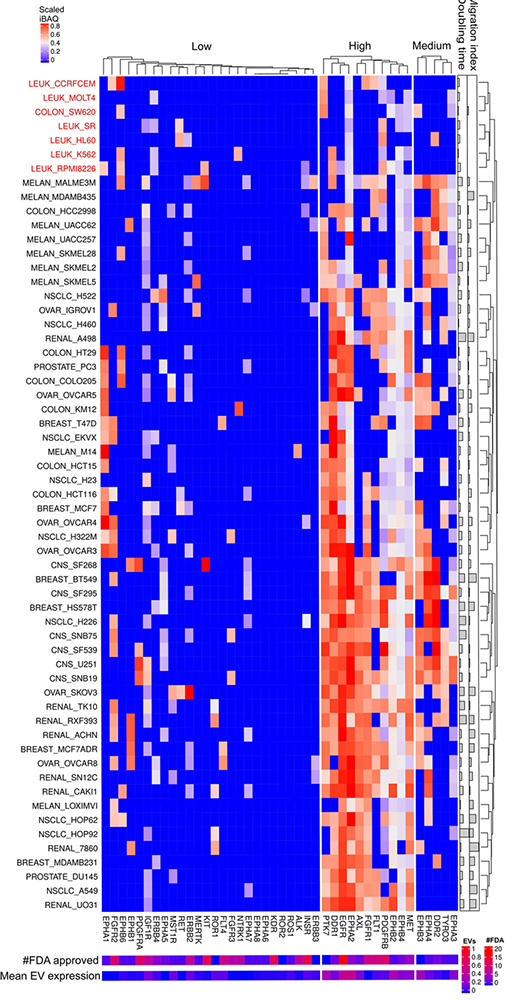 Figure 6
Receptor tyrosine kinases expressed in cells and EVs. The lower right color bar indicates the color code for the heatmap as iBAQ values scaled between 0 and 1. The bar and color bar labeled #FDA on the right indicates the number of FDA approved drugs targeting the identified RTKs. The bar and color bar labeled EVs depict the mean scaled iBAQ value in EVs from the same set of cell lines. Cell lines color coded red displays are lower expression of the widely expressed RTKs.
Quantitative analysis of RTKs´ scaled iBAQ values from cellular proteome revealed three expression clusters, designated low, medium and highly expressed proteins across the NCI-60 human tumor cell line panel (Figure 6). Eleven RTKs are highly expressed in most cancer cell lines except for the leukemic cell lines (highlighted in red in Figure 6) together with a subset of colon, breast and melanoma. The leukemia-derived cell lines have in general a low overall expression of RTKs and migration index. Overall, cell lines with low migration index showed lower RTK expression levels than cell lines with higher migration index (see Figure 6). This stands somewhat in contrast to previous studies proposing FLT3, KIT, IGF1R or PI3K as target for acute myeloid leukemia. However, most of the leukemia cell lines, analyzed in the present study, are from acute lymphoblastic leukemia where the most frequent cause is BCR-ABL. EGFR is widely expressed in EVs from almost all cancer cell lines and is also the RTK targeted by many FDA approved drugs (DrugBank provided the source of FDA approved drug targets, https://www.drugbank.ca/). Interestingly, AXL, EPHB2 and PTK7 are highly expressed as well but not targeted by any FDA approved drugs. Further, MS analysis detected high levels of PTK7, EPHB2 and AXL in EVs from the same cell lines (Figure 7). EPHA2 and EPHB4 proteins are members of the Eph receptor-ephrin system associated with tumor migration and invasion mechanisms (30). Indeed, proteins of the EPH family are mostly undetected in NCI-60 leukemia cell lines with a correspondent lower migration index among all cell lines. Pro-proliferative effect of senescence cells on MCF-7 cells depends on the presence of EPHA2 on small like-EVs such as exosomes (31). Given that EGFR is often mutated and exhibit enhanced activity in many cancers the above mentioned mechanism for gliomas might be present for other tumors as well. Moreover, EGFR is frequently targeted by anti-cancer drugs such as gefitinib, erlotinib and lapatinib. Further investigations need to address if EV expressed EGFR can shield the cancer cellular expressed EGFR as have previously been observed for CD20.
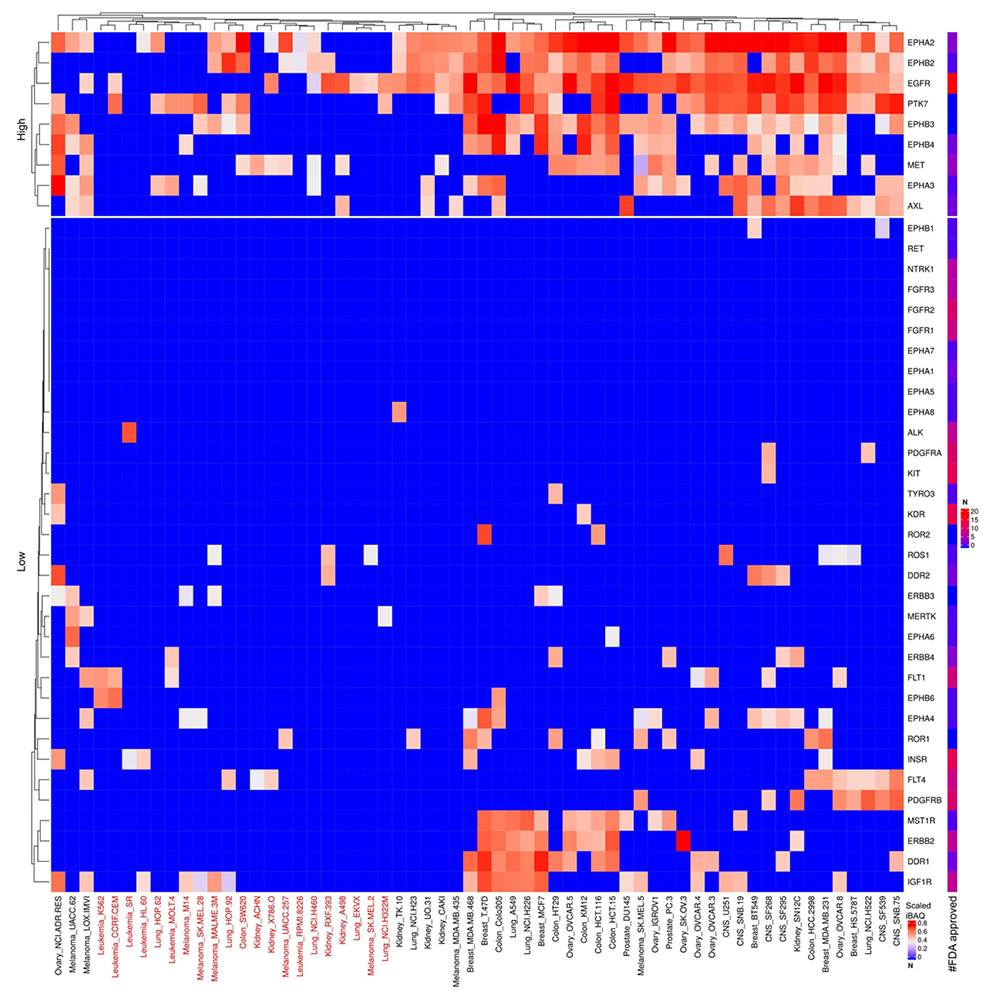 Figure 7
Scaled iBAQ expression values for RTKs in EVs obtained from NCI cell lines. The lower right color bar indicates the color code for the heatmap as iBAQ values scaled between 0 and 1. The bar and color bar labeled #FDA on the right indicates the number of FDA approved drugs targeting the identified RTKs. EVs from cell lines, color coded red, display are lower expression of the otherwise widely expressed RTKs.
Nineteen proteins are in the cluster of high and widely expressed onco-proteins and approximately half of these are also highly expressed in EVs (see Figure 8-9). Especially, the onco-proteins RHOA, PHB, FUS and NPM1 are among the top 20% most abundant proteins across basically all cell lines. None of the FDA approved drugs target these proteins. RHOA is a small GTPase protein belonging to the Rho family which is found overexpressed in many malignancies.
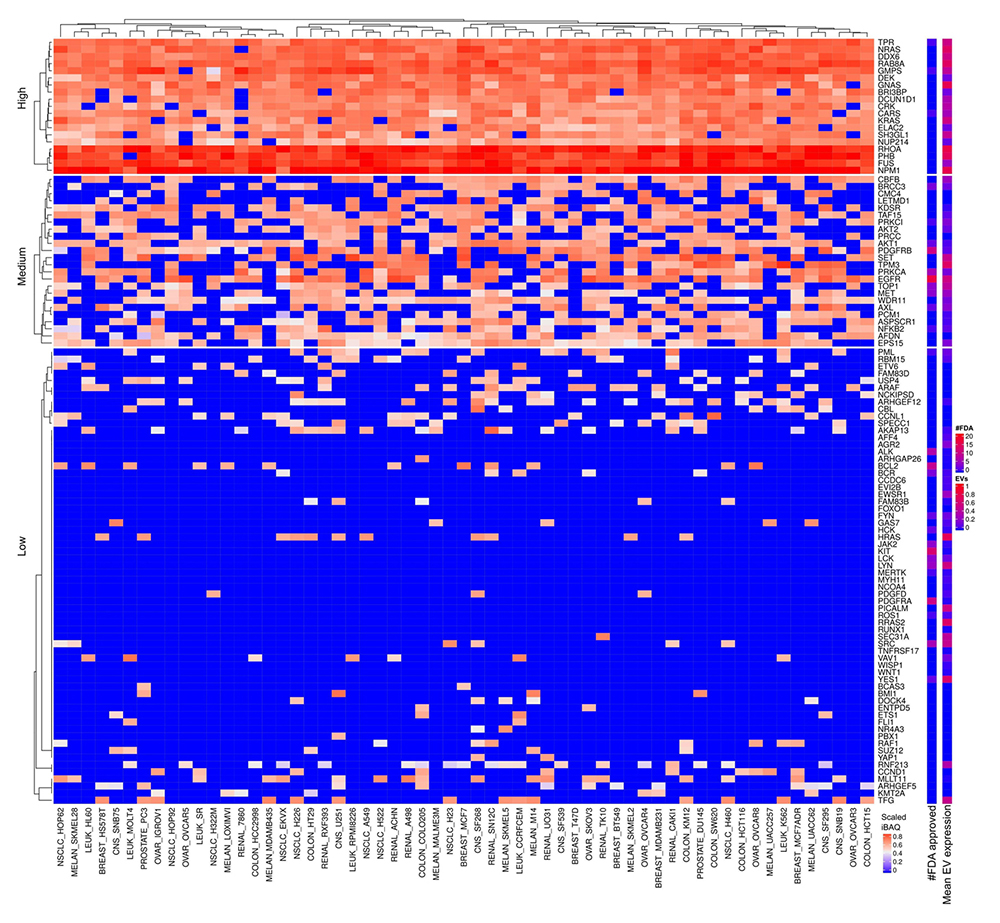 Figure 8
Onco-proteins expressed in cells and EVs. The lower right color bar indicates the color code for the heatmap as iBAQ values scaled between 0 and 1. The bar and color bar labeled #FDA on the right indicates the number of FDA approved drugs targeting the identified onco protein. The bar and color bar labeled EVs depict the mean scaled iBAQ value in EVs from the same set of cell lines.
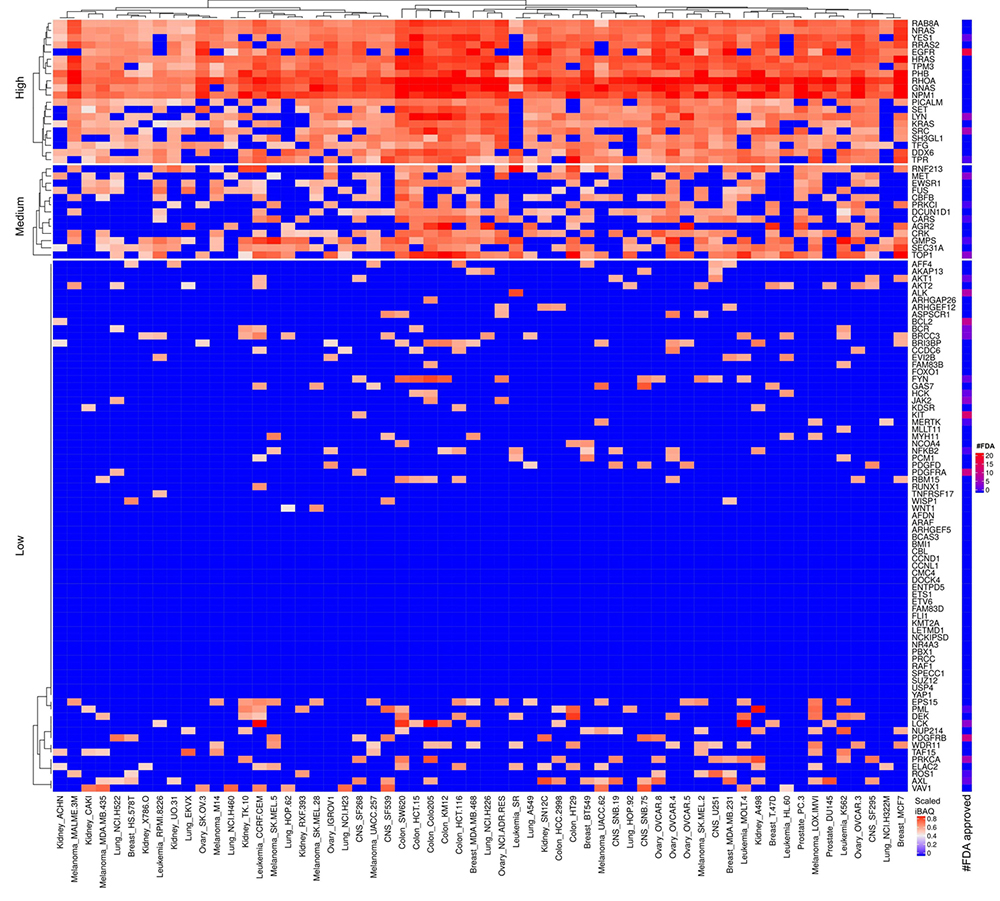 Figure 9
Scaled iBAQ expression values for oncoproteins in EVs obtained from NCI cell lines. The lower right color bar indicates the color code for the heatmap as iBAQ values scaled between 0 and 1. The bar and color bar labeled #FDA on the right indicates the number of FDA approved drugs targeting the identified oncoproteins.
Prohibitin (PHB) is ubiquitously expressed and evolutionally conserved protein suggesting that it would be a poor cancer target despite the high abundance across cell lines. Moreover, PHB has anti-proliferative function and tumor suppressor characteristics. Nevertheless, a previous study (32) describes anti- and pro-tumorigenic roles of PHB in cancers but still the dual role, as pro- and anti-tumorigenic, makes PHB a complex potential cancer therapeutic target.
FUS is a DNA/RNA-binding protein with various roles such as transcription regulation, RNA splicing, RNA transport, DNA repair and damage response (33). Interestingly FUS is less abundant in EVs together with DEK which also participates in DNA/RNA binding. Active DNA repair and damage response in cancer correlates with poor treatment outcome of chemotherapy. The role of FUS in DNA repair and damage response potentially might deliver differential toxicity between normal cells and cancer cells. Ward et al demonstrated that loss of FUS expression by RNA interference intensely impairs cellular proliferation presumably by mitotic arrest (34). Nucleophosmin (NPM1) is a ubiquitously expressed nucleolar phosphoprotein. The literature describes NPM1 as overexpressed, mutated, rearranged and deleted in human cancer with functions in both proliferation and growth-suppression pathways (35).
We observed several overexpressed tumor suppressors across all cellular proteomes (Figure 10) and to less extent in EVs (Figure 11). It might appear peculiar that tumor suppressors are over expressed in cancer. However, the observed overexpressed tumor suppressors identified by MS might mainly represent mutated inactive forms of the proteins. Nevertheless, the proteins we discussed below are widely overexpressed in all cancer cell lines and the mutations that inactivate them occur in low frequency in small subgroups of cancers. Therefore, inactive tumor suppressor protein forms do not fully explain the high and broad expression of the specific tumor suppressors. The above discussion mentioned cases of proteins having both anti- and pro-tumorigenic properties. The literature describes more cases of proteins defined as both anti- and pro-tumorigenic than the signatures from UniProt. Nevertheless, the oncoprotein and tumor suppressor signatures from UniProt also intersect with proteins such as MAFB, PRKCI, MAF, FES and PML. For these proteins, mutations, protein modifications and interaction factors play a critical role in determining anti- versus pro-tumorigenic function of a specific protein.
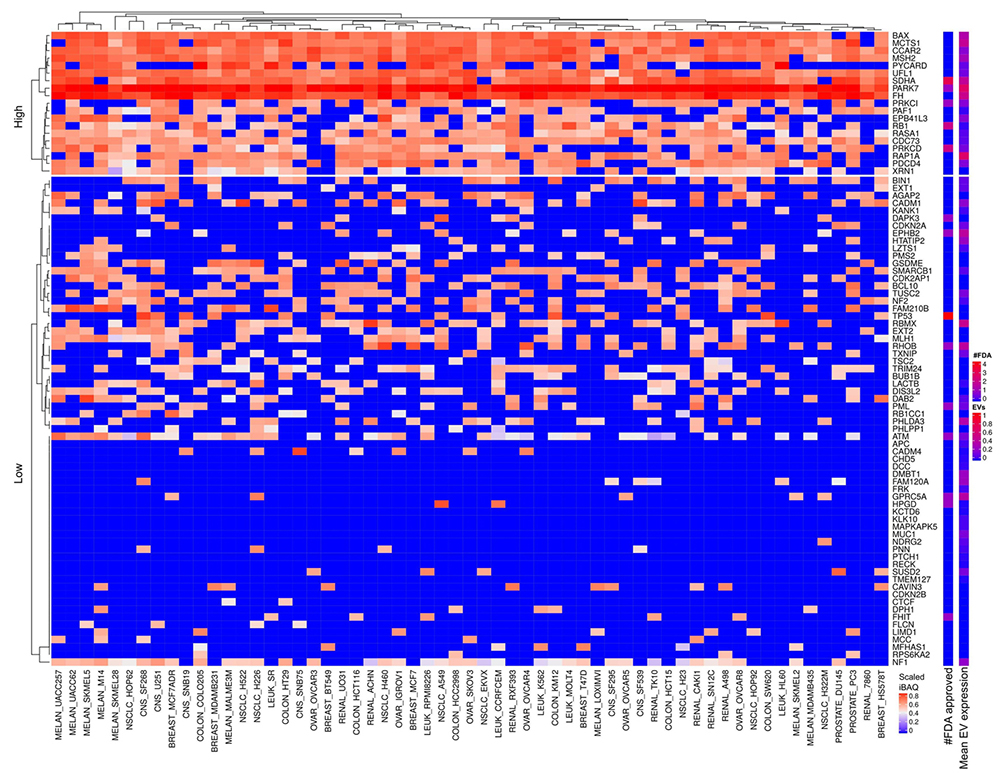 Figure 10
Tumor suppressor proteins expressed in cells and EVs. The lower right color bar indicates the color code for the heatmap as iBAQ values scaled between 0 and 1. The bar and color bar labeled #FDA on the right indicates the number of FDA approved drugs targeting the identified Tumor suppressor protein. The bar and color bar labeled EVs depict the mean scaled iBAQ value in EVs from the same set of cell lines.
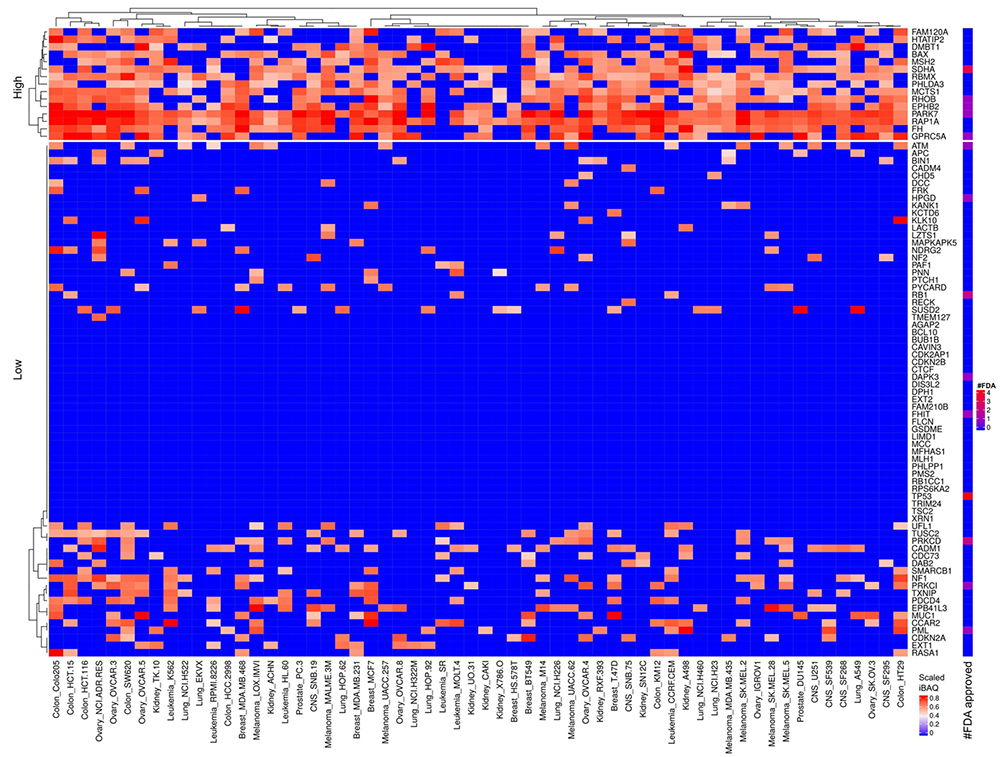 Figure 11
Scaled iBAQ expression values for tumor suppressor proteins in EVs obtained from NCI cell lines. The lower right color bar indicates the color code for the heatmap as iBAQ values scaled between 0 and 1. The bar and color bar labeled #FDA on the right indicates the number of FDA approved drugs targeting the identified tumor suppressor proteins.
In therapeutics, it is simpler to inhibit function than obtaining gain of function, which makes tumor suppressors less attractive as therapeutic targets. Nevertheless, ongoing research aims at better characterizing and understanding the proteasome ubiquitin system and how cellular systems specifically targets proteins for degradation. For example, if it is possible to inhibit an E3 ubiquitin ligase involved in ubiquitination and subsequent degradation of P53 then gain of function of P53 tumor suppressor activity might be achievable. This could be generalized by targeting E3 ligases specific to low expressed tumor suppressors.
The MS data showed that UFL1, SDHA, PARK7 and FH had the highest cellular expression of the tumor suppressors annotated in UniProt (Figure 10). UFL1 is an E3 protein ligase involved in covalent attachment of the ubiquitin-like modifier UFM1 to specific protein targets. UFL1 mediated UFmylation potentially targets proteins for degradation in a similar way as ubiquitin. Both germ-line and somatic deletion of RCAD/Ufl1 to inhibit UFmylation correlated with blocked autophagic degradation, increased mitochondrial mass and reactive oxygen species, and led to DNA damage response (36). DNA damage response failure in healthy cells leads to genomic instability and subsequently tumorigenesis. Well-known examples are BRCA1 and BRCA2 mutations that associate to mainly breast and ovarian cancer. On the other hand, BRCA1, BRCA2, PALPB2 and ATM mutations correlate with increased chemo resistance in cancer cells (37). Future investigation might address if modulation of UFM1 signaling potentially can sensitize cancer cells to chemo/radio therapy. Alternatively, combined inhibition of UFL1 and the proteasome with e.g. bortezomib might provide a boosted toxic effect by simultaneously blocking autophagy and the proteasome. Succinate dehydrogenase flavoprotein subunit (SDHA) functions in mitochondrial respiration and is involved in the synthesis of fumarate from succinate. Germline mutations in succinate dehydrogenase complex genes predispose individuals to a subgroup of cancers such as familial paraganglioma-pheochromocytoma syndrome (FPG) and gastrointestinal stromal tumors (GIST) (38). It is currently unclear how SDHA activity relates to therapeutic outcome (39). Fumarate hydratase (FH) is a mitochondrial protein involved in the synthesis of (S)-malate from fumarate which is part of the carbohydrate metabolism. Germline mutations in FH correlate with predisposition to cancer as well (40). It is curious that both SDHA and FH on one hand behave as tumor suppressor based on the above discussed cancer effect of germline mutation but on the other hand found highly and widely expressed in many cancer cell lines (Figure 10). PARK7 is a protein and nucleotide deglycase that catalyzes the deglycation of the Maillard adducts from proteins or nucleotides. PARK7 is considered a genetic risk factor for Parkinson’s disease. Additionally, PARK7 also acts as an oncogene and as therapeutic cancer target (41).
Even though cancer cells exhibited abundant expression of tumor suppressors, a plethora of combinatorial oncogenic events might lead to further cancer cell transformation (1). Therefore, for each cancer clone from the heterogenous population of tumor cells, a malignant phenotype depends on the status of protein-protein interactions upstream or downstream of tumor suppressors associated pathways. This might be reflected for example in the sorting of proteins in the genesis of endosomes and subsequently on the protein patterns in exosomes. Interestingly, several tumor suppressors described to act as metastasis suppressors or possessing proapoptotic as well as antiangiogenic properties, are upregulated in EVs compared to the cell of origin, such as oxidoreductase HTATIP2 (HTATIP2) and deleted in malignant brain tumors 1 protein (DMBT1) (Figures 10-11). Transfer of DMBT1 within exosomes, acts as a proangiogenic factor to promote wound healing in context of diabetic disease (42).
The most consistent and highly expressed apoptosis inhibitor and regulator proteins are ARL6IP1, DIABLO, AIFM1 and HSP90AB1. FDA approved drugs target none of these proteins (Figure 12). ARL6IP1 and HSP90AB1 are also abundant in the correspondent EVs (Figure 13). The apoptotic regulator ADP-ribosylation factor-like 6 interacting protein 1 (ARL6IP1) when inhibited by short hairpin RNA cause cell cycle arrest and mitigated cell migration in human cervical cancer (43). DIABLO, a pro-apoptotic protein, promotes apoptosis by negatively regulating IAPs and activating caspases. Upregulation of caspases both on the protein and mRNA level are frequent in cancers, which concur with the results in Figure 12. This seems paradoxical given the function of DIABLO to promote apoptosis. However, it was recently demonstrated that DIABLO participates in the regulation of phospho-lipid (PL) biosynthetic pathways essential for cancer development (44). AIFM1 like DIABLO participates in regulation of apoptosis but is also a NADH oxidoreductase. Hepatoma cell lines overexpressing full length AIFM1 displays growth inhibition and apoptosis (45). Though, under normal conditions AIFM1 protects against apoptosis and only promotes apoptosis under an apoptogenic stimulus (46). HSP90AB1, heat shock protein 90 kDa alpha, class B, member 1, is essential for many cellular processes and consequently for cell survival. Due to the frequent high mutational load in cancer cells, toxic mutated proteins accumulate. Chaperones and degradative pathways possess the capacity to clear these toxic proteins and therefore essential for cancers. HSP90AB1 promotes tumor formation and cancer cell proliferation and considered as a promising target for cancer therapy (47). HSP90AB1 and to some extent ARL6IP1 are highly expressed in EVs and consequently might horizontally transfer to other cells in the microenvironment (Figure 13).
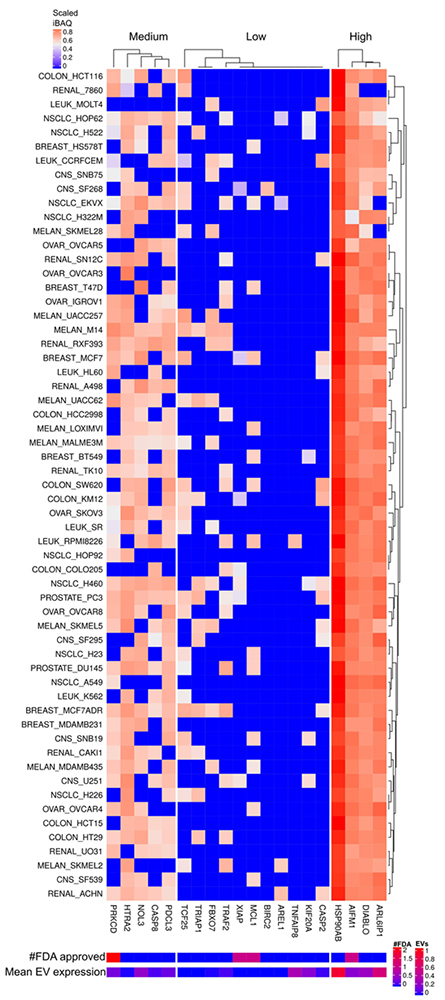 Figure 12
Apoptosis inhibitor and regulator proteins expressed in cells and EVs. The lower right color bar indicates the color code for the heatmap as iBAQ values scaled between 0 and 1. The bar and color bar labeled #FDA on the right indicates the number of FDA approved drugs targeting the identified Apoptosis inhibitors. The bar and color bar labeled EVs depict the mean scaled iBAQ value in EVs from the same set of cell lines.
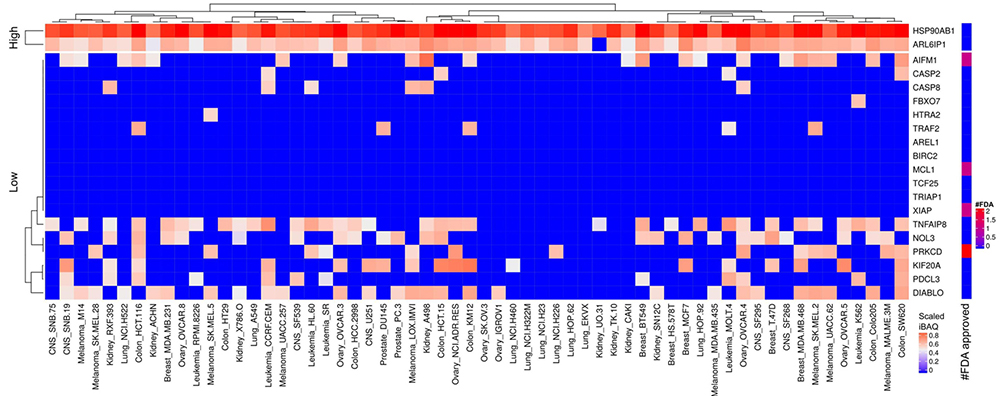 Figure 13
Scaled iBAQ expression values of inhibitor of apoptosis factors in EVs obtained from NCI cell lines. The lower right color bar indicates the color code for the heatmap as iBAQ values scaled between 0 and 1. The bar and color bar labeled #FDA on the right indicates the number of FDA approved drugs targeting the identified inhibitor of apoptosis factors.
The most consistent and highly expressed angiogenesis proteins are RNH1, NCL, MYH9 and ERAP1. FDA approved drugs targets none of these highly expressed angiogenesis proteins (Figure 14). RNH1, NCL and MYH9 were also found abundant in EVs (Figure 15). Cell line adaptation to cell culture medium might be the cause of the relatively low number of identified angiogenesis proteins. Nevertheless, 44% of all human annotated angiogenesis factors were detected in EVs whereas 31% in cells.
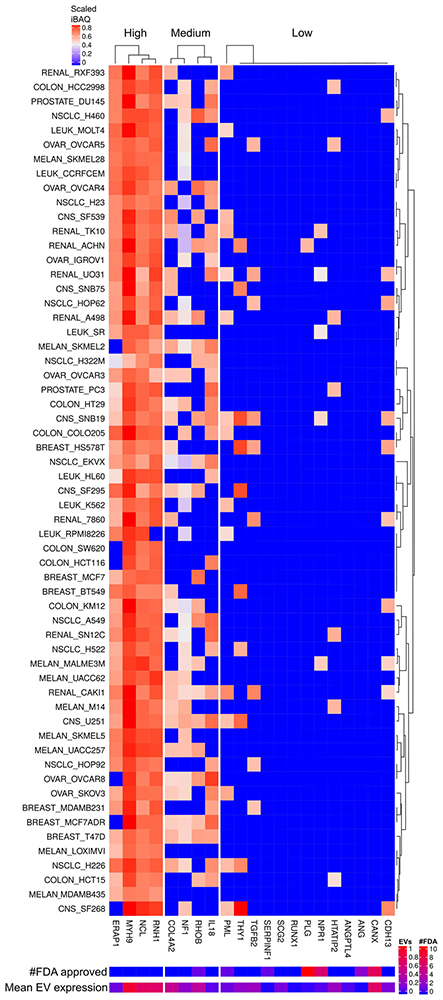 Figure 14
Angiogenesis factors expressed in cells and EVs. The lower right color bar indicates the color code for the heatmap as iBAQ values scaled between 0 and 1. The bar and color bar labeled #FDA on the right indicates the number of FDA approved drugs targeting the identified Angiogenesis factors. The bar and color bar labeled EVs depict the mean scaled iBAQ value in EVs from the same set of cell lines.
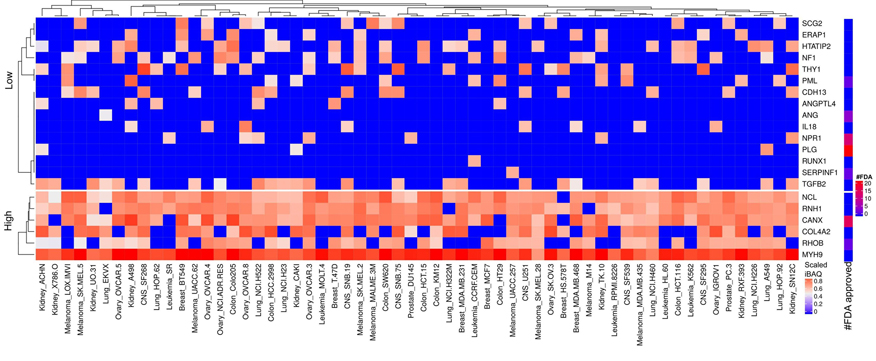 Figure 15
Scaled iBAQ expression values of angiogenesis factors in EVs obtained from NCI cell lines. The lower right color bar indicates the color code for the heatmap as iBAQ values scaled between 0 and 1. The bar and color bar labeled #FDA on the right indicates the number of FDA approved drugs targeting the identified angiogenesis factors.
RNH1 binds to ribonucleases and holds them in an inactive form. One of these ribonucleases is angiogenin (ANG), the first human tumor-derived protein found to stimulate the growth of blood vessels. RNH1 binds strongly to ANG but ANG were only detected in EVs in low levels (Figure 15). Furthermore, RNH1 functions as a regulator of HDACi resistance in gastric cancer cell lines (48). Nucleolin (NCL) belongs to a large family of RNA binding proteins and functions in ribosome biogenesis and chromatin structure regulation (49). NCL is frequently described as overexpressed in cancer cells and tumor-associated blood vessels. NCL supports tumorigenesis and angiogenesis. It is abundant in a variety of human neoplasias and associated with a high risk of relapse and poor survival (50). MYH9 acts as a physical linker between nucleolin and cytoskeleton and thereby involved in translocation of NCL in angiogenesis (51). miR-647 targets SRF, a transcription factor which promote tumor metastasis and MYH9 expression. miR-647 functions as a tumor metastasis suppressor in gastric cancer by targeting SRF and consequently also MYH9 (52). Endoplasmic reticulum aminopeptidase 1 (ERAP1) customizes the N-terminus of proteasome-generated peptides to accommodate loading onto MHC-I molecules in the endoplasmic reticulum (ER) of cytotoxic T lymphocytes. ERAP1 in cytotoxic T lymphocytes is critically involved in the process of tumor rejection (53). This raises the question as to why this protein is so highly expressed in cellular proteome but not EVs across all cancer cell lines (Figure 14-15). Evidence of ERAP1 involvement in angiogenesis and macrophage activation also exists (54).
FDA approved drugs that mainly control positively or negatively blood coagulation are available for a subgroup of the low abundant angiogenesis proteins. PML, an E3 ligase, is reoccurring in several signatures such as onco-proteins, tumor suppressor and angiogenesis factors. The FDA approved drug arsenic trioxide targets PML for treatment of leukemia that is unresponsive to first line agents. PML is in general low abundant or not detected but is expressed in some leukemia cell lines. Despite the lower expression of PML in HL60 there are reports of efficacy of arsenic trioxide in acute myeloid leukemia patients (55). This suggests that low abundant proteins especially with regulatory role should not be ignored as possible cancer drug targets. On the other hand, completely ignoring consistent and highly expressed proteins across all cell lines seems unreasonable.
The most abundantly expressed EMT factors across all cell lines are CD44, HSP90AA1, HSPB1, MSN, ANXA1, YWHAZ HMGB1 and PRDX1. FDA approved drugs target four of these proteins (Figure 16) for reducing inflammation, infections and improving tissue regeneration. Figure 17 depicts the scaled iBAQ values for low and sparsely expressed EMT proteins in cells. A large number of reports describe heat shock proteins as abundant in cancer such as for example HSP90AA1 and HSPB1 (56). This might be explained by large number of toxic mutant proteins in cancer cells, which heat shock proteins support their clearance. Investigation of CD44 as target in head and neck cancer is ongoing. Essentially, all the abundant EMT factors detected in raw cell extract are also abundant in the EVs (Figure 18).
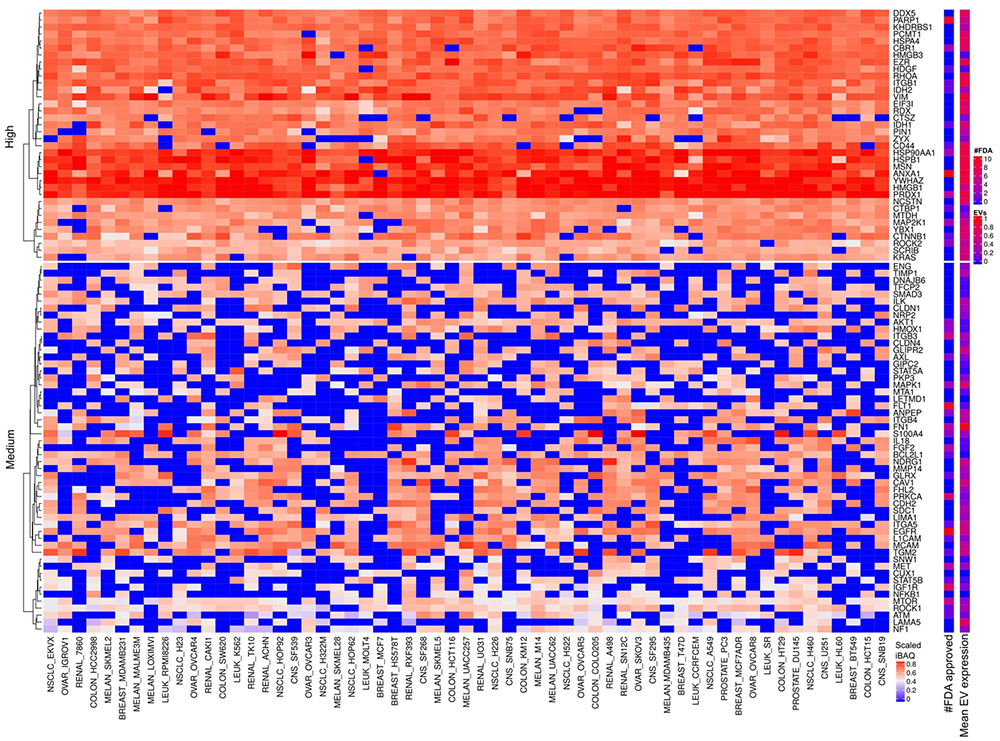 Figure 16
EMT factors expressed in cells and EVs. The lower right color bar indicates the color code for the heatmap as iBAQ values scaled between 0 and 1. The bar and color bar labeled #FDA on the right indicates the number of FDA approved drugs targeting the identified EMT factors. The bar and color bar labeled EVs depict the mean scaled iBAQ value in EVs from the same set of cell lines.
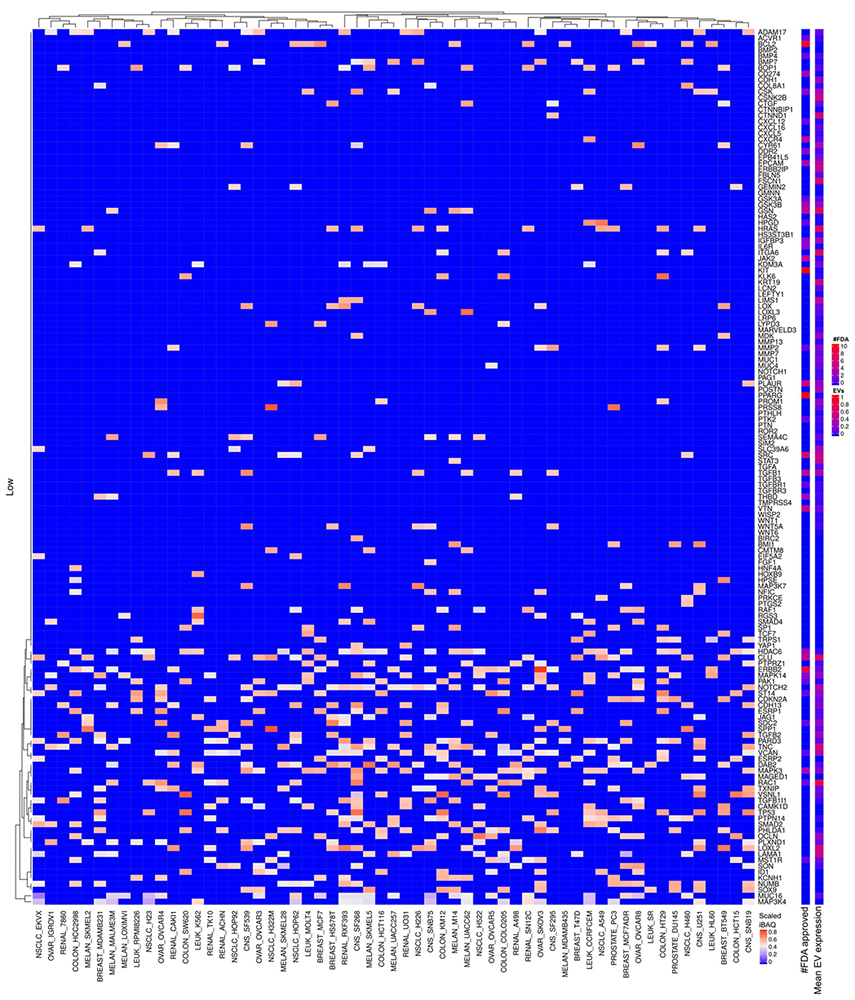 Figure 17
Scaled iBAQ expression values of low expressed EMT factors.
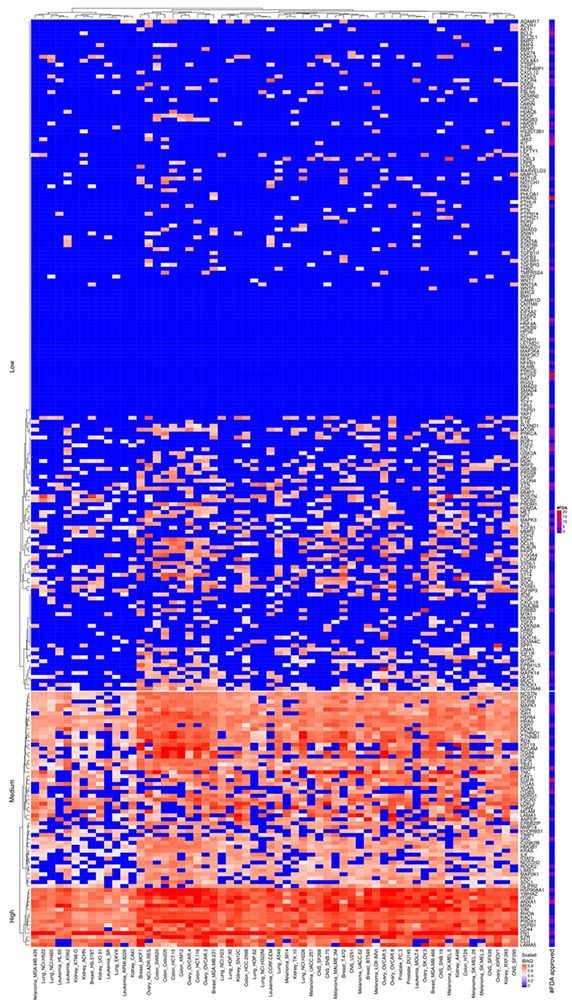 Figure 18
Scaled iBAQ expression values of EMT factors in EVs obtained from NCI cell lines. The lower right color bar indicates the color code for the heatmap as iBAQ values scaled between 0 and 1. The bar and color bar labeled #FDA on the right indicates the number of FDA approved drugs targeting the identified EMT factors.
There are 35 metalloproteases or protease homolog proteins highly expressed in most of the cancer cell lines. Only five of these have FDA approved drugs, which target other types of diseases than cancer (Figure 19). The most abundantly expressed are TFRC and PA2G4 which are inactive non-peptidase homologue according to MEROPS (57). TFRC are highly expressed in all cell lines which concur with the literature description stating upregulation of TFRC in proliferating cells, e.g., malignant cells compared to quiescent cells (58). PA2G4 contributes to proliferation and interacts with histone deacetylases (59). Furthermore, it functions as a transcriptional co-repressor of androgen receptor-regulated and cell cycle regulatory genes. LAP3 and NPEPPS (a.k.a. prostate specific antigen, PSA) are highly expressed in most of the cell lines (Figure 19) and annotated as functional metalloproteases in MEROPS. Based on the data in Figure 19 PSA appears as a non-specific cancer marker which conflicts with current knowledge based on RNA-seq. Future experimental evaluation hopefully validates the observed PSA protein expression patterns. Furthermore, EST profiles from UniGene confirm that PSA might not display prostate expression as specific as previously considered. UQCRC1/2 are mitochondrial inactive non-peptidase homologues previously found widely expressed in normal as well as in tumor tissues according to UniGene. PSMD14 is a 26S proteasome non-ATPase regulatory subunit which cleavages Lys-63 poly-ubiquitin. Lys-63 poly-ubiquitin linkage is proposed to target proteins to proteasome degradation but also involved in non-degradative signaling (60). It is well described that proteasome is abundant and highly active in cancer and therefore explored as a target for anti-cancer therapies (61). However, currently no FDA approved drugs targets PSMD14 (Figure 19). ADAM10 cleaves the membrane-bound precursor of TNF-alpha and is being considered as a promising target for cancer and inflammation (62). Methionine aminopeptidase 2 (METAP2) is a bifunctional protein regulating post-translational processing and protein synthesis and reported highly abundant in various cancers (63). D-methionine is an FDA approved drug targeting METAP2 that protects against weight loss upon chemo- or radiotherapy. However, there is no FDA approved drug targeting METAP2 as an anti-cancer strategy. Several FDA approved drugs targets IDE, an insulin degrading enzyme, for skin infection but not cancer. We observe low levels of extracellular proteases involved in remodeling extra cellular matrix which might be a function lost in the cell lines. Nevertheless, MMP14 was found at medium expression values in approximately half of the cell lines. Most of the metalloproteases or homologs of metalloproteases abundant in the cancer cells are also abundant in EVs which means that they might suffer from EV mediated tumor shielding if exploited as an anti-cancer target (Figure 19-20).
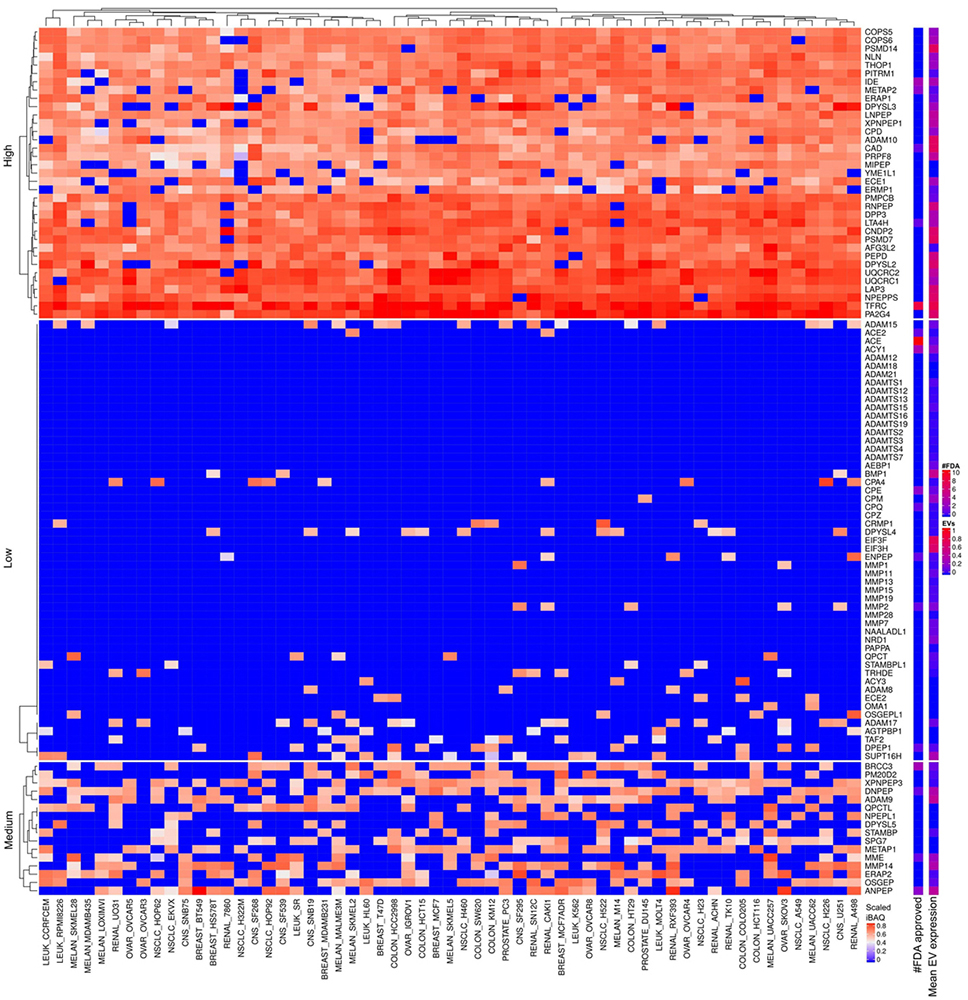 Figure 19
Metalloproteases expressed in cells and EVs. The lower right color bar indicates the color code for the heatmap as iBAQ values scaled between 0 and 1. The bar and color bar labeled #FDA on the right indicates the number of FDA approved drugs targeting the identified Metalloproteases. The bar and color bar labeled EVs depict the mean scaled iBAQ value in EVs from the same set of cell lines.
The analysis in section 5 focused on abundant proteins associated to cancer hallmarks. Proteins with differential abundance in EVs compared to cells can potentially shed light on the function of EVs. To address if there are abundant EV proteins present at low abundance in the cells, we next extracted the top 10% most abundant EV proteins for each cell line data set and then enquire which of these proteins were consistent among the top 10% abundant proteins across EVs from all cell lines. Trypsin-2 (PRSS2) and ACTG1 were the most abundant and consistently expressed proteins in EVs across all cell lines. The present meta-analysis maintained the identified proteins from the original study. Although, the original study included a database of common contaminants for the MSMS search, human PRSS2 displays 89% identical amino acid residues with trypsin used for digestion during sample preparation and therefor most likely represents a contamination from the protein digestion step. Nevertheless, PRSS2 is observed at high levels in pancreatic juice and its expression correlates with pancreatitis and pancreatic cancer (64). PRSS2 activates carcinoma invasion by processing tight junctions and activating ProMT1-MMP (65). Therefore, the potential overlap of tryptic peptides from PRSS2 and trypsin used for protein digestion might constitute a problem for cancer proteomics studies. Actin, cytoplasmic 2 (ACTG1) is ubiquitously expressed and involved in multiple types of cell motility. Destabilizing ACTG1 suppresses cancer cell migration (66). ACTG1 is commonly co-isolated with EVs (67). It has been acknowledged that absolute purification of EVs is unattainable. As it is, the composition of EV preparations contains also components of non-EV co-isolated structures. For example, proteins associated to other intracellular compartments than plasma membrane/endosomes and secreted proteins recovered with EVs (67). It is conceivable that during secretion of EVs to the extracellular space monomers of cytoskeleton actin in the microtubules might remain bound to the vesicles to some degree after detachment from the cells.
The protein LGALS3BP were also found highly abundant and consistently expressed in EVs except from mainly leukemia cell lines and showed low expression in cellular proteomes (data not shown). LGALS3BP binds specifically to a human macrophage-associated lectin (Mac-2) and to galectin 1. LGALS3BP serum levels predict the presence of fibrotic nonalcoholic steatohepatitis (NASH) and NASH cirrhosis (68). LGALS3BP is classified as a secreted protein frequently recovered with EVs (67). However, LGALS3BP might possess a functional role associated to EV function. Especially, the lower abundance in EVs from leukemia cells question LGALS3BP as general contaminant.
We mainly discussed the highly expressed proteins. Nevertheless, the abundant proteins might represent mutated nonfunctional forms in which case inhibition will cause the opposite effect than the intended tumorigenic inhibition. Nonetheless, integrating the consistently abundant proteins across all cell lines with mutational data on NCI cell lines from The Cancer Genome Atlas database, we find relatively that low percentage of the cell lines contain mutation or copy number alteration in the genes encoding these abundant proteins (Figure 21). There is also the issue of toxicity upon targeting the abundant proteins. Nevertheless, we found FDA approved drugs that target a subset of the top abundant proteins. We observed consistent high abundant proteins belonging to signatures associated to the investigated hallmarks of cancer in both cellular and EV proteomes. Therefore, the findings are consistent with the frequent literature presented hypothesis that EVs can horizontally transfer protein factors that promote genomic instability, cellular growth and migration (69, 70). Leukemia cell lines clustered together mainly for RTK and total expression values. In addition, expression values based on signatures of extracellular matrix and cell adhesion confidently clustered together leukemia cell lines (data not shown).
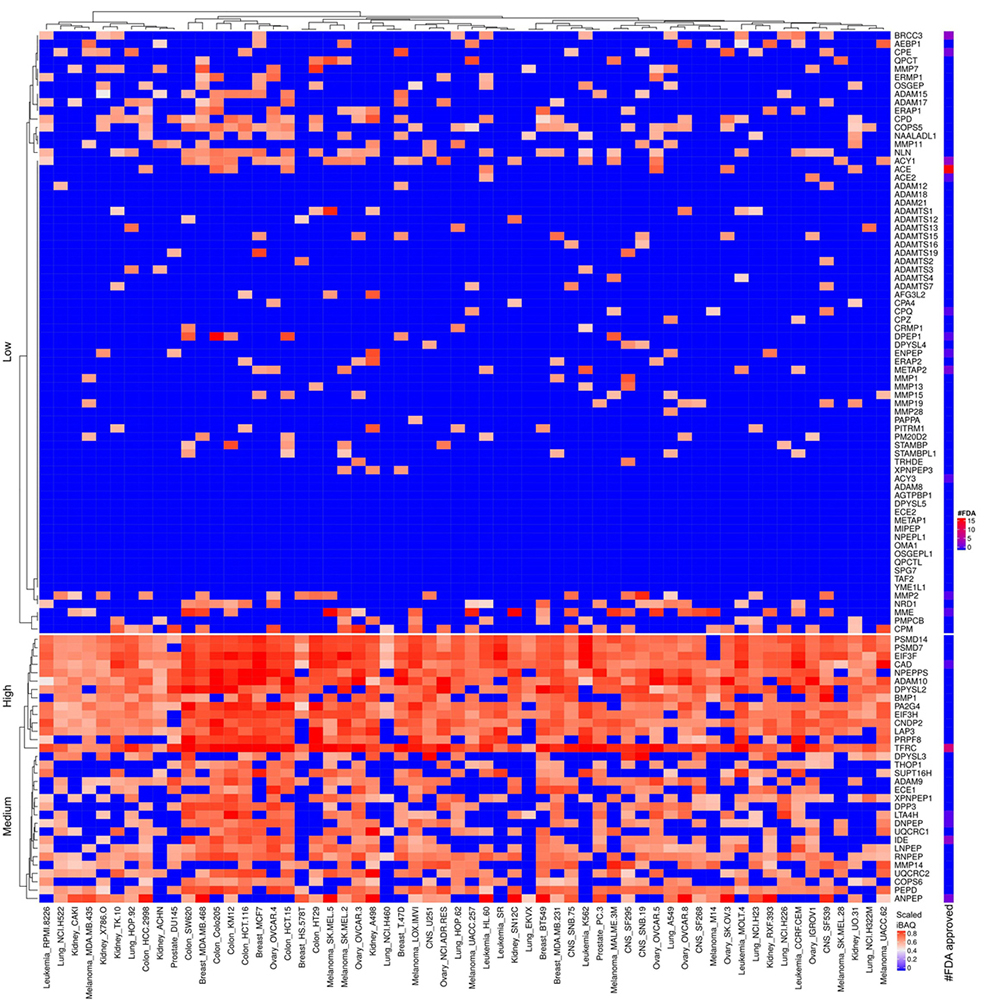 Figure 20
Scaled iBAQ expression values of metallo proteases factors in EVs obtained from NCI cell lines. The lower right color bar indicates the color code for the heatmap as iBAQ values scaled between 0 and 1. The bar and color bar labeled #FDA on the right indicates the number of FDA approved drugs targeting the identified metallo proteases factors.
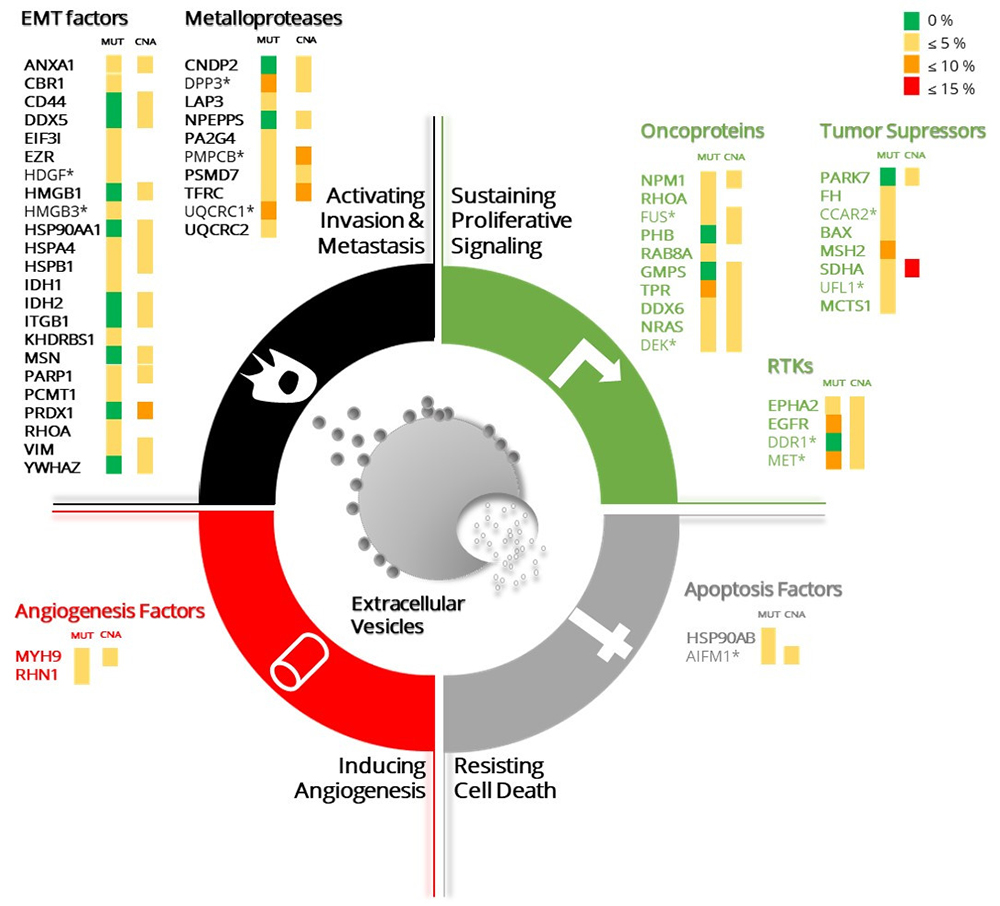 Figure 21
The top abundant proteins in the NCI-60 cancer cell lines panel associated to cancer hallmarks signatures are depicted. The top 10% most abundant proteins in each cancer hallmarks signature from the cellular proteome are listed. The proteins abundance values correspond to the mean of the expression values for a single protein overall cell lines (not depicted). The fold change between cellular and EVs proteomes was calculated for each protein. Those proteins for which the fold difference exceeds or equals 2 are annotated with an asterisk. The percentage of mutations (MUT) and copy number alterations (CNA) of each gene, annotated in the cancer genome ATLAS, are represented by colour scale grouped into 4 intervals (top right). The representation of the different cancer hallmarks was adapted from Figure 1 in Hanahan and Weinberg, Cell 2011 (1).
The coverage of the cellular and EV proteomes were ~31% and 34% of the genome, respectively. Transcriptomics in a given cell line normally cover ~50% of the annotated genes in the human genome. Proteome analysis detected about 25% of all proteins for each cell line based on the data used in this study. Storage of mRNA within cells without active transcription is well described (71). However, the lower genomic coverage for the proteomics data-set explored in this study compared to transcriptome data might also partly be explained with lower technical coverage of the proteomics data. Nevertheless, Gholami et al analyzed a subset of cell lines with deeper coverage but observed marginal improved coverage. In addition, when the authors merged all data sets across all cell lines, they identified 10,350 proteins corresponding to 8,739 unique genes which represent 46% of the protein-coding human genome (21). The overall expression of proteins across cell lines showed positive correlation (Figure 2 and 3). The leukemia cell lines displayed highest similarity in expression values for the different tissue origins. The other tissues were represented by cell lines of which some correlated strongly with the leukemia cell lines whereas others were more distant (Figure 3). The high similarity in protein expression values across cell lines might partly be caused by adaptation to cell culture media and lack of stimulus from surrounding tissue and microenvironment. Future studies need to address if the similar abundant proteins across cancer cell lines described in the present study are an experimental artifact, a result of cell culture methods or of biological relevance. If these abundant proteins represent common cancer characteristics, then this might have implication for design of novel cancer therapies. Constitutively activated cancer related genes such as EGFR, IGFR, RAS were among the most abundant expressed proteins. Traditionally, mutational data and to some extent transcriptional data obtained from cancer cells studies define oncogenes. In the present study we investigated the protein expression values of the defined oncogenes across 60 cell lines. We observed that protein expression across all cancer cell lines gave a different perspective of general cancer features compared to transcription and somatic mutations obtained by nucleotide sequencing. We observed consistent patterns of abundant expressed proteins across all cell lines which belong to signatures corresponding to cancer hallmarks. The consistent abundant protein expression patterns stand somewhat in contrast to the high heterogeneity reported for cancer in terms of somatic mutations. This together with recent improvement in mass spectrometry supports the argument for increased investigation of clinical proteomics in cancer. Interestingly, the literature describes these consistently abundant proteins found in this study as potential targets for various specific cancers but not as general cancer targets. We speculate that different combination therapies based on targeting abundant and widely expressed proteins with already approved FDA drugs might work as a strategy to repurpose drugs for cancer therapies. For example, SDHA and FH were consistently abundant across all cell lines and both function in fumarate metabolism. Mutations in SDHA and FH predispose individuals to cancer. Consequently, it is interesting to validate if the consistent and abundant SDHA and FH proteins represent functional and active enzymes.
There is also an emerging body of evidence pointing to EVs role in cancer development and cancer treatment. Noteworthy are experiments showing that EVs depletion from tumor cells microenvironment improve cancer drug response. Comparison between the whole cell proteome and the correspondent derived EVs is therefore of extreme relevance for the study of cancer. The top 10% most abundant proteins in signatures of key components of proliferative signaling, display similar abundance in cells and EVs (Figure 21). Interestingly, discoidin domain receptor tyrosine kinase 1 (DDR1), that is activated by collagen is highly abundant overall in epithelial tumor cells whereas EVs expression is restricted to a small subset of lines including breast, lung, ovary and colon cell lines. In a breast cancer model, evidences showed that DDR1 is regulated by transmembrane 4 L6 family member 1 (TM4SF1), which is a related tetraspanin protein, shown to induce metastatic reactivation in the lung and predicts breast cancer relapse. Tetraspanins mediated major classes of signaling molecules such as RTKs affecting its subcellular localization and trafficking. The two human Discoidin Domain Receptors (DDR1 and DDR2) are activated by collagen fibers rather than soluble growth factors (72, 73). The kinetics of DDR1/2 activation is unusually slow, suggesting that these receptors may reveal a new twist on the theme of receptor crosslinking by multivalent ligands. Recently, it has been shown that the presence of multidrug resistance proteins such as Pgp-1 and enrichment of the lipid ceramide in EVs might mediate drug resistance. EVs potentially also mediate multidrug resistance through uptake of drugs in vesicles and thus limit the bioavailability of drugs to treat cancer cells. In this review, we discussed the emerging evidence of the role EVs play in mediating drug resistance in cancers and in particular the role of EVs mediating drug resistance in advanced prostate cancer. Case studies on drug resistance are described as mediated by EVs that act as decoys, particularly in adjuvant immunotherapy treatments.
The analysis performed in this study suggests that the EV proteome is highly heterogeneous and probably constantly changing according to the cellular needs. If this is the case, then proteome of cancer EVs potentially changes in response to cancer drugs therapy. This is in line with frequent observed phenomena that EVs from cancer cells challenged with tumor drugs directly secrets the drug in EVs (17, 74). These observations support the idea that EVs might be valuable for following cancer patients undergoing cancer therapy. The discussion presented here suggests that there is active selection process for targeting proteins to the EVs. This means that there is a need to discover signals and mechanisms that target proteins for the different types of EV secretion. Furthermore, the corresponding receptors on the late endosomes need identification. Indeed, the literature describes examples of signals for active sorting of which one involves ubiquitin (75). This is consistent with specific E3 ligases and basically all proteasome subunits can be identified in EV samples. It might be interesting to characterize the ubiquitin branching of proteasomes in EVs versus cellular proteasome. Furthermore, protein loading into EVs because of protein damaging modifications such as oxidation (76) or misfolded proteins is well described (77). LGALS3BP displayed significant higher expression in EVs compared to the cellular proteome except for the leukemia cell lines and is well represented in Exocarta. Perhaps LGALS3BP target EVs loaded with damaged proteins to macrophages for phagocytosis. LGALS3BP is a secreted protein frequently identified in EVs samples (67). More investigation is needed to address if the lower LGALS3BP abundance in leukemia EVs compared to the other cells is associated with functional consequence for the EVs (e.g. in terms of uptake of EVs).
Current data and published results suggest that the EV proteome contains markers for predicting tumor tissue of origin, cancer diagnostics and prognostics. Though, in a liquid biopsy, we will be dealing with a complex mixture of EVs from different tissue sources. Furthermore, the ranges of EV concentration from different cells in the microenvironment will vary from patient to patient. Finally, current published clinical proteomics data sets are too small to allow definite conclusion on the potential of EVs for diagnostics and prognostics. There is a need for proteomics characterization of EVs from clinical liquid biopsies applying state of art mass spectrometry to analyze larger cohorts of patients.
Cancer hallmark proteins were identified in EVs obtained from all NCI60 cell lines at comparable levels to that of the cellular proteome. This observation supports that cancer hallmark proteins are involved in functional transfer of cancer hallmark properties through EVs. Consistently abundant tumor hallmark proteins across all cell lines were identified. These proteins are typically mutated in less than 15% cells suggesting that they overall are active. A subset of these abundant proteins was also abundant in EVs and therefore potentially might act as decoys upon drug targeting. Protein content of EVs correlated with cellular origin supporting the potential use of EV proteins as biomarkers. We hypothesize based on the previous and presented results that large scale clinical EV biomarker projects will become an attractive research topic in the coming years.
R.M. is supported by Fundação para a Ciência e a Tecnologia (CEEC position, 2019-2025 investigator). This article is a result of the projects (iNOVA4Health - UID/Multi/04462/2013), supported by Lisboa Portugal Regional Operational Programme (Lisboa2020), under the PORTUGAL 2020 Partnership Agreement, through the European Regional Development Fund (ERDF). This work is also funded by FEDER funds through the COMPETE 2020 Programme and National Funds through FCT - Portuguese Foundation for Science and Technology under the projects number PTDC/BTM-TEC/30087/2017 and PTDC/BTM-TEC/30088/2017. This work was supported by the Wellcome Trust/DBT India Alliance Margdarshi Fellowship (grant number IA/M/15/1/502023) awarded to A. P. B.C.S, M.C.S.C. and C.B. are supported by the the Champalimaud Foundation and the EMBO Installation Grant 3921. The results shown here are in part based upon data generated by the TCGA Research Network: https://www.cancer.gov/tcga.
EGFR
epidermal growth factor receptor
epithelial-mesenchymal transition
microvesicles
receptor tyrosine kinases
tumour-derived exosomes