
We took an experimental database mining analysis to determine the expression of 28 co-signaling receptors in 32 human tissues in physiological/pathological conditions. We made the following significant findings: 1) co-signaling receptors are differentially expressed in tissues; 2) heart, trachea, kidney, mammary gland and muscle express co-signaling receptors that mediate CD4+T cell functions such as priming, differentiation, effector, and memory; 3) urinary tumor, germ cell tumor, leukemia and chondrosarcoma express high levels of co-signaling receptors for T cell activation; 4) expression of inflammasome components are correlated with the expression of co-signaling receptors; 5) CD40, SLAM, CD80 are differentially expressed in leukocytes from patients with trauma, bacterial infections, polarized macrophages and in activated endothelial cells; 6) forward and reverse signaling of 50% co-inhibition receptors are upregulated in endothelial cells during inflammation; and 7) STAT1 deficiency in T cells upregulates MHC class II and co-stimulation receptors. Our results have provided novel insights into co-signaling receptors as physiological regulators and potentiate identification of new therapeutic targets for the treatment of sterile inflammatory disorders.
Co-signaling receptors including co stimulation receptors (CSRs) and co inhibition receptors (CIRs) have a pivotal role in Tcell biology, as they determine the functional outcome of Tcell receptor (TCR) signaling (1). Previously we reported that TCR and T cell co-stimulatory receptor CD28 play important roles in T cell co-stimulation and T cell/CD4+ regulatory T cell (Treg) survival (2-9). Recently, we and others identified non-T cell functions (reverse signaling) (10) of co-signaling receptors such as CD40/CD40L (11-15), CD70/CD27 (16, 17), 4-1BBL (18) and CD48 (19). Furthermore, co-signaling receptors can be expressed in non-antigen-presenting cells including T-cells. Despite the recognition of functions of co-signaling receptors in regulating T cell activation and their presence in non-antigen presenting cells, understanding of whether reverse signaling of these co-signaling receptors play roles in tissue physiology (20) and pathology (17, 21) remains unclear. One of the reasons for the lack of knowledge in this area is that we do not know the overall expression patterns of these co-signaling receptors in tissues and in diseased conditions.
Pathogen-associated molecular patterns (PAMPs) and danger associated molecular patterns (DAMPs) generated during microbial invasion or tissue injury act as sensors and activate the innate immune system to respond to infection or injury (22). The key cellular receptors, that recognize the “threat” signals initiated by PAMPs and DAMPs, are referred to as pattern recognition receptors (PRR). One of the receptor families that is highly characterized as PRRs is cytosolic sensing receptors NLRs (NOD (nucleotide binding and oligomerization domain)-like receptors) to recognize DAMPs, particularly in inflammation privileged tissues where inflammasome component genes that activate pyroptosis are not constitutively expressed (23, 24). Previously, using endogenous metabolite lysophospholipids (LPLs) as a prototype, we proposed that certain metabolites that regulate homeostatic functions at physiological levels, can adapt as pro-inflammatory mediators at elevated concentrations (25). We named such metabolites as “conditional DAMPs” and their endogenous receptors as “conditional DAMP receptors”. The new conditional DAMP receptors covered significant loopholes in the current danger model, which identify only the 6 PRRs mentioned above as DAMP receptors. We named these 6 categories of PRRs as “classical DAMP receptors” (25). Along the line, we recently reported a series of significant findings on the expression and roles of caspase-1 in NLR pathway in vascular inflammation (11, 23, 25-35). However, the issues of how these innate immune receptors regulate the expression of tissue co-signaling receptors and mediate T cell activation remain unknown.
In the development of immunosurveillance against tumors/cancers, a series of checkpoints have to overcome to implement effective anti-tumor T cell responses. The recent development of reagents such as monoclonal antibodies that act as checkpoint blockade agents had had a dramatic effect on human cancer treatment, with a marked reported success for anti-cytotoxic T lymphocyte associated antigen 4 (CTLA-4) and programmed cell death-1(PD-1) in particular in clinical trials (36). However, detailed expression changes of these immune checkpoint molecules in normal tissues versus tumors/cancers derived from the tissues need to be examined. The characterization of expressional changes of immune checkpoint receptors in normal tissues versus tumors/cancers derived from the tissues will provide valuable guidance for novel immune checkpoint blockade therapeutics to cancers/tumors.
Recent reports identified many cell types that are capable of acting as atypical antigen presenting cells (APC) and present antigens to major histocompatibility complex (MHC) class II molecules to conventional CD4+ T cells (37). Of note, CD4+ T cells are among atypical APCs. We recently reported that GATA3, HDAC6 and BCL6 regulate FOXP3+Treg plasticity and determine Treg conversion into either novel APC-like Treg or Th1-Treg (38). However, it is unknown what master regulators determine non-Treg T cell plasticity into atypical APC.
In spite of recent significant progress in this front, there are many aspects of T cell co-signaling receptors that have not yet been explored: first, the expression profile of co-signaling receptors under physiological conditions, specifically in humans have not been studied; second, whether the expression of certain co-signaling receptors are modulated in pathological conditions such as inflammation, cancer and in severe tissue damages such as burns and trauma is not clear; and third, mechanistically, whether pro-/anti-inflammatory signaling is negatively/positively associated with the expression of co-signaling receptors is not known. To address these questions, we took a “panoramic view” at the tissue expression patterns of 28 identified co-signaling receptors. Our results demonstrated that co-signaling receptors are differentially expressed among tissues at physiological conditions. Certain tumors including urinary tumor, germ cell tumor, leukemia and chondrosarcoma express the highest levels of co-signaling receptors for T cell activation, suggesting a possibility of co-signaling receptor regulation of their tumor immunogenicities. Finally, we also found that signal transducer and activator of transcription 1(STAT1) deficiency (39, 40) upregulates MHC class II and co-stimulation receptors in T cells, suggesting that STAT1 inhibits T cell plasticity into atypical APCs. Our findings provide novel insights on co-signaling receptors as new therapeutic targets in metabolic diseases, tumors, inflammation and tissue damages.
An experimental data mining strategy (Figure 1) was used to analyze the expression profiles of mRNA transcripts of genes encoding T cell co-stimulation receptors and co-inhibition receptors in 32 different human and 29mouse tissues. We utilized experimentally verified mRNA expression in the expressed sequence tag(EST) databases of the National Institutes of Health (NIH)/National Center of Biotechnology Information (NCBI) UniGene (http://www.ncbi.nlm.nih.gov/sites/entrez?db=unigene) to determine the transcription profile of T cell co-stimulation receptors and co-inhibition receptors in tissues of interest. Transcripts per million of genes of interest were normalized to that of house-keeping β-actin in each given tissue to calculate the arbitrary units of gene expression. A confidence interval of the expression variation of house-keeping genes was generated by calculating the mean plus two times that of the standard deviation of the arbitrary units of three randomly selected housekeeping genes (PRS27A, GADPH, and ARHGDIA in human; Ldha, Nono, and Rpl32 inmouse) normalized by β-actin in the given tissues. If the expression variation of a given gene in the tissues was larger than the upper limit of the confidence interval (the mean plus two times the standard deviation) in house-keeping genes, the high expression levels of genes in the tissues were considered statistically significant. Gene transcripts where the expression level was lower than one per million were technically considered as no expression.
 Figure 1
Flow chart of database mining strategy data organization. Abbreviations: NCBI: National Center of Biotechnology Information; IDs: Identifications; EST: Expressed sequence tag.
Microarray datasets were collected from ArrayExpress of European Bioinformatics Institute, which stores data from high-throughput functional genomics experiments (https://www.ebi.ac.uk/arrayexpress).These data includes the information of the expression of T cell co-stimulation receptors and co-inhibition receptors through experiments submitted directly to ArrayExpress or imported from the NCBIGene Expression Omnibusdatabase (https://www.ncbi.nlm.nih.gov/gds/).
Recent reports showed that co-stimulation receptors (CSRs) and co-inhibition receptors (CIRs) expressed in antigen presenting cell (APC) play important roles in modulating T cell activation status (1). An important question remains whether human tissues contain various types and numbers of antigen presenting cells (APCs), which provide various stimulatory/suppressive environments for all the four CD4+ T cell functional aspects including priming, helper cell differentiation, effector and memory functions. We hypothesize that human tissues have different antigen presenting environments and expression levels of CSRs and CIRs. To examine this hypothesis, by searching updated REFERENCES (1, 41, 42), we collected total of 28 co-signaling receptors expressed on the cell surface of APCs including 14 CSRs, 4 CSRs that become CIRs when encounter activated T cells, and 10 CIRs (Table 1). We then examined the expression patterns of all the 28 co-signaling receptors in 32 human tissues by searching DNA sequencing-based data of mRNA levels at physiological conditions. Based on the co-signaling receptor expression amongst human tissues examined, we classified them into following three groups: highly expressed (++), low expressed (+), and not expressed (-) as summarized in Table 2. Of note, information on BTNL2 gene expression was not found in human expression sequence tag (EST) profile in the NIH-UniGene database, therefore expression levels of 27 human co-signaling receptors were analyzed (Table 2).
| Gene name | Full name | Gene ID | Binding receptors on T cell membrane | UniGene3 ID | PMID | ||
|---|---|---|---|---|---|---|---|
| Human (Hs.) | Mouse (Mm.) | ||||||
| Co-stimulation receptor (14) | |||||||
| B7-H2 | inducible T-cell costimulator ligand | ICOSLG | ICOS | 14155 | 17819 | 23470321 | |
| CD70 | CD70 molecule | CD70 | CD27 | 501497 | 42228 | 23470321 | |
| LIGHT | TNF superfamily member 14 | TNFSF14 | HVEM | 129708 | 483369 | 23470321 | |
| CD40 | CD40 molecule | CD40 | CD40L | 472860 | 271833 | 23470321 | |
| 4-1BBL | TNF superfamily member 9 | TNFSF9 | 4-1BB | 1524 | 41171 | 23470321 | |
| OX40L | TNF superfamily member 4 | TNFSF4 | OX40 | 181097 | 4994 | 23470321 | |
| TL1A | TNF superfamily member 15 | TNFSF15 | DR3 | 23349 | 208152 | 23470321 | |
| GITRL | TNF superfamily member 18 | TNFSF18 | GITR | 248197 | 276823 | 23470321 | |
| CD30L | TNF superfamily member 8 | TNFSF8 | CD30 | 494901 | 4664 | 23470321 | |
| TIM4 | T-cell immunoglobulin and mucin domain containing 4 | TIMD4 | TIM1 | 334907 | 69002 | 23470321 | |
| SLAM | signaling lymphocytic activation molecule family member 1 | SLAMF1 | SLAM | 523660 | 103648 | 23470321 | |
| CD48 | CD48molecule | CD48 | CD2/2B4 | 243564 | 1738 | 23470321 | |
| SEMA4A | semaphorin 4A | SEMA4A | TIM2 | 408846 | 439752 | 12374982 | |
| CD58 | CD58 molecule | CD58 | CD2 | 34341 | 23470321 | ||
| Dual function receptor (4)2 | |||||||
| Naïve T cell | Active T cell | ||||||
| B7-1 | CD80 molecule | CD80 | CD28 | CTLA4 | 838 | 89474 | 23470321 |
| B7-2 | CD86 molecule | CD86 | CD28 | CTLA4 | 171182 | 1452 | 23470321 |
| CD155 | poliovirus receptor | PVR | CD226 | TIGHT | 171844 | 227506 | 23470321 |
| CD112 | interleukin 2 receptor subunit beta | IL2RB | CD226 | TIGHT | 655455 | 4341 | 23470321 |
| Co-inhibition receptor (10) | |||||||
| Galectin 9 | lectin, galactose binding, soluble 9 | LGALS9 | TIM3 | 81337 | 341434 | 23470321 | |
| CD113 | nectin cell adhesion molecule 3 | NECTIN3 | TIGHT | 293917 | 328072 | 23470321 | |
| HVEM | TNF receptor superfamily member 14 | TNFRSF14 | BTLA/CD160 | 512898 | 215147 | 23470321 | |
| B7-DC | programmed cell death 1 ligand 2 | PDCD1LG2 | PD-1 | 532279 | 116737 | 23470321 | |
| B7-H1 | CD274 molecule | CD274 | PD-1/B7-1 | 521989 | 245363 | 23470321 | |
| B7-H3 | CD276 molecule | CD276 | ND1 | 744915 | 5356 | 27192563 | |
| B7-H4 | V-set domain containing T-cell activation inhibitor 1 | VTCN1 | ND | 546434 | 137467 | 27192563 | |
| VISTA | V-set immunoregulatory receptor | VSIR | ND | 47382 | 273584 | 27192563 | |
| HHLA2 | HERV-H LTR-associating 2 | HHLA2 | TMIGD2 | 252351 | 27192563 | ||
| BTNL2 | Butyrophilin-like 2 | BTNL2 | ND | 534471 | 441007 | 27192563 | |
| 1ND: not determined, 2Act as co-stimulation receptors when meet naïve T cells and act as co-inhibition receptors when meet | |||||||
| Gene | Adipose tissue | Adrenal gland | Bladder | Blood | Bone | Bone marrow | Brain | Cervix | Embryonic tissue | Esophagus | Eye | Heart | Intestine | Kidney | Liver | Lung | Lymph node | Mammary gland | Muscle | Nerve | Ovary | Pancreas | Placenta | Prostate | Skin | Spleen | Stomach | Thymus | Trachea | Umbilical cord | Uterus | Vascular | H(%) | L(%) | H+L(%) |
|---|---|---|---|---|---|---|---|---|---|---|---|---|---|---|---|---|---|---|---|---|---|---|---|---|---|---|---|---|---|---|---|---|---|---|---|
| 1 | 2 | 3 | 4 | 5 | 6 | 7 | 8 | 9 | 10 | 11 | 12 | 13 | 14 | 15 | 16 | 17 | 18 | 19 | 20 | 21 | 22 | 23 | 24 | 25 | 26 | 27 | 28 | 29 | 30 | 31 | 32 | ||||
| Co-stimulation receptor | |||||||||||||||||||||||||||||||||||
| B7-H2 | ++ | ++ | + | ++ | + | ++ | + | + | + | + | ++ | + | + | + | + | + | + | + | ++ | + | 19 | 44 | 63 | ||||||||||||
| CD70 | + | + | ++ | + | + | + | + | + | + | 3 | 25 | 28 | |||||||||||||||||||||||
| LIGHT | + | + | + | 0 | 9 | 9 | |||||||||||||||||||||||||||||
| SEMA4A | + | + | + | ++ | + | + | ++ | + | + | + | ++ | ++ | ++ | + | + | + | + | ++ | ++ | ++ | + | 25 | 41 | 66 | |||||||||||
| CD40 | + | ++ | + | + | ++ | ++ | + | ++ | ++ | ++ | ++ | + | ++ | ++ | + | + | + | + | 28 | 28 | 56 | ||||||||||||||
| 4-1BBL | + | + | ++ | + | + | + | ++ | + | + | + | 6 | 25 | 31 | ||||||||||||||||||||||
| OX40L | + | + | + | + | + | + | + | + | + | 0 | 28 | 28 | |||||||||||||||||||||||
| TL1A | + | + | + | + | + | + | + | 0 | 22 | 22 | |||||||||||||||||||||||||
| GITRL | + | + | ++ | 3 | 6 | 9 | |||||||||||||||||||||||||||||
| CD30L | + | + | + | + | + | + | + | + | + | + | + | ++ | ++ | 6 | 34 | 41 | |||||||||||||||||||
| TIM4 | + | + | + | + | + | + | + | 0 | 22 | 22 | |||||||||||||||||||||||||
| SLAM | + | + | + | + | + | ++ | + | + | + | + | ++ | ++ | + | 9 | 31 | 41 | |||||||||||||||||||
| CD48 | ++ | ++ | + | + | + | + | ++ | ++ | ++ | ++ | + | + | + | + | ++ | + | ++ | + | ++ | 28 | 31 | 59 | |||||||||||||
| CD58 | ++ | + | + | ++ | + | + | + | ++ | + | + | + | + | + | + | + | + | + | ++ | ++ | + | 16 | 47 | 63 | ||||||||||||
| Dual function receptor | |||||||||||||||||||||||||||||||||||
| B7-1 | + | + | + | + | + | 0 | 16 | 16 | |||||||||||||||||||||||||||
| B7-2 | ++ | + | + | + | + | + | + | + | + | + | + | ++ | + | ++ | + | 9 | 38 | 47 | |||||||||||||||||
| CD155 | + | + | + | + | + | + | + | + | + | + | + | ++ | + | + | + | + | + | + | + | + | + | + | + | + | + | + | + | + | + | 3 | 88 | 91 | |||
| CD112 | + | + | + | + | + | + | + | + | + | + | + | + | + | + | + | + | + | + | + | + | + | + | + | + | + | + | + | + | 0 | 88 | 88 | ||||
| Co-inhibition receptor | |||||||||||||||||||||||||||||||||||
| B7-H1 | + | + | + | + | + | + | + | ++ | + | + | + | ++ | ++ | + | 9 | 34 | 44 | ||||||||||||||||||
| Galectin9 | + | + | + | + | + | + | + | + | + | + | + | + | + | ++ | + | ++ | + | + | + | + | + | + | + | + | 6 | 69 | 75 | ||||||||
| B7-DC | + | + | + | + | + | + | 0 | 19 | 19 | ||||||||||||||||||||||||||
| CD113 | + | + | + | + | + | + | + | + | + | + | + | + | + | + | ++ | + | + | ++ | + | + | + | + | 6 | 63 | 69 | ||||||||||
| HVEM | + | + | + | + | + | ++ | + | + | + | + | + | + | + | + | + | + | + | + | + | ++ | + | + | + | + | + | 6 | 72 | 78 | |||||||
| B7-H3 | + | + | + | + | + | + | + | + | + | + | + | + | + | + | + | + | + | + | + | + | + | + | + | + | + | + | ++ | + | + | + | 3 | 91 | 94 | ||
| B7-H4 | + | + | + | + | + | + | + | + | + | + | + | + | + | ++ | + | 3 | 44 | 47 | |||||||||||||||||
| VISTA | + | + | + | + | + | + | + | + | + | + | + | ++ | + | + | + | + | ++ | + | + | ++ | + | + | + | + | + | + | 9 | 72 | 81 | ||||||
| HHLA2 | + | + | + | + | + | + | ++ | 3 | 19 | 22 | |||||||||||||||||||||||||
| H(%) | 4 | 4 | 4 | 7 | 7 | 4 | 7 | 4 | 0 | 0 | 11 | 7 | 0 | 11 | 4 | 7 | 22 | 11 | 7 | 15 | 4 | 4 | 15 | 0 | 4 | 11 | 4 | 22 | 33 | 0 | 0 | 7 | |||
| L(%) | 19 | 22 | 26 | 67 | 44 | 30 | 59 | # | 33 | 22 | 48 | 33 | 48 | 63 | 52 | 74 | 33 | 52 | 30 | 15 | 44 | 52 | 59 | 74 | 48 | 37 | 56 | 41 | 11 | 7 | 63 | 22 | |||
| H+L(%) | 22 | 26 | 30 | 74 | 52 | 33 | 67 | # | 33 | 22 | 59 | 41 | 48 | 74 | 56 | 82 | 56 | 63 | 37 | 30 | 48 | 56 | 74 | 74 | 52 | 48 | 59 | 63 | 44 | 7 | 63 | 30 | |||
| Among 27 co-signaling receptor genes expressed in human tissues, CD40, CD48, CD58, SEMA4A and B7-H2 are the highly expressed co-stimulation receptors, and there is no highly expressed co-inhibition receptors. Five tissues including lymph node, placenta, thymus, nerve and trachea are the tissues with high T cell co-stimulation and co-inhibition signaling potential. Abbreviations: ++High expression; +Low expression; H High expression rate; L Low expression rate. The BTNL2 gene has no human EST profile, which explains that there are 28 genes in Table 1 but 27 genes in Table 2. >12% tissues and molecules are highlighted respectively in H (%) row and column. >60% tissues and molecules are highlighted respectively in H+L(%) row and column. | |||||||||||||||||||||||||||||||||||
We found that co-signaling receptors are differentially expressed in 32 human tissues in physiological condition. We identified CD40, CD48, CD58, SEMA4A, and B7-H2 are the highly expressed CSRs and we could not distinguish any CIRs that are highly expressed in tissues. When considering all the levels of expression of co-signaling receptors in tissues, we found that three CSRs including B7-H2, SEMA4A, CD58 and five CIRs such as galectin 9, CD113, HVEM, B7-H3, and VISTA are expressed in more than 60% of human tissues examined. We also found that five tissues such as lymph node, placenta, thymus, nerve and trachea have high T cell co-stimulation and co-inhibition signaling potential. As shown in Table 3, human tumors have higher expression of CIRs than CSRs. SEMA4A, CD40 and CD48 are the highly expressed CSRs; and Galectin9, SEMA4A, B7-H3, B7H4 and VISTA are highly expressed CIRs in human tumors. Bladder carcinoma and ovarian tumors have high co-inhibition potential, whereas chondrosarcoma has high co-stimulator potential (Table 3). Furthermore, three co-signaling receptors such as CD48 (CSR), two CIRs galectin 9, and CD113 are significantly expressed in 29 mouse tissues. Lymph node, lung, skin, and spleen have high expression of co-signaling receptors among mouse tissues examined (Table 4).
| Gene | 1 Adrenal tumor | 2 Bladder carcinoma | 3 Breast tumor | 4 Cervical tumor | 5 Chondrosarcoma | 6 Colorectal tumor | 7 Esophageal tumor | 8 Gastrointestinal tumor | 9 Germ cell tumor | 10 Glioma | 11 Kidney tumor | 12 Leukemia | 13 Liver tumor | 14 Lung tumor | 15 Lymphoma | 16 Ovarian tumor | 17 Pancreatic tumor | 18 Prostate cancer | 19 Retinoblastoma | 20 Skin tumor | 21 Muscle tissue tumor | 22 Uterine tumor | H(%) | L(%) | H+L(%) |
|---|---|---|---|---|---|---|---|---|---|---|---|---|---|---|---|---|---|---|---|---|---|---|---|---|---|
| Co-stimulator | |||||||||||||||||||||||||
| B7-H2 | + | + | + | + | + | ++ | + | + | + | ++ | + | + | + | 9.1 | 50 | 59.1 | |||||||||
| CD70 | + | + | + | ++ | + | + | + | + | + | + | + | 4.5 | 45.5 | 50 | |||||||||||
| LIGHT | + | + | 0 | 9.1 | 9.1 | ||||||||||||||||||||
| SEMA4A | ++ | ++ | + | + | + | + | + | + | ++ | + | + | + | + | 13.6 | 45.5 | 59.1 | |||||||||
| CD40 | + | ++ | + | + | + | + | + | + | ++ | + | ++ | + | 13.6 | 40.9 | 54.5 | ||||||||||
| 4-1BBL | + | + | + | + | + | 0 | 22.7 | 22.7 | |||||||||||||||||
| OX40L | + | + | + | + | + | + | + | + | 0 | 36.4 | 36.4 | ||||||||||||||
| TL1A | + | + | 0 | 9.1 | 9.1 | ||||||||||||||||||||
| GITRL | 0 | 0 | 0 | ||||||||||||||||||||||
| CD30L | + | + | + | + | 0 | 18.2 | 18.2 | ||||||||||||||||||
| TIM4 | + | + | + | 0 | 13.6 | 13.6 | |||||||||||||||||||
| SLAM | + | + | + | + | + | 0 | 22.7 | 22.7 | |||||||||||||||||
| CD48 | ++ | ++ | + | ++ | ++ | ++ | ++ | + | + | ++ | ++ | 36.4 | 13.6 | 50 | |||||||||||
| CD58 | ++ | + | + | + | + | + | + | + | + | + | 4.5 | 40.9 | 45.5 | ||||||||||||
| Altered | |||||||||||||||||||||||||
| B7-1 | + | + | + | 0 | 13.6 | 13.6 | |||||||||||||||||||
| B7-2 | + | + | + | + | + | + | 0 | 27.3 | 27.3 | ||||||||||||||||
| CD155 | + | ++ | + | + | ++ | + | + | + | + | + | + | + | + | + | + | + | + | + | + | 9.1 | 77.3 | 86.4 | |||
| CD112 | + | + | + | + | + | + | + | + | + | + | + | + | + | + | + | + | + | + | + | + | 0 | 90.9 | 90.9 | ||
| Co-inhibitor | |||||||||||||||||||||||||
| B7-H1 | + | + | + | + | + | + | ++ | + | 4.5 | 31.8 | 36.4 | ||||||||||||||
| Galectin9 | ++ | + | + | + | + | + | + | + | + | + | ++ | + | + | + | ++ | + | + | + | + | 13.6 | 72.7 | 86.4 | |||
| B7-DC | + | + | 0 | 9.1 | 9.1 | ||||||||||||||||||||
| CD113 | ++ | + | + | + | + | + | + | + | + | + | + | + | + | 4.5 | 54.5 | 59.1 | |||||||||
| HVEM | ++ | + | + | + | + | + | + | + | + | + | + | + | + | + | + | ++ | + | + | 9.1 | 72.7 | 81.8 | ||||
| B7-H3 | ++ | ++ | + | + | + | + | + | ++ | + | + | + | + | + | + | + | + | + | + | 13.6 | 68.2 | 81.8 | ||||
| B7-H4 | ++ | + | + | + | + | ++ | ++ | 13.6 | 18.2 | 31.8 | |||||||||||||||
| VISTA | + | ++ | + | + | + | + | + | ++ | ++ | + | + | + | + | + | + | + | 13.6 | 59.1 | 72.7 | ||||||
| HHLA2 | ++ | + | + | 4.5 | 9.1 | 13.6 | |||||||||||||||||||
| H(%) | 11.1 | 14.8 | 11.1 | 0 | 18.5 | 3.7 | 0 | 0 | 7.4 | 7.4 | 3.7 | 11.1 | 3.7 | 0 | 11.1 | 14.8 | 3.7 | 0 | 0 | 3.7 | 3.7 | 7.4 | |||
| L(%) | 7.4 | 3.7 | 51.9 | 18.5 | 51.9 | 40.7 | 22.2 | 59.3 | 70.4 | 44.4 | 37 | 29.6 | 37 | 44.4 | 44.4 | 29.6 | 37 | 33.3 | 7.4 | 37 | 40.7 | 44.4 | |||
| H+L(%) | 18.5 | 18.5 | 63 | 18.5 | 70.4 | 44.4 | 22.2 | 59.3 | 77.8 | 51.9 | 40.7 | 40.7 | 40.7 | 44.4 | 55.6 | 44.4 | 40.7 | 33.3 | 7.4 | 40.7 | 44.4 | 51.9 | |||
| Human tumors have higher expression of co-inhibitor receptors than that of co-stimulators. SEMA4A, CD40 and CD48 are the highly expressed co-stimulators, and Galectin9, B7-H3, B7H4 and VISTA are highly expressed co-inhibitors. Bladder carcinoma and ovarian tumor have high co-inhibitor potential; whereas chondrosarcoma has high co-stimulator potential. bbreviations: ++High expression; +Low expression; H High expression rate; L Low expression rate, ?12% means high level. | |||||||||||||||||||||||||
| Gene | 1 Adipose tissue | 2 Adrenal gland | 3 Bladder | 4 Blood | 5 Bone | 6 Bone marrow | 7 Brain | 8 Embryonic tissue | 9 Eye | 10 Heart | 11 Inner ear | 12 Kidney | 13 Liver | 14 Lung | 15 Lymph node | 16 Mammary gland | 17 Muscle | 18 Ovary | 19 Pancreas | 20 Pineal gland | 21 Pituitary gland | 22 Prostate | 23 Skin | 24 Spinal cord | 25 Spleen | 26 Sympathetic ganglion | 27 Testis | 28 Thymus | 29 Thyroid | H(%) | L(%) | H+L(%) |
|---|---|---|---|---|---|---|---|---|---|---|---|---|---|---|---|---|---|---|---|---|---|---|---|---|---|---|---|---|---|---|---|---|
| Co-stimulator | ||||||||||||||||||||||||||||||||
| B7-H2 | + | + | + | + | + | + | + | + | + | + | + | 0 | 38 | 38 | ||||||||||||||||||
| CD70 | 0 | 0 | 0 | |||||||||||||||||||||||||||||
| LIGHT | + | + | + | 0 | 10 | 10 | ||||||||||||||||||||||||||
| SEMA4A | + | + | + | + | + | + | + | + | + | + | + | + | + | + | + | + | + | + | + | + | + | 0 | 72 | 72 | ||||||||
| CD40 | + | + | + | + | + | + | ++ | + | ++ | + | + | 7 | 31 | 38 | ||||||||||||||||||
| 4-1BBL | + | + | + | + | ++ | + | + | + | 3 | 24 | 28 | |||||||||||||||||||||
| OX40L | + | ++ | 3 | 3 | 7 | |||||||||||||||||||||||||||
| TL1A | + | ++ | 3 | 3 | 7 | |||||||||||||||||||||||||||
| GITRL | + | 0 | 3 | 3 | ||||||||||||||||||||||||||||
| CD30L | ++ | + | + | + | 3 | 10 | 14 | |||||||||||||||||||||||||
| TIM4 | + | + | ++ | + | + | + | 3 | 17 | 21 | |||||||||||||||||||||||
| SLAM | + | + | + | ++ | + | + | ++ | + | + | 7 | 24 | 31 | ||||||||||||||||||||
| CD48 | ++ | ++ | ++ | ++ | + | + | ++ | ++ | ++ | ++ | ++ | ++ | ++ | ++ | ++ | 44.8* | 7 | 52 | ||||||||||||||
| CD58 | 0 | 0 | 0 | |||||||||||||||||||||||||||||
| Altered | ||||||||||||||||||||||||||||||||
| B7-1 | + | + | ++ | + | + | 3 | 14 | 17 | ||||||||||||||||||||||||
| B7-2 | + | + | + | ++ | + | + | ++ | + | 7 | 21 | 28 | |||||||||||||||||||||
| CD155 | ++ | + | + | + | + | + | + | + | ++ | ++ | + | + | + | + | + | ++ | ++ | 17 | 41 | 59 | ||||||||||||
| CD112 | + | + | + | + | + | + | + | + | ++ | + | + | + | ++ | + | + | + | + | 7 | 52 | 59 | ||||||||||||
| Co-inhibitor | ||||||||||||||||||||||||||||||||
| B7-H1 | + | + | ++ | + | 3 | 10 | 14 | |||||||||||||||||||||||||
| Galectin9 | + | + | + | + | ++ | + | + | + | + | + | ++ | ++ | + | ++ | ++ | + | 17 | 38 | 55 | |||||||||||||
| B7-DC | + | + | + | + | + | + | ++ | ++ | + | + | 7 | 28 | 35 | |||||||||||||||||||
| CD113 | ++ | + | + | + | + | + | + | ++ | ++ | ++ | ++ | ++ | + | ++ | ++ | + | + | 28 | 31 | 59 | ||||||||||||
| HVEM | + | + | + | 0 | 10 | 10 | ||||||||||||||||||||||||||
| B7-H3 | + | + | + | + | + | + | + | + | + | 0 | 31 | 31 | ||||||||||||||||||||
| B7-H4 | + | ++ | + | 3 | 7 | 10 | ||||||||||||||||||||||||||
| VISTA | + | + | + | + | + | + | + | + | + | + | + | + | + | + | + | + | ++ | + | ++ | + | + | 7 | 66 | 72 | ||||||||
| BTNL2 | ++ | + | + | 3 | 7 | 10 | ||||||||||||||||||||||||||
| H(%) | 0 | 0 | 7 | 7 | 4 | 4 | 0 | 0 | 4 | 0 | 0 | 4 | 7 | 15 | 41 | 7 | 7 | 4 | 7 | 0 | 11 | 4 | 15 | 7 | 15 | 4 | 4 | 11 | 4 | |||
| L(%) | 0 | 0 | 11 | 19 | 11 | 48 | 48 | 56 | 30 | 22 | 22 | 26 | 26 | 37 | 4 | 56 | 7 | 19 | 22 | 4 | 0 | 0 | 48 | 4 | 41 | 4 | 19 | 56 | 7 | |||
| H+L(%) | 0 | 0 | 19 | 26 | 15 | 52 | 48 | 56 | 33 | 22 | 22 | 30 | 33 | 52 | 44 | 63 | 15 | 22 | 30 | 4 | 11 | 4 | 63 | 11 | 56 | 7 | 22 | 67 | 11 | |||
| CD48, CD155, Galectin 9 and CD113 are the highly expressed co-signaling receptors in mouse tissues; and lymph node, lung, skin, and spleen have high expression of co-signaling receptors among all the mouse tissues examined. Abbreviations: ++High expression; +Low expression; H High expression rate; L Low expression rate, >12% means high level. | ||||||||||||||||||||||||||||||||
Recent reports showed that CSRs and CIRs expressed in APCs play important roles in modulating four inter-connected processes such as:1) priming T cells, 2) promoting T helper cell differentiation, 3) facilitating T effector function, and 4) memory function (1). We hypothesized that CSRs and CIRs have differences in modulating these four functional processes. To examine this hypothesis, we performed an extensive literature search. As summarized in Table 5, we found that 28 co-signaling receptors expressed in APC that can bind to 23 counter receptors on T cell surface. These receptors functionally differ in modulating 4 main immunological functions of T cells mentioned above. CD40 and CD70 are the only CSRs that exert all four immunological functions on T cells. Six CSRs including CD48, CD58, TL1A, OX40L, LIGHT, B7-H2 and one CIR Galectin 9 can regulate three functions mentioned above. The other co-signaling receptors have less effect on functional processes of the T cells. Further, our data revealed that most CIRs focus on suppressing T cell effector function.
| Human tissues | High expression co-signaling receptors | Cumulative score while interaction with naïve T cell | Cumulative score while interaction with active T cell |
|---|---|---|---|
| Adipose tissue | CD58(6+) | 6+ | 6+ |
| Adrenal gland | B7-H2 (4+) | 4+ | 4+ |
| Bladder | B7-H2 (4+) | 4+ | 4+ |
| Blood | B7-2(4+ /4-),CD48(6+) | 10+ | 2+ |
| Bone | CD40(7+),CD58(6+) | 13+ | 13+ |
| Bone marrow | CD48(6+) | 6+ | 6+ |
| Brain | B7-H2(4+),SEMA4A(2+) | 6+ | 6+ |
| Cervix | 4-1BBL(4+) | 4+ | 4+ |
| Embryonic tissue | 0 | 0 | |
| Esophagus | ? | 0 | 0 |
| Eye | HVEM(7-),CD40(7+),SEMA4A(2+) | 2+ | 2+ |
| Heart | B7-H2(4+),CD58(6+) | 10+ | 10+ |
| Intestine | ? | 0 | 0 |
| Kidney | CD70(6+),CD40(7+),CD155(2+/1-) | 15+ | 12+ |
| Liver | 0 | 0 | |
| Lung | CD40(7+),SEMA4A(2+) | 9+ | 9+ |
| Lymph node | B7H2(4+),CD40(7+),SLAM(3+),CD48(6+),Galectin9(5),SEMA4A(2+) | 17+ | 17+ |
| Mammary gland | CD40(7+),CD48(6+),SEMA4A(2+) | 15+ | 15+ |
| Muscle | CD40(7+),CD48(6+) | 13+ | 13+ |
| Nerve | 4-1BBL(4+),CD48(6+),CD113(1-),VISTA(ND*) | 9+ | 9+ |
| Ovary | Galectin9(5-) | 5- | 5- |
| Pancreas | CD40(7+) | 8+ | 8+ |
| Placenta | CD40(7+),B7-H1(7-),CD113(1-),VISTA(ND) | 1- | 1- |
| Prostate | ? | 0 | 0 |
| Skin | HVEM(7-) | 7- | 7- |
| Spleen | B7-2(4+/4-),CD48(6+),SEMA4A(2+) | 12+ | 4+ |
| Stomach | CD58(6+) | 6+ | 6+ |
| Thymus | B7-H2(4+),CD30L(2+),SLAM(3+),CD48(6+), B7-H1(7-), SEMA4A(2+) | 10+ | 10+ |
| Trachea | B7-2(4+/4-),CD30L(2+), SLAM(3+),CD58(6+), B7-H1(7-), SEMA4A(2+), B7-H4(ND), HHLA2(ND) | 10+ | 2+ |
| Umbilical cord | ? | 0 | 0 |
| Uterus | ? | 0 | 0 |
| Vascular | GITRL(1+),CD48(6+) | 7+ | 7+ |
| 1. Embryonic tissue, esophagus, intestine, liver, prostate, umbilical cord and uterus have no highly expressed co-signaling receptors, suggesting these tissues have low co-signaling potentials; 2. when encountered with naïve T cells or activated T cells, the co-signaling potential score of blood, spleen and trachea show -8 change, and kidney show -3 change on active T cells; and 3. skin, ovary and placenta have high co-inhibition potentials. ND: not determined | |||
To determine whether co-signaling receptors have functional overlaps in modulating four T cell functional processes, we performed a Venn analysis. As shown in Figure 2, we found that CSRs have diversified effects on stimulating T cells in priming, differentiating, effector and memory processes (Figure 2A) whereas most CIRs regulate T effector function (Figure 2B). In addition, we found that GITRL and TIM4 are the only two CSRs that have one function. CD113, CD112, and CD155 are the only CIRs that have one function, others have multiple effects on T cells. Priming, differentiation and memory function have no unique co-signaling receptors, which indicate that these three functions are all connected to T cell effector functions.
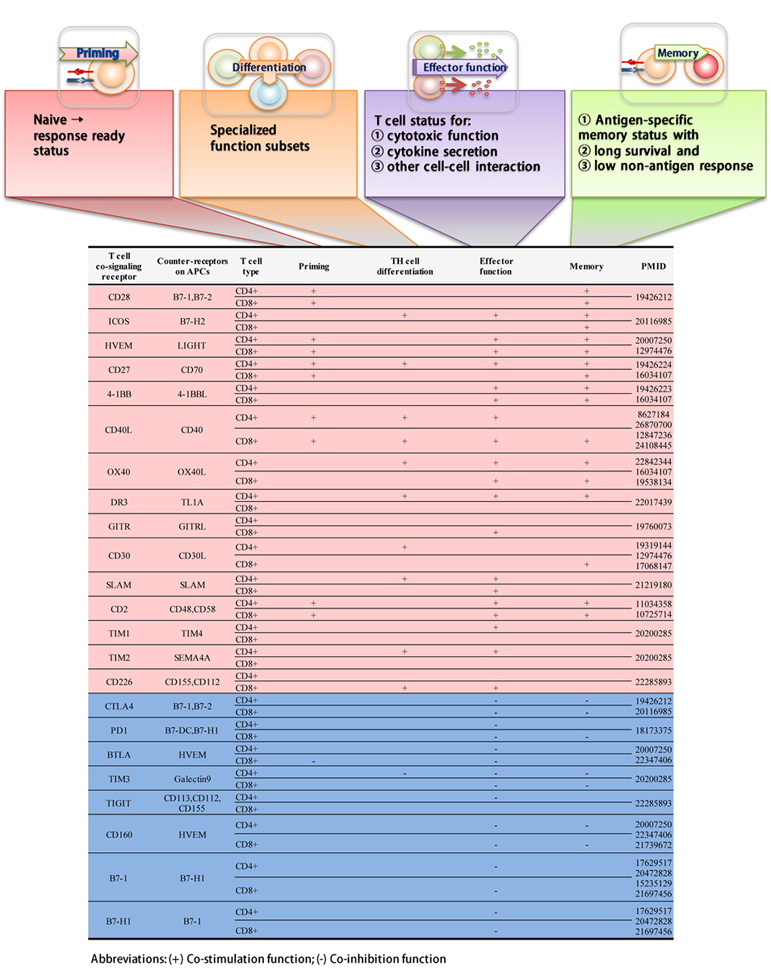 Figure 2
The Venn diagram analysis indicate that co-stimulation receptors exert diversified functions on T cells. A. CSRs exert diversified immunological regulating functions on T cells. B. Most CIRs exert limited effects on T cells.
Recently, Dr. Pober’s laboratory showed that engagement of the T-cell receptor not only activates T cells but also triggers CD4+T cell trans-endothelial migration (TEM) by a process that is distinct from that induced by activating chemokine receptors on T cells. This distinct process is slower, require microtubule-organization of T cell and engagement of proteins of the endothelial cell (43), suggesting that MHC class I/II-antigen epitopes expressed in tissue APCs and potential other signaling receptors in tissue endothelial cells modulate various T cell functions including trans-endothelial cell migration. We hypothesized that human tissues have significant differences in co-signaling for four major T cell processes. As shown in Figure 3, based on the highly expressed co-signaling receptors in human tissues (Table 2) and various T cell modulation processes of these co-signaling receptors (Table 5), we estimated the human tissue co-signaling potential (Table 6). We found that among 32 human tissues, 10 tissues including blood, bone, heart, kidney, lymph node, mammary gland, muscle, spleen, thymus, and trachea have high cumulative score of co-signaling potentials. In addition, we found the following results: 1) embryonic tissue, esophagus, intestine, liver, prostate, umbilical cord and uterus do not have highly expressed co-signaling receptors, suggesting these tissues have low co-signaling potential, and may have immune privilege status(23); 2) when meet with naïve T cells versus activated T cells, the co-signaling potential scores of blood, spleen and trachea are decreased by“-8”, and the co-signaling potential scores of kidney are decreased by“-3”; and 3) skin, ovary and placenta have high co-inhibition potentials.
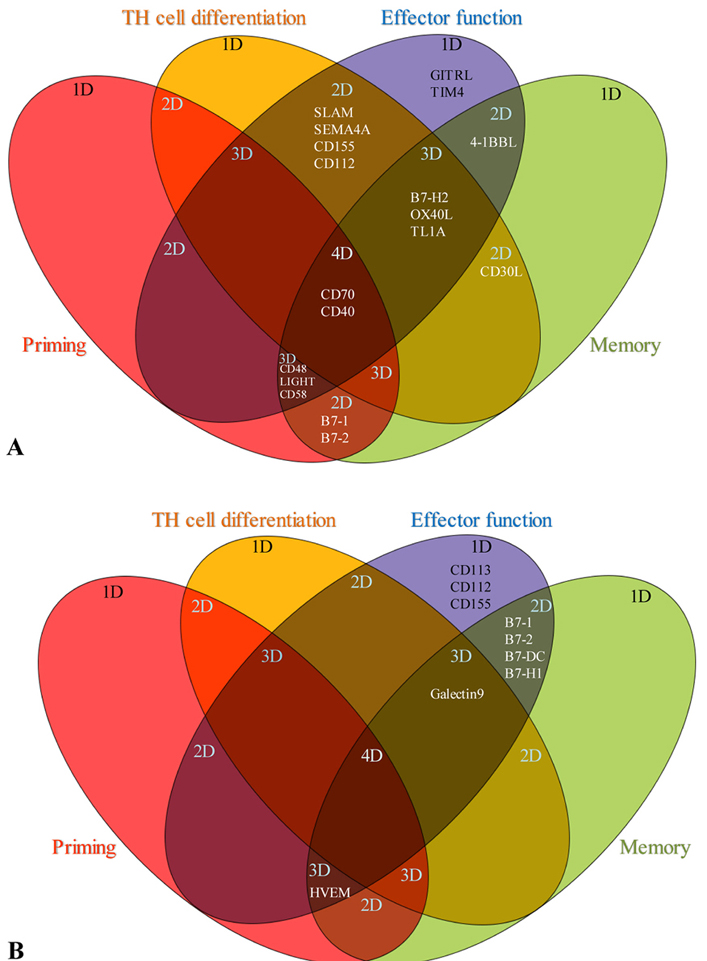 Figure 3
Human tissues have significant differences in co-signaling for 4 main immunological functions of T cells in 32 human tissues. A. The effects of CSRs on immunological functions of naïve T cells. B. The effects of CIRs on immunological functions of activated T cells. The results indicate that: lymph node has the highest co-signaling potential, ovary and skin only have co-inhibition potential. * Co-signaling scores of different tissues were estimated on the highly expressed receptors data given in tables 2 and 3.
| Cell type | Macrophage | |||||||||||||||
|---|---|---|---|---|---|---|---|---|---|---|---|---|---|---|---|---|
| Condition | Infectious disease | Differential polarizations (M1 versus M0 and M2 versus M0) | ||||||||||||||
| GEO ID | GSE77561 | GSE45170 | GSE79854 | GSE79854 | GSE61535 | GSE34103 | GSE35449 | GSE77425 | GSE85346 | GSE5099 | GSE40885 | GSE35449 | GSE77425 | GSE55029 | GSE5099 | GSE35433 |
| Description | Streptococcus pneumoniae | leptospiral | H1N1 | H3N2 | Legionella pneumophila | Listeria | M1 Vs M0 | M1 Vs M0 | M1 Vs M0 | M1 Vs M0 | M1 Vs M0 | M2 Vs M0 | M2 Vs M0 | M2 Vs M0 | M2 Vs M0 | M2 Vs M0 |
| B7-H2 | 3.06 | 0.41 | ||||||||||||||
| CD70 | ||||||||||||||||
| LIGHT | 0.28 | 0.3 | 0.08 | |||||||||||||
| CD40 | 6.81 | 2.31 | 5.39 | 3.69 | 28.99 | 31.97 | 3.51 | 2.36 | 2.34 | |||||||
| 4-1BBL | 26.89 | 4.06 | 4.61 | 2.17 | 3.25 | |||||||||||
| OX40L | 0.17 | |||||||||||||||
| TL1A | 6.95 | 4.03 | ||||||||||||||
| GITRL | ||||||||||||||||
| CD30L | 0.26 | 0.43 | 4.89 | |||||||||||||
| TIM4 | ||||||||||||||||
| SLAM | 9.46 | 3.19 | 2.88 | 2.91 | 24.59 | 3.33 | 154.84 | 59.12 | 5.98 | 2.92 | 13.36 | 7.97 | ||||
| CD48 | 2.19 | 2.93 | 3.07 | |||||||||||||
| SEMA4A | 3.01 | 3.34 | 0.37 | |||||||||||||
| CD58 | 2.7 | |||||||||||||||
| B7-1 | 4.7 | 3.76 | 10.97 | 41.22 | 8.97 | 6.45 | ||||||||||
| B7-2 | 10.52 | 2.6 | 2.36 | |||||||||||||
| CD155 | 3.35 | 4.19 | 2.03 | 5.77 | 11 | |||||||||||
| CD112 | ||||||||||||||||
| Galectin9 | 0.34 | 0.3 | ||||||||||||||
| CD113 | 2.87 | |||||||||||||||
| HVEM | ||||||||||||||||
| B7-DC | 3.09 | 9.82 | 3.95 | 4.5 | ||||||||||||
| B7-H1 | 5.22 | 6.73 | 11.94 | 6.95 | 3.61 | 73.2 | 2.53 | |||||||||
| B7-H3 | ||||||||||||||||
| B7-H4 | ||||||||||||||||
| VISTA | 0.43 | |||||||||||||||
| HHLA2 | 3.84 | |||||||||||||||
| BTNL2 | ||||||||||||||||
| The co-stimulation receptors including CD40, 4-1BBL, SLAM, CD48, B7-1, B7-2, and CD155 are significantly upregulated in macrophages in response to infections; 2. Co-stimulation receptors including CD40, 4-1BBL, TL1A, CD30L, SLAM, CD48, SEMA4A, B7-1, B7-2, and CD155 are significantly upregulated in M1 macrophage polarization. In contrast, only two co-stimulation receptors such as CD40 and SLAM are upregulated in M2 macrophages; 3. two co-inhibition receptors such as B7-DC and B7-H1 are upregulated in macrophages in response to infection; 4. four co-inhibition receptors such as CD113, B7-DC, B7-H1, and HHLA2 are upregulated in M1 macrophage polarization; and 5. CD70, GITRL, TIM4, CD112, HVEM, B7-H3, B7-H4 and BTNL2 have no significant changes under different polarization. | ||||||||||||||||
We further examined whether human tissues have significant differences in co-signaling for four major T cell functions in 32 tissues. As demonstrated in Figure 3, we found that nine human tissues including bone, eye, kidney, lung, lymph node, mammary gland, thymus, trachea and vasculature have dominant CSR signaling for T effector functions (shown in green). In addition, three human tissues such as eye, ovary, placenta and skin have dominant CIR function for T effector process (shown in light blue).
It has been reported that the infiltrated immune cells play a critical role for immunosurveillance in cancers and the prognosis of patients with cancer (44). We hypothesized that decreased expression of CSRs and increased expression of CIRs in tumor cells may be associated with certain human tumors. Based on our analysis of the expression changes of co-signaling receptors in human tumors in comparison to that of corresponding human tissues, we generated human tumor co-signaling potentials as shown in Figure 4. We found that first, five human tumors including uterine tumor, germ cell tumor, leukemia, glioma and chondrosarcoma have high co-stimulation potential and low co-inhibition potential, suggesting that these five tumors may have better response to immunotherapy; second, six human tumors such as esophageal tumor, skin tumor, liver tumor, colorectal tumor pancreatic tumor, and prostate tumor have moderate co-stimulation potential and moderate co-inhibition potential, suggesting that these six tumors may not respond to immunotherapy well; and third, other 11 tumors (50.0%) including retinoblastoma, cervical tumor, lymphoma, adrenal tumor, gastrointestinal tumor, kidney tumor, ovarian tumor, soft tissue muscle tissue tumor, breast tumor, lung tumor and bladder carcinoma have low co-stimulation potentials and high co-inhibition potential, suggesting that these 11 tumors may have poor response to immunotherapy.
 Figure 4
Human tumors have lower co-signaling potential than correlated human tissues, especially the co-stimulation potential. A. Co-stimulation potential of human tumors. B. Co-stimulation potential of corresponding human tissues. *Tumors with changed co-signaling potential.
In addition, by comparing the detailed changes of co-signaling potentials of human tumors with that of corresponding human tissues (Figure 5), we found that: 1) the co-signaling potential of 16 human tumors are significantly different from that of the corresponding human tissues; and 2) human tumors including leukemia, chondrosarcoma, germ cell tumor, lymphoma, breast tumor, muscle tumor, pancreatic tumor, uterine tumor have dominant co-stimulation for T effector function. Taken together, our results suggest that human tumors have lower co-signaling potential compared to healthy human tissues, suggesting that downregulation of co-stimulation potential may be one of the strategies that tumors have developed to escape immunosurveillance.
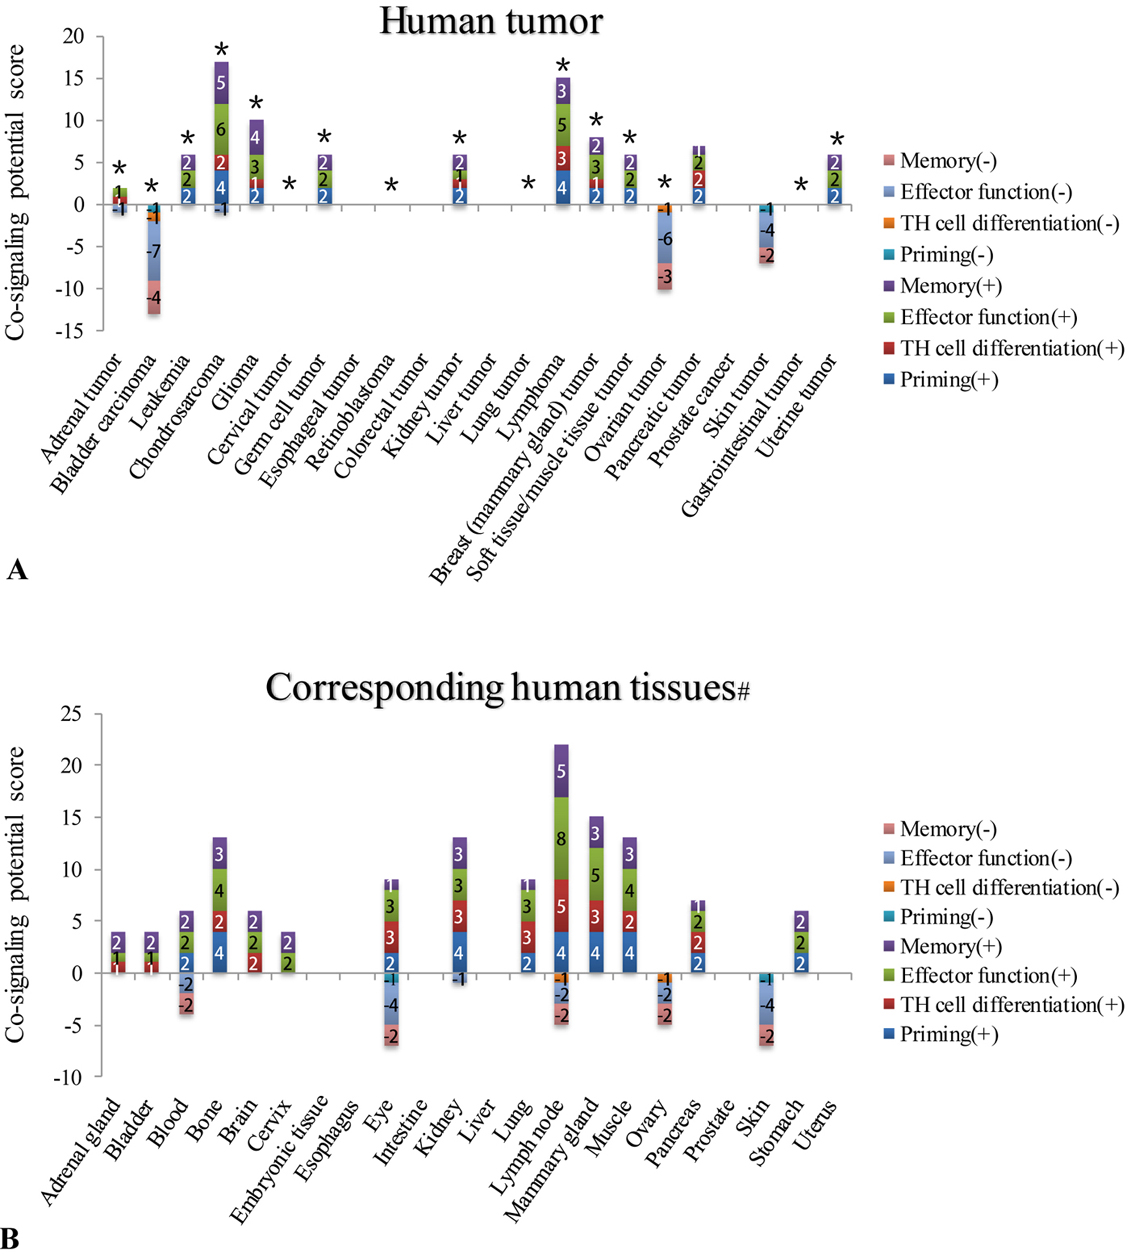 Figure 5
Five human tumors have T cell co-stimulation potentials higher than correlated healthy tissues (changes ?0), including in uterine tumor, germ cell tumor, leukemia, glioma, and chondrosarcoma. A. Stimulation potential during tumor genesis B. The correlation between tumor prognosis and co-stimulation potential. Prognosis data is based on the effects of the immune infiltrate cell types discussed in a published article (PMID: 28741618).
Moreover, it has been reported that localized co-stimulation is important for tumor-specific T cell responses (45). We hypothesize that tumorgenesis mediated increase in the expression of CSRs would be correlated with the prognosis of patients with tumors. To examine this issue, we analyzed the new data of the effects of immune infiltrate on the prognosis of patients with cancer, which is discussed in Fridman, WH et al Nature review (Figure 5B) (44). This data was a summary of as many as 200 studies. We defined a type of combined prognosis scores (PS) as follows: 1) No effect of immune infiltrate on prognosis was counted as (0); 2) the strong negative prognosis effect of immune infiltrate was counted as (-2);3) less strong negative prognosis effect of immune infiltrate was counted as (-1);4) positive prognosis effect of immune infiltrate was counted as (+1); and 5) strong positive prognosis effect of immune infiltrate was counted as (+2). The correlation analyses were conducted between the increased co-stimulation potential during tumorigenesis in human tumors shown in Figure 5A and the final prognosis values for six reported immune infiltrated cell types including CD8+ T cells, tertiary lymphoid structure, regulatory T cells (Treg), CD68+ macrophages, proinflammatory classically activated macrophages (M1 macrophages), and alternatively activated macrophages (M2 macrophages), respectively. As shown in Figure 5B, among six cell types analyzed, we found that the increased co-stimulation potential in nine human tumors including breast tumor, lung tumor, liver tumor, ovarian tumor, bladder carcinoma, gastrointestinal tumor, esophageal tumor, glioma and kidney tumor was significantly correlated, R2= 0.4851 (p 0.371), with improved final prognosis values based on decreased M2 macrophage infiltrates in the human tumors. The results suggest that first, increased co-stimulation potential during tumorigenesis have potential for predicting the prognosis of patients with tumor; and second, increased co-simulation potentials during tumorigenesis in human tumors are associated with decreased infiltration of M2 anti-inflammatory macrophages in tumors, implying a beneficial prognosis of type I pro-inflammatory macrophages infiltrated in tumors.
We hypothesized that tissue expression of co-signaling receptors are either under the regulation of tissue physiological status (staying downstream) or regulating tissue physiological status (staying upstream) as defined by the expression levels of inflammation-related DAMPRs (46), cellular stress-regulators, hypoxia regulators, blood supply-related vascular endothelial growth factors (VEGFs), tissue regeneration-related four stem cell regulators (Yamanaka factors: octamer-binding transcription factor4 (POU5F1, Oct3/4), sex determining region Y)-box 2 (Sox2),Kruppel-like factor 4(Klf4),c-Myc)), epigenetic modulators such as cellular hyper-, hypo- methylation status and cell markers of three professional antigen presenting cell types. To test this hypothesis, based on the numbers of co-signaling receptors expressed in 32 tissues/27co-signaling receptors, we determined co-signaling receptor potentials. To determine the extent to which factor expression and that of co-signaling receptors are related, we conducted correlation studies.
We hypothesized that if there is a positive correlation, the expression of PAMP receptors/metabolite-regulated DAMP receptors (PRRs) and inflammasome components), the factors (such as oxygen sensors, genes that regulate angiogenesis pathway, stem cell master genes, and the co-signaling receptors will modulate their expression accordingly (22). As shown in Figure 6, among 14 genes examined highly expressed co-signaling receptor potentials in tissues were significantly correlated with that of NOD3 (r2 = 0.3.068; p = 0.0075), NALP9 (r2 = 0.2262; p = 0.0253) and CARD8 (r2 = 0.2791; p = 0.0115). Similarly, high and low expressed co-signaling receptor potential in tissues was significantly correlated with that of NOD4 (r2 = 0.1822; p = 0.0476); and NALP6 (r2 = 0.1825; p = 0.0474) (Figure 7).
 Figure 6
The expression of NLRs/ inflammasome sensors are correlated in low levels with the expression of a few highly expressed co-signaling receptors in human tissues. (Human tissues analyzed: adipose tissue, bladder, blood, bone, bone marrow, brain, embryonic tissue, eye, heart, kidney, liver, lung, lymph node, muscle, pancreas, skin, spleen, thymus, placenta, umbilical cord, uterus, vascular). Abbreviations: NOD 1/2/3/4: Nucleotide-binding oligomerization domain-like receptors 1/2/3/4; NALP 2/3/6/9/14: Nod like receptor (NLR) family pyrin domain containing 2/3/6/9/14; NAIP: NLR family apoptosis inhibitory protein; NLRC4: NLR family CARD domain containing 4; ASC: PYD and CARD domain containing; IFI16: interferon gamma inducible protein 16; CARD8: caspase recruitment domain family member 8.
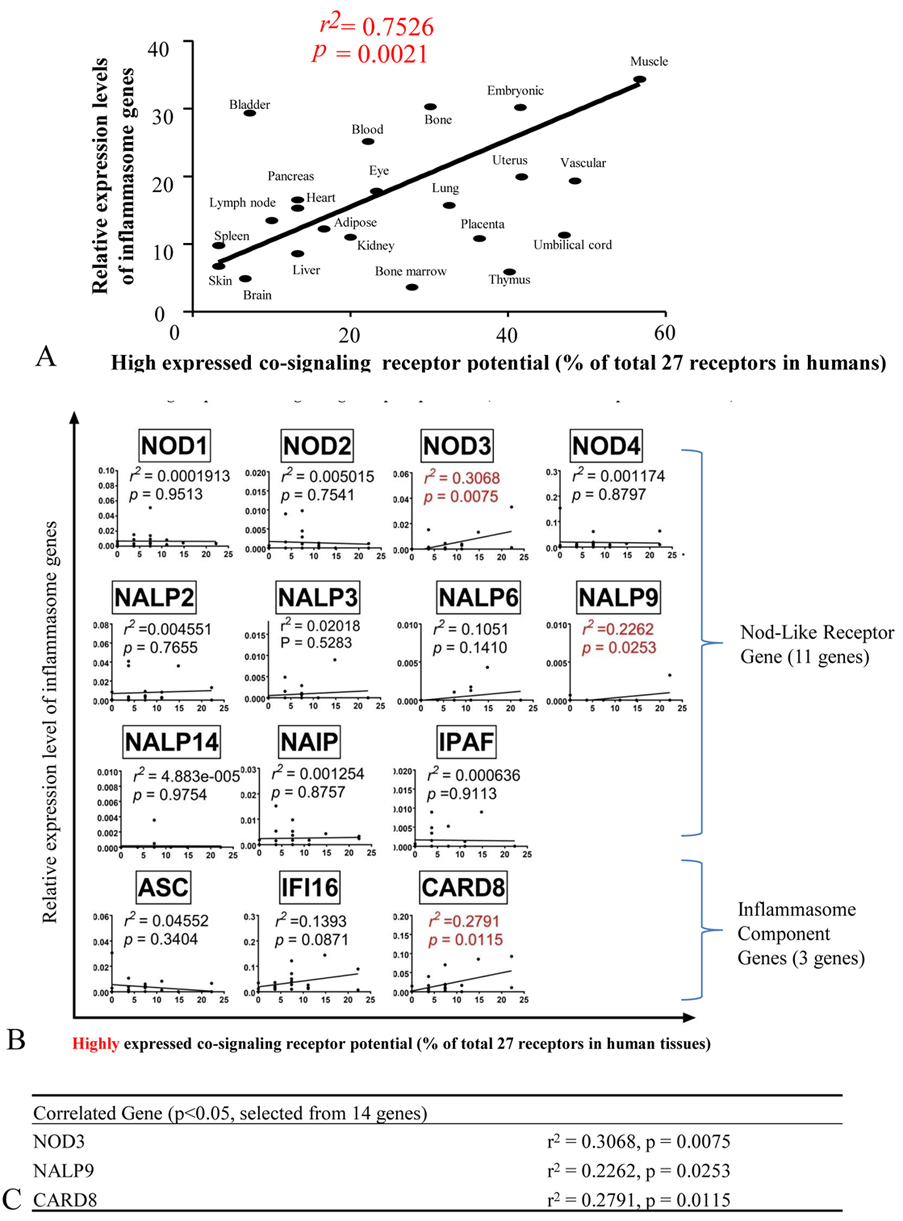 Figure 7
The expression of NLRs/ inflammasome sensors are correlated in low levels with the expression of some co-signaling receptors in human tissues. (Tissues analyzed: adipose tissue, bladder, blood, bone, bone marrow, brain, embryonic tissue, eye, heart, kidney, liver, lung, lymph node, muscle, pancreas, skin, spleen, thymus, placenta, umbilical cord, uterus, vascular). Abbreviations: NOD1/2/3/4: Nucleotide-binding oligomerization domain-like receptors1/2/3/4; NALP2/3/6/9/14: NLR family pyrin domain containing 2/3/6/9/14; NAIP: NLR family apoptosis inhibitory protein; NLRC4: NLR family CARD domain containing 4; ASC: PYD and CARD domain containing; IFI16: interferon gamma inducible protein 16; CARD8: caspase recruitment domain family member 8.
To further consolidate our findings, we used microarray data deposited in the NIH/NCBI-Geo datasets and examined the expression of NOD3, NOD4, CARD8, NALP6 and NALP9 in the deficiencies/knock-down of four CSRs CD80, CD48, TIM and CD40 datasets versus wild-type control microarray data. The results shown in Figure 8 demonstrated that these co-signaling receptors regulate the expression of NOD3, NOD4, CARD8, NALP6 and NALP9 (p 0.05). These results suggest that first, T cell reverse signaling via co-signaling receptors may regulate the expression of some inflammasome components NOD3, NALP9, CARD8, NOD4 and NALP6 in the antigen presenting cells to regulate the DAMPs-, and PAMPs- sensing pathways (Figure 9), which correlated with a recent report on the roles of type 1 T helper cell (Th1) and Th17 in regulating innate immunity for bacterial clearance (47, 48); and/or second, these five inflammasome components may initiate signaling in regulating co-signaling receptor expression in human tissues as the parts of inflammation initiation, suggesting that innate immune sensor components regulate T cell activation (49).
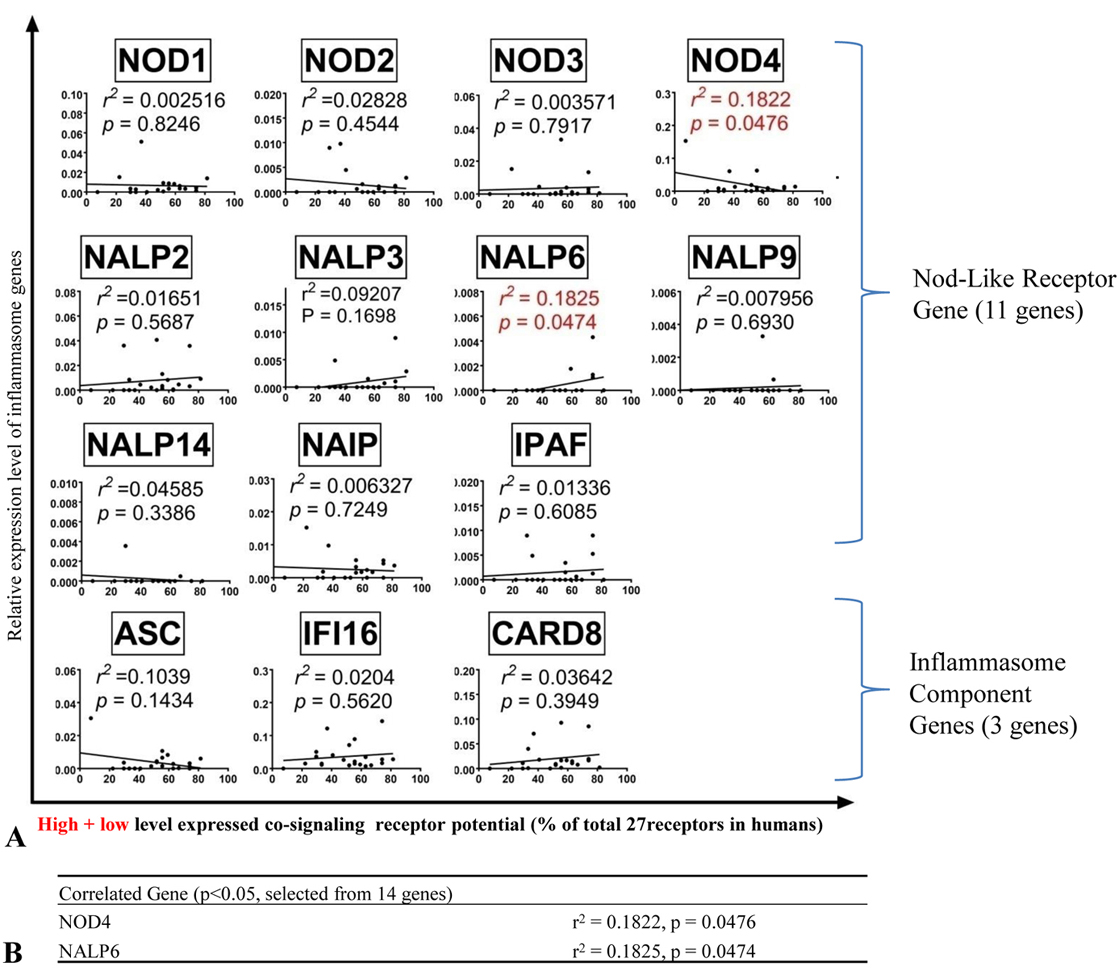 Figure 8
Deficiencies of co-signaling receptors modulate the expression of NOD3, CARD8, NALP6, NALP9 and VEGFR3 (FLT4) (p <0.05). This suggests that T cells regulate the inflammasome pathways in antigen presenting cells via reverse signaling of co-signaling receptors
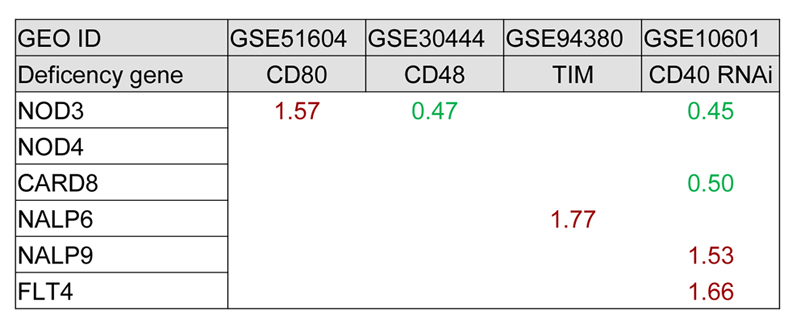 Figure 9
Reverse signaling from T cells regulate the expression of inflammasome components.
We examined the hypothesis that tissue physiological functional status such as hypoxia responsive pathways, vascular growth factor pathways, stem cell master gene-regulated tissue regeneration pathway and mitochondrial activity pathway may also regulate co-signaling receptor expression in human tissues. To test this hypothesis, we performed correlation analysis for the expression of the genes involved in these pathways with co-signaling receptors. These genes included seven vascular endothelial growth factor (VEGF) pathway genes (VEGFA, VEGFB, VEGFC, C-fos-induced growth factor (FIGF), VEGF receptor 1 (VEGFR1, FLT1), VEGFR2 (KDR), and VEGFR3 (FLT4)), six stem cell regulator genes (CD34, Kit, Myc, Klf4, Pou5F1(Oct3/4), and Sox2) (50), and three mitochondrial activity regulators (transcription factor A, mitochondrial (TFAM), nuclear respiratory factor 1 (NRF1)(51), and the transcription factor nuclear factor erythroid 2 p45-related factor 2, NRF2)(52). Co-signaling receptor expression potentials in human tissues were significantly correlated with that of VEGFR3 (FLT4) (r2 = 0.3873; p = 0.0020) (Figure 10). To further consolidate the findings, we used the microarray data deposited in the NIH/NCBI-Geo datasets and examined VEGFR3 expression in the presence of deficiencies/ knock-down of co-signaling receptors such as CD80, CD48, TIM and CD40. The results in Figure 11 showed that CD40 knock-down with RNAi upregulates VEGFR3; and that VEGFR3 knock-down with RNAi regulates the expression of seven co-signaling receptors including four CSRs such as SEMA4A, TIM4, B7-H2, CD48 and three CIRs including Galectin 9, B7-DC and HVEM. These results suggest that in response to hypoxia, blood supply and angiogenesis changes, stem cell regulation and mitochondrial activity changes, all the co-signaling receptors process behavior almost the same; and VEGFR3, as a key vascular growth factor receptor, plays an essential function in regulating these co-signaling receptor expression and/or co-signaling receptor functions may regulate the VEGFR3 expression and lymphatic vascular development in human tissues (53).
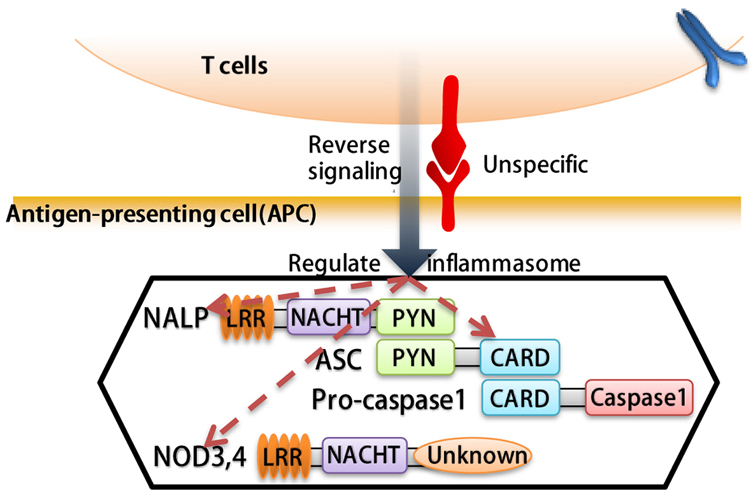 Figure 10
Human vascular endothelial cell growth factor receptor 4 (FLT4) expression in tumor tissues are correlated with the expression of highly expressed co-signaling receptors in human tissues. A. Correlation between co-stimulation receptor potential and genes that regulate hypoxia, angiogenesis, stem cells and mitochondrial signaling pathways. B. FLT4 gene is significantly correlated with co-signaling receptor potential. (Tissues analyzed: adipose tissue, bladder, blood, bone, bone marrow, brain, embryonic tissue, eye, heart, kidney, liver, lung, lymph node, muscle, pancreas, skin, spleen, thymus, placenta, umbilical cord, uterus and vascular). Abbreviations: PHD2: Prolyl hydroxylase domain-containing protein-2; HIF1B: Hypoxia-inducible factor-1 beta; HIF1/2A: Hypoxia-inducible factor 1/2-alpha; VEGFA/B/C: Vascular Endothelial Growth Factor A/B/C; FIGF: C-fos-induced growth factor; FLT1/4: Fms related tyrosine kinase ¼; KDR: Kinase insert domain receptor; MYC: MYC proto-oncogene; KIT: KIT proto-oncogene receptor tyrosine kinase; KLF4: Kruppel like factor 4; POU5F1: POU class 5 homeobox 1; SOX2: SRY-box 2; TFAM: transcription factor A; NRF1: nuclear respiratory factor 1; NRF2(GABPA): GA binding protein transcription factor alpha subunit.
 Figure 11
nock down of VEGFR3 (FLT4) regulates the expression of co-signaling receptors. This suggests that VEGFR3 regulates the expression and functions of co-signaling receptors in VEGFR3+ endothelial cells and other VEGFR3+ cells.
It has been reported that treatment with DNA methylation inhibitors and histone deacetylase inhibitors activate a growth-inhibitingimmuneresponsewhich can be an effective therapeutic approach for malignant disorders (54). We hypothesized that certain co-signaling receptor expression are under epigenetic regulation such as methylation as we reported for enzyme expression of homocysteine-methionine metabolism pathways. Thus, we analyzed the correlation between mouse co-signaling receptor expression and mouse tissue methylation indices determined by the ratios between S-adenosyl methionine (SAM – the universal methyl donor)/ S-adenosyl homocysteine (SAH - a methyltransferase inhibitor) in mouse tissues (55). As shown in Figure 12A and Figure 12B, we found that relative expression levels of 10 co-signaling receptors in mouse tissues including CIR B7-H1 (r2 = 0.9668, P = 0.0004), CIR BTNL2 (r2 = 0.9242, P = 0.0022), CSR CD40 (r2 = 0.932, P = 0.0018), CSR GITRL (r2 = 0.9242, P = 0.0022), CSR CD30L(r2 = 0.9242, P = 0.0022), CSR TIM4 (r2 = 0.9318, P = 0.0018), CSR SLAM(r2 = 0.9242, P = 0.0022), CSR B7-H2 (r2 = 0.8807, P = 0.0056), dual function B7-2 (r2 = 0.884, P = 0.0053), CSR CD48 (r2 = 0.7487, P = 0.0457) are correlated with tissue SAM/SAH levels (hyper-methylation index). These results suggest that first, the expression of 35.7% (10/28) co-signaling receptors may regulate tissue hyper-methylation status or tissue hyper-methylation status may regulate the expression of one-third of co-signaling receptors in mouse tissues; and second, during tumorigenesis certain tumors can switch methylation/demethylation regulation modes on these co-signaling receptors and upregulate these co-signaling receptors, after treated with DNA methylation inhibitors and/or histone deacetylase inhibitor(s), then anti-tumor immune responses can be enhanced.
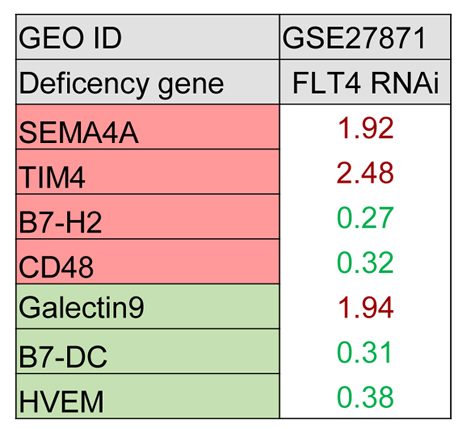 Figure 12
The tissue hypermethylation indices as evaluated by S-adenosylmethionine (SAM)/ S-adenosylhomocysteine (SAH) ratio are correlated with the expression of co-signaling receptors in six mouse tissues (tissues: liver, brain, heart, kidney, lung and spleen). A. The correlation between relative expression of co-stimulation receptors and SAM/SAH ratio. B. Depending on the R2 value, the correlation was segmented in to three tiers, named high, middle and low. C) Schematic representation: 1) Histones H3 and H4 methylation promote genes transcription; the methylation residues of H3 are R2, 8, 17, 26 and K4, 9, 23, 27, 36, 79; the methylation residues of H4 are R3 and K20 (PMID: 22982198). 2) CpG island methylation promote co-signaling receptor genes transcription. (PMID: 15506922).
Since the main types of professional APCs are dendritic cells (DCs), macrophages, and B cells (56), we hypothesized that highly expressed co-signaling receptors in tissues are correlated with the expression of macrophage marker adhesion G protein-coupled receptor E1 (F4/80), B cell marker CD20, T cell markers CD3G, CD3E and CD3D and DC marker CD11C in human tissues. To test this hypothesis, we performed correlation analysis for the expression of these professional APC markers with co-signaling receptor potential in 22 human tissues. As shown in Figure 13A and Figure 13B, human tissue expression levels of macrophage marker F4/80 (r2 = 0.1259, p = 0.0463), B cell marker CD20 (r2 = 0.2392, p = 0.0045), and T cell antigen receptor components CD3G (r2= 0.1565, p = 0.0250) and CD3E (r2 = 0.3646, p = 0.0003) are significantly correlated with the high expressed co-signaling receptor potential. However, tissue expression levels of DC marker CD11C and T cell marker CD3D are not correlated with the high expressed co-signaling receptor potential. These results suggest that first, tissue expression of high expressed co-signaling receptors are partially correlated with tissue contents of professional APCs; and second, the expression of highly expressed co-signaling receptors in non-professional APCs in tissues contribute significantly to forward signaling in regulating T cell activation and reverse signaling in regulating tissue physiology and pathology as demonstrated by our report on CD40 (11).
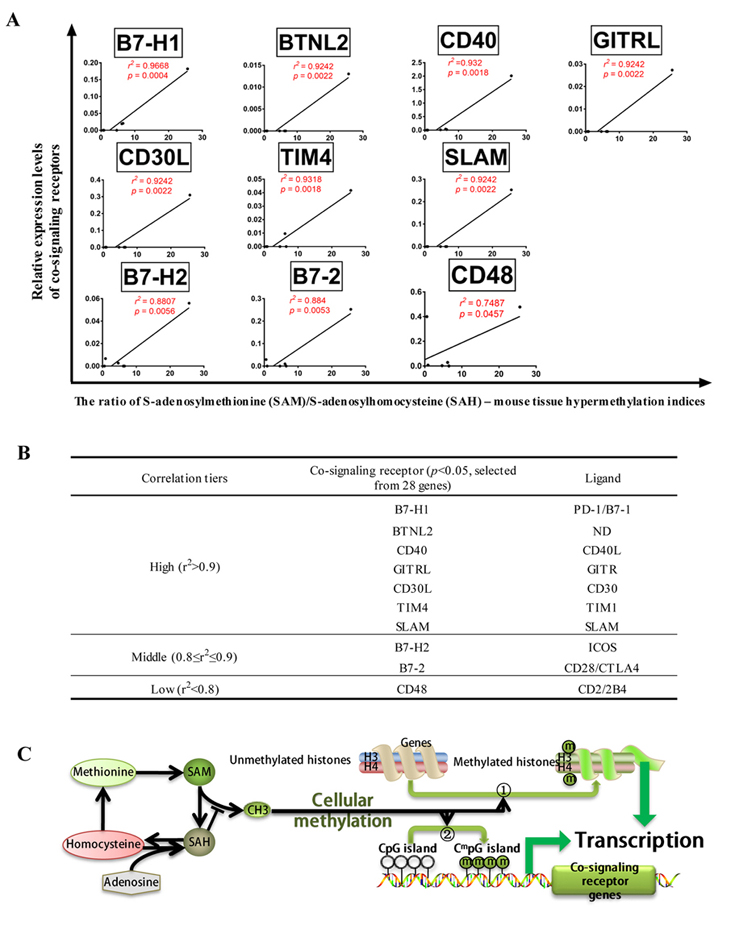 Figure 13
Expression levels of macrophage marker F4/80, B cell marker CD20, and T cell antigen receptor components CD3G and CD3E in human tissues are significantly correlated with the high expressed co-signaling receptor potential. A) Correlation between macrophage, dendritic cells, T-cell and B-cell markers with highly expressed co-signaling potential. B) The cell markers that are significantly correlated with the expression of highly expressed co-signaling potential.
We hypothesized that reverse signaling by upregulated co-stimulation receptors in macrophages may contribute to infections and macrophage polarization. To test this hypothesis, we examined six macrophage microarray datasets of infectious disease including streptococcus pneumonia, leptospiral, influenza H1N1, influenza H3N2, Legionella pneumophila, and listeria, respectively. As shown in Table 7, among 26 upregulated co-signaling receptors, 22 receptors were CSRs (84.6%) whereas other 4 receptors were CIRs (15.4%). Also, the co-stimulation receptors including CD40, 4-1BBL, SLAM, CD48, B7-1, B7-2, and CD155 are significantly upregulated in macrophages in response to infections. In addition, 2 CIRs such as B7-DC and B7-H1 are upregulated in macrophages in response to infection.
| Cell type | SMC | EC | Leukocytes | ||||||
|---|---|---|---|---|---|---|---|---|---|
| GEO ID | GSE21403 | GSE78020 | GSE46262 | GSE59226 | GSE36809 | GSE36809 | GSE36809 | GSE57065 | GSE57065 |
| Description | IL-1b | TNF+IFN | hyperglycemia | influenza virus | Trauma 1d | Trauma 7d | Trauma 28d | Septic shock high score | Septic shock low score |
| B7-H2 | 35.7 | 10.03 | 0.4 | ||||||
| CD70 | |||||||||
| LIGHT | 6.32 | 2.75 | 3 | 3.81 | |||||
| CD40 | 16.38 | 9.41 | 0.19 | ||||||
| 4-1BBL | 0.36 | ||||||||
| OX40L | 0.27 | ||||||||
| TL1A | 0.09 | ||||||||
| GITRL | |||||||||
| CD30L | 0.46 | 2.66 | |||||||
| TIM4 | |||||||||
| SLAM | 0.46 | 0.44 | 0.4 | ||||||
| CD48 | 2.16 | ||||||||
| SEMA4A | 2.91 | 3.02 | 2.45 | 2.33 | 2.03 | 2.63 | 2.44 | ||
| CD58 | 0.09 | 3.38 | 2.21 | 2.82 | 3.08 | ||||
| B7-1 | 6.95 | ||||||||
| B7-2 | 4.6 | 0.49 | |||||||
| CD155 | 2.52 | ||||||||
| CD112 | 4.74 | 0.22 | 0.22 | 0.45 | 0.15 | 0.2 | |||
| Galectin9 | 43.77 | ||||||||
| CD113 | 0.03 | ||||||||
| HVEM | 16.25 | ||||||||
| B7-DC | 2.79 | ||||||||
| B7-H1 | 6.59 | 49.18 | 2.02 | 3.87 | |||||
| B7-H3 | |||||||||
| B7-H4 | 0.24 | ||||||||
| VISTA | |||||||||
| HHLA2 | |||||||||
| BTNL2 | 2.25 | ||||||||
| 1. VSMCs upregulate co-stimulation receptors B7-H2, CD40, SEMA4A, B7-1, B7-2, and CD155 after stimulation with interleukin-1b (IL-1b); 2. In contrast, endothelial cells upregulate B7-H2, CD40, SEMA4A and CD112 and co-inhibition receptors Galectin 9, HVEM, B7-DC, and B7-H1 after stimulation with tumor necrosis factor-a (TNF-α) and interferon (IFN); and 3. Co-stimulation receptors such as LIGHT, SEMA4A, and CD58 show significant upregulations; and co-stimulation receptors SLAM, B7-2, and CD112 are downregulated in the tissue injuries such as severe trauma and septic shock in leukocytes. | |||||||||
Furthermore, we examined five macrophage microarray datasets of type 1 macrophage (M1) polarization versus M0 non-polarized macrophage controls and five microarray datasets of M2 polarization versus M0 non-polarized macrophage controls. We found that 1) 22 CSRs (73.3%) and 8 CIRs (26.7%) were upregulated during M1 polarization; 2) 6 CSRs and 1 CIR were upregulated during type 2 macrophage (M2) polarization; 3) CSRs such as CD40, 4-1BBL, TL1A, CD30L, SLAM, CD48, SEMA4A, B7-1, B7-2, and CD155 are significantly upregulated in M1 macrophage polarization. In contrast, only two CSRs including CD40 and SLAM are upregulated in M2 macrophages; 4) 4 co-inhibition receptors such as CD113, B7-DC, B7-H1, and HHLA2 are upregulated in M1 macrophage polarization; and 5) CD70, GITRL, TIM4, CD112, HVEM, B7-H3, B7-H4 and BTNL2 have no significant changes under M1 or M2 polarization. These results suggest that reverse signaling of CSRs than CIRs play an essential role in macrophages during infections. Further, many CSRs are involved in M1 polarization while only few CSRs play a role in M2 polarization.
We previously proposed endothelial cells as innate immune cells, which can act as APC in pathological conditions by upregulating MHC class II and co-stimulation receptors (56). We also reported that vascular smooth muscle cells upregulate innate immune sensor caspase-1/inflammasome pathway in chronic kidney disease (CKD) (31, 57). Thus, we hypothesized that vascular cells including endothelial cells (EC) and vascular smooth muscle cells (VSMC) may upregulate co-stimulation receptors and co-inhibition receptors in pathologies. We analyzed microarray datasets conducted on endothelial cells and VSMCs stimulated with pro-inflammatory cytokines. Additionally, our analysis also included microarray datasets conducted on leukocytes extracted during infections, trauma injury and septic shock. As shown in Table 8, we found that 1) VSMCs upregulate co-stimulation receptors B7-H2, CD40, SEMA4A, B7-1, B7-2, and CD155 after stimulation with interleukin-1beta (IL-1beta); 2) In contrast, endothelial cells upregulate four CSRs B7-H2, CD40, SEMA4A and CD112 and four CIRs Galectin 9, HVEM, B7-DC, and B7-H1 (PD-L1) after stimulation with tumor necrosis factor-alpha (TNF-alpha) and interferon-gamma (IFN-gamma) (58); and 3) three CSRs such as LIGHT, SEMA4A, and CD58 were significantly upregulated and SLAM, B7-2, and CD112 were downregulated in leukocytes extracted during severe trauma and septic shock. These results suggest that first, forward and reverse signaling of three out of 18CSRs, B7-H2, CD40, and SEMA4A (16.7%),play significant roles in vascular cells stimulated with pro-inflammatory cytokines such as TNF-alpha and IFN-gamma; second, pro-inflammatory cytokines TNF-alpha and IFN-gamma also upregulate five out of ten CIRs (50%) in endothelial cells, suggesting that endothelial cells play an essential role in immune tolerance, anti-inflammatory responses, and inflammation resolution, presumably via their forward signaling and reverse signaling; and third, three CSRs, LIGHT, SEMA4A and CD58, upregulated in trauma and septic shock injury in leukocytes have specific forward and reverse signaling in the pathologies.
| Gene | Gene ID | Topology on cell membrane* | Intracellular domain | Phosphorylation sites | Interaction partners* | |
|---|---|---|---|---|---|---|
| N-out | C-out | |||||
| + | 259-277 | + | ICOS, ZDHHC6, PTPRD, LGALS1, C2CD2L(BioGrid) | |||
| LIGHT | TNFSF14 | + | 34-53 | + | HVEM, CCPG1, APP, YTHDF1, HOXD13(BioGrid) | |
| TIM4 | TIMD4 | + | 287-308 | + | TIM1, B7-H3, HLA-B(STRING) | |
| CD48 | CD48 | + | 225-242 | + | PRAP1, EEF1D, BRIX1, CD2, LCK(BioGrid) | |
| CD58 | CD58 | + | 216-234 | + | CD2, PARP2, LGALS3, ABHD12B, DNAJA1(BioGrid) | |
| CD113 | NECTIN3 | + | 39-62 | + | CD111, CD112, TIGHT, INPP5K, MAK(BioGrid) | |
| B7-DC | PDCD1LG2 | + | 225-243 | + | PDCD1, SBDS, SLC39A11, NGLY1, ALCAM(BioGrid) | |
| B7-H3 | CD276 | + | 467-487 | + | LGALS8, MDL1, RYK, CEACAM21, SIGLECL1(BioGrid) | |
| B7-H4 | VTCN1 | + | 260-280 | + | NCALD, BTLA(BioGrid) | |
| VISTA | VSIR | + | 195-215 | + | PLSCR1, SMAD3(BioGrid) | |
| HHLA2 | HHLA2 | + | 345-365 | + | TMIGD2, HHLA3, DMAP1(STRING), YPO0764(IntAct) | |
| BTNL2 | BTNL2 | ? | + | 7-23 | + | HSPA1L, ANXA11, IFNA10, EMC10, HLA-DRB1(STRING) |
| Our database mining analysis show that all the co-signaling receptors have phosphorylation sites in the intracellular domain, which indicate that all the co-signaling receptors have kinase activities for their potential downstream pathways. 1. Most co-signaling receptors have their N-terminus localized intracellularly; 2. all 12 CSRs and CIRs have the intracellular domains and potential phosphorylation sites; and 3. B7-H4 and VISTA has two interaction partners, while all the other receptors have more than three interaction partners. The topology information of co-signaling receptors were analyzed using the databases such as the UniProt (www.uniprot.org/) and HMMTOP (http://www.enzim.hu/hmmtop/). The interaction partners of co-signaling receptors were analyzed using the databases including the BioGrid (https://thebiogrid.org/), STRING (https://string-db.org/), and IntAct (http://www.ebi.ac.uk/intact/). | ||||||
To further consolidate our findings that reverse signaling of CSRs and CIRs in the pathophysiology of vascular cells, we hypothesized that CSRs and CIRs play important roles in EC activation (22) and VSMC phenotypic switch by modulating the expressions of EC adhesion molecules and VSMC phenotypic switching markers. To examine this hypothesis, we conducted a literature search and selected 20 EC adhesion molecules and 20 VSMC phenotypic switching markers. As shown in Figure 14, we found that: 1) CD30L (a CSR) transgenic overexpression in spleen induces the endothelial cell adhesion molecule FN1 and VSMC phenotypic switching marker alpha-SMA upregulation; 2) B7-H4 (a CIR) overexpression in pancreas downregulates CD31 and upregulates VSMC markers S100A4 and GP110; CD40 RNA interference (RNAi) in human umbilical vascular endothelial cells (HUVEC) induces the upregulation of EC adhesion molecules AGT, TGFB1 in HUVEC and upregulation of VSMC markers MMP-1, MMP-3, and SMMHC; 3) CD70 (a CSR) transgenic overexpression in hematopoietic stem cells (HSC) induces the upregulation of EC adhesion molecule VCAM-1, and VSMC marker cyclin; 4) In CD48 (CSR) negative cells, VSMC marker TIMP-2 was upregulated; and finally, 5) CSR CD112 deficiency induces upregulation of EC adhesion molecules COL18A1, and E-selectin in HUVEC, and downregulates VSMC markers TIMP-1, ACLP, smoothelin, and SM22-alpha. These results suggest that reverse signaling of CSRs and CIRs regulates the pathophysiology of vascular cells by modulating the expression of endothelial cell adhesion molecules and VSMC phenotypic switching markers.
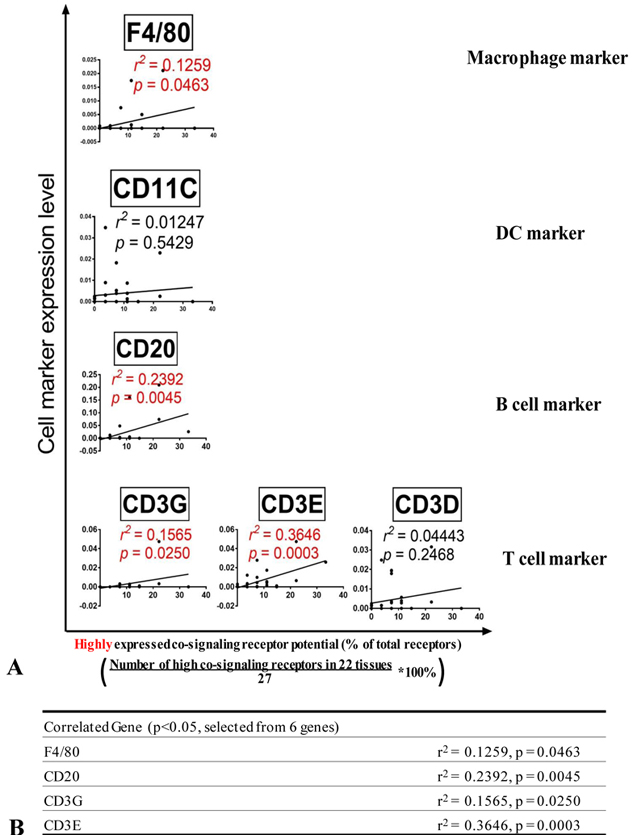 Figure 14
Reverse signaling of CSRs and CIRs regulate pathophysiology of vascular cells. A) Modulation of CSRs and CIRs affect endothelial cell activation and vascular smooth muscles phenotypic switch. B) Schematic representation of modulation co-signaling receptors in vascular inflammatory disorders induce endothelial activation by increasing the presence of adhesion molecules. Further, changes in the co-signaling receptors induce the vascular smooth muscles to undergo phenotypic changes.
To further consolidate our findings that reverse signaling of CSRs and CIRs in the pathophysiology of professional APCs, endothelial cells (EC) and other cells, we extensively searched previous literature. As shown in Figure 15, we found that, 1) in addition to co-stimulation for T cell activation, 12 CSRs including B7-1, B7-2, CD70, CD40, 4-1BBL, OX40L, TL1A, GITRL, CD30L, SLAM, CD155, CD112, and 2 CIRs Galectin9, HVEM have reverse signaling pathways in professional APCs, ECs, monocytes, and other cells; 2) The most common pathway involved in reverse signaling in various cells is mitogen activated protein kinase (MAPK) pathway; 3) Other downstream pathways involved are phosphatidylinositol-3 kinases (PI3K)-AKT (a serine/threonine kinase also known as protein kinase B, PKB), indoleamine 2,3-dioxygenase (IDO), tumor necrosis factor receptor associated factors(TRAF)2/3/4/5/6, signaling lymphocytic activation molecule (SLAM)-associated protein (SAP), focal adhesion kinase (FAK) and caspase-1; 4) CSRs have signaling pathways in various innate immune and non-immune cells; and 5) CSRs regulate various immunological and cell biological roles including apoptosis, autoantibody generation, EC activation (adhesion molecule upregulation), immunoglobulin class switching, expression of CCR7, HLA-DR, and CD86, osteroclastogenesis, cell adhesion and migration, cytotoxicity, cell proliferation.
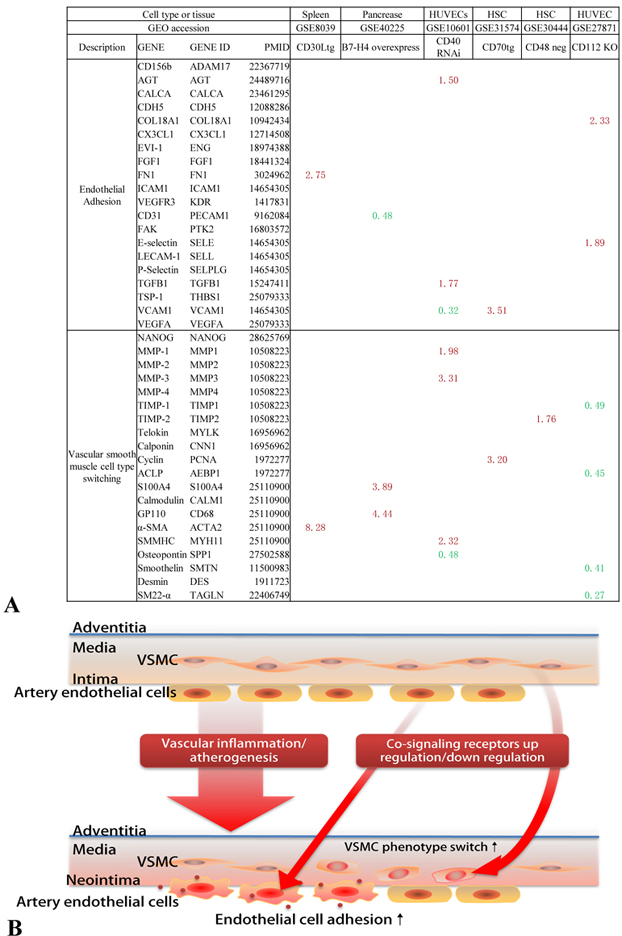 Figure 15
In addition to co-stimulation for T cell activation, 12 co-stimulation receptors including B7-1, B7-2, CD70, CD40, 4-1BBL, OX40L, TL1A, GITRL, CD30L, SLAM, CD155, CD112, and 2 co-inhibition receptors Galectin9, HVEM have reverse signaling pathways in professional APCs, endothelial cells, monocytes, and other cells. A) The signaling pathways that are involved in reverse signaling. MAPK pathway is the most common pathway involved in reverse signaling. B) Schematic representation of the biological roles played by the signaling pathways that mediate reverse signaling.
For those less-characterized CSRs and CIRs including five CSRs (B7-H2, LIGHT, TIM4, CD48 and CD58) and seven CIRs (CD113, B7-DC, B7-H3, B7-H4, VISTA, HHLA2 and BTNL2), we also searched the structural evidences of reverse signaling by analyzing the candidate phosphorylation sites in their intracellular domains and protein interaction partners. As shown in Table 9, we found that 1) Most co-signaling receptors have their N-terminus localized intracellularly; 2) all 12 CSRs and CIRs have the intracellular domains and potential phosphorylation sites; and 3) B7-H4 and VISTA has two interaction partners, while all the other receptors have more than three interaction partners. These analyses suggest that all the CSRs and CIRs have intracellular domain with phosphorylation site capable for reverse signaling and regulating the pathophysiology of professional APCs, vascular cells and other cells in addition to regulate T cell activation and other T cell functions including priming, differentiation, effector and memory functions.
It has been well accepted that all the CSRs and CIRs are expressed in professional antigen presenting cells (APCs) and “conditional APCs” including endothelial cells as we proposed (56). Recent reports showed that an increased number of cell types that are capable of acting as atypical APCs and present antigens to major histocompatibility complex (MHC) class II molecules to conventional CD4+ T cells (37). Of note, CD4+ T cells are among atypical APCs. However, it is unknown what master regulators control the development of T cell plasticity into atypical APCs. We hypothesized that when key transcription factors in T cells have mutations, T cells upregulate MHC class II and CSRs and CIRs. To examine this hypothesis, we analyzed MHC class II expression and the expression of CSRs and CIRs in six T cell master gene mutations. As shown in Figure 16, we found that: 1) T-helper-inducing POZ/ Kruppel-like factor (Thpok, cKROX) deficiency upregulated CIR CD113, CSR B7-1 and downregulated CSRs CD40 and SLAM; 2) Myb deficiency upregulated CSR CD30L and CIR VISTA but downregulated CSRs SLAM and B7-2; 3) signal transducer and activator of transcription 4 (STAT4) deficiency downregulated B7-1; 4) transcription factor 3 (TCF3, E2 alpha) deficiency upregulated CSRs LIGHT and SLAM and downregulated CSR CD48; 5) canonical Wnt/β-catenin effector (Tcf1) deficiency upregulated CSRs LIGHT, CD155 and CD112, but downregulated T cell antigen receptor beta (TCR-beta); and finally 6) STAT1 deficiency (59) upregulated four CSRs such as CD40, CD30L, B7-1, and CD112 and three CIRs including CD113, B7-DC, and BTNL2. In addition, STAT1 deficiency upregulated MHC class II expression. Taken together, STAT1 deficiency not only upregulates MHC class II for delivering T cell activation signal 1, but also upregulates four CSRs for delivering T co-stimulation signal as T cell activation signal 2 (2, 4). Therefore, our results have demonstrated for the first time that STAT1 inhibits T cell plasticity into atypical APCs; and other transcription factors also modulate the expression of CSRs and CIRs in T cells.
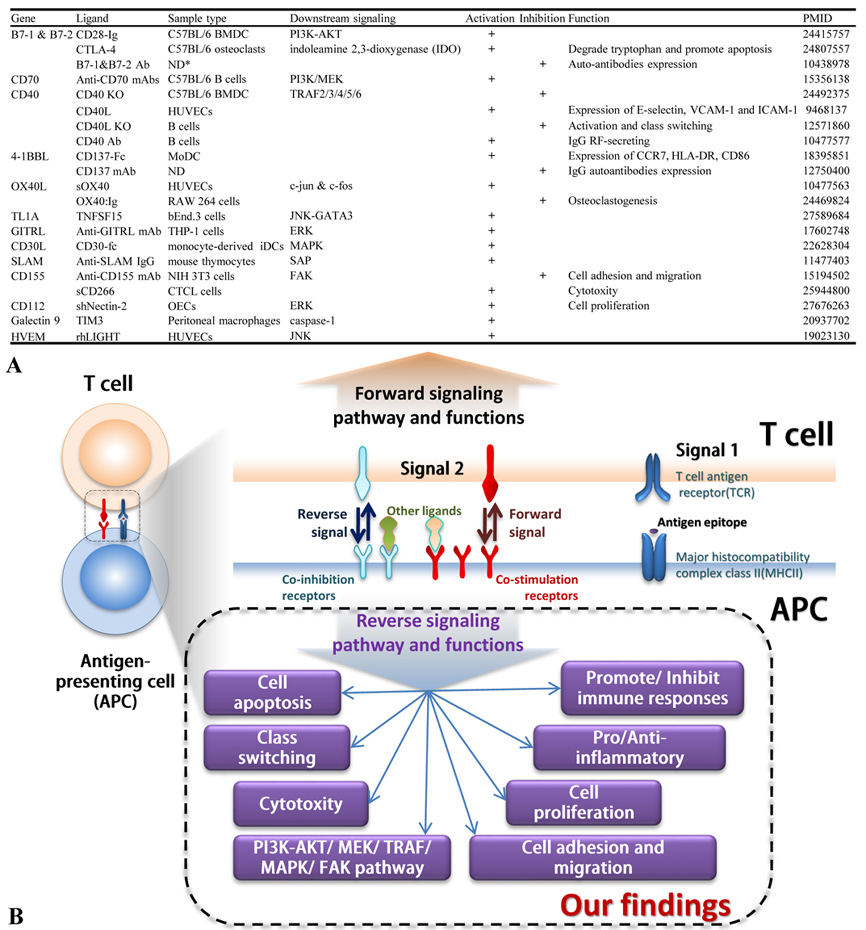 Figure 16
Transcription factors modulate the expression of CSRs and CIRs in T-cells. Stat1 attenuate T-cell plasticity and prevents its conversion to APCs. A. The deficiencies of master genes such as THPOK, MYB, STAT1, and TCF1 in T cells upregulate co-signaling receptors and major histocompatibility complex class II (MHC class II) (STAT1 deficiency). B. Schematic representation of how the mutations in T-cell master regulators can modulate T-cell plasticity.
It has been documented that CSRs and CIRs play critical roles via forward signaling in regulating T cell activation, T cell functional status in priming, differentiation, effector and memory. However, the reverse signaling of these co-signaling receptors in APCs and other cells remained poorly characterized. To improve our understanding in this aspect, we took an experimental datamining approach that we pioneered in 2004 (23, 26, 60-62), and analyzed the expression of 28 CSRs and CIRs in 32 human and mouse tissues as well as many pathological settings. We made the following significant findings. 1)Among 27 co-signaling receptors expressed in 32 human tissues, five CSRs such as CD40, CD48, CD58, SEMA4A and B7-H2 are highly expressed; there are no highly expressed CIRs; and five tissues including lymph node, placenta, thymus, nerve and trachea have high T cell co-stimulation and co-inhibition potential. 2)Two CSRs including CD40 and CD70 exert all four functions on T cells including priming, differentiating, effecting and memorizing; and six CSRs including CD48, CD58, TL1A, OX40L, LGHT, B7-H2 and one CIR Galectin 9 have three functions. 3)32 human tissues have significant differences in co-signaling that regulate four T cell functions including priming, differentiation, effector and memory. 4) Increased co-stimulation potential in nine human tumors in breast, lung, liver, ovaries, gastro-intestine, esophagus, kidney and in glioma and bladder carcinoma is significantly correlated with improved prognosis. 5) Inflammasome components NOD3, NALP9, CARD8, NOD4 and NALP6 are few of the significant regulators of the tissue expression of co-signaling receptors; and reverse signaling via co-signaling receptors regulate the pro-inflammatory sensor functions of innate immune cells for DAMPs and PAMPs. 6) VEGFR3, a key VEGF receptor, plays an essential function in regulating these co-signaling receptor expression, suggesting that co-signaling receptors may play important roles in angiogenesis. 7) Tissue hyper-methylation status may regulate the expression of one-third of co-signaling receptors in mouse tissues; and during tumorigenesis, certain tumors can switch methylation/demethylation regulation modes on these co-signaling receptors and upregulate these co-signaling receptors, suggesting that DNA methylation inhibition and histone deacetylase inhibition can enhance co-signaling receptor expression and anti-tumor immune responses. 8) Tissue expression levels of macrophage marker F4/80, B cell marker CD20, and T cell markers CD3G and CD3E are correlated with highly expressed co-signaling receptors, but not correlated with the expression of dendritic cell marker CD11C in 22 tissues. 9) Reverse signaling of CSRs play roles more than that of CIRs in macrophages during infections; and reverse signaling of many CSRs plays important roles in M1 polarization but only that of three CSRs such as CD40, SLAM and B7-2 play some roles in M2 polarization. 10) Forward and reverse signaling of three CSRs B7-H2, CD40, and SEMA4A play roles in vascular cells during inflammation; and forward and reverse signaling of 50% co-inhibition receptors upregulated in inflammation makes EC play roles in immune tolerance, anti-inflammation, and inflammation resolution. 11) Reverse signaling of CSRs and CIRs regulate the expression of EC adhesion molecules and VSMC phenotypic switching markers. 12) 12 CSRs and 2 CIRs are reported to have reverse signaling pathways including PI-3 kinase-Akt, MAPK, TRAF, caspase-1; and all the CSRs and CIRs have intracellular domain with phosphorylation sites capable for reverse signaling. 13) STAT1 inhibits T cell plasticity into atypical APCs; and other transcription factors modulate the expression of CSRs and CIRs in T cells.
By analyzing sequencing data from tissue cDNA libraries, we were able to study the expression profiles of CSRs and CIRs in various tissues. Since the data are collected from cDNA cloning and DNA sequencing experiments rather than theoretical data derived from computer modeling, the data require no further experimental verification. Since the gene expression sequencing tag (EST) data deposited in the NIH-NCBI-UniGene database have been established based on DNA sequencing data, the data obtained by EST database mining are more precise in providing the tissue expression profiles of genes than traditional hybridization- and primer annealing-based approaches like Northern blots and RT-PCRs (23). Of note, since the UniGene database does not have many non-tumor cell line-related gene expression data in various gene deficiencies and stimulation conditions, we analyzed microarray-based gene expression data deposited in NIH-GEO Datasets to determine CSR and CIR expression changes under pathological conditions.
We previously proposed a novel concept that endothelial cells are innate immune cells, in which we provided strong evidence to show that endothelial cells stimulated by various pathological factors can function as innate immune cells comparable to that of prototypic innate immune cells such as macrophages. ECs’ innate immune cell functions include the upregulation of CSRs for T cell activation and other T cell functions. Although ECs’ function in attenuating T cell activation and inhibiting autoimmune responses has been reported (63), CIRs function in ECs and other vascular cells remains poorly characterized. Our new finding showed that potential forward and reverse signaling of 50% CIRs upregulated by pro-inflammatory cytokine TNF-alpha and IFN-gamma stimulation (58) can make ECs to play significant roles in immune tolerance, anti-inflammation, and inflammation resolution during inflammatory pathologies.
Recent reports showed that an increased number of cell types that are capable of acting as atypical APC and present antigens to major histocompatibility complex (MHC) class II molecules to conventional CD4+ T cells (37). Of note, CD4+ T cells are among atypical APCs. Indeed, we recently reported that GATA3, HDAC6 and BCL6 regulate FOXP3+Treg plasticity and determine Treg conversion into either novel antigen-presenting cell-like Treg or Th1-Treg (38). However, it is unknown what master regulators control the development of non-Treg T cell plasticity into atypical APC. The novel finding presented in this manuscript has demonstrated for the first time that STAT1 deficiency in T cells upregulates MHC class II and co-stimulation receptors, suggesting that STAT1 inhibits T cell plasticity into atypical antigen presenting cells.
Herein, we acknowledge that further experiments such as qPCR, immunoblots, flowcytometry etc. are required to verify tissue expression profiles CSR and CIRs in both physiological and pathological conditions. Further, well-designed experiments are needed to validate the signaling pathways that are involved in reverse signaling that we report here.
Based on our new findings and others reports, to improve our understanding on co-signaling receptors including CSRs and CIRs, we propose a new working model as shown in Figure 17 and highlight the new roles of reverse signaling of co-stimulation receptors and co-inhibition receptors on T cells and non-T cells. T cell transcription factor STAT1 inhibits the expression of MHC class II and co-signaling receptors. This leads to inhibition of T cell plasticity into atypical antigen presenting cells (APCs). Since STAT1 deficiency significantly weakens immune response (64), our findings suggest that STAT1 inhibition of T cell plasticity into atypical antigen presenting cells support immune function of T cells. Further, our new finding showed that pro-inflammatory cytokine TNF-alpha and IFN-gamma stimulation (58), secreted by endothelium-interacting CD4+ T helper cell 1 (Th1 cells) and other immune cells, upregulate co-inhibition receptor expression on endothelial cells (ECs) significantly. This indicates that ECs play significant roles in immune tolerance, inhibition of inflammation, and inflammation resolution during inflammatory disorders. Additionally, cellular immunometabolic status such as hypomethylation/ hypermethylation status, signaling of pathogen-associated molecular patterns (PAMPs) receptors/danger associated molecular patterns (DAMPs) receptors/ inflammasomes, as well as vascular endothelial growth factor receptor 3 (VEGFR3) pathways play significant roles in modulating the expression of CSRs and CIRs. Our results have provided novel insights into co-signaling receptors as physiological regulators in addition to their functions in regulating T cell activation and also suggest new therapeutic targets for the treatment of cancers and inflammatory disorders.
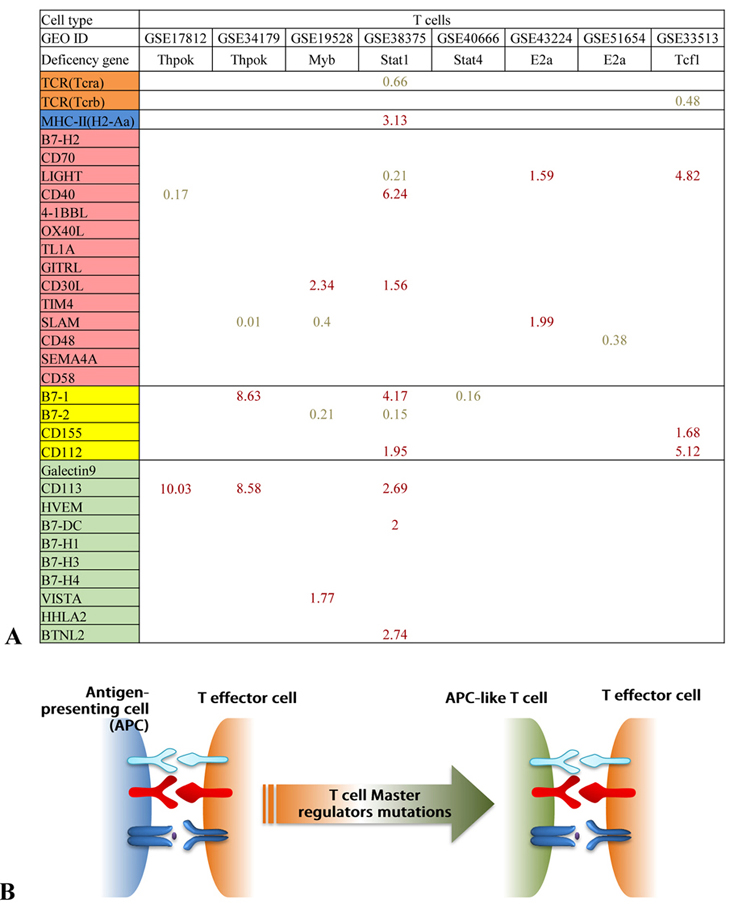 Figure 17
New roles of reverse signaling exerted by CSRs and CIRs on T-cells and non T-cells. A) Mutations of T-cell master regulators such as STAT1 can modulate the expression of CSRs and CIRs, thus affect the plasticity of T-cells. B) Pro-inflammatory cytokines such as tumor necrosis factor –alpha (TNF-alpha) and Interferon-gamma (IFN-gamma) secreted by CD4+ Th1 cells and other immune cells increase the expression of CIRs in endothelial cells. This suggest that endothelial cells play a significant role in modulating immune tolerance, attenuation of inflammation, inflammation resolution and tumorigenesis. C) The cellular methylation status, signaling mediated via DAMPRs and PAMPRs and VEGFR3 pathway during various pathological conditions modulate the expression of CSRs and CIRs.
This work partially supported by the National Natural Science Foundation of China (grant No. 81700706) to Dr. N. Wu; and NIH grant to Dr. XF. Yang (Grant No. RO1 - HL132399-01A1).