
Synaesthesia is a neurodevelopmental trait that causes unusual sensory experiences (e.g., perceiving colours when reading letters and numbers). Our paper represents the first evidence that synaesthesia can impact negatively on children’s well-being, and that there are likely to be important mental health co-morbidities for children with synaesthesia. We recruited 76 synaesthetes aged 6-10 years who had one of two types of synaesthesia (grapheme-colour synaesthesia and sequence-personality synaesthesia), and compared them to almost one thousand matched non-synaesthete controls. We tested children’s wellbeing with two different measures, and found a significant relationship between synaesthesia and affect (i.e., mood), and also between synaesthesia and anxiety. Children with synaesthesia showed evidence suggesting significantly higher rates of Anxiety Disorder, and also displayed a type of mood-moderation in demonstrating fewer extremes of emotion (i.e., significantly fewer negative feelings such as fear, but also significantly fewer positive feelings such as joy). We discuss our results with reference to the emotional moderation of alexithymia (the inability to recognize or describe one's own emotions), and to a set of known links between alexithymia, anxiety, autism and synaesthesia.
Synaesthesia is an unusual neurodevelopmental trait affecting approximately 4.4% of the population (1). People with synaesthesia experience unusual secondary sensations such as colours or tastes triggered by everyday activities like reading or listening to music (for review see (2, 3)). These lifelong sensations are experienced automatically, without effort, and tend to first emerge sometime early in childhood (4). Here we focus on two common types of synaesthesia in which reading letters and numbers triggers either colours (grapheme-colour synaesthesia; e.g., the synaesthete feels that A is red, 7 is blue) or personifications (sequence-personality synaesthesia; e.g., the synaesthete feels that A is outgoing and male; 7 is generous and female; (5, 6). Sequence-personality synaesthesia is also known by the acronym OLP (ordinal linguistic personification) and we use this term henceforth. Both grapheme-colour and OLP are widely recognised variants of synaesthesia with known neurological profiles (e.g., altered white matter coherence in regions associated with colour processing or social processing, respectively; (7, 8)). There has been a long history of research on synaesthesia in adults (for a historical review see (9)) but a relative paucity of information about synaesthesia in children. In this study we ask whether children with either type of synaesthesia show differences in their wellbeing. In our study we tested a very large sample of over a thousand children with and without synaesthesia, while administering two different wellbeing measures (see below). We asked whether children identified as synaesthetes are also those who show differences to non-synaesthetes in their wellbeing. We begin with a brief overview of concepts of wellbeing then discuss why wellbeing may be an area of interest in synaesthesia research.
Subjective wellbeing describes feelings of pleasantness about one’s life (e.g., (10)) and encompasses a number of different constructs (see (11)). Its definition can include aspects of life satisfaction (12), hedonic wellbeing (e.g. emotional stability, good mental health), eudaemonic wellbeing (e.g. positive mental attitude, fulfillment, e.g. (13)), or bodily and health-related wellbeing (e.g., (14)). Treatments of wellbeing in children have been similarly wide-ranging, with many studies focussing on single dimensions within what is understood to be a multi-dimensional concept (11, 15–18). Wellbeing can also be contextually dependent (19, 20) with children showing different levels of wellbeing in different contexts (e.g., home vs. school). Understanding children’s wellbeing is of particular importance because individual differences relate to inequalities in a number of important domains. For example, lower levels of wellbeing have been linked to lower educational attainment (21–23), poorer behaviour (24, 25), and poorer life outcomes (26).
Why might we anticipate differences in wellbeing in children with synaesthesia? Our hypotheses stem from related studies in adults, which show that synaesthetes differ from their peers in five key ways: in their levels of anxiety (27), in their personality traits (28), in their sensory sensitivities (29), in their high academic achievements (e.g., (30)), and in their rates of conditions such as autism (31–33). Each of these findings could influence scores in wellbeing, in the following ways. First, Carmichael et al. (27) showed that adult synaesthetes reported elevated levels of anxiety disorder. In their study, Carmichael and colleagues screened several thousand adults from the general population for the trait of synaesthesia, while at the same time eliciting their self-reported health history. People verified as synaesthetes were also significantly more likely to report diagnosed anxiety disorder (but not other health conditions), compared to non-synaesthetes. Their finding was replicated within a second sample, using different methodologies (see (27)) suggesting that anxiety may indeed be a trait associated with synaesthesia. Importantly, anxiety in adults often has its roots in childhood (e.g., childhood anxiety brings a three-fold increase for experiencing depression or anxiety in later life; (34)). This suggests that anxiety may be found not only in synaesthetic adults but also in synaesthetic children.
People with synaesthesia also show differences in their personality traits. Of particular relevance here is that children with grapheme-colour synaesthesia showed low extraversion (28), a feature elsewhere associated with negative wellbeing (for review see (35)). Other personality traits speak to potentially higher levels of wellbeing, particularly the well-replicated finding that both child and adult synaesthetes are high in the personality trait of Openness to Experiences (28, 36–38). Openness has been linked to creativity and intellectual curiosity as well as elevated levels of wellbeing (see (39–41)). Similarly, adult synaesthetes show higher rates of positive schizotypy ((38) e.g, magical thinking), a particular manifestation of schizotypy with numerous links to positive wellbeing (42). Hence personality differences found in both adult and child synaesthetes suggest that children with synaesthesia may have either elevated wellbeing (linked to their Openness) or indeed lower wellbeing (linked to their low Extraversion).
A third reason to explore wellbeing in children with synaesthesia comes from the relationship between synaesthesia, sensory sensitivity and autism (43). Adults with synaesthesia have higher rates of sensory sensitivities (e.g., sensory overload from lights or sound (43) and this trait has been linked with poor wellbeing and anxiety in children (44, 45). Similarly, people with autism have elevated rates of synaesthesia (31, 32), and autism itself has well known comorbidities with anxiety and depression (e.g., (46, 47); for a recent review see (48)). On the other hand, one recent study has shown that synaesthesia is elevated only in people with autism who also happen to have exceptional talents (i.e., autistic savants; (32)) and there is some evidence that giftedness can itself elevate wellbeing (for discussions see (49)). Relatedly, synaesthetes even without autism are known to out-perform their peers in academic achievements (e.g., in vocabulary tests) and they have higher academic self-confidence (30). Again, these achievements are known to correlate with positive wellbeing (50). In summary, there are a number of reasons to suspect that synaesthesia may be accompanied by lower levels of wellbeing (given anxiety disorder, autism, and sensory sensitivities in adult synaesthetes; and low Extraversion as a personality trait) but conversely, also higher levels of wellbeing (from high Openness in their personality, academic achievement, and possible links to talent).
The differences discussed above, which set synaesthetes apart from their peers, also raise one final hypothesis about wellbeing in childhood synaesthesia. We noted above a link between synaesthesia and autism (31–33) and we point out that autism has another relevant co-morbidity, known as alexithymia. This trait is characterised by low emotional self-awareness, in that people with alexithymia struggle to identify or describe their own emotional states, and have particular difficulties distinguishing between emotional arousal and other bodily sensations (e.g., (51, 52); for recent reviews see (53, 54)). Importantly, alexithymia contains both a cognitive component (relating to difficulties recognising and labelling emotions) but also an affective component (inability to become emotionally aroused; (55)). It exists in around 10% of the general population (56, 57) but is particularly elevated in anxiety disorder (52) and autism (where comorbidity with alexithymia is as high as 50%; (58–60)). Given the adult co-morbidities between synaesthesia on the one hand, and anxiety and autism on the other, this raises the question of whether people with synaesthesia may also show traits of alexithymia.
This important question about alexithymia in synaesthesia was tested directly in a group of adult grapheme-colour synaesthetes by Janik (61). Janik found no significant differences to a group of controls1 although her sample contained only 10 grapheme-colour synaesthetes, and were all adults. We therefore test here whether evidence of alexithymia can be found in a far large sample of synaesthetes, who are still children. Since alexithymia is a disorder of mood regulation, we investigated mood by looking at the affective responses of children using a version of the Positive and Negative Affect Scale for Children (PANAS-C; (62); see Methods). This questionnaire might speak to the affective component of alexithymia (inability to become emotionally aroused) because it asks children directly about their positive and negative moods (e.g., how happy have they felt in the last week? How fearful?). If children with synaesthesia show evidence of mood disregulation, we predict they may demonstrate unusual patterns of mood, for example, muted emotional responses on both scales (i.e., reduced happiness, but also reduced fear; see Discussion for a fuller treatment of how alexithymia might manifest in mood questionnaires).
In summary, we investigated levels of wellbeing in children with synaesthesia, using an unusually large sample of children with this unusual condition. We tested 1042 children, including synaesthetes with one of two types of synaesthesia (grapheme-colour synaesthesia and OLP synaesthesia) and their matched controls. We administered two measures of wellbeing: children self-competed a test of positive and negative affect (i.e., a version of the PANAS-C; (62)), and at the same time, their parents completed a questionnaire about their child’s levels of anxiety (Screen for Child Anxiety Related Emotional Disorders - SCARED; (63)). Our sample of synaesthetes was identified from an earlier study that conduct wide-scale screening for the condition, so our synaesthetes were sampled without recruitment biases (e.g., no self-referral biases, see (30) for discussion). Importantly, experimenters did not who the synaesthetes were when administering wellbeing questionnaires, so they could not inadvertently influence the results.
We tested 1042 children aged 6-10 year. These included 76 children with grapheme-colour synaesthesia and/or OLP synaesthesia (40 girls, 36 boys, mean age = 8.87 SD = 1.11). Specifically, these were 35 grapheme-colour synaesthetes (20 girls, 15 boys, mean age = 8.77 SD =1.18); 34 OLP synaesthetes (17 girls, 17 boys, mean age = 9.01 SD = 1.06), and 7 synaesthetes with both (3 girls, 4 boys, mean age = 8.72 SD = 1.06). Synaesthetes had been identified from an earlier screening program (see (28)) which targeted the student bodies of 22 primary schools in Southern England, screening every pupil in Years 2-5 for synaesthesia (N = 3426, aged 6 to 10 years; 1669 female, 1737 male; mean age = 8.42; SD = 1.17). Since opt-out rates were extremely low (1%) this covered almost the entire student body in every class/school targeted, making the screening process an unbiased sampling of local child synaesthetes.
The diagnostics used in this earlier screening study identified the ‘gold standard’ marker for synaesthesia known as ‘consistency-over-time’: i.e., tests are designed around the fact that that the colours of graphemes (e.g., A is red) do not change markedly over time for any given grapheme-colour synaesthete, and the personalities does not change (e.g., B is outgoing) for any given OLP synaesthete. The diagnostics for synaesthesia therefore elicited associations (e.g., What colour is A?) multiple times and assessed consistency: synaesthetes were identified as children who were extraordinarily consistent in repeated testing, while non-synaesthetes were inconsistent. Specifically, synaesthetes had to be significantly more consistent that their age-matched peers within an initial consistency test (Session 1), and within a second consistency test (Session 2) and across the 7 months separating the two sessions. (Indeed this test is so conservative that synaesthetes had to be more consistent over 7 months than their peers had been within the 10 minutes of Session 1). The full details of this screening protocol are available within (28).
In addition to our synaesthetes, we also recruited a group of non-synaesthete controls (N = 966, 504 girls, 462 boys, mean age = 8.38 SD = 1.19). Controls were drawn from the same screening population as synaesthetes, but were children who had failed the synaesthesia diagnostics2. In addition to our child participants we also tested 262 parents, comprising 31 parents of our synaesthetic children (18 girls, 13 boys, mean age = 8.54 SD = 1.12), and 231 parents of controls (118 girls, 113 boys, mean age = 8.33 SD = 1.20). Our study was approved by the Sussex University Science and Technology ethics committee.
We administered the following tests of wellbeing, the first completed by children at school and the second completed by parents.
The dPANAS-C (64) is a child-completed questionnaire measuring mood and emotional wellbeing, split into two domains: Positive Affect relates to feelings of enthusiasm, joy and alertness, and Negative Affect relates to feelings such as sadness, fear, guilt and anger (62). The questionnaire has 10-items, comprising 5 adjectives on the positive scale (joyful, cheerful, happy, lively, proud) and 5 adjectives on the negative scale (miserable, mad, afraid, scared, sad). Children were asked to consider each item in turn, and to decide how much they had felt that emotion in the last week. Children responded using a 5-point Likert scale (Very slightly or not at all, A little, Moderately, Quite a bit, Extremely). The dPANAS-C is an adaptation of the PANAS-C short form (62) which itself was based on a longer 27-item PANAS-C scale (65) and prior to that, an original PANAS questionnaire for adults (66). The adaptation used in this study (dPANAS-C) provides age-appropriate definitions for vocabulary in the test (e.g., Miserable, Moderately). For example, the item ‘miserable’ is presented with a definitional speech bubble that states “Miserable means really sad”.
This parent-completed questionnaire (63) is a 41-item childhood screening measure for anxiety symptoms related to overall anxiety, with additional sub-scales of Panic Disorder, General Anxiety Disorder, School Avoidance, Social Anxiety and Separation Anxiety. Questions are presented as statements, which parents rate based on their child over the past three months. For example, Item 36 relates to school avoidance and states “My child is scared to go to school”. Parents respond on a 3-point Likert scale “Not true or hardly ever true/ Somewhat true or sometimes true/ Very true or often true”.
Our child-report task (dPANAS-C) was administered in either a pencil-and-paper version or via a touchscreen electronic tablet (we introduced tablets part-way through our testing simply to facilitate coding for the large sample of participants). Children were given individual 10” tablets, one per child (i.e., 33 Acer Aspire SW3-016 or Acer One 10 tablets running on Intel® Atom TM x5-Z8300 processors with Windows 10 and 10.1" LED backlight touchscreens (1280 x 800 pixels). Children were tested within their classes, with an average size of 25.3 pupils (SD =5.0, range 8-32). Each class cohort was tested by three researchers at any given time. After gaining consent from gatekeepers, parents and children, our child participants were guided through the activity. During the instructions, children were told they were going to “answer some questions about their feelings and emotions, like happy and scared”. They were told to look at the emotion, and to choose the answer that best matched how they felt during the last week. The response scale was explained to them and they were told there were no right or wrong answers, and that nobody they knew would read their answers. This measure took approximately 5 minutes to complete and was given among other measures whose findings are reported elsewhere. Testing took place October 2016 to April 2017. Researchers did not know at the time of testing which children were synaesthetes and which were controls.
Parents completed the SCARED questionnaire in either a pencil-and-paper version sent by post, or through an identical version posted on the website Qualtrics, which parents accessed via a URL delivered by email. The decision of post versus email was dictated by how each school communicated routinely with their parents. The questionnaire was sent out at the start of the children’s testing, and reminder emails were sent twice more during the following 12 months. The questionnaire also contained five other testing items (e.g., a personality questionnaire, whose findings are to be reported elsewhere) including a demographic questionnaire which elicited (inter alia) mother’s age, highest qualification of either parents (None, Schooled to 16 years, Schooled to 17-19 years, Undergraduate, Postgraduate, Other), and home language environment (i.e., language spoken mostly at home: English only; English and other language; Other language only). All three variables have been recently implicated in either wellbeing (67) or synaesthesia (e.g., (30, 68)) so will be included in our analyses below.
We will first examine children’s affective wellbeing from the dPANAS-C questionnaire (completed by children; (64)) and then examine their anxiety from the SCARED questionnaire (completed by parents; (63)). Given the rarity of synaesthesia, and the potential for small group sizes, we first combine both types of synaesthetes in our initial analyses (grapheme-colour with OLP synaesthetes), but then separate into separate sub-groups were power allows. Since numbers of synaesthetes are particular small in our anxiety measure (because the SCARED was completed only by a subset of parents) we present only a combined analysis for anxiety. When analysing by synaesthesia sub-type, we removed seven synaesthetes who had both types of synaesthesia (i.e., both grapheme-colour and OLP synaesthesia), but these children are reinserted when we merge synaesthetes into a single group. Since children were naturally clustered within schools and classes, we first investigated whether these clusters influenced our dependent measures. Mixed effects models (adjusting for age at time of dPANAS-C data collection) showed no significant school-level or class-level differences for either the negative or positive scale of the dPANAS-C (henceforth dPANAS-neg and dPANAS-pos) nor for the SCARED, so mixed effects models were not necessary for the remainder of our analyses below.
Table 1 shows the age of participants, along with their mean positive and negative affect scores across groups. Since there were significant age-differences, subsequent analyses controlled for age (entered in decimalised years) as a control covariate, along with one independent variable (Synnaesthesia status; i.e., synaesthete vs. control).
| |
Synaesthetes | Controls | Age differences | ||
|---|---|---|---|---|---|
| Any | GC only | OLP only | |||
| Child’s age | 8.87 (1.11) | 8.77 (1.18) | 9.01 (1.06) | 8.38 (1.19) | ANY>C: t (1039)=3.51 p<.001 |
| - emotions | 8.22 (3.62) | 8.54 (4.03) | 8.21 (3.41) | 10.08 (4.33) | |
| + emotions | 17.80 (3.92) | 17.83 (3.46) | 17.97 (4.35) | 19.08 (4.41) | |
| n | 76 | 35 | 34 | 965 | |
We began by analysing our dPANAS-C scores, considering each scale separately (negative and positive affect). We generated a score in each scale by first coding children’s responses as 1 to 5 (where 1= Very slightly or not at all, and 5= extremely), and then summing the five adjectives on each scale. Analyses showed that data within both scales violated assumptions of normality (measured by the Shapiro-Wilks test and inspection of QQ/PP plots) for the control group (PANAS-negative W = .91, p<.001, PANAS positive W = .94, p <.001) and the synaesthete groups (Any synaesthesia: PANAS-negative W = .80, p<.001, PANAS positive W = .95, p <.01; GC synaesthesia PANAS-negative W = .78, p<.001; OLP synaesthesia: PANAS-negative W = .91, p<.001, PANAS positive W = .94, p <.001). We therefore ran a bootstrapped ANCOVA for each scale, predicting score by Synaesthesia status (i.e., whether each child is a synaesthete vs control; see Methods for how this status was determined). Table 2 shows the output of our model for our combined group of synaesthetes, and indicates that synaesthetes reported significantly lower levels of emotion than controls, on both the positive scale (adjusted marginal mean difference = 1.23, d = -0.28) and on the negative scale (adjusted marginal mean difference = 1.41, d = -0.34).
| dPANAS-C: Negative emotions | dPANAS-C: Positive emotions | |||||||
|---|---|---|---|---|---|---|---|---|
| Predictors | B (SE) | F | p | Partial Eta sq | B (SE) | F | p | Partial Eta sq |
| Child age | -0.90 (0.11) | 68.41 | <.001 | .061 | -0.08 (0.11) | 0.52 | .471 | <.001 |
| Synaesthesia status | -1.41 (0.50) | 8.08 | <.001 | .008 | -1.23 (0.52) | 5.51 | .006 | .005 |
We found similar trends when we split synaesthetes into two groups; i.e., grapheme-colour showed a trend for lower negative affect (F(1,997) = 2.54, p = .07uncorrected, mean difference = -1.18, BCa CI -2.39/0.18; d = -0.28) and lower positive affect (F(1,997) = 2.71, p = .05uncorrected, mean difference = -1.21, BCa CI -2.41/0.13, d = -0.28); while OLP synaesthetes showed lower negative affect only (F(1,997) = 3.18, p=.02 uncorrected, mean difference = -1.30, BCa CI -2.45/-0.07, d = -0.31) but no differences in positive affect (F(1,996) = 1.83, p=.16uncorrected, mean difference = -1.05, BCa CI -2.51/0.38, d = -0.25). However, our smaller group sizes mean these numbers fail to reach significance and/or fail to survive correction. Therefore, in order to explore the relationship with greater power, we followed previous approaches which combine behaviours across scales. Following this approach (69), we took the median point in each scale, and assigned ‘low’ status to children below the median, and ‘high’ status to children above. For example, a child falling below the median in both scales would be ‘low positive’ and ‘low negative’. This classification, from Norlander and colleagues (69) has been used elsewhere in both adults (70, 71) and children (72–74), and affords a way to divide children into the four natural groupings that fall out from the positive and negative scales. These grouping are shown below, along with the terminology used by Norlander and colleagues to name each of the four classifications.
1. Self-fulfilling: Children who report high positive and low negative affect
2. Low affective: Children who report low positive and low negative affect
3. High affective: Children who report high positive and high negative affect
4. Self-destructive: Children who report low positive and high negative affect
Our findings above suggested that children with synaesthesia may be ‘low affective’ (i.e., they report low affect on both positive and negative scales), and this can be seen in Figure 1 (for all synaesthetes combined, for grapheme-colour synaesthetes and OLP synaesthetes, separately). This figure shows that synaesthetes are more likely to fall within the low affective group than any other classification, and also that synaesthetes are more likely to fall within this group than controls.
 Figure 1
Group membership of the four affective groups by percentage. Figure compares synaesthetes in grey (any synaesthesia, GC, OLP) against controls in white.
To test this statistically, we ran binary logistic regressions, with the outcome variable being the likelihood of having a classification of low affective (vs. other classification), using group status as predictor (synaesthetes vs. controls). We again controlled for child’s age, and found that synaesthetes were three times more likely to be found in the low affective group than non-synaesthete s (β = 3.19, p < .001; see Table 3). A similar pattern was found when considering each group of synaesthetes separately, with both effects highly significant (see Table 3).
| Parameter | B | SE | β | β 95% CI |
|---|---|---|---|---|
| Any synaesthesia | ||||
| Intercept | -1.16 | .08 | ||
| Child’s age | .30 | .06 | 1.35*** | [1.19,1.52] |
| Synaesthesia.status | 1.16 | .25 | 3.18*** | [1.96,5.14] |
| Grapheme-colour synaesthesia | ||||
| Intercept | -1.14 | .08 | ||
| Child’s age | .31 | .06 | 1.36*** | [1.20,1.54] |
| Synaesthesia.status | .97 | .35 | 2.63** | [1.32,5.24] |
| OLP synaesthesia | ||||
| -1.14 | .08 | |||
| Child’s age | .28 | .06 | 1.33*** | [1.17,1.50] |
| Synaesthesia.status | 1.20 | .36 | 3.32*** | [1.65,6.70] |
Our anxiety measure was the parent-completed SCARED questionnaire (75). We had responses from the parents of 262 children, and we combined our synaesthetes into a single group irrespective of sub-type (N = 31; given our small sample). We had also gathered additional data from parents on three measures which might influence our data: mother’s age, highest household education, and home language environment. We examined these three variables first and found systematic differences between the control and synaesthete groups. Given our small sample size, we coded highest household education as Degree (undergraduate, postgraduate) versus Non-degree (Schooled to 16 years, Schooled to 17-19 years, No qualification, Other), and we coded home language environment as English only versus Other (English and other language; Other language only). We found that synaesthetes had older mothers (43.2 vs 41.4, t(260)= 2.03, p<.05), potentially more educated parents (90.3% with degree vs 77.0%, χ2= 2.90, p<.10) and were more likely to speak an additional language at home other than English (22.6% vs 10.4%, χ2=3.89, p<.05). We therefore controlled for these factors, as well as child’s age, in our models below.
We coded SCARED responses using a standard approach (76), assigning a score of 0-2 for each response, in which 0 = Not true or hardly ever true, 1 = Somewhat true or sometimes true, and 2 = Very true or often true. This generates an overall score for Anxiety Disorder from all 41 questions, as well as separate scores on the five anxiety sub-domains (Panic disorder, Generalised Anxiety Disorder, Separation anxiety, Social anxiety, School avoidance; see (63); see Supplementary Information (SI) for scoring protocols). We then identified children falling in the pathological range (e.g., those with scores ≥25 out of 41 for overall Anxiety Disorder; see SI, for thresholds within the five sub-domains). To analyse our data, we used binary logistic regression with the outcome being anxiety pathology, and the predictor being group membership (synaesthetes vs. controls), while also including one or more co-variate (mother’s age, household education, home language environment). Early models included all three co-variates simultaneously, leading to a final model including two covariates -- home language, and mother’s age -- which remained significant (either at conventional alpha levels or trending at p < .10; see Table 4, and Tables 5 to 10).
| Parameter | B | SE | β | β 95% CI |
|---|---|---|---|---|
| Intercept | -1.58 | 0.19 | 0.21 | |
| Mother’s age | -0.05 | 0.03 | 0.95# | 0.90, 1.01 |
| Home language (non-English) | -0.87 | 0.64 | 0.42 | 0.12,1.48 |
| synaesthesia.status | 0.93 | 0.45 | 2.54* | 1.05, 6.15 |
| Anxiety type | % controls | % synaesthetes | β | β 95% CI |
|---|---|---|---|---|
| Anxiety Disorder overall | 16.9 | 30.0 | 2.54* | 1.05, 6.16 |
| Panic disorder | 6.4 | 10.0 | 2.29 | .59, 8.93 |
| Generalised Anxiety Disorder | 14.6 | 22.6 | 2.38# | .90, 6.26 |
| Separation anxiety | 28.3 | 33.3 | 1.31 | .58, 2.98 |
| Social anxiety | 18.2 | 29.0 | 1.85 | .78, 4.36 |
| School avoidance | 11.1 | 16.1 | 2.15 | .73, 6.37 |
| Parameter | B | SE | β | β 95% CI |
|---|---|---|---|---|
| Intercept | -2.97 | .33 | .05 | |
| Mother’s age | -.09 | .04 | .91* | .84, .99 |
| Home language (non-English) | nf | nf | nf | nf |
| synaesthesia.status | .83 | .69 | 2.29 | .59, 8.93 |
| Parameter | B | SE | β | β 95% CI |
|---|---|---|---|---|
| Intercept | -1.81 | .21 | .16 | |
| Mother’s age | -.08 | .03 | .92** | .87, .97 |
| Home language (non-English) | -1.25 | .76 | .29 | .06,1.28 |
| synaesthesia.status | .87 | .49 | 2.38# | .90, 6.26 |
| Parameter | B | SE | β | β 95% CI |
|---|---|---|---|---|
| Intercept | -.96 | .16 | .38 | |
| Mother’s age | -.01 | .02 | .99 | .94, 1.03 |
| Home language (non-English) | .09 | .43 | 1.09 | .47, 2.54 |
| synaesthesia.status | .27 | .42 | 1.31 | .57, 2.98 |
| Parameter | B | SE | β | β 95% CI |
|---|---|---|---|---|
| Intercept | -1.49 | .18 | .23 | |
| Mother’s age | .00 | .03 | 1.00 | .95, 1.05 |
| Home language (non-English) | -0.10 | .49 | .91 | .35, 2.38 |
| synaesthesia.status | .61 | .44 | 1.85 | .78, 4.36 |
| Parameter | B | SE | β | β 95% CI |
|---|---|---|---|---|
| Intercept | -2.13 | .23 | .12 | |
| Mother’s age | -.06 | .03 | .94# | .88, 1.00 |
| Home language (non-English) | -1.57 | 1.04 | .21 | .03, 1.60 |
| synaesthesia.status | .77 | .55 | 2.15 | .73, 6.37 |
Table 4 shows the outcome of our model for overall Anxiety Disorder. This shows that synaesthetes were significantly more likely to have symptoms of clinical anxiety disorder (30.0% of synaesthetes with anxiety, in raw data), and were two and a half times more likely than non-synaesthetes (16.9% with anxiety).
Figure 2 shows the overall percentage of synaesthetes and controls falling within the pathological category of Anxiety Disorder. It also shows a , as well as the breakdown within each anxiety sub-domain. Although our participant numbers were relatively small, we further explored these five sub-domains in our SI. Our SI analysis of sub-domains is suggestive of a trend for elevated scores for synaesthetes within the sub-domain of Generalised Anxiety Disorder in particular (p=0.08), although the effect within this subdomain would not survive correction.
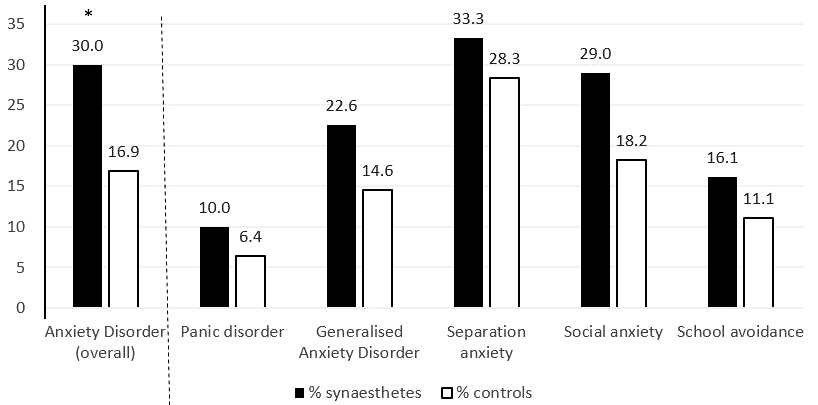 Figure 2
Percentage of children from the synaesthete and control groups falling into each anxiety category, according to suggestive pathological thresholds (76). Our significant main effect is shown on the left of the dotted line: synaesthetes were more likely than controls to experience symptoms suggestive of overall Anxiety Disorder (* p < .05). SI shows the group-wise comparisons within each anxiety sub-domain (to the right of the dotted line), where the sub-domain of Generalised Anxiety Disorder emerges as one possible locus of this effect at the level of an uncorrected trend.
In our study we examined the wellbeing of children with synaesthesia, aged 6-10 years old. We tested two types of synaesthetes, both of whom have unusual experiences when they read letters or numbers. Grapheme-colour synaesthetes experience unusual colours (e.g., A might be red, 7 might be green), and OLP synaesthetes experience unusual personifications (e.g., A might be an unpleasant man; for review see (2)). In our study we administered two tests of wellbeing to synaesthetes, non-synaesthete controls, and their parents.
We have two key findings. First we found a significant difference between synaesthetes (overall) and controls in their levels of anxiety, using the parent-reported SCARED (63). We also found an important difference in the way synaesthetes experienced moods. The child-completed dPANAS-C revealed that children with each type of synaesthesia (grapheme-colour and OLP synaesthesia separately) experienced significantly fewer positive emotions than their peers, but also significantly fewer negative emotions. This “emotional moderation” is of the type potentially captured by definitions of the affective component in alexithymia (the inability to experience, recognize or describe one's own emotions, e.g., (51, 52)), and we discuss these findings in greater detail below.
Our findings showed that children with synaesthesia were significantly more likely than their peers to show symptoms of anxiety, above the pathological threshold suggestive of Anxiety Disorder. This disorder can include symptoms of Panic Disorder (e.g., heart beating fast), Generalised Anxiety Disorder (e.g., worrying about the future), Separation Anxiety (e.g., fear when not with family), Social Anxiety (e.g., difficulty talking to new people) and School avoidance (e.g., worries or fears about going to school). Data from our test suggests that synaesthetes were significantly more anxious than controls at the broadest level (i.e., in Anxiety Disorder overall). They also scored numerically higher than controls in every sub-domain, especially Generalised Anxiety Disorder, although these sub-domain findings did not reach conventional significance and/or failed to survive correction. Future study would therefore be needed to better understand whether the significant pattern of overall Anxiety Disorder could be tied to any sub-domain(s) in particular.
Our finding of anxiety in child synaesthetes supports our earlier findings in adult synaesthetes (27). Adults with synaesthesia self-reported higher rates of diagnosed Anxiety Disorder compared to non-synaesthetes (but not other conditions). A second study by Carmichael and colleagues replicated this finding. This mirroring between adult and child synaesthetes fits with broader literature showing that three quarters of anxiety disorders originate in childhood (e.g., (83)). And we point out that these findings sit alongside other studies showing synaesthetes have traits co-morbid with anxiety: significant introversion (28), greater rates of autism (31), and elevated positive schizotypy (38, 84). Our findings are particularly important because Anxiety Disorder is among the most problematic mental health disorders in children (85). We suggest that recognising synaesthesia means recognising risk factors for anxiety, where early intervention is known to significantly improves life-outcomes (e.g., (86)). We therefore suggest that early diagnosis3 of synaesthesia might provide an opportunity to conduct risk assessments for anxiety on children diagnosed as synaesthetic (e.g. are they missing school? disengaged in class?). This can indicate whether specialist input for anxiety may be needed. This type of ‘synaesthesia pointer’ to anxiety might be particularly important in children, because they are less able to verbalise their anxiety (83). In summary, we propose that assessment of synaesthesia can be extrapolated to the assessment of its co-morbidities, and the negative consequences these can engender.
We also found that children with synaesthesia experienced an unusual mood profile compared to controls. In the week prior to testing, synaesthetes experienced fewer positive moods and fewer negative moods than controls. This unusual difference in the profile of mood was found in children with either grapheme-colour synaesthesia or OLP synaesthesia, suggesting it is symptomatic of a more general synaesthestic phenotype. This pattern was especially apparent when participants were categorised by their dPANAS-c scores according to the four affective profiles of Norlander and colleagues (69). These profiles capture the four possible pairings of high/low scores in the positive/negative affect, and synaesthetes were significantly more likely to fall in the ‘low affective’ group (i.e., have low positive and low negative affect) compared to controls.
We noted above that these difficulties in emotional regulation might fit the definition of alexithymia (for reviews see (53, 87)). Alexithymia has a number of facets including a reduced capacity to (i) experience emotions; (ii) identify emotions; (iii) verbalise emotions (iv) think about one’s emotions (i.e., being externally oriented), and (v) a reduction in fantasizing. Our findings may potentially be relate to one (or more) of the first four features. Since alexithymia was named almost 50 years ago (88), the condition has come to be recognised as a possible vulnerability factor for a range of physical and mental health disorders (53) including depression (89), anxiety (90), and even coronary heart disease (91). The link between alexithymia and anxiety may be of particular importance, given our second finding suggestive of elevated Anxiety Disorder in children with synaesthesia. It is also possible that any putative link between synaesthesia and alexithymia could stem from co-morbidities with a third condition, autism. Rates of synaesthesia are elevated in autism (31, 32), while as many of 50% of people with autism have alexithymia (59). Another important consideration may be the neurobiological underpinnings of all three conditions. For OLP synaesthsia, at least, neurological differences have been localised to the corpus callosum (8), a prominent structure in both autism (92) and alexythemia (93). For example, there was significant under-connectivity in white matter within the corpus callosum in a sample of adult OLP synaesthetes (8), suggesting that this region may be implicated in all three conditions discussed here.
When discussing alexithymia we should be cautious. Our findings are suggestive of a mood disorder, but we did not use a dedicated alexithymia measure. Although alexithymia scales exist for children (e.g., (94)), they have not been adapted for self-report in children of our age group (6+ years), but only for children far older (typically 12 years or above (e.g., (97); or more rarely, with a mean age of 10 years (94, 98); for a review see (99)). We therefore used a mood measure, suitable for the age of our cohort, in the large numbers we tested. But there is also second reason for caution when discussing alexithymia. Although the pattern of results here – muted positive and negative mood – fits clearly definitions of alexithymia (reduced capacity to experience/identify emotions), some studies show marked negative affect in alexithymics (95) with less influence on positive affect (96). In other words, the “definitional criterion” of muted affect (as found here) may not always marry with the pattern observed when alexithymics are categorised via mood questionnaires. It will therefore be important to explore issues of alexithymia more directly using other measures. Future studies might present alexithymia questionnaires to older synaesthetes, or use behavioural tests (e.g., absence of priming from emotionally laden stimuli such as angry faces; (100); for review see (53)). Only further studies using specific alexithymia tools could elucidate this potential link further.
In summary, we have shown two different ways in which synaesthesia can impact on the wellbeing of child synaesthetes. We also point out that synaesthesia can also impair wellbeing more directly, if sensations themselves are unpleasant. One case-study we have encountered is a child OLP synaesthete who has a pathological phobia of the number 3, because her numbers have personalities, and the number 3 is a bully. In another case-study (female age 10) a child synaesthete has colours not only from letters and numbers but also from voices, and has become mute to avoid the unpleasant colour of her own voice. Recognising these as synaesthesia-related anxieties is the first step in understanding how to provide appropriate remediation. Overall, however, our research joins a body of literature showing that synaesthetes experience a somewhat complex profile, with both benefits and difficulties. These include faster processing speed (101) and superior literacy skills (30) but also sensory sensitivities (at least in adults; (43) and now, heightened anxiety in both adults (27) and children (as shown here) along with differences in mood regulation. Recognising and diagnosing synaesthesia is the first step to understanding these emotional differences, and perhaps an important way to flag the potential for childhood mental health issues which might otherwise go unnoticed. However, whilst our findings mirror those in adult samples (27), both child and adult studies have been limited to only two variants of synaesthesia. It would therefore be prudent to take the findings here as a first step to exploring synaesthesia more widely. In sum, our paper represents the very first evidence that synaesthesia can impact negatively on children’s well-being and shows that there are likely to be important co-morbidities with synaesthesia that may require closer inspection by child health care practitioners.
Authors received funding from the European Research Council under the European Union's Seventh Framework Programme (FP/2007-2013) / ERC Grant Agreement no. (617678). We are grateful to Juliet Wilkes, Olivia Casey-Haworth, Monica Boutros, and Mira Kaut for their help with data collection and input.
1That study also examined a group of mirror-touch synaesthetes, who have higher than average empathy (Banissy & Ward, 2007) and experience vicarious touch/pain when observing this in others. This unusual group of synaesthetes – quite different to the synaesthetes tested here -- were consequently found to have lower than average alexithymia compared to controls (i.e., they were more emotionally conscious than the average person, perhaps linked to their higher empathy).
2For the purposes of another study where we examined synaesthesia and cognition, these controls had been recruited as two sub-groups. Average-memory controls (N = 640, 331 girls, 309 boys, mean age = 8.40 SD =1.17) were non-synaesthetes who performed within the average range in their consistency test of Session 1. In contrast, high-memory controls (N = 326, 173 girls, 153 boys, mean age = 8.35 SD = 1.21) had performed well within Session 1; i.e., they had been as consistent as synaesthetes but did not continue to score well in Session 2 or across sessions. These children therefore showed evidence of having a superior memory span for paired associations (e.g., colours for letters) while not being synaesthetes, so could serve as a useful control of high achievers in cognitive comparisons. For our purposes here, however, we combine both sets of controls into a single sub-group. We point out that this makes our test more conservative because we are comparing synaesthetes (high achievers) to controls (a mix of high and average achievers) which could make controls a priori lower in well-being, while our results in fact show the reverse (lower well-being in synaesthetes).
3The term ‘diagnostic’ in this context does not imply a clinical illness but the identification of a condition or trait. We use the term here given the well-established diagnostic criteria for identifying synaesthesia (see Methods).”
OLP
Ordinal Linguistic Personification
standard deviation