


1 Neuroscience, UConn Health, School of Medicine, Institute for Systems Genomics, Farmington, CT 06030, USA
2 Center for Laser Microscopy, Institute of Physiology and Biochemistry “Jean Giaja”, Faculty of Biology, University of Belgrade, 11000 Belgrade, Serbia
3 Department of Physiology, Institute of Health Sciences, Yeditepe University, 34755 Istanbul, Turkey
4 Departments of Neurobiology, Bioengineering, and Chemical and Systems Biology, Stanford University, Stanford, CA 94305, USA
Abstract
Background: Population voltage imaging is used for studying brain
physiology and brain circuits. Using a genetically encoded voltage indicator
(GEVI), “VSFP” or “ASAP2s”, or a voltage-sensitive dye, Di-4-Anepps, we
conducted population voltage imaging in brain slices. The resulting optical
signals, optical local field potentials (LFPs), were used to evaluate the
performances of the 3 voltage indicators. Methods: In brain slices
prepared from VSFP-transgenic or ASAP2s-transgenic mice, we performed multi-site
optical imaging of evoked cortical depolarizations - compound excitatory
postsynaptic potentials (cEPSPs). Optical signal amplitudes (
Keywords
- autofluorescence
- cerebral cortex
- excitatory postsynaptic potentials
- temporal summation
- paired pulse facilitation
- photobleaching
Functioning neurons generate electrical fields, which are best studied by electrodes [1]. However, voltage imaging can also be used to monitor neuronal electrical fields [2, 3], especially when large areas are under investigation [4, 5, 6, 7, 8], or when the voltage imaging is done through an intact animal skull [9].
Genetically encoded voltage indicators (GEVI) have emerged as a valuable tool in experimental neuroscience [10, 11, 12, 13]. The performance of newly developed GEVIs vary between laboratories, preparations, and applications [14, 15]. Previously, we developed the GEVI, ASAP1 with a four-helix voltage-sensing domain. We mutated the positively charged residues in the fourth helix (S4) responsible for sensing the transmembrane electrical field. The resulting GEVI variant, ASAP2s, contained the R415Q mutation, which neutralizes one of the sensing charges in S4. ASAP2s showed an improved voltage responsiveness, slower off-rate than ASAP1, and compatibility with two-photon imaging applications [16]. In the current study, we explore the properties of ASAP2s for population voltage imaging.
Wide-field population voltage imaging methods lack cellular resolution. Mixed synaptic and action potentials arising from hundreds of dendrites and axons arrive onto the same optical detector. Such optical signal represents the “mean” response of many neurons. In population imaging experiments, the activity of many elements, such as desynchronized activations of hundreds of neurons, is mixed into one representative signal, a signal that represents a given population of cells projected onto the optical detector [17, 18, 19, 20, 21, 22].
Using side-by-side measurements, including the same light source, optical path, detector, and stimulation paradigm, we compared three voltage indicators: two GEVIs (ASAP2s and VSFP) and one voltage-sensitive dye (Di-4-Anepps) [23, 24]. Both GEVIs were congenitally expressed in cortical pyramidal neurons in transgenic mice, thus eliminating variables commonly associated with the quality of the adeno-associated virus (AAV) vectors or quality of intracranial injections.
Brain slices were harvested from transgenic mice (age 25–90 days, both sexes) according to the institutionally approved animal protocol. All mice were housed in standard conditions with free access to food and water, in a 50% dark/light cycle. VSFP. The transgenic mouse line CaMK2A-tTA; tetO-chiVSFP was donated by Thomas Knopfel (Hong Kong Baptist University, Hong Kong, China). The chi-VSFP mice expressed chimeric voltage sensitive fluorescent protein (chi-VSFP) in all cortical pyramidal neurons [25]. ASAP. Generation of the Ai169-ASAP2s mouse line (Jax Lab #:031569, Bar Harbor, ME, USA) harboring TIT2L-ASAP2-ICL-tTA2, a Cre-dependent ASAP2s gene at the TIGRE2.0 locus, has been previously described [26]. Initially, transgenic ES cells of a 129S6/SvEvTac x C57BL/6 F1 background were used to generate chimeric mice, which were bred to PhiC31-expressing C57BL/6 transgenic mice (Jax Lab) to establish germline founders while removing a AttB/AttP-flanked PGK-hygro-SV40polyA cassette in the transgene. These F1 founders were outcrossed to C56BL/6 three times, and F4 mice with TIT2L-ASAP2-ICL-tTA2 but lacking the PhiC31 gene were crossed to generate TIT2L-ASAP2-ICL-tTA2 homozygotes. These TIT2L-ASAP2-ICL-tTA2 homozygotes were then crossed with a Thy1-Cre mouse line (Jax Lab #006143) to generate mice expressing ASAP2s in all pyramidal cells, in all cortical layers. TIT2L-ASAP2-ICL-tTA2 homozygotes were also crossed to Cux2-CreERT2 mice in a C57BL/6 background (MMRC 032779, MMRRC at Univ. of California, Davis, CA, USA). Resulting double-hemizygous progeny were mated to each other and multiple double-homozygous Cux2-CreERT2 TIT2L-ASAP2-ICL-tTA2 were identified. These in turn were mated to each other to create a stable line in which tamoxifen induces ASAP2s expression in layer 2/3 cortical pyramidal neurons selectively. Two weeks prior to sacrifice and brain tissue collection, mice were fed a tamoxifen diet (TAM Diet (500, 2016), Teklad, ENVIGO, https://insights.inotivco.com/) for 2–7 consecutive days, ad libitum.
Following extraction, brains were fixed in 4% paraformaldehyde (PFA) for 24 h. After dehydration in rising sucrose concentrations (10, 20, and 30%) in 0.2 M phosphate buffer (PB), tissue was sliced using a cryostat and stored at –20 °C. Coronal brain sections (50 µm) were dehydrated in 0.01 M phosphate buffer saline (PBS) for 10 min and incubated in a blocking solution containing 10% bovine serum albumin (BSA) and 0.01% Triton-X 100 in 0.01 M PBS for 1 hour. Next, slices were incubated with a primary mouse anti- glial fibrillary acidic protein (GFAP) antibody (1:100, Aves Labs, Inc, Davis, CA, USA) or primary mouse anti-NeuN antibody (1:100, Merck Milllipore, Burlington, MA, USA) in 0.01 M PBS overnight at 4 °C. Slices were washed in PBS 3 times for 10 min and incubated with secondary goat anti-mouse AlexaFluor 555 antibody (1:200, Invitrogen, Waltham, MA, USA) for 2 hours. After washing in 0.01 M PBS 3 times for 10 min, slices were stained with nuclear counterstain Hoechst 3342 (1 µg/mL) for 10 min, washed 4 times for 5 min in 0.01 M PBS and mounted using MOWIOL medium. Images of immunolabeled coronal brain slices were acquired using Keyence: BZ-X800 microscope (2x, 10x, and 20x lens; Itasca, IL, USA), DAPI (OP-87762), GFP (OP-87763), and TexasRed (OP-87765) filter set.
Following a deep anesthesia with isoflurane, mice of both sexes (ages P21–P56)
were decapitated. Brains were extracted with the head immersed in ice-cold saline
(artificial cerebrospinal fluid [ACSF] containing in mM: 125 NaCl, 26
NaHCO
Optical traces were conditioned and analyzed in Neuroplex (RedShirtImaging).
Bleach correction was performed by subtracting an exponential fit from the
optical trace. Temporal averaging (n = 4 sweeps), spatial averaging (21 or 37
pixels), low-pass Gaussian filter with 100 Hz cutoff, and high-pass Tau filter
(10) were also conducted. For measurements of optical noise (root mean square,
RMS) and signal-to-noise ratio (SNR), the low-pass filter was not used. Optical
signal amplitude was measured as fractional change in light intensity
(
Three strains of transgenic mice were used to prepare acute brain slices for electrophysiology optical imaging experiments. Wild type mice were used for experiments with autofluorescence optical signals and voltage-sensitive dye, Di-4-Anepps. Each brain slice (experimental groups varied in size from 31 to 104 brain slices) was stimulated in an identical manner and simultaneous multisite optical recordings were performed using the same experimental setup (light source, optical filters, dichroic mirror, objective lens, and camera). We present a comprehensive analysis of voltage indicator performances, and we point to both advantages (optical sensitivity, speed of response, afterhyperpolarization, spatial spread of voltage transiens) and disadvantages (signal decay time, photobleaching, autofluorescence optical signal bleed-through) attributed to each indicator.
Crossing of the Thy1-Cre and ASAP2s_LoxP mouse lines achieved strong labeling
of all cortical layers, with the exception of the L4 lamina. That is, in the
ASAP2s channel (green), we found a darker horizontal band coinciding with
cortical layer 4 (Fig. 1). This darker band was not caused by a lower density of
cells, as both the nuclear stain, Hoechst (Fig. 1A
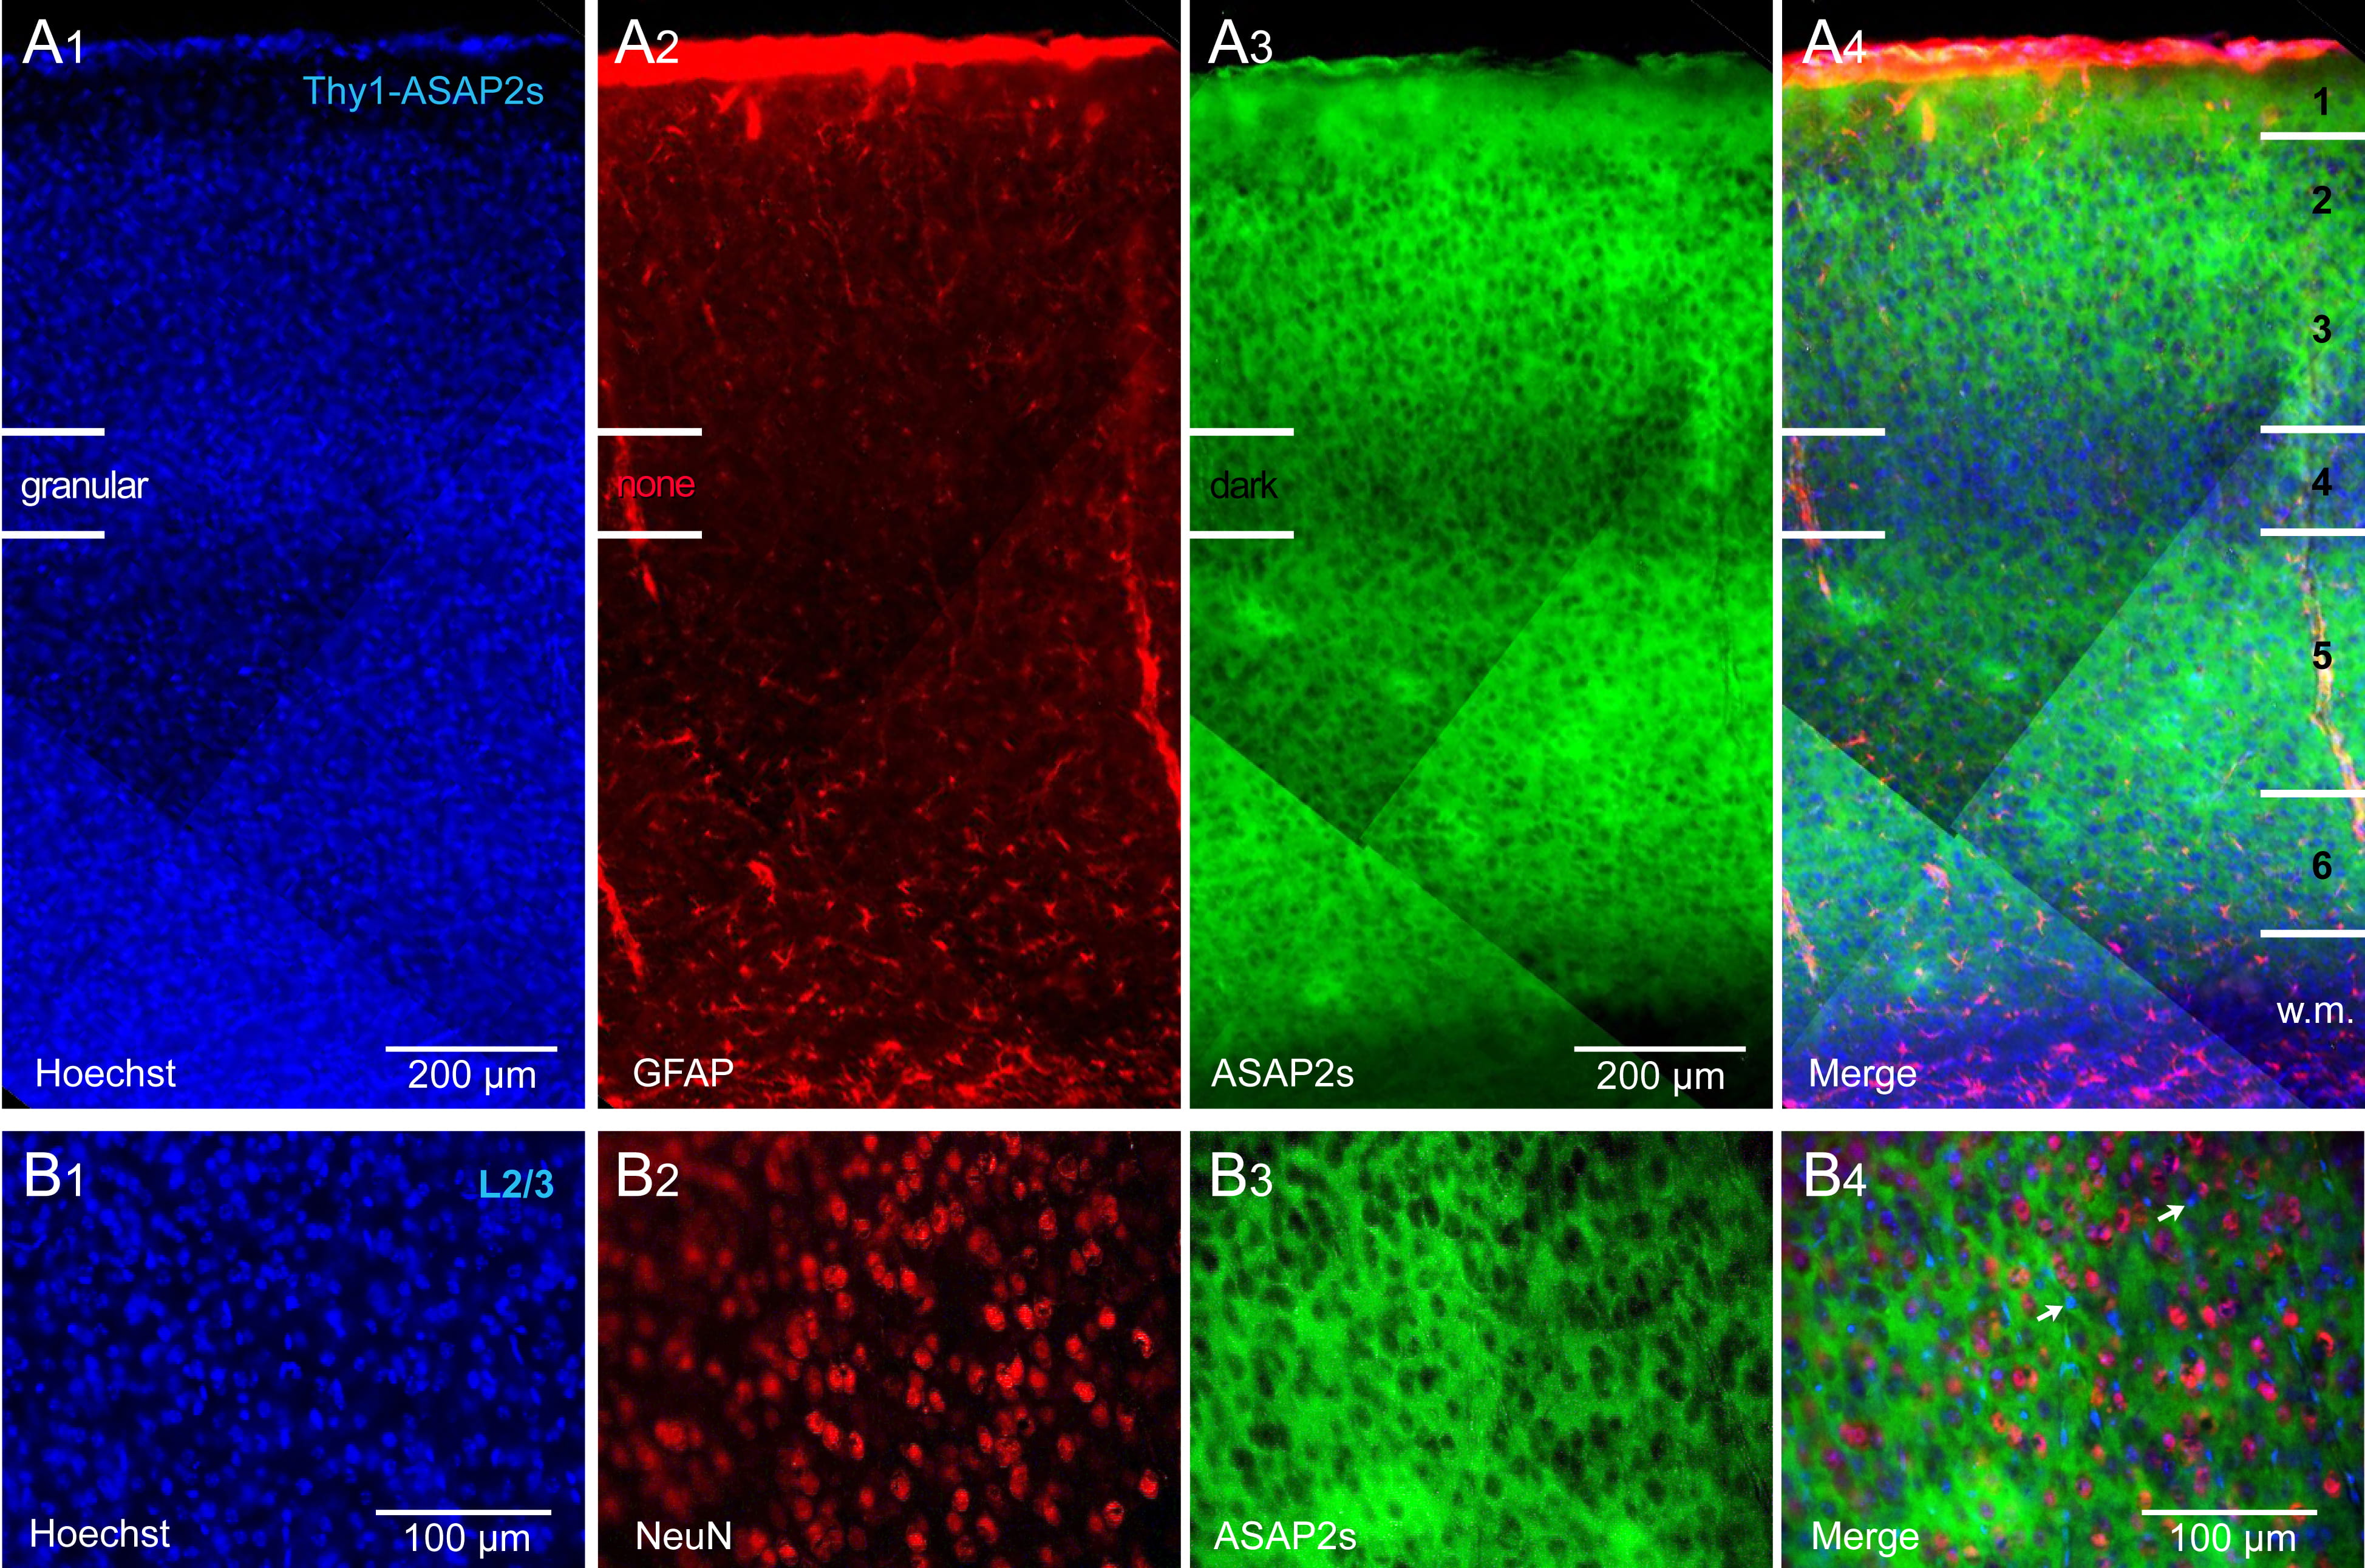 Fig. 1.
Thy1-ASAP2s mice. ASAP2s is expressed in all pyramidal cells of
all cortical layers. (A
In tamoxifen-fed Cux2-CreER-ASAP2s mice, ASAP2s expression was restricted to L2/3
pyramidal cells (Fig. 2A). The ASAP2s-labeled axons of L2/3 pyramidal neurons
could be traced in corpus callosum (CC), superior portions of neostriatum (Fig. 2A
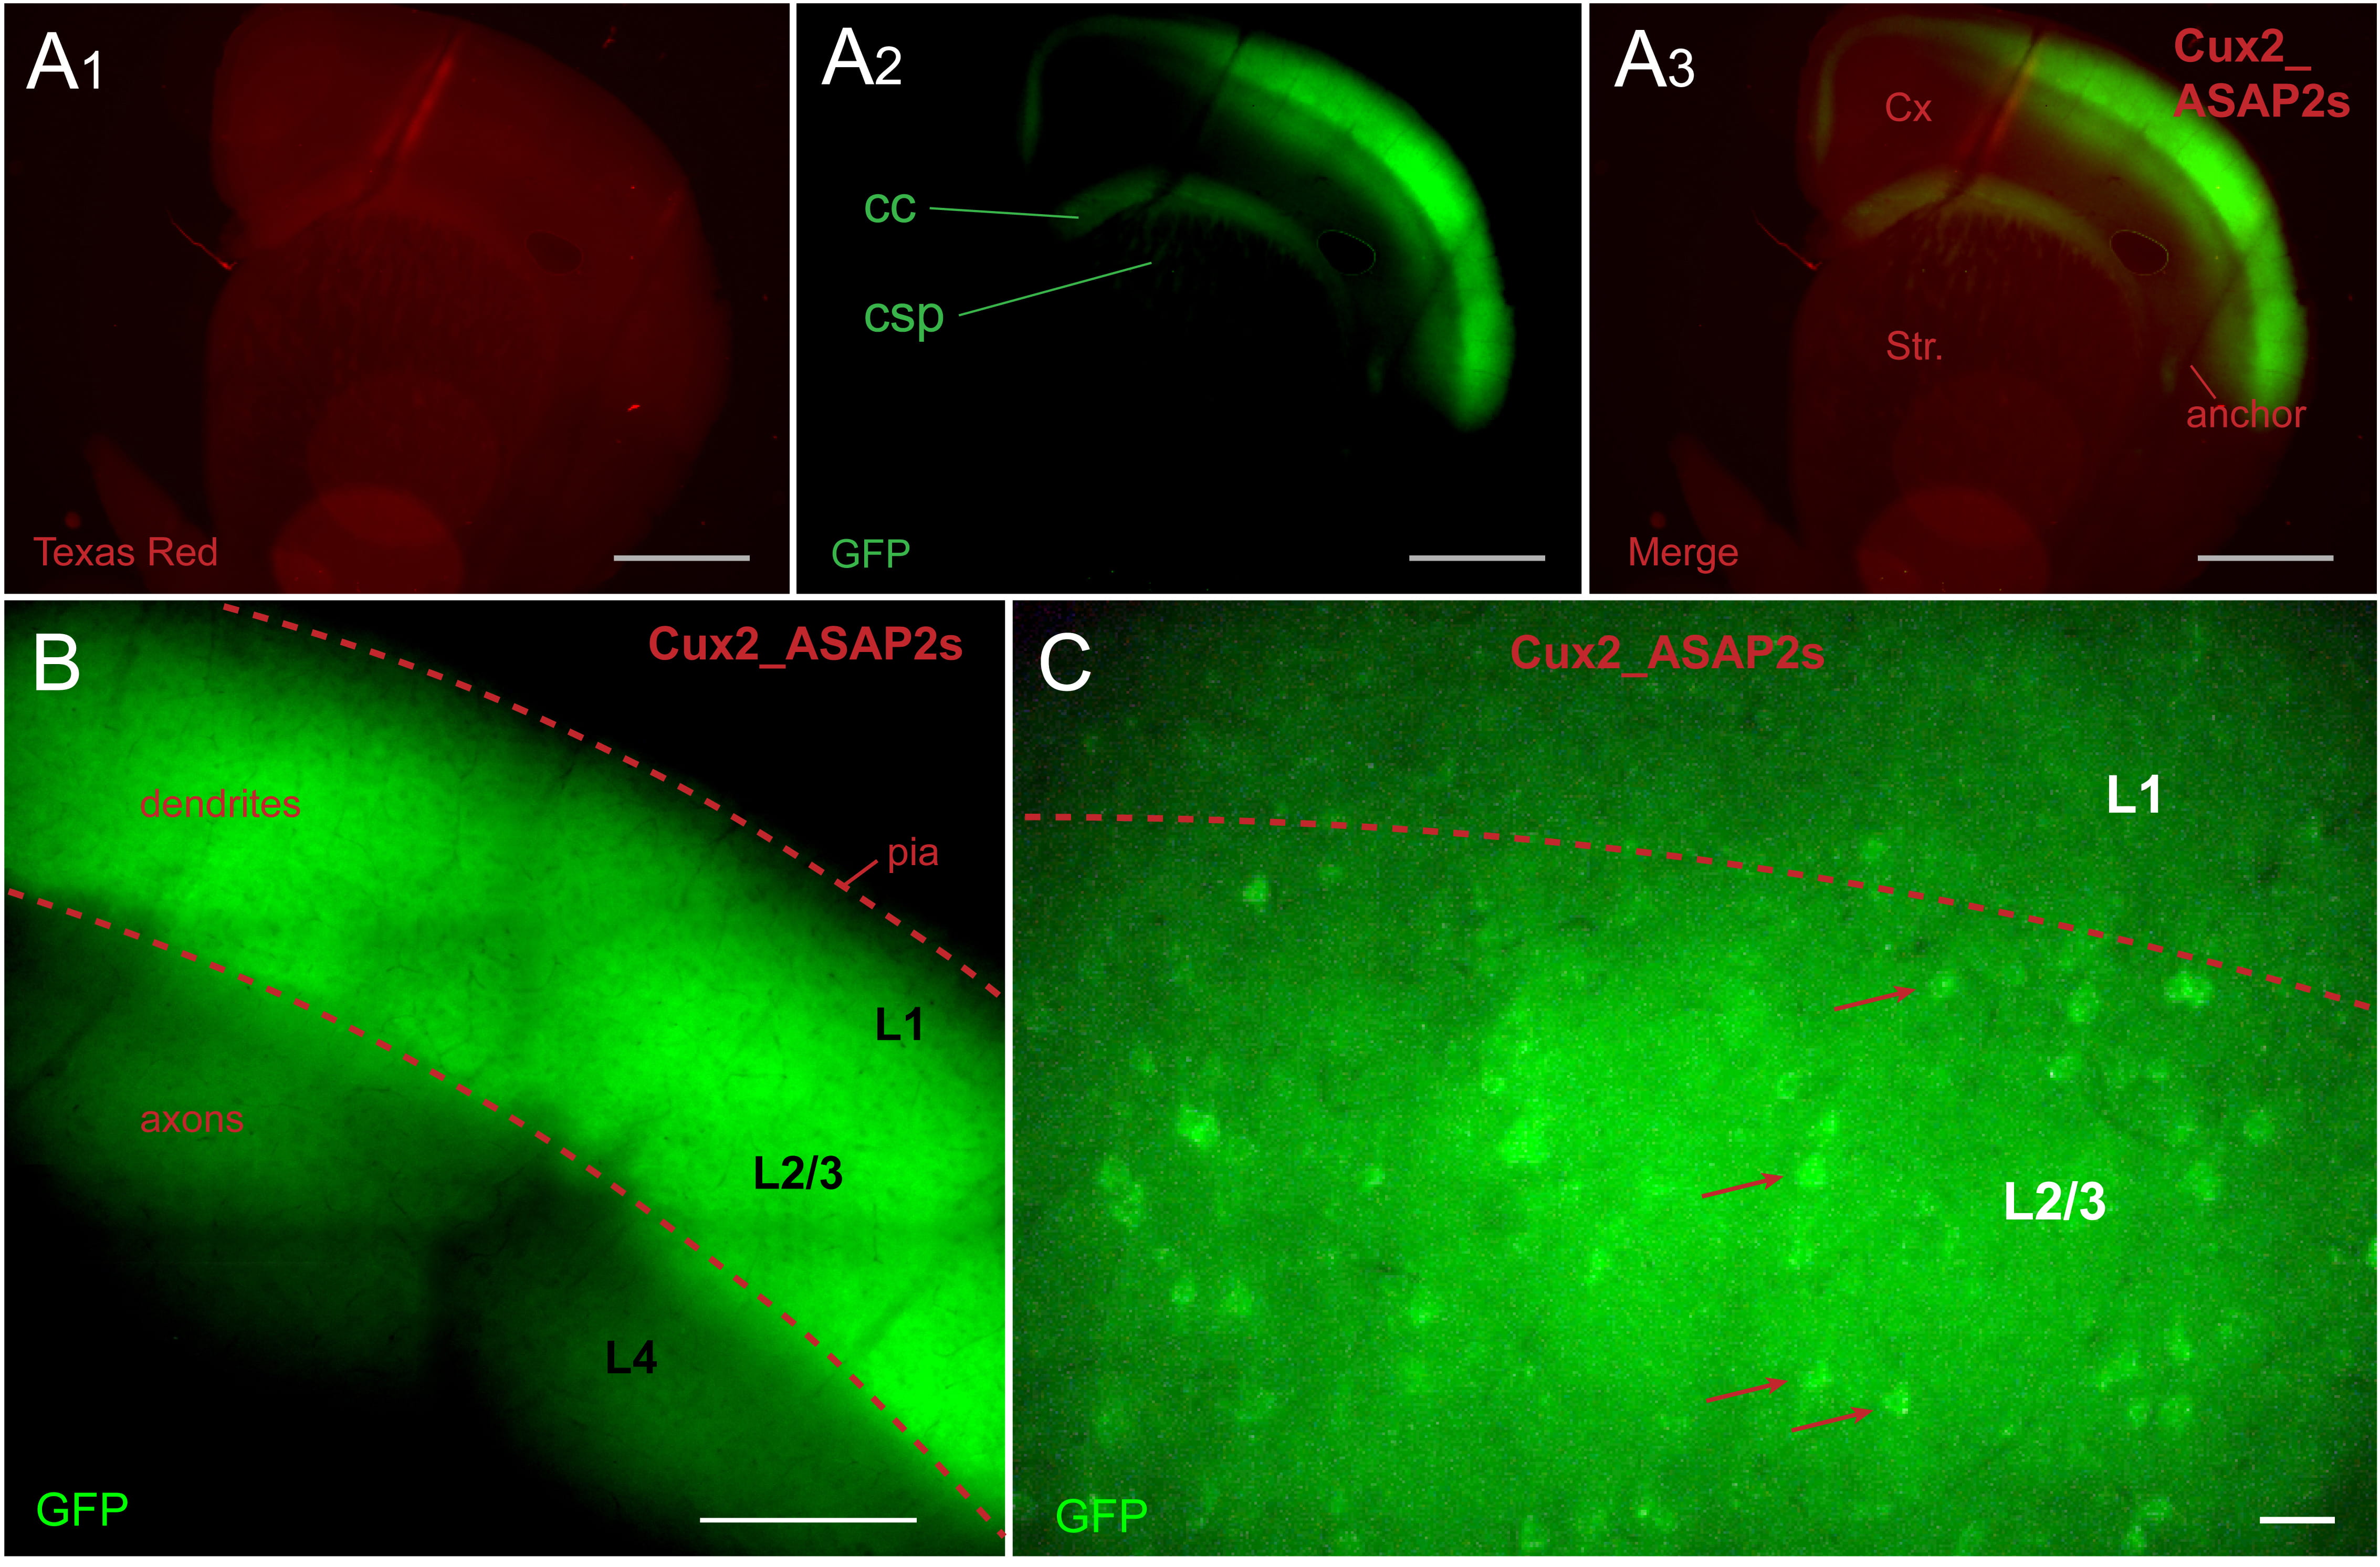 Fig. 2.
Cux2_ASAP2s animal. ASAP2s is expressed in layer 2/3 pyramidal
cells. (A
In brain slices collected from wild type mice, we performed optical recording
sessions in the absence of GEVIs or dyes (Fig. 3A
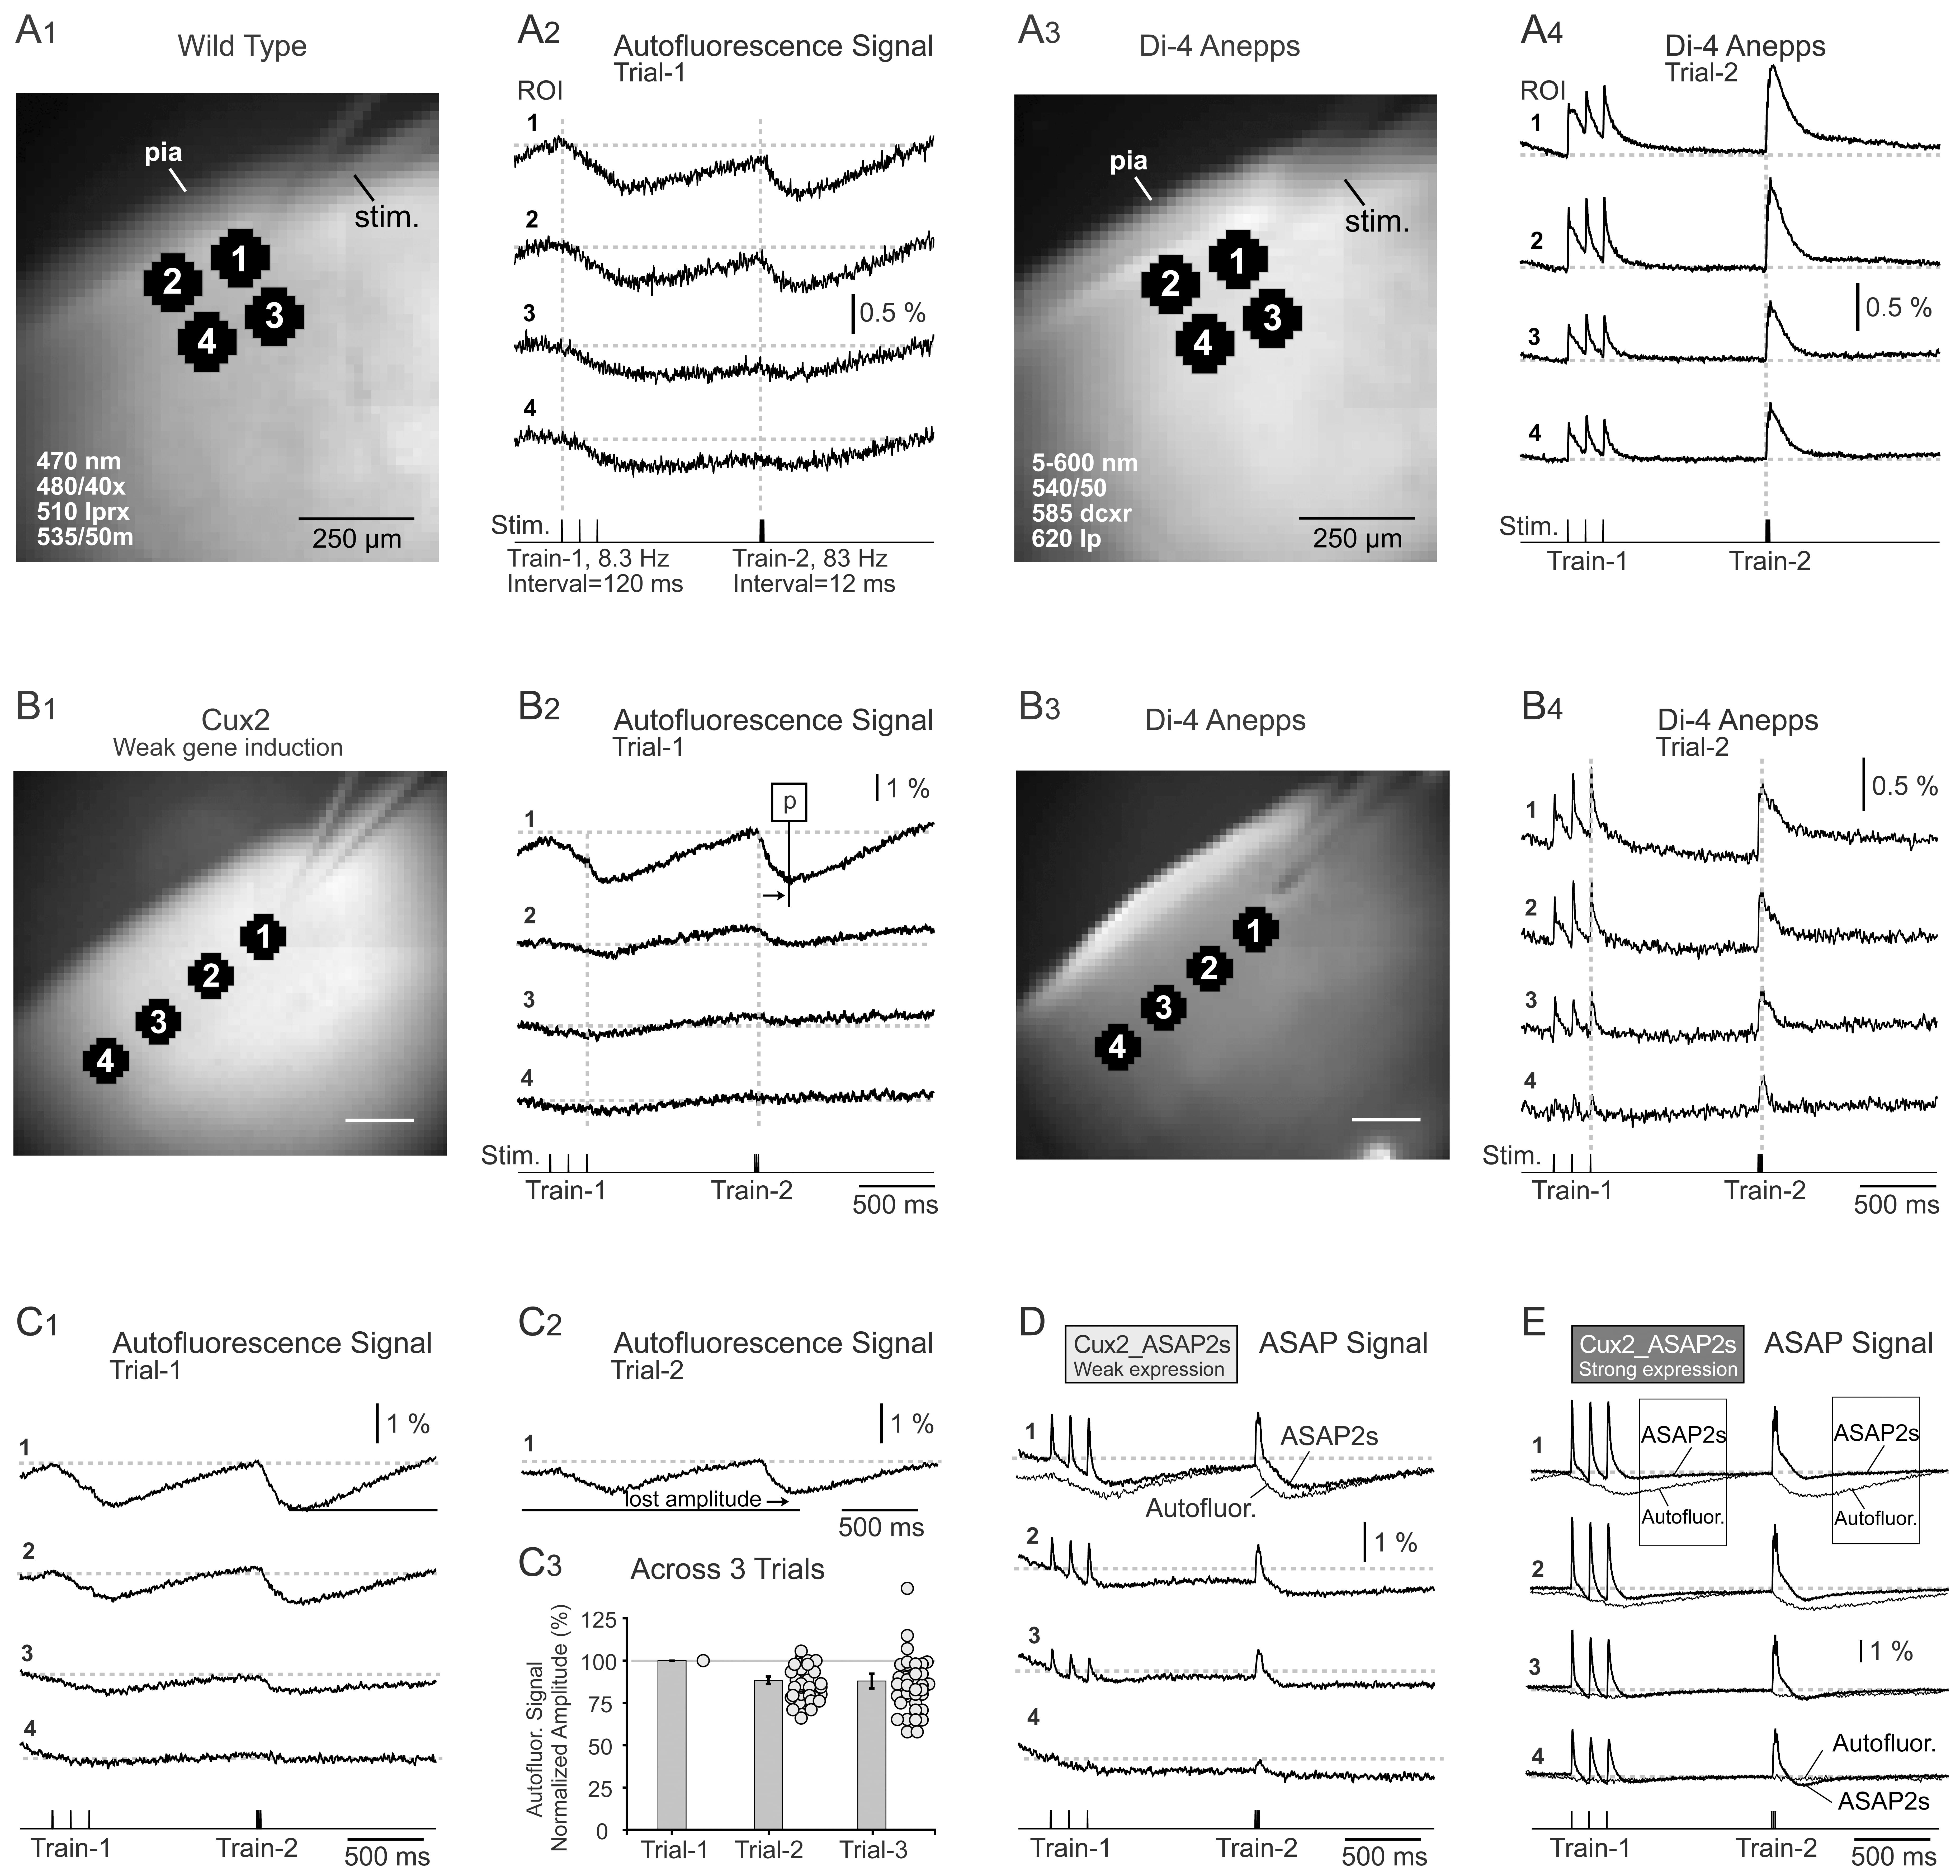 Fig. 3.
Optical signals of various origins evoked by identical stimuli.
(A
Two types of optical signals, autofluorescence and voltage sensitive dye (VSD),
exhibited different temporal dynamics. In Fig. 3B, we marked the end of the
synaptic stimulation train by a gray dashed vertical line. While the VSD signal
begins to decay immediately at the end of the synaptic stimulation train (Fig. 3B
The amplitudes of the autofluorescence optical signals tended to decrease with
repetitive measurements, from Trial-1 to Trial-2, for example
(compare Fig. 3C
Both the autofluorescence and ASAP2s signals were recorded in the same optical
channel (green fluorescent protein, GFP, excitation 480/40 nm), meaning there was a possibility of
autofluorescence optical signals interfering (mixing) with the ASAP2s signals. By
reducing the number of days that the Cux2-ASAP2s animals were fed the tamoxifen (TAM) diet,
from 7 to 2–3 days, we were able to achieve weak expression of GEVI. In weakly
expressing ASAP2s mice, we observed slow negative undulations superimposed onto
fast voltage signals (n = 4 brain slices, Fig. 3D, black traces). To illustrate
this point, we have included the autofluorescence optical signal from Fig. 3C
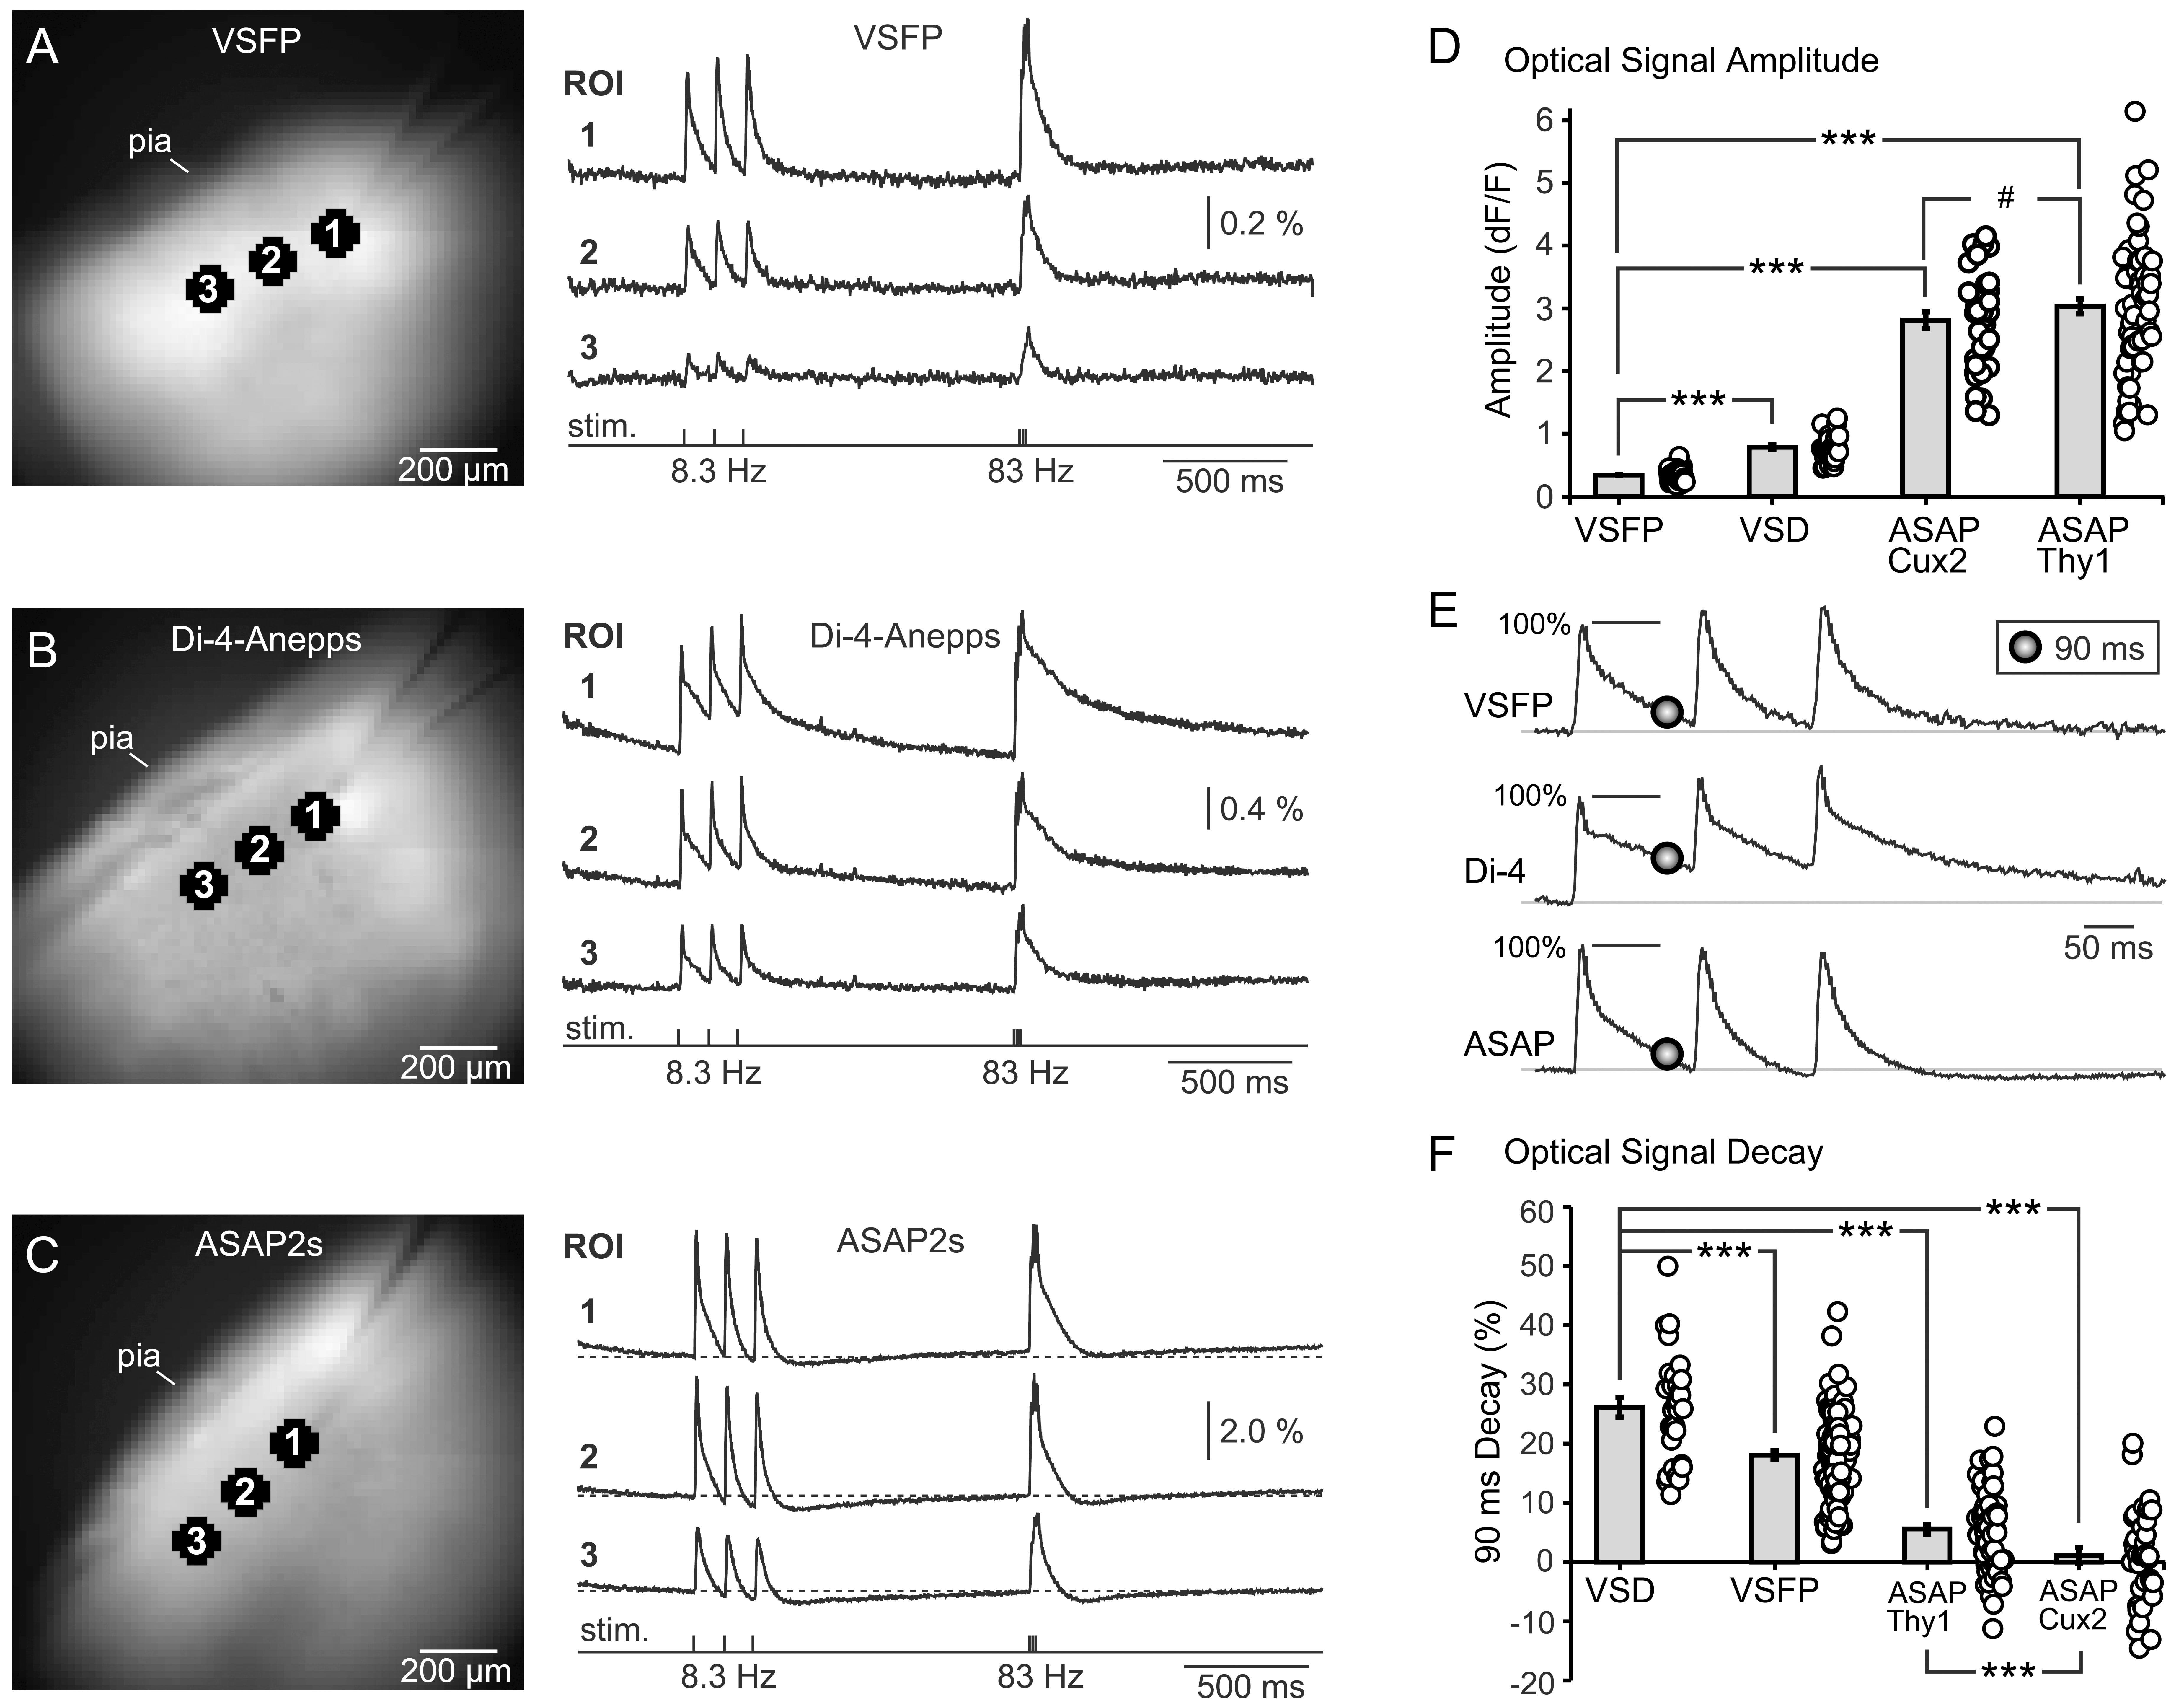
Using an identical experimental paradigm (8.3 Hz and 83 Hz stimulation) and the
same recording setup (same light source, objective lens, and camera), we compared
the performances of 3 voltage indicators, two GEVIs (VSFP and ASAP2s), and one
VSD (Di-4-Anepps). Three synaptic transients separated by 120 ms (8.3 Hz) were
clearly delineated by VSFP (Fig. 4A, 8.3 Hz), Di-4-Anepps (Fig. 4B, 8.3 Hz), and
ASAP2s (Fig. 4C, 8.3 Hz). Three synaptic transients separated by 12 ms (83 Hz)
were not delineated as the membrane voltage did not have enough time to
repolarize between stimuli. Instead, the 83 Hz synaptic triplet appeared as a one
complex voltage transient (summation) in recordings made by VSFP (Fig. 4A, 83
Hz), Di-4-Anepps (Fig. 4B, 83 Hz), or ASAP2s (Fig. 4C, 83 Hz). We used the peak
of the 83 Hz event to quantify optical signal amplitudes
 Fig. 4.
Three voltage indicators.
(A) Transgenic mice expressing VSFP in cortical pyramidal neurons. Surface of
brain slice with stimulating electrode in L2/3. Stimulation was the same as in
Fig. 3. Voltage indicator is VSFP. (B) Same as in A, except the subject was a
wild-type mouse (Black 6) and the voltage indicator is voltage-sensitive dye,
Di-4-Anepps. (C) Same as in A, except mouse was transgenic, expressing voltage
indicator ASAP2s in pyramidal neurons (Thy1). (D) Signal amplitude at the
stimulation site ROI 1. Four experimental groups based on the voltage indicator
used. Each dot represents one measurement in one brain slice. VSFP n = 104, VSD n
= 31, ASAP-Cux2 n = 37, ASAP-Thy1 n = 71. The ASAP2s signal amplitude was not
affected by the type of transgenic mouse, Thy1-Cre or Cux2-CreER (no significant
difference). (E) The signal decay dynamics was quantified at 90 ms after the
stimulus pulse; and expressed as a percentage of the first peak amplitude. (F)
Quantifications of the signal decay rate (explained in E) are plotted here as
raster and bar graphs, where “bar” indicates mean
We selected the best traces from VSFP (n = 18), ASAP2s (n = 15), and Di-4-Anepps
recordings (n = 14) and calculated optical noise (RMS) in 40
sampling points (40.8 ms duration), 10 ms prior to the onset of the stimulus. The
average RMS in VSFP, ASAP2s, and Di-4-Anepps traces were remarkably similar:
0.0430
Interestingly, the decay phases of the cEPSP showed different temporal dynamics
between the 3 voltage indicators. We estimated the “rate of decay” by
measuring the fraction of the optical signal (peak = 100%) remaining 90 ms after
the onset of the extracellular stimulus (Fig. 4E, gray ball). We found that VSD
optical signals showed the slowest decay. In the VSD recording mode, at 90 ms
post stimulus, the optical signal repolarized down to only 26.16
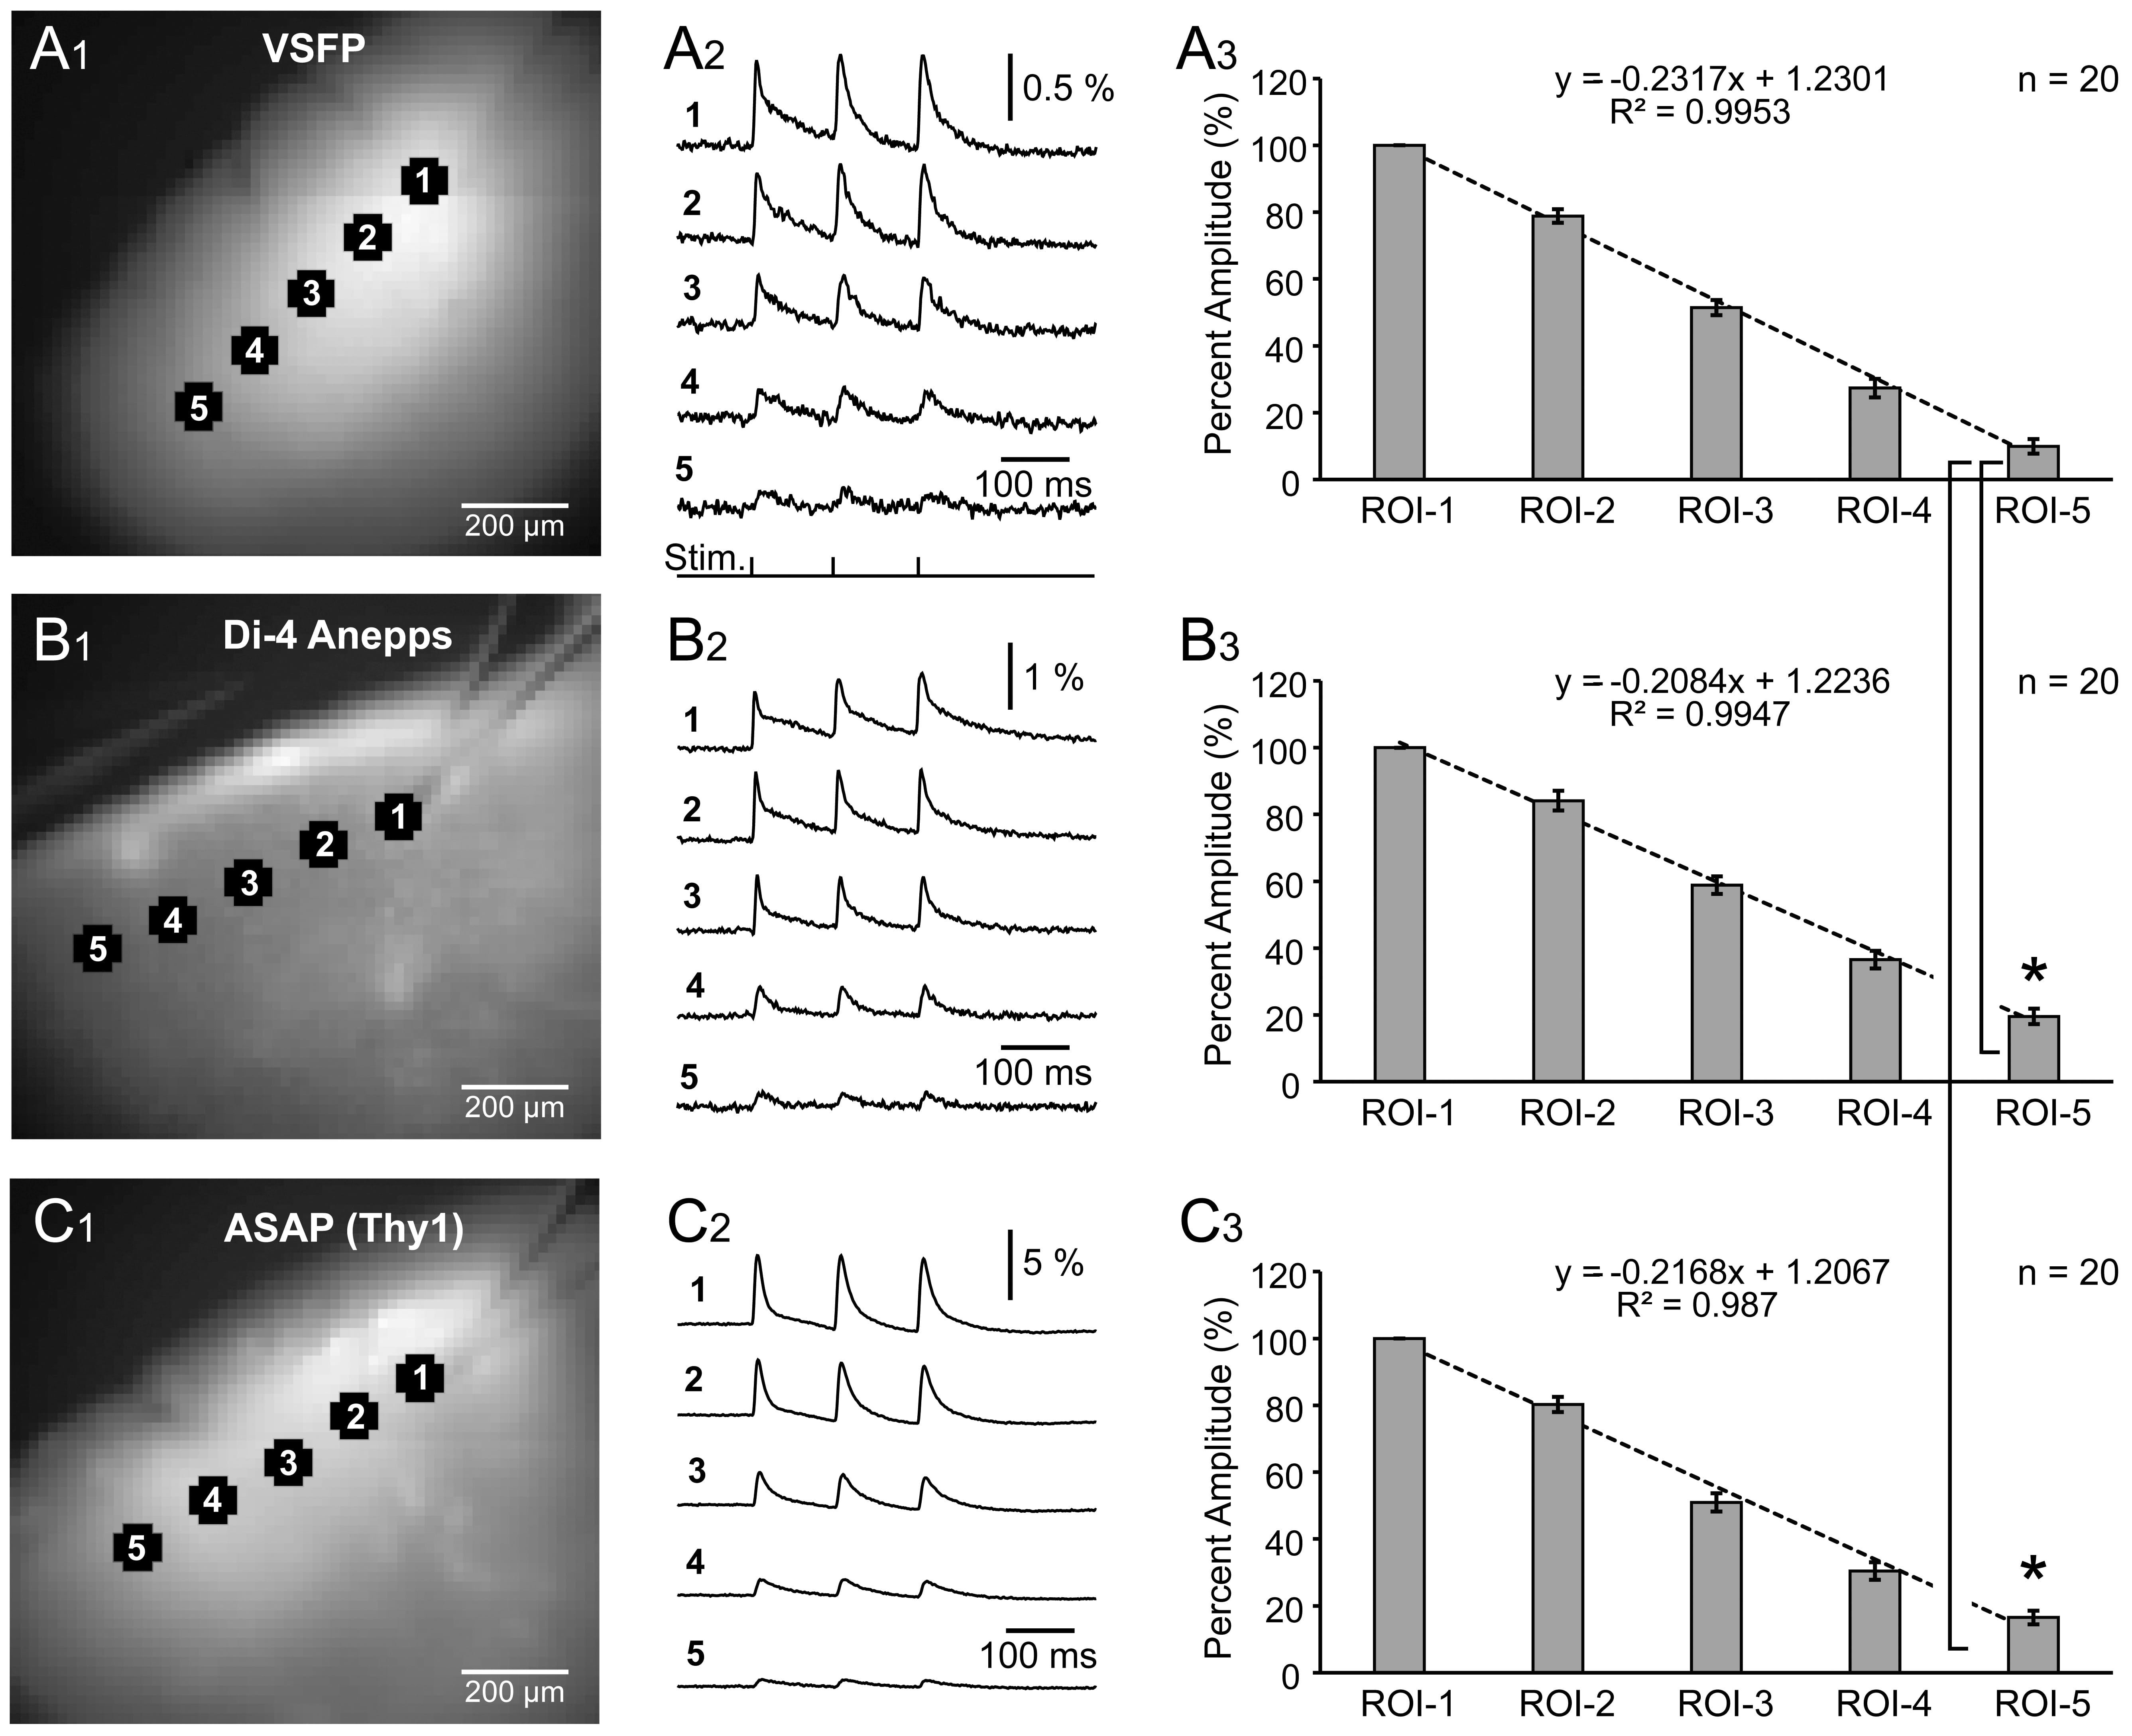
Using the same experimental paradigm (8.3 Hz) and recording setup, we evaluated
the spread of synaptically-evoked depolarization along the L2/3 cortical lamina,
in VSFP, Di-4-Anepps, and ASAP2s experiments. A glass stimulation electrode was
positioned in L2/3, and evoked optical signals were recorded simultaneously in 5
regions of interest, including the stimulation site (Fig. 5A
 Fig. 5.
Spatial spread of synaptically evoked voltage transients
assessed by three voltage indicators. (A
Using the same experimental paradigm (8.3 Hz) and recording setup, we evaluated the temporal summation of synaptically-evoked depolarization in VSFP and ASAP2s experiments. A glass stimulation electrode was positioned in L2/3 and synaptically evoked optical signals were recorded at the stimulation site. We show 5 brain slices from the VSFP experimental groups (Fig. 6A) and 5 brain slices from the ASAP2s group (Fig. 6B). Interestingly, in the VSFP experimental series, the 3rd synaptic event often exhibited a higher amplitude than the 1st synaptic event (Fig. 6A, dashed horizontal line), reminiscent of temporal summation of synaptic potentials (paired pulse facilitation). On the contrary, in the ASAP2s experiments, the 3rd synaptic event often showed a smaller amplitude than the 1st synaptic event in the same optical trace (Fig. 6B, dashed horizontal line), reminiscent of synaptic depression or synaptic fatigue. Note that both VSFP and ASAP2s signals were recorded in the same optical channel in which we detect autofluorescence optical signals (GFP, excitation = 470 nm, emission = 510 nm). However, VSFP signals show facilitation (Fig. 6A) while the ASAP2s signals show depression, on the same experimental paradigm.
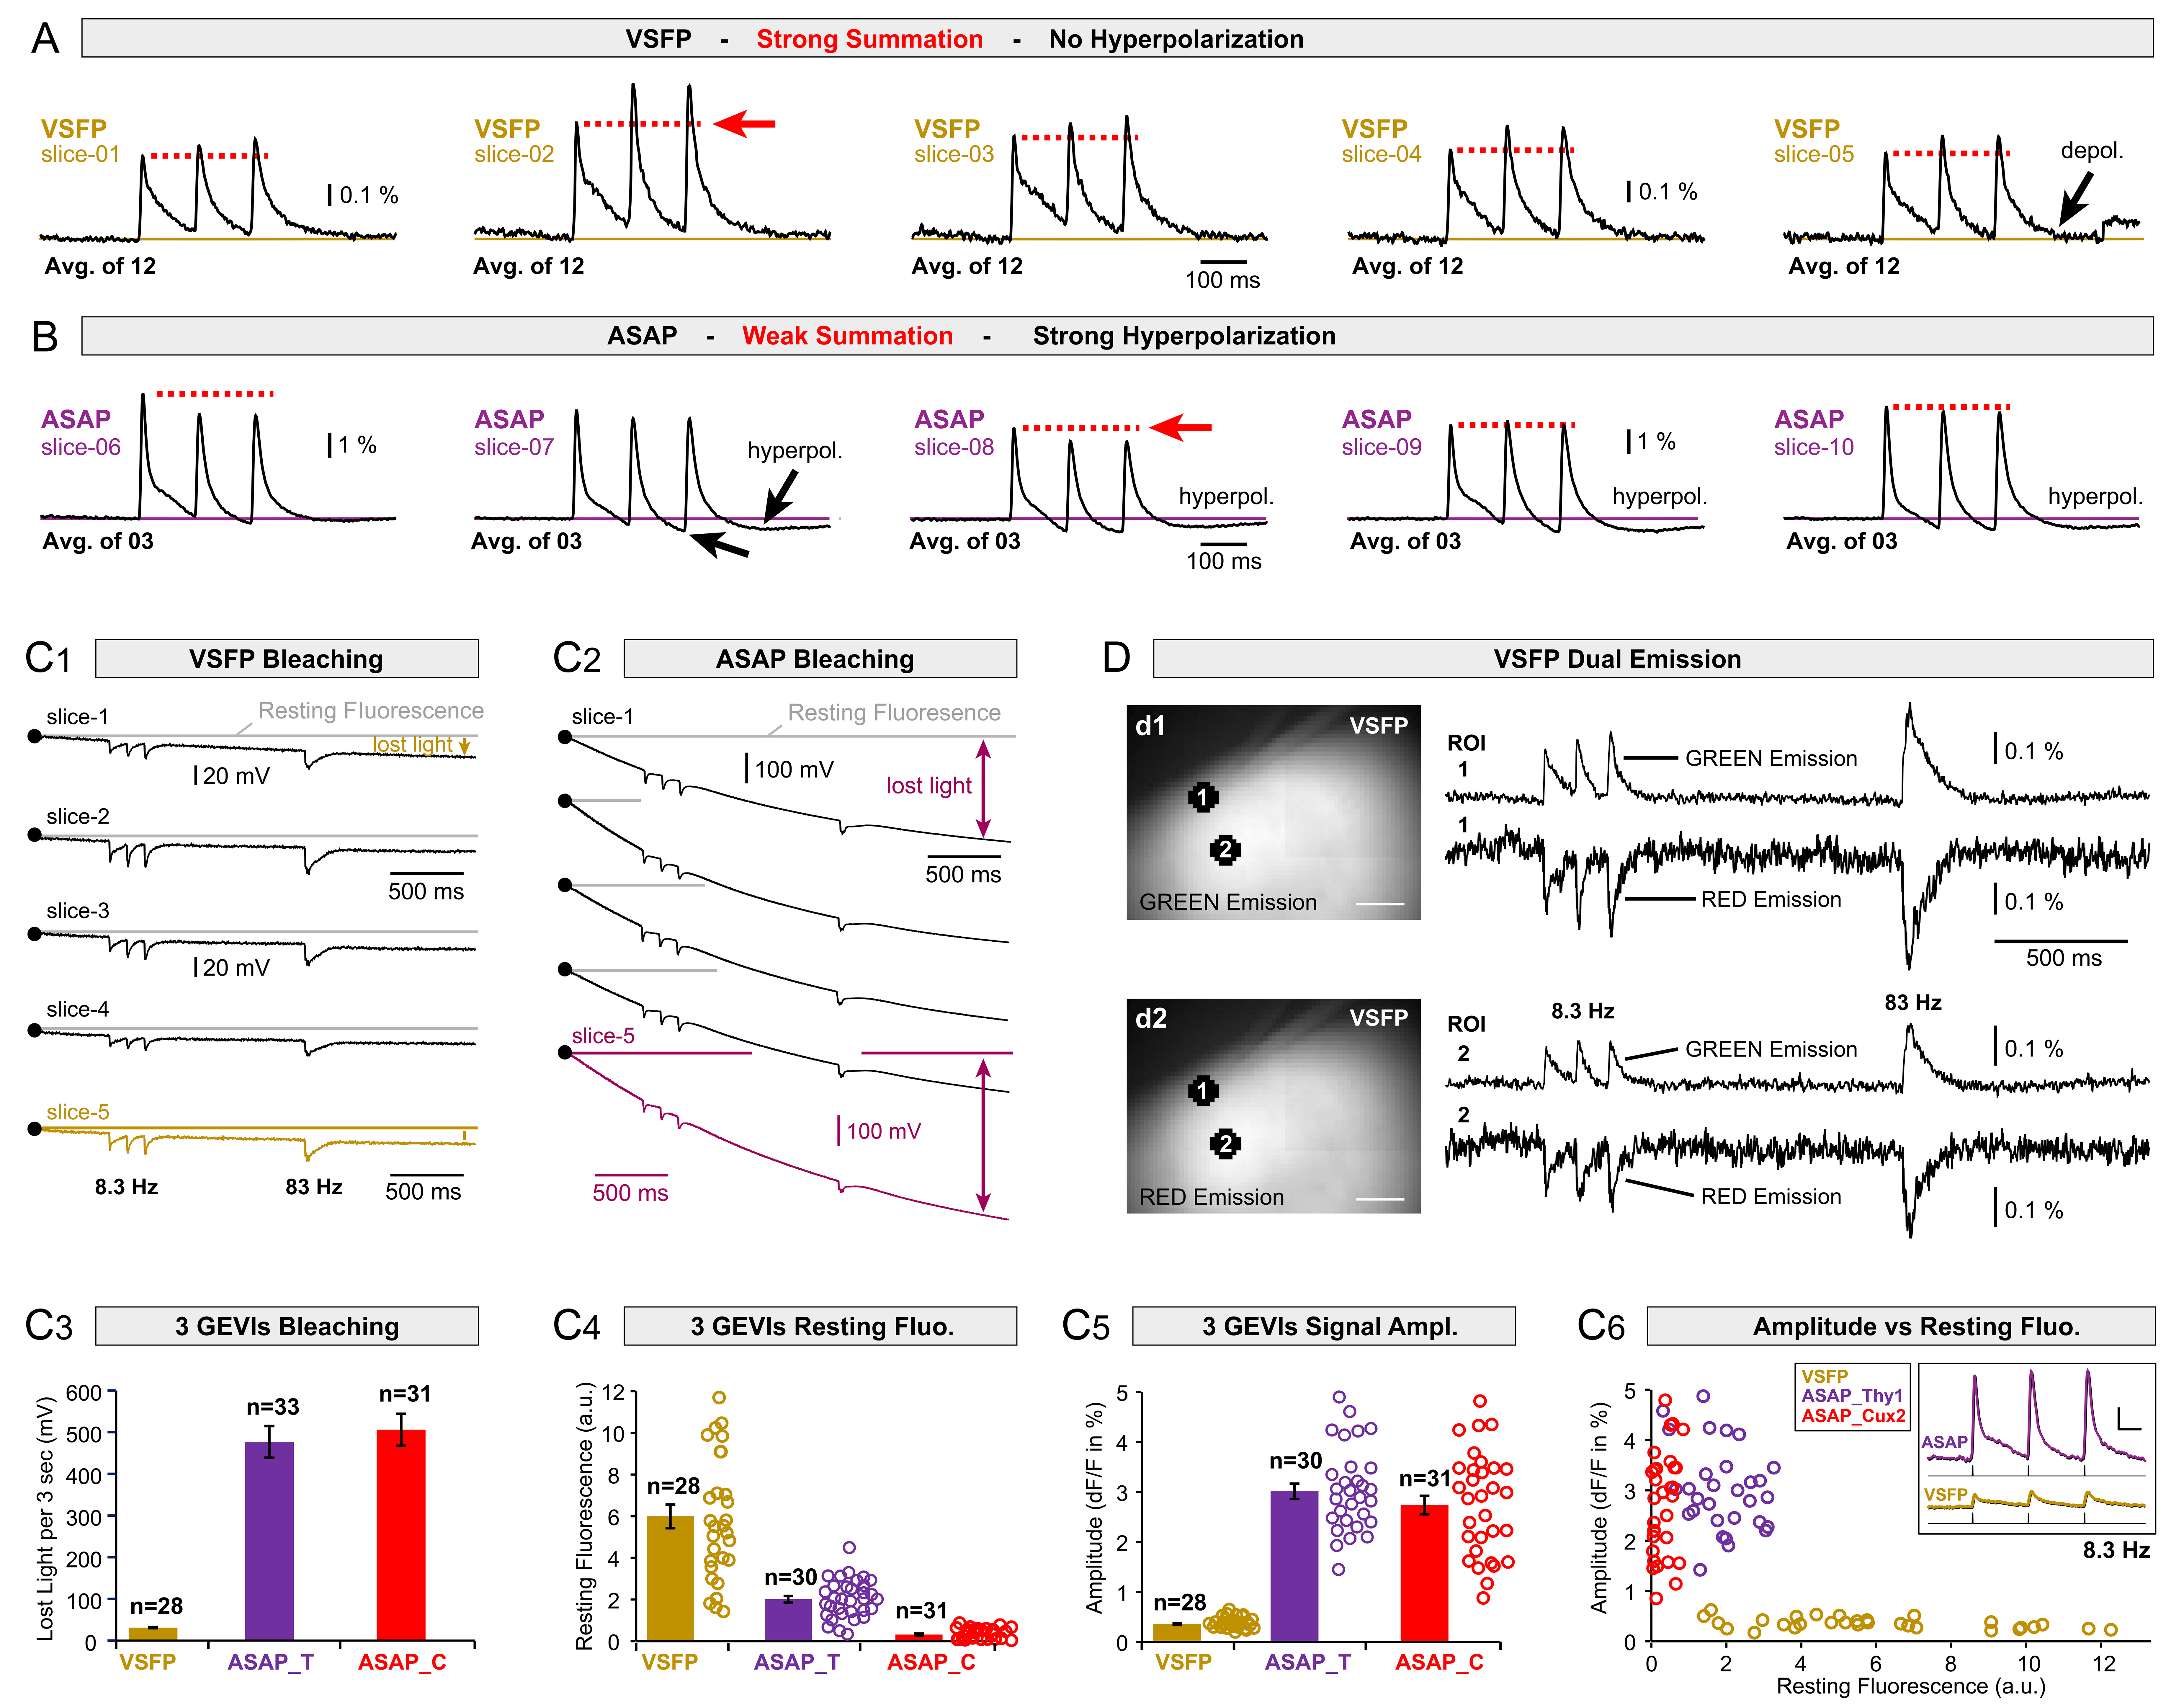 Fig. 6.
Temporal dynamics of the two genetically encoded voltage
indicator (GEVI) variants, VSFP and ASAP. (A) Three synaptic pulses were
delivered into L2/3 at 120 ms interval (8.3 Hz). Five brain slices expressing
VSFP – one trace per slice. Red arrow indicates that the 3rd peak is of a
greater amplitude than the 1st peak. Black arrows emphasize that membrane voltage
is always above the resting membrane potential (beige horizontal line). Each
trace is an average of 12 trials. (B) Identical stimulus as in A. Five traces
from 5 brain slices expressing ASAP2s. Red arrow indicates that the 3rd peak is
of a lower amplitude than the 1st peak. Black arrow indicates voltages more
negative than the resting potential. Each trace is an average of 3 trials. Note
different amplitude scales in A versus B. (C
Another difference between VSFP and ASAP2s was the absence or presence of a fast
negative voltage transient following the evoked depolarizing voltage transient in
cortical layer 2/3. This negative voltage transient is dubbed “apparent
hyperpolarization” (Fig. 6B). First, we made sure that we conditioned optical
traces in both experimental groups with an identical set of low-pass and
high-pass digital filters. In the VSFP experimental series (n = 104 brain slices,
34 mice), on their return to the baseline (repolarization phase) the optical
traces did not cross the baseline established before the arrival of the stimulus
(Fig. 6A, baseline is marked by a beige horizontal line). VSFP traces approached
the baseline, but never crossed (Fig. 6A, black arrow). Conversely, in the
ASAP2s experiments (n = 30 brain slices, 10 animals), optical traces regularly
crossed the baseline established before the arrival of the stimulus (Fig. 6B,
purple horizontal line). The ASAP2s traces traversed the baseline after the 1st,
2nd, and 3rd synaptic event (Fig. 6B, black arrows). In brain slice experiments,
the baseline established before stimulation was reminiscent of a resting membrane
potential, and negative deflections in the ASAP2s optical signal (Fig. 6B, black
arrows) are reminiscent of cortical hyperpolarizations in population voltage
imaging experiments [31, 32]. Fast hyperpolarizations in ASAP2s traces (Fig. 6B,
black arrows) were not caused by underlying autofluorescence optical signals
(Fig. 3C
The camera used in the current study (Neuro-CCD, RedShirtImaging) converted the
incoming photon flux into voltage (current-to-voltage converter). The RFI (in mV) is the fluorescence level at the beginning of
an optical recording sweep (e.g., time = 0 ms). In any type of a fluorescence
measurement, RFI at the beginning is different from that recorded at the end of
an optical sweep (e.g., time = 3000 ms), due to photobleaching. In the current
study, the bleaching rate of a fluorescent indicator was quantified by measuring
the amount of the RFI reduction (in mV) during a 3-second optical sweep (Fig. 6C
While ASAP2s emits only in the green channel, VSFP generates a dual emission in both green and red, stemming from the presence of two fluorophores in each VSFP indicator molecule [33]. When excited by 488 nm light, the voltage indicator VSFP glowed in green channel (emission 510–545 nm), but also in the red spectra (emission 578–625 nm) [27]. In the same brain slice (Fig. 6D), we recorded synaptically evoked optical signals first in the green (donor) and then in the red emission channel (acceptor). These recordings produced signals of opposite polarity (n = 6 brain slices). Invariably, the signal to noise ratio in the green emission channel (Fig. 6D, green emission) was better than in the red emission channel (n = 24 ROIs in 6 brain slices). The dual emission of VSFP (Fig. 6D) could be useful for in vivo experiments, in settings in which both channels, donor and acceptor, are recorded simultaneously [25]. Optical signals in the red channel could potentially be used to correct for mechanical artifacts, as well as for conditioning optical signals.
The true polarity of VSFP and ASAP optical signals is shown in Fig. 6C
Wide-field population imaging (macroscopic, mesoscopic) and fiber photometry
lack single-cell resolution. Activity of many neurons is mixed into one
representative signal; a signal that represents a given population of neurons
[17, 18, 19, 20, 21, 22, 34, 35, 36, 37]. In the current population imaging approach, single-cell
resolution was lost due to dense neuron labeling with fluorescence indicators
(Fig. 2A,B), indiscriminate expression of fluorescent indicator in all neuronal
compartments (dendrites and axons, Fig. 1B
In Figs. 3,4,5,6, all optical signals were evoked by synaptic stimulation, involving extracellular current pulse delivered in L2/3. Depolarization responses of many L2/3 pyramidal cells were projected to the same detector pixel, and for that reason the reported optical signals are similar to LFP, which are known to be dominated by synaptic potentials [38]. Population voltage imaging has a better spatial resolution than the LFP signal [17, 38]. Electrical LFPs report extracellular current densities. When a depolarization wave passes under an LFP electrode, the LFP signal flips its polarity. In contrast, the GEVI method reports transmembrane voltage changes. In our GEVI recordings, a membrane depolarization is always with positive polarity, and membrane hyperpolarization is always negative, regardless of the voltage transient’s propagation velocity or direction. One should also consider the possibility that this negative signal component (apparent hyperpolarization) may represent an activity-related alkalinization of extracellular space to which some GEVIs are sensitive [39, 40].
Integration of fragmented sensory inputs is best studied by measuring neuronal voltages at multiple sites [41, 42]. In association cortices, integration of primary sensory information with other sensory modalities (touch, light, or sound) and quick comparisons with previously stored patterns (memory), lead to the generation of adequate motor actions. These operations engage both local and distributed region-wide computations [43] conducted using both rapid and slow changes in neuronal membrane voltage [44, 45, 46]. Only macroscopic GEVI voltage imaging (GEVI-produced optical LFP) can be used to achieve 4 cardinal requirements of a modern systems neuroscience:
(1) To record fast changing voltage transients (compound action potentials (APs) and EPSPs).
(2) To record slow changing voltage transients (long-lasting depolarizations or hyperpolarizations).
(3) Record simultaneously at many sites.
(4) Record from an identified neuronal subtype (e.g., neocortical layer 2/3 pyramidal cells).
In departure from standard voltage-sensitive dye imaging [4, 17], GEVI imaging offers three important advantages: (a) physiological signals restricted to a specific cell population of interest (e.g., neocortical layer 2/3 pyramidal cells); (b) GEVI transgenic mice do not require removal of dura or skull-bone - imaging through a thinned skull [43]; and (c) repeated imaging sessions in living mice over the time course of an experiment lasting days [47].
In the absence of any fluorescent labeling (no GEVI expression or dye
application), autofluorescence optical signals (excitation 470 nm, emission 510
nm) reliably detect synaptically evoked “events” in cerebral cortex. Amplitudes
of autofluorescence optical signals (
Both VSFP and ASAP2s produced optical signals that can be used for comparing amplitudes and time courses (rise time, decay time, and temporal summation) of the evoked voltage waveforms between experimental groups. For example, comparing an experimental group composed of Alzheimer’s disease model mice versus an experimental group composed of their healthy littermates [51]. Both GEVI indicators, VSFP and ASAP2s, can be used for monitoring “vertical” propagation of evoked depolarizations between cortical layers (e.g., from L4 to L2/3), or “horizontal” propagation along one cortical lamina (e.g., along layer 2/3, Fig. 5). One important difference between the two GEVI indicators was temporal summation at the 120 ms stimulus interval (8.3 Hz). While the VSFP optical signals integrated photons and showed a gradual increase in the synaptic event amplitude at the end of a synaptic train (activity-dependent amplitude facilitation, Fig. 6A), the ASAP2s optical signals showed gradual declines (activity-dependent amplitude depression, Fig. 6B).
The half-width (duration at half amplitude) of the cEPSP voltage waveforms in ASAP2s and VSFP experimental series were similar (compare Fig. 4A vs Fig. 4C), suggesting that these two GEVI variants faithfully report cEPSP decay phases in cerebral cortex, while the voltage-sensitive dye Di-4-Anepps alters cortical cEPSP waveforms. Two factors may potentially account for a slightly slower decay phase in the Di-4-Anepps experimental series (Fig. 4B,E,F). First, ASAP2s and VSFP signals were restricted to excitatory pyramidal cells, while Di-4-Anepps indiscriminately labeled all neuronal and non-neuronal membranes. It is not clear how optical signals from interneurons, astrocytes, blood vessels, and other elements affect the cEPSP voltage waveforms. Second, Di-4-Anepps exerts pharmacological effects on neurons [52], therefore the slowing of the EPSP decay phase observed in the present study (Fig. 4B,E,F) may also be an undocumented pharmacological effect of this voltage-sensitive dye. However, to demonstrate a pharmacological effect, one should present the dye-induced effects (e.g., a change in the time course of the voltage transient) with electrophysiological methods, which was not done here.
All three voltage indicators evaluated in the present study (ASAP2s, VSFP, and
Di-4-Anepps) have demonstrated versatility in population voltage imaging of
synaptically-evoked cortical depolarizations, in vitro, in brain slices.
Transgenic mouse lines carrying VSFP or ASAP2 offer major practical and
conceptual advantages. Transgenic expression eliminates invasive and
labor-intensive intracranial injections of AAV vectors. A fast OFF dynamic of the
GEVI variant, ASAP2s, renders this indicator the first choice for studying
rapidly changing voltage fields in cerebral cortex (e.g., cortical oscillations).
A strong resting fluorescence of VSFP, renders this indicator the first choice
for intact-skull imaging (imaging through a thinned skull bone). Among three
indicators tested, ASAP2s was the only one showing apparent cortical
hyperpolarizations. In the same optical channel in which we recorded ASAP2s
optical signals (excitation 470 nm, emission 510 nm), we also recorded
autofluorescence optical signals. These “negative” optical signals,
autofluorescence optical signals, should not be confused for hyperpolarizing
cortical events in ASAP2s traces. Autofluorescence optical signals have an
opposite polarity and a slow dynamic compared to ASAP2s signals of evoked cEPSPs.
When ASAP2s expression is low, like in Cux2_ASAP2s mice, the autofluorescence
optical signals mix with the ASAP2s signals, and introduce slow wave artifacts.
ASAP2s bleaches notably faster than VSFP. While VSFP produces optical signals in
both green and red channel simultaneously, ASAP2s has no functional signal and no
fluorescence in the red segment of the visible light. ASAP2s has approximately
7-fold greater signal amplitude (
ACSF, artificial cerebrospinal fluid; ASAP2s, GEVI made by the M.Z. Lin laboratory; Age P21, postnatal day 21; cEPSPs, compound excitatory postsynaptic potentials; Di-4-Anepps, a commercially available voltage-sensitive dye; ES cells, embryonic stem cells; F1, the first filial generation of animal offspring; GEVI, genetically encoded voltage indicator; Jax Lab, Jackson laboratory; LFP, local field potential; VSFP, GEVI made by the T. Knopfel laboratory; TAM Diet, tamoxifen diet; VSD, voltage sensitive dye.
The datasets used and/or analyzed during the current study are available from the corresponding author upon request.
SDA and MZL designed the research study. BLB and LXL produced animals expressing GEVIs. KDM and SDA generated histological data. KDM, MHZ, BLB, OB, ZYE, and SDA performed optical recordings. KDM and SDA analyzed the data. KDM, SDA and MZL wrote the manuscript. All authors contributed to editorial changes in the manuscript. All authors read and approved the final manuscript. All authors have participated sufficiently in the work and agreed to be accountable for all aspects of the work.
Brain slices were obtained from mice according to the animal protocol (AP-200902-0526) approved by the UConn Health Institutional Animal Care and Use Committee (IACUC).
We are grateful to Chenchen Song and Thomas Knopfel for the VSFP transgenic mouse line, to John Zhou and Riqiang Yan for help with imaging histological sections, to Pavle Andjus, Gulderen Yanikkaya Demirel, and Bayram Yilmaz for supervision of students, and to Kumiko Watanabe and Bugra Ozgun for technical support.
This research was funded by the Cure Alzheimer’s Fund (#65539), the National Institute of Mental Health (U01MH109091), the National Institute on Aging (AG064554), the UConn Health Alcohol Research Center (ARC)/Kasowitz Medical Research Fund (P50AA027055), and the H2020-MSCA-RISE-2017 (#778405).
The authors declare no conflict of interest.
References
Publisher’s Note: IMR Press stays neutral with regard to jurisdictional claims in published maps and institutional affiliations.