


 , Vladimir Pavković 2, Tamara Vlastelica 3, Milica Kostić-Stanković 3
1 Department of Operational Research and Statistics, Faculty of Organizational Sciences, University of Belgrade, 11000 Belgrade, Serbia
2 The College of Tourism, Academy of Applied Studies Belgrade, 11000 Belgrade, Serbia
3 Department of Marketing Management and Communications, Faculty of Organizational Sciences, University of Belgrade, 11000 Belgrade, Serbia
Abstract
The global tourism market is characterised by intense competition, whereby the reputation of a tourist destination is one of the most important resources for gaining a competitive advantage. Since reputation represents a manageable category, this study aims to identify the key constituents of the reputation of an urban tourist destination and determine the nature of the relationship between these constituents and the intentions and behaviours of tourists towards urban tourist destinations with a good reputation. To examine the above-mentioned relationships, a conceptual model is proposed. To verify the model, a survey was conducted on a representative sample of 376 respondents from the capital of a Central and Eastern European (CEE) country, the Republic of Serbia. The research results indicate that both tangible and intangible constituents affect consequential intentions and behaviour, such as in-person positive review and recommendation, positive online review and recommendation, willingness to visit a destination again and willingness to permanently move to a destination. Moreover, it is demonstrated that this relationship is affected by the demographics of tourists—their age and income, which contributes to the current literature in the field and offers valuable insights for effective urban tourist destination management.
Keywords
- urban tourist destination
- reputation
- experience
- conceptual model
- tourist behaviour
An urban tourist destination represents a city as a spatial unit characterised by numerous dimensions of tourist attractiveness and various tourist activities. According to Pavković and Vlastelica (2022), the concept of dimensions of tourist attractiveness is a broader concept than tourist attractions, as it includes tangible and intangible attributes, but also those attributes of the destination that do not represent attractions for tourists per se, but in combination affect expectations and experiences of tourists. These dimensions, individually or jointly, through quality experiences with them, and consequently, reputation as an attitude that arises based on these experiences, increase the destination’s competitiveness in the global tourism market. Wang et al (2021) state that in conditions of increasingly strong competition, only those tourist destinations that have a good reputation have the opportunity to attract a larger number of tourists.
Reputation is a psychological construct (Aksak et al, 2016) based on personal experiences with the subject of reputation (Darwish and Burns, 2019; Vlastelica et al, 2018) and represents a comparable category according to different criteria (Dutot and Castellano, 2015), such as competition (Rindova et al, 2005) and personal expectations (Khan and Digout, 2018). Reputation is a more complex concept than image (Argenti and Druckenmiller, 2004; Shirvani Dastgerdi and De Luca, 2019), as it is formed based on experiences with the subject of the reputation (Chun, 2005) and requires significantly more time to develop (Walker, 2010), considering that it includes, among other things, previous and present experiences (Artigas et al, 2015). In fact, an image creates expectations about a destination (Jiang et al, 2016; Kladou and Mavragani, 2015), through marketing and public relations activities (Skočajić et al, 2024), especially media and promotional campaigns (Ali et al, 2018), as well as by conveying other people’s experiences through different narratives (Morgan et al, 2007), whereas reputation is shaped by personal experience (Ali et al, 2018; Foroudi et al, 2016).
Su et al (2018) argue that a positive reputation is becoming increasingly important for tourism, particularly in how tourists perceive a destination based on their experiences and how they develop subsequent behaviours. In this regard, numerous authors have pointed out in their works that a good reputation is fundamentally based on quality experiences (Fishbein and Ajzen, 1975; Pavković, 2022; Vlastelica et al, 2017; Zhang et al, 2018). Artigas et al (2015) observe quality experience through cognitive and affective evaluation. They note that cognitive evaluation is based on paying attention to stimuli and events, as well as understanding and remembering them. Thus, it presents how individuals perceive and process attributes of the tourist destination, such as architecture and natural features, attractions, services, and infrastructure. On the other hand, affective evaluation encompasses a set of positive, neutral, or negative associations related to the destination, which arise from emotional reactions to different places that are transformed into images and memories. The authors argue that when both cognitive and affective evaluations are favourable, they foster a positive reputation for the destination. Tourist experiences are crucial to the perception of a city, as tourists move around the city, enjoy the sights and attractions, sounds and smells, and interact with local people, which greatly affects their overall experience (Wearing and Foley, 2017). Therefore, it is particularly important to have a sufficient number of diverse dimensions of tourist attractiveness that can attract tourists to an urban tourist destination and provide them with unique experiences.
Numerous authors have established that the reputation of a tourist destination represents a manageable category which significantly affects the future intentions and behaviour of tourists (Garín-Muñoz and Moral, 2017; Hassan and Soliman, 2021; Wang et al, 2021). Previous research showed that the reputation of a tourist destination can be observed through tangible and intangible constituents (Ali et al, 2018; Wearing and Foley, 2017), depending on the specificity of the dimensions of tourist attractiveness to which experiences and attitudes relate. Pavković (2022) states that to create a quality reputation of an urban tourist destination, not all its constituents need to have a good reputation. Tourists sublimate experiences of all individual constituents of reputation, giving them different importance (depending on motivational factors), so that overall reputation is formed at the expense of the strongest, which can be positive or negative. Based on previous considerations, three research questions emerge. First, what are the constituents of the reputation of an urban tourist destination that are significant for tourists? After the constituents have been determined, the question is whether there is a relationship between these constituents and subsequent intentions and behaviours. Finally, it is of interest to observe if and how the demographic characteristics of tourists (age and income level) affect the defined relationship.
Many countries recognised tourism as an opportunity to improve their economy, so they strategically approached development and increased investments in this area. Urban tourism attracts more and more tourists, thus making it one of the fastest-growing types of tourism (Pavković et al, 2024; Postma et al, 2017). World Travel & Tourism Council (2022) in the Cities Economic Impact Report states that many major cities remain iconic destinations that hold the key attractions for visitors. From 2022 to 2032, the sector is projected to increase its share of economic activity in numerous major cities, e.g., direct Travel & Tourism Gross domestic product (GDP) from cities will grow from 582 bn to 1.1 tn dollars. Reputation is one of the most important elements that contribute to the economic benefits of cities as urban tourist destinations (Shirvani Dastgerdi and De Luca, 2019; Garín-Muñoz and Moral, 2017; Papadimitriou et al, 2018; Su et al, 2018). Therefore, city governments and destination management organisations (DMOs) need to pay special attention to creating and managing a good reputation for individual dimensions of tourist attractiveness and the overall urban tourist destination.
Emerging economies are currently the primary drivers of the increasing global demand for international tourism. The United Nations (UN) World Tourism Organization states that some of the fastest-growing outbound tourism markets are the emerging markets (World Travel Market, 2023). Serbia represents a typical emerging tourism industry (Statista, 2024), and Belgrade, being the capital, economic centre and most populated city of the country, is also an example of a major city in a developing country. According to the Oxford Economics Global Cities Index for the year 2024, Belgrade is in the rank group 401–425 (Oxford Economics, 2024). Other capitals of the emerging economies within the same group are Skopje (North Macedonia), Baku (Azerbaijan), Quito (Ecuador), and Chişinău (Moldova). Emerging Europe, a London-based organisation that aims to promote the potential of emerging countries, in 2023, ranked Belgrade as the 14th established city on the business-friendly city perception index in the Emerging Europe (2023). Belgrade shares cultural similarities with a range of cities, particularly in Eastern Europe, the Balkans, and other emerging markets with similar historical, economic, and social contexts. Belgrade is culturally similar to cities in the former Yugoslavia (Zagreb, Sarajevo) and other post-socialist countries (Budapest, Bucharest, Sofia, Warsaw) (Babić, 2021), as well as cities in Turkey due to their Ottoman past. Therefore, it is viable to examine a representative sample of Belgrade residents to examine reputational constituents and their impact on tourists’ intentions and behaviour in terms of research results generalisation.
To answer the previously raised questions, a conceptual model has been proposed and verified on a representative sample of the Belgrade population. By answering the raised questions, it is possible to provide valuable answers and detangle how members of a particular surveyed population perceive any tourist destination and which reputational constituents of a tourist destination are attractive to them. The results of this study could be useful for destination management organisations willing to attract members of a particular population.
The paper is structured as follows. After introductory considerations, the second part provides an overview of the literature on the reputation of urban tourist destinations. The third part proposes the constituents of reputation, subsequent intentions and behaviours of tourists, and the conceptual model. The fourth part describes the research methodology, while the fifth part presents and interprets the research results. We finish the paper with the discussion and concluding remarks.
In recent years, an increasing number of researchers have recognised the importance of reputation and have demonstrated its impact on the competitiveness and attractiveness of tourist destinations, reducing risk when making travel decisions, and other significant aspects of the decision-making process and intentions towards tourist destinations. Thus, similar to corporate reputation, the reputation of tourist destinations represents one of the most important intangible assets (Darwish and Burns, 2019). Hassan and Soliman (2021) even consider tourism an industry that depends on reputation.
Satisfaction with tangible and intangible constituents of reputation affects the creation of the overall good reputation of an urban tourist destination and consequently impacts the intentions and behaviours of tourists. A positive reputation of an urban tourist destination has been shown to significantly impact various aspects of its attractiveness and success. Several authors have discussed how a well-maintained reputation enhances a destination’s competitiveness. For instance, Hassan and Soliman (2021), Darwish and Burns (2019), and Morgan and Huertas (2011) emphasise that a strong reputation can position a destination favourably against competitors, making it more appealing to tourists. Moreover, a reputable destination increases tourist loyalty and influences repeat visits, as highlighted by Su et al (2018) and Papadimitriou et al (2018). The credibility and reliability of the destination are also significantly bolstered, further reinforcing tourist confidence and driving repeat visits (Artigas et al, 2015; Cillo et al, 2021).
Furthermore, a positive reputation has been found to influence word-of-mouth recommendations. Garín-Muñoz and Moral (2017) note that satisfied tourists are more likely to recommend a destination to others, effectively enhancing its visibility and appeal. Wisnawa et al (2019) consider important tourists’ expectations as their hope that their needs would be satisfied primarily in the context of the quality of dimensions of tourist attractiveness. Based on that, tourists’ trust is critical when selecting a destination, and studies by Hassan and Soliman (2021) and Su et al (2020) show that a good reputation reduces perceived risks, increasing the destination’s attractiveness. Additionally, having a positive reputation signals that the destination offers high-quality products and services (Su et al, 2020).
A good reputation also directly impacts the economic aspects of tourism. According to Wang et al (2021) and Garín-Muñoz and Moral (2017), tourists tend to spend more at reputable destinations, which can enhance local economic benefits. In the event of a crisis, a strong reputation can expedite recovery (Su et al, 2018). Finally, a strong reputation can attract investment and qualified human resources, which are crucial for the sustainable growth of the tourism sector (Darwish and Burns, 2019; Shirvani Dastgerdi and De Luca, 2019).
Artigas et al (2015, pp. 147) define the reputation of a tourist destination as “tourists’ evaluative judgment and perception of the tourist destination based on its activities and past performances”, or as “a synthesis of opinions, perceptions, knowledge, and attitudes of various stakeholders, including tourists, local residents, and society as a whole”. Su et al (2018, pp. 4) define destination reputation as “a global assessment of the degree to which a destination is perceived as ‘good’ or ‘bad’ by tourists”. Vlastelica et al (2017, pp. 158) state that reputation consists of “beliefs and attitudes, preceded by experience, which result in intentions and behaviours of individuals”. This definition is based on the Theory of Reasoned Action (Fishbein and Ajzen, 1975), which claims that experience with an object leads to the creation of beliefs and attitudes that subsequently lead to intentions and behaviour towards that object, forming a causal chain. Based on this theoretical approach, Pavković (2022, pp. 20) defines the reputation of an urban tourist destination as “a psychological construct based on tourists’ attitudes towards the urban tourist destination and its physical and social elements of tourist attractiveness, based on personal experiences and representing a comparable category, both in relation to personal and social expectations, as well as in relation to competition, whereby, as such, reputation affects the intentions and behaviours of tourists towards the urban tourist destination”.
Personal experiences are crucial in forming a reputation in tourism (Foroudi et al, 2016) because they stem from tourists’ contacts and interactions with the physical environment, atmosphere, other tourists, and service providers (Ali et al, 2018). In this sense, exceptional experiences are one of the most important benefits tourists seek (Cillo et al, 2021), representing the kind of experiences that exceed the expectations of tourists regarding the dimensions of tourist attractiveness. The significance of experiences for destination reputation is also confirmed by Zhang et al (2018), who believe that destinations, due to increasing competition, must create and provide an unforgettable cognitive and affective perception of experience to tourists, thereby establishing a strong bond between the destination and tourists.
According to Artigas et al (2015), there is causality between: (a) cognitive and affective perception of experiences, (b) reputation, and (c) future intentions towards the destination. They note that cognitive evaluation is based on paying attention to stimuli and events, understanding and remembering them. Thus, it presents the way in which individuals perceive and process attributes of the tourist destination, such as architecture and natural features, attractions, services, and infrastructure. On the other hand, affective evaluation encompasses a set of positive, neutral, or negative associations related to the destination, which arise from emotional reactions to different places that are transformed into images and memories.
Numerous elements create a destination’s reputation (Morgan, 2012), so the process of creating and managing it requires a cooperative approach from various actors at the destination itself (Beritelli and Laesser, 2011), which is why Buhalis (2003) considers destination reputation management particularly challenging. Vengesayi and Mavondo (2004) believe that destinations should build a positive reputation by enabling tourists and visitors to have quality experiences, which depend on the expertise and enthusiasm of employees in the tourism industry as well as the local population. The local population is one of the most important elements in creating the reputation of an urban tourist destination, through their role in the experiences of tourists staying in the destination. This primarily refers to hospitality (Zhang et al, 2018), knowledge of foreign languages, acceptance of different cultural values and characteristics of tourists from abroad, willingness to help tourists, and the atmosphere they create in the destination.
Measuring reputation is challenging, and therefore, different metrics have been proposed. For example, according to the Reputation Institute’s City RepTrak® report (2018), the key attributes driving a city’s reputation and which are directly related to tourism are a safe environment for visitors and residents (12.2%) and a beautiful city (11.9%). In this paper, based on a literature review and previous research, constituents of urban tourist destination reputation have been identified as a comprehensive system of tangible and intangible dimensions of tourism attractiveness related to the urban tourist destination. Tourists primarily form expectations regarding the dimensions of tourism attractiveness of the urban tourist destination that they consider the most important. Then, during their stay at the destination, they form attitudes towards individual dimensions of tourism attractiveness with which they have had experiences, which are the result of cognitive and affective evaluation of the experience.
As a basis for defining tangible and intangible constituents of reputation, the division into physical and social dimensions of tourism attractiveness proposed by Pavković and Vlastelica (2022) was used. Tangible reputation constituents are: parks and green areas (PGA), tourist attractions along the waterfront (TW), cultural and historical attractions (CHA), hospitality and entertainment facilities (HEF), festivals and events (FE), shopping facilities (SF), accommodation facilities (AF), price affordability (PA), cleanliness of the city (CC), convenient transportation and easy access to all tourist facilities in the city (CT). Intangible constituents of reputation are the following attributes: safe (SAF), interesting (INT), authentic (AUT), and pleasant ambience (PAM).
Furthermore, the authors have defined certain intentions and behaviours of tourists that are a direct consequence of a good or bad reputation of a tourist destination and that reflect satisfaction, loyalty, and willingness to recommend. Those are: positive review and recommendation in person (PIP), positive online review and recommendation (POL), willingness to visit destination again (VDA), and willingness to permanently move to destination (MTD).
We primarily base the proposed model on the Theory of Reasoned Action (TRA) by Fishbein and Ajzen (1975), which suggests that the correlation between experience, beliefs, attitudes, intentions, and behaviour is a suitable and well-established theoretical foundation for examining the impact of destination reputation on tourist decision-making. By applying TRA, we systematically analysed how tourists’ perceptions of, experiences with, and attitudes toward tangible and intangible reputational constituents translate into their intentions to visit, recommend, revisit a destination, or permanently move to a destination. TRA has been effectively utilised in tourism research to predict various behaviours. Sparks and Pan (2009) found that tourists’ attitudes toward sustainable travel influenced their intention to choose eco-friendly accommodations, while subjective norms (friends’ and family’s views) reinforced these choices. Han and Kim (2010) applied TRA to explain green hotel choices, highlighting that positive attitudes and social approval drive eco-conscious booking decisions. Ryu and Jang (2006) demonstrated that tourists’ intention to try local cuisine in a travel destination was shaped by both their attitude toward local food and social influences. Besides the TRA, we took into account the cause-and-effect behaviour related to reputation and companies (Vlastelica et al, 2017), tourist destinations (Cillo et al, 2021; Garín-Muñoz and Moral, 2017) and urban tourist destinations (Pavković, 2022). It was reasonable to assume that the good reputation of an urban tourist destination has some kind of influence on the behaviour of tourists in relation to it. On the other hand, starting from the characteristics of dimensions of tourist destination attractiveness presented by Pavković et al (2024), and based on the sistematisation of constituents of reputation presented by Pavković and Vlastelica (2022), it would be interesting to investigate what are the consequent intentions and behaviours of tourists in relation to tangible and intangible constituents in urban tourist destinations with a good reputation.
The first hypothesis of our work is:
H1: There is a positive relationship between the tangible constituents of reputation and consequent intentions and behaviours toward the urban tourist destination.
Consequent intentions and behaviours toward the urban tourist destination have been a topic of interest for many scholars. In their study, Bigne et al (2001) observed how image, quality and satisfaction impact the desire to return and willingness to recommend a destination. They found both statistically significant direct and indirect relationships. A few years later, Um et al (2006) slightly modified the model and observed how perceived attractiveness, satisfaction, perceived value for money impact revisit intention. They also obtained positive statistically significant impacts. Both of these models are promising. However, their reputation constructs were single-item constructs, indicating that the multidimensionality of reputation could not be captured. In a more recent paper, Hassan and Soliman (2021) observed how destination reputation impacts revisit intention. They went a step further and perceived reputation as a multidimensional 5-item construct. Their results pointed out that reputation positively and significantly impacts willingness to visit a destination again. The research also explores the recommendations in person and online. Wang et al (2021) analysed how tourism destination reputation measured through catering quality, accommodation condition, landscape, cultural attraction and recreation and entertainment activities, impacts tourist consumption behaviour regarding willingness to recommend a touristic destination to others. A positive relationship was determined. Within the listed studies, when measuring reputation, these authors mostly focused on tangible aspects of reputation and used single-item constructs. In our study, compared to the listed studies, we have a slightly different approach. We observe tangible constituents of reputation as a latent construct, while behaviours related to an urban destination with a good reputation as single-item elements. Therefore, our hypothesis H1 can be parsed into:
H1.a: There is a positive relationship between the tangible constituents of reputation and positive review and recommendation in person (PIP).
H1.b: There is a positive relationship between the tangible constituents of reputation and positive online review and recommendation (POL).
H1.c: There is a positive relationship between the tangible constituents of reputation and willingness to visit the destination again (VDA).
H1.d: There is a positive relationship between the tangible constituents of reputation and willingness to permanently move to a destination (MTD).
The second hypothesis of our work is:
H2: There is a positive relationship between the intangible constituents of reputation and consequent intentions and behaviours toward the urban tourist destination.
The previously shown literature review signalled that authors vastly focused on tangible constituents of reputation when mentioning reputation. Within our research, we wanted to make a distinction between the two. Nevertheless, several studies focused on intangible constituents of reputation and their impact. Artuğer (2015) showed that the less safe the perception of a tourist destination, the lower the revisit intention is. Hasan et al (2019) proved that perceived destination risks negatively influence tourist attitudes towards revisiting destinations. Lai et al (2018) showed that higher safety perception leads to positive recommendations. Kim and Bonn (2016) determined that existential authenticity affects willingness to return and willingness to recommend to others. Again, we observe intangible constituents of reputation as a latent construct, while behaviours related to urban destination with good reputation as single-item elements. Therefore, our hypothesis H2 can be parsed into:
H2.a: There is a positive relationship between the intangible constituents of reputation and positive review and recommendation in person (PIP).
H2.b: There is a positive relationship between the intangible constituents of reputation and positive online review and recommendation (POL).
H2.c: There is a positive relationship between the intangible constituents of reputation and willingness to visit the destination again (VDA).
H2.d: There is a positive relationship between the intangible constituents of reputation and willingness to permanently move to a destination (MTD).
Numerous authors have proven that different demographic characteristics moderate tourists’ experiences, perception, image and reputation formation. Social Identity Theory posits that individuals derive a portion of their identity from group memberships, such as age cohorts and socioeconomic classes (Scheepers and Ellemers, 2019). These group affiliations shape perceptions and behaviours, including travel-related decisions (Huang et al, 2008). Understanding these dynamics allows for more accurate modelling of tourist behaviours and intentions (Sakakida et al, 2004). Incorporating age and income as moderating variables in the study of tourist decision-making is essential, as these demographic factors significantly influence perception, attitudes, travel behaviours and preferences (Hoxter and Lester, 1988). Age affects tourists’ destination choices, activity preferences, and overall travel motivations (Triandis, 1995). Income levels determine the affordability of travel options, influencing decisions regarding destination selection, accommodation types, and length of stay (Hoxter and Lester, 1988; Huang et al, 2008). From a managerial perspective, recognising the moderating effects of age and income enables tourism marketers to tailor the offer and communication strategies effectively (Huang et al, 2008). By segmenting the market based on these demographics, marketers can customise promotional messages, select appropriate communication channels, and design offerings that resonate with specific groups (Kostic-Stankovic et al, 2019; Triandis, 1995). Therefore, we add one more hypothesis:
H3: Demographic characteristics of the respondents influence the relationship between the constituents of reputation and specific consequent intentions and behaviours towards the urban tourist destination.
As different demographic characteristics can be moderators of the observed relationships, herein, we focus on the impact of gender and income. For example, Wang et al (2016) used multi-group SEM analysis to compare models of cognitive and affective images between genders and found gender-related differences between the models. Abubakar et al (2017) used the same methodological approach to observe how gender moderates the impact of online WOM on revisit intention. Gender differences were also found in the work of Krupskyi et al (2019). Looking at the impact of income, Djeri et al (2014), also on a sample of Serbian respondents, showed that income is a major factor in tourism-related decision-making. Struwig and du Preez (2024), in a recent study, showed that respondents with different income levels pay attention to various tangible and intangible aspects of the reputation of a tourist destination.
Based on the literature review, we have formulated the following hypotheses:
H3.a: The age of respondents influences the relationship between reputation constituents and specific consequent intentions and behaviours toward urban tourist destinations.
H3.b: Income influences the relationship between reputation constituents and specific consequent intentions and behaviours toward urban tourist destinations.
Fig. 1 provides a conceptual model based on the defined model elements and hypotheses. One side of the model represents the tangible and intangible constituents of reputation, while the other, the outcome side, illustrates the behaviours related to an urban destination with a good reputation. The observed relationship is moderated by respondents’ age and income.
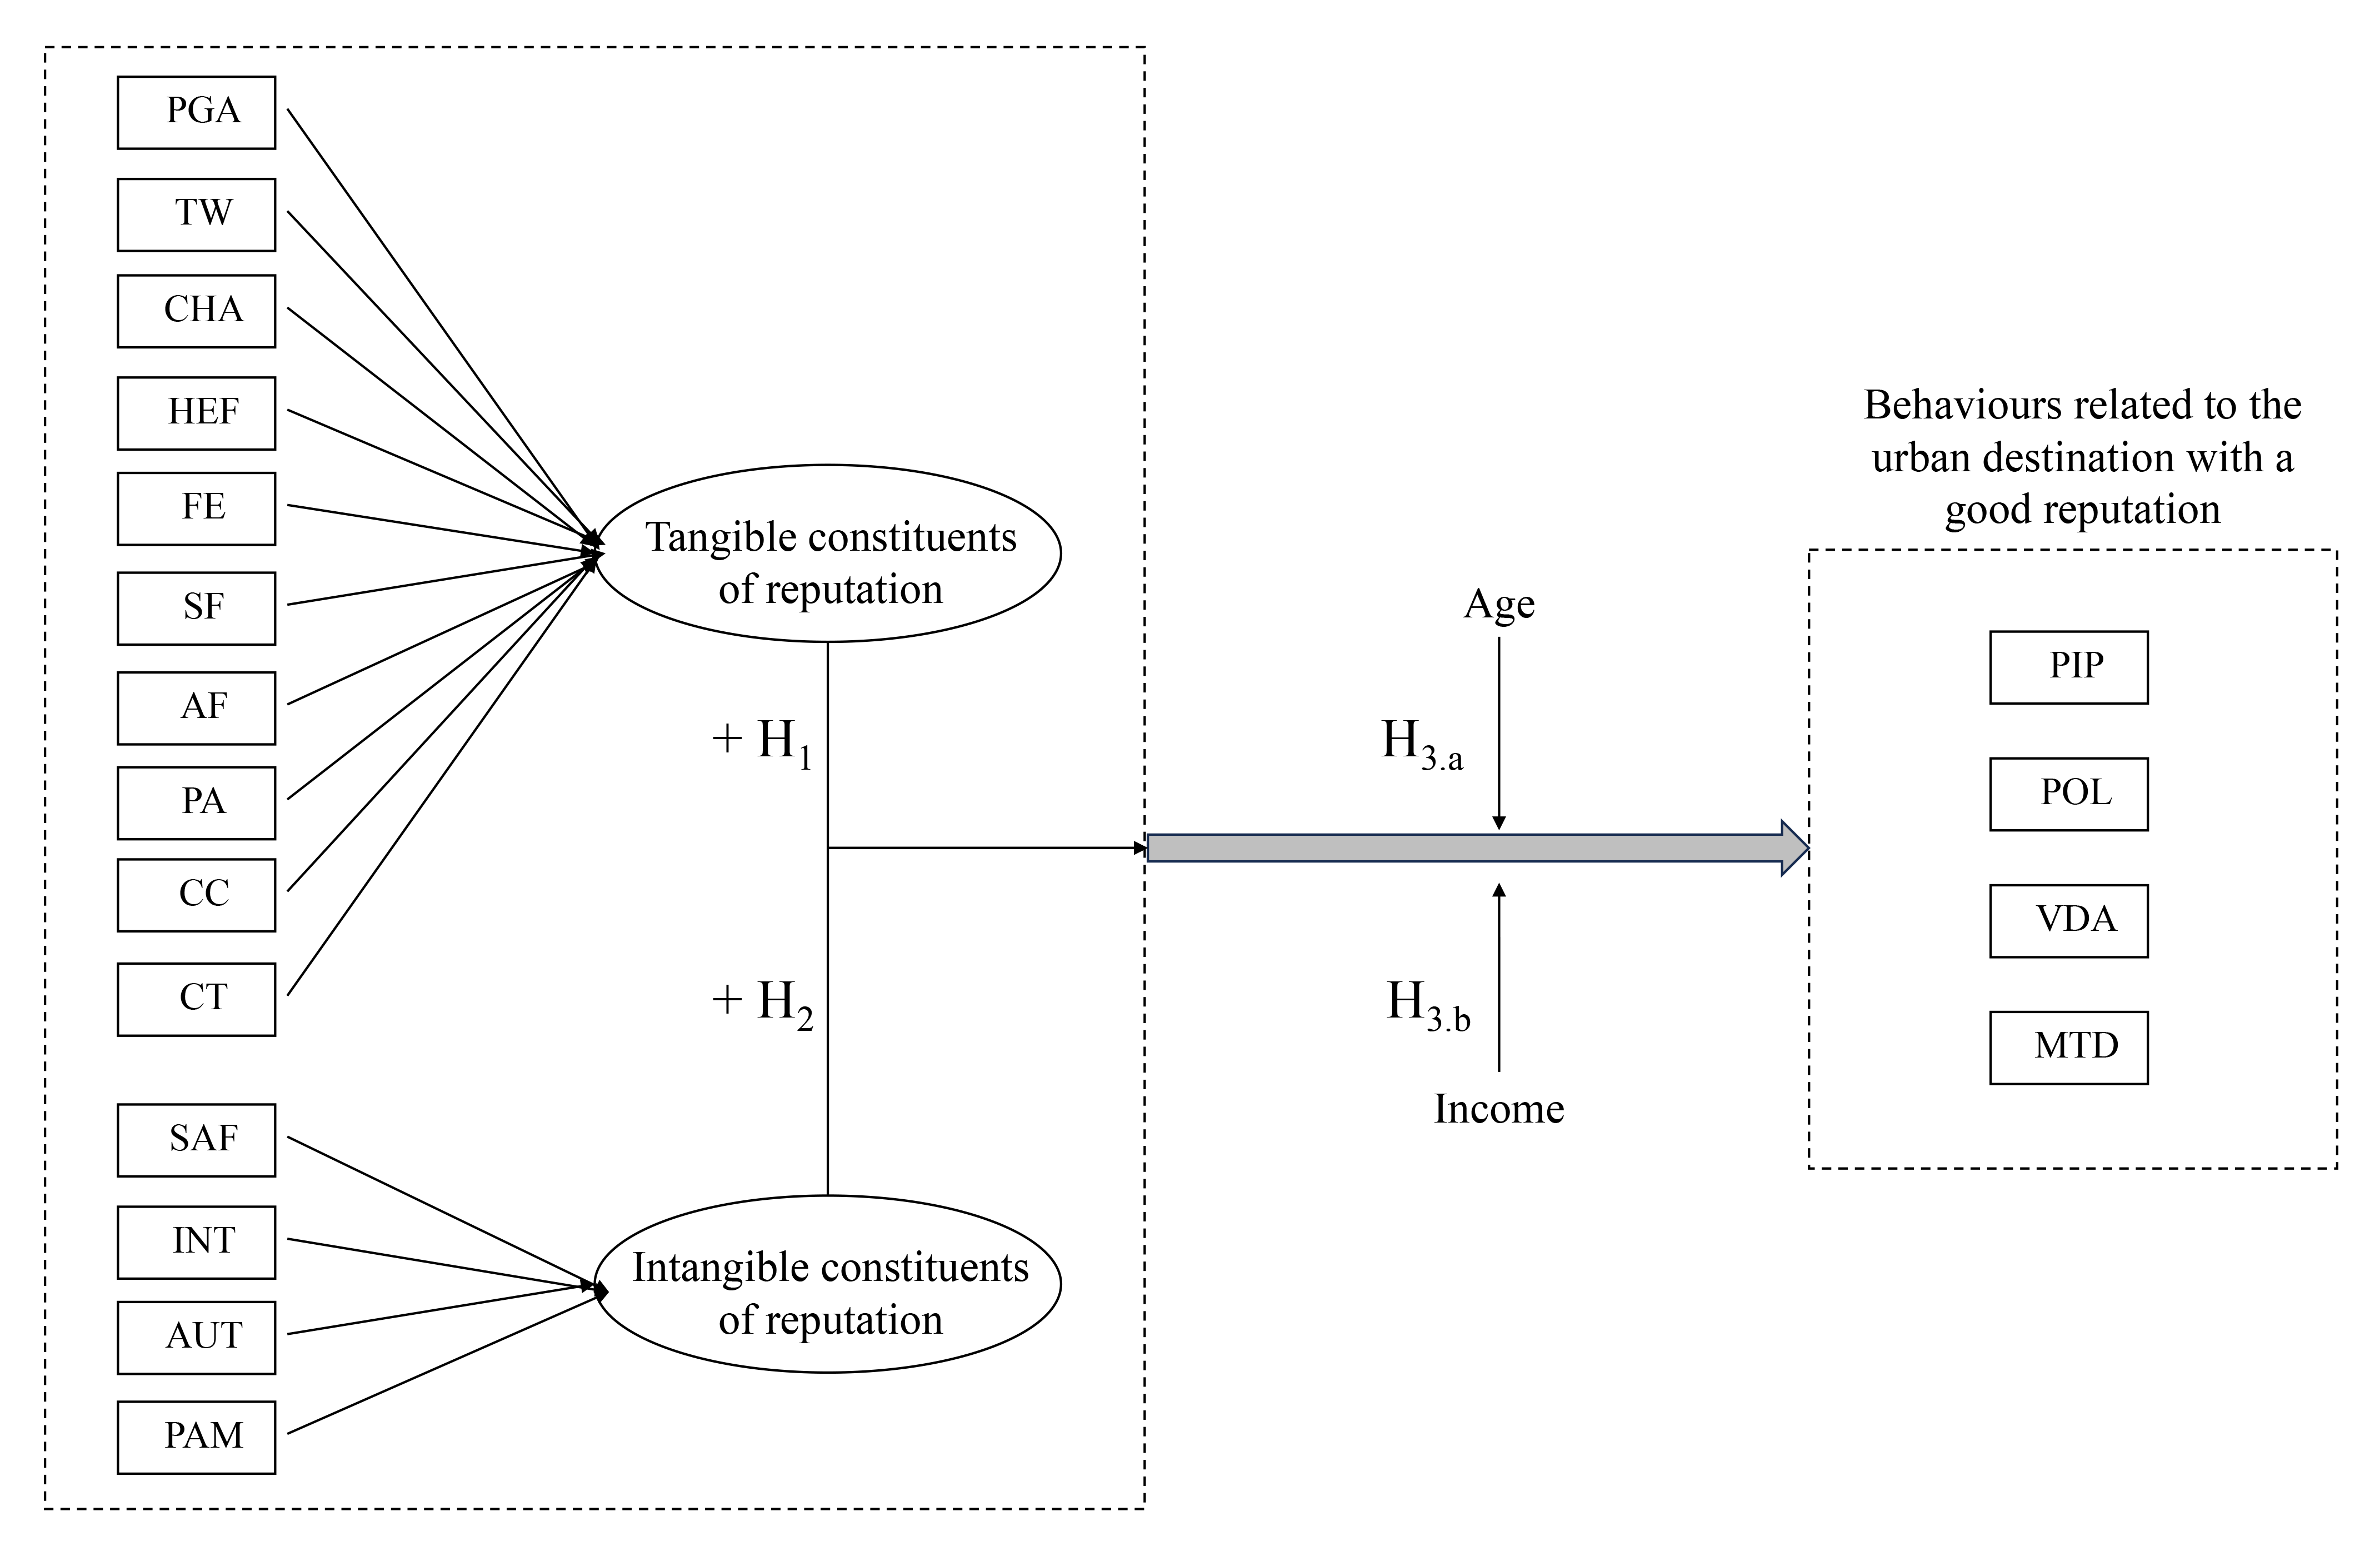 Fig. 1.
Proposed conceptual model. PGA, parks and green areas; TW, tourist attractions along the waterfront; CHA, cultural and historical attractions; HEF, hospitality and entertainment facilities; FE, festivals and events; SF, shopping facilities; AF, accommodation facilities; PA, price affordability; CC, cleanliness of the city; CT, convenient transportation and easy access to all tourist facilities in the city; SAF, safe; INT, interesting; AUT, authentic; PAM, pleasant ambience; PIP, Positive review and recommendation in person; POL, positive online review and recommendation; VDA, willingness to visit destination again; MTD, Willingness to permanently move to destination.
An empirical study was conducted on a representative sample to determine the causality of the relationship between the quality of tourists’ experience with certain constituents of reputation and their intentions and behaviours towards that urban tourist destination. For the purposes of the study, 376 residents of Belgrade, as the capital and emitting centre of the Republic of Serbia, were selected. The data collection process was conducted by a marketing research agency which has access to a representative sample of the Belgrade population.
The type of research involved a representative, random, stratified sample. Computer-aided web interviewing (CAWI) was chosen as the method of data collection. The respondents were surveyed in July 2020. At the beginning of the survey, there were a couple of eliminatory questions. First, respondents who reported not having visited at least two cities outside their own country in the past five years were not considered suitable for the research, since it was aimed at individuals with recent travel experience. It is believed that their answers would be more trustworthy due to their international travel and the presumption that their memories and impressions of the visited places are still fresh. Second, respondents who had visited cities in passing on their way to their ultimate destination or during a one-day excursion to a city while staying at another destination were not included in the study, because the research aimed for the respondents who spent several days at a tourist destination so they could experience it more profoundly. Finally, tourism professionals were excluded from the sample, as they pay attention to details that are not important to “regular” tourists. It was believed that their answers would influence and distort the research results.
Participants were asked to indicate one urban tourist destination they have visited and perceived as having a good reputation. Then they rated the quality of their experience with each tangible (PGA, TW, CHA, HEF, FE, SF, AF, PA, CC, and CT) and intangible (SAF, INT, AUT, PAM) constituent of reputation on a five-point Likert scale. All the questions were in the format “After visiting a particular destination, indicate the level of agreement with the following statements”, where a statement refers to a certain constituent of reputation. The answer scale for Tangible and Intangible constituents of reputation was: 1—I completely disagree, 3—I did not use/I do not know, 5—I completely agree. The questions related to each consequent behaviour (PIP, POL, VDA, MTD) were formulated as “After visiting a tourist destination, what is the probability that you would …?”. The answer scale for consequent behaviour was also a five-point Likert scale: 1—Not probable at all, 3—I do not know, 5—Highly probable/Sure.
The statistical method chosen to verify the proposed conceptual model and test the three research hypotheses was Structural Equation Modeling (SEM). SEM analysis integrates the principles of two well-acknowledged analyses: factor analysis and multiple linear regression (Kline, 2023). Factor analysis enables grouping variables into latent constructs, thus enabling the measurement of complex, multidimensional phenomena. At the same time, multiple linear regression allows for exploring relationships among these latent constructs and other measured variables within the model. Having in mind the main characteristics of SEM analysis, it has been used with a lot of success in conceptual model verification in various fields, including tourism and management science (for example, Chi and Qu, 2008; Estevão et al, 2015; Komazec et al, 2023). In the field of SEM, two algorithms are commonly employed: covariance-based (CB) SEM and partial least squares (PLS) SEM. For our study, we implemented CB-SEM using R and its package Lavaan (Rossel, 2024).
Multigroup SEM analysis (MG-SEM) is an extension of SEM analysis that allows for comparing SEM models evaluated on different respondent groups (Fischer and Karl, 2019). Namely, the same SEM model is created on several groups, and the model paths are compared to explore whether statistically significant differences exist between the evaluated models. In the employed Lavaan package, the MG-SEM is done in several steps. First, a constrained or free model is created and evaluated; a model in which the factor loadings, intercepts, and regression paths are equal across the groups. Second, an unconstrained or free model is created and evaluated; the model in which the regression paths are allowed to vary freely. Finally, Analysis of Variance (ANOVA) compares the two fitted models. The null hypothesis is that the models do not differ, while the alternative is that the models differ (Fischer and Karl, 2019).
Before the hypothesis testing and conceptual model verification, the sample’s descriptive statistics analysis was conducted, which is presented in Table 1.
| Characteristics | Categories | Percentage of the sample |
| Gender | Male | 45.2% |
| Female | 54.8% | |
| Age group | Baby boomers | 9.9% |
| Generation X | 34.3% | |
| Generation Y | 28.8% | |
| Generation Z | 26.9% | |
| Monthly income | Low income (up to 500 EUR) | 25.6% |
| Average income (501–1000 EUR) | 55.1% | |
| High income (above 1000 EUR) | 19.2% |
EUR, Euros.
When it comes to gender, a slight disproportion is visible. There are more female respondents than male respondents in the sample, 54.8% to 45.2%. Regarding the age of the respondents, generation classification was made according to the Pew Research Center (2019). Generation X (born between 1965 and 1980), Generation Y (born between 1981 and 1996), and Generation Z (born between 1997 and 2012) are almost equally represented. Finally, when the monthly income is observed, most respondents have an average income (55.1%), which encompasses a monthly income of 860 EUR (Statistical Office of the Republic of Serbia, 2020a). According to the same source, the average age of Belgrade residents was 42.5 years, and there are more female than male citizens in Serbia in general (Statistical Office of the Republic of Serbia, 2020b). Therefore, we can observe the sample as representative of the Belgrade population.
Before conducting the SEM analysis, we conducted the descriptive statistics of the respondents’ agreement on the statements related to the quality of the experience and behaviours associated with the urban destination with a good reputation. The results are presented in Table 2.
| Item | Parks and green areas (PGA) | Attractions along the waterfront (TW) | Cultural and historical attractions (CHA) | Hospitality and entertainment facilities (HEF) | Festivals and events (FE) | Shopping facilities (SF) |
| Mean | 4.40 | 4.30 | 4.72 | 4.61 | 4.36 | 4.47 |
| Std | 0.783 | 0.984 | 0.332 | 0.637 | 0.896 | 0.764 |
| Item | Accommodation facilities (AF) | Price affordability (PA) | Cleanliness of the city (CC) | Convenient transportation (CT) | Safe (SAF) | Interesting (INT) |
| Mean | 4.63 | 3.96 | 4.42 | 4.59 | 4.55 | 4.78 |
| Std | 0.629 | 1.189 | 0.777 | 0.702 | 0.659 | 0.478 |
| Item | Authentic (AUT) | Pleasant ambience (PAM) | PIP | POL | VDA | MTD |
| Mean | 4.73 | 4.78 | 3.77 | 3.26 | 4.67 | 3.65 |
| Std | 0.567 | 0.519 | 0.439 | 0.846 | 0.564 | 1.286 |
Note: PIP, Positive review and recommendation in person; POL, positive online review and recommendation; VDA, willingness to visit destination again; MTD, Willingness to permanently move to destination; Std, Standard deviation.
As presented in Table 2, the constituents rated the highest by respondents were intangible INT and PAM, with an average of 4.78. These two constituents have a relatively small standard deviation, indicating that the respondents’ answers were coherent. On the other hand, the constituent which ranked the lowest was tangible PA, with an average of 3.96 and a high standard deviation of 1.189. This result is expected since the average income of Serbian citizens is among the lowest in Europe (Eurostat, 2023), and most urban tourist destinations are not perceived as affordable. Regarding future behaviour, the mean values are somewhat lower. The average PIP and POL are 3.77 and 3.26. At the same time, the results indicate that respondents are willing to visit the destination with a good reputation again, as the mean VDA is 4.67, but are not so inclined to move to the destination since the mean value of this potential future behaviour is 3.65.
The analysis that could also provide valuable insights is the interdependence testing between the conceptual model’s dependent variables. Table 3 presents the obtained Spearman’s correlations.
| Correlations | PIP | POL | VDA | MTD |
| PIP | 1 | |||
| POL | 0.275** | 1 | ||
| VDA | 0.533** | 0.278** | 1 | |
| MTD | –0.029 | 0.022 | 0.268** | 1 |
Note: **p
Positive review and recommendation in person (PIP) is positively and significantly correlated with positive online review and recommendation (POL) and willingness to visit a destination again (VDA). However, the correlation between PIP and willingness to permanently move to a destination (MTD) is negative, low, and not statistically significant. The pattern is similar to POL, which is positively correlated with VDA but negatively and nonsignificantly with MTD. These results might indicate that if a person talks and posts positively about a destination, that might be a sign of their willingness to visit that destination again, but it cannot be a sign of their willingness to move to a destination permanently. On the other hand, a high VDA is related to a higher MTD.
Before conducting the SEM analysis, inspecting the internal consistency of the two latent constructs within the model was necessary. To do so, we used the Cronbach’s alpha (Cronbach, 1951). This coefficient ranges from 0 to 1, with values above 0.7 indicating good internal consistency (Gliem and Gliem, 2003). The measured values of Cronbach’s alpha per latent construct are presented in Table 4. Construct Tangible constituents of reputation (abbreviated Tangible) is formed out of 10 items and has the value of Cronbach’s alpha 0.757, slightly above the defined threshold. On the other side, Construct Intangible constituents of reputation (abbreviated Intangible) is formed out of 4 items and has somewhat better internal consistency. We can continue with the SEM modelling as both latent constructs have satisfactory results.
| Tangible constituents of reputation (Tangible) | Intangible constituents of reputation (Intangible) | |
| Number of items | 10 | 4 |
| Alpha | 0.757 | 0.854 |
In this model, we test the impact of Tangible and Intangible constituents of reputation on each of the four consequent intentions and behaviours toward the urban tourist destination (PIP, POL, VDA and MTD). The model is assessed by presenting and interpreting the value of the Chi-square statistics, the degrees of freedom (df), Comparative Fit Index (CFI), Tucker-Lewis Index (TLI), and the Root Mean Square Error of Approximation (RMSEA). The initial model results are Chi-square 396.979, df = 124, CFI = 0.853, TLI = 0.818, RMSEA = 0.084. Considering the model complexity and sample size, the obtained value of the Chi-square statistics is quite low. At the same time, the values of the CFI and TLI indices are close to the proposed threshold of 0.9 (Hu and Bentler, 1999). The RMSEA is slightly above the 0.08 borderline for acceptance. The initial fit of the data to the model is satisfactory; however, we slightly modified the model. None of the measured variables within the latent constructs were removed, as all p-values were below 0.001. To fine-tune the model, we used modification indices. The final model results are the following: Chi-square 289.297, df = 153, CFI = 0.904, TLI = 0.869, RMSEA = 0.071. The value of the Chi-square statistics decreased additionally, the CFI and TLI are above or closer to the 0.9 threshold, while the RMSEA is below 0.07. These results indicate a good fit to the data. Therefore, we can interpret the estimated model paths. The model estimation results are presented in Table 5. Before interpreting the results, it should be noted that in the following steps, the final model was used when the multigroup SEM analysis was performed. No additional alterations to the model were made.
| Related behaviour | Predictor(s) | Standardised coefficient | Z-value | p-value | R2 |
| Positive review and recommendation in person (PIP) | Tangible | –0.093 | –1.035 | 0.301 | 0.029 |
| Intangible | 0.217 | 2.505 | 0.012 | ||
| Positive online review and recommendation (POL) | Tangible | 0.296 | 3.263 | 0.001 | 0.129 |
| Intangible | 0.086 | 1.058 | 0.290 | ||
| Willingness to visit destination again (VDA) | Tangible | –0.015 | –0.173 | 0.863 | 0.066 |
| Intangible | 0.266 | 3.100 | 0.002 | ||
| Willingness to permanently move to destination (MTD) | Tangible | 0.064 | 0.721 | 0.471 | 0.028 |
| Intangible | 0.119 | 1.399 | 0.162 |
Looking at the first equation, the equation of PIP, we can see that only Intangible constituents of reputation are a statistically significant predictor. If the respondents are satisfied with the intangible constituents of reputation, and their satisfaction increases by 1 point on a Likert scale, their proneness to giving a positive review and recommendation in person (PIP) will increase by 0.217. The other predictor, Tangible constituents of reputation, proved to have a negative, non-significant impact on PIP. The two predictors explain just 2.9% of the variability of PIP.
Conversely, in the model of POL, it can be noted that only Tangible constituents of reputation are a statistically significant predictor. If the respondents are satisfied with the tangible constituents of reputation, and their satisfaction increases by 1 point on a Likert scale, their proneness to giving a positive review and recommendation online (POL) will increase by 0.296. The other predictor, Intangible constituents of reputation, proved to have a positive, non-significant impact on POL. The two predictors have good explanatory power and explain 12.9% of the variability of POL.
The model of VDA indicates that, again, only one constituent of reputation is a statistically significant predictor: Intangible constituents of reputation. The estimated regression coefficient is positive, indicating that the more the respondents are satisfied with the intangible constituents of reputation, the more likely they will consider visiting the destination again. However, this model explains only 6.6% of the variability of VDA. Considering that the decision to visit a destination again is a complex decision with multiple factors impacting the decision, this can be considered a good result.
Interestingly, when it comes to modelling the willingness to permanently move to a destination (MTD), neither of the two constituents of reputation is a statistically significant predictor. Both constituents have positive regression coefficients and impact, but they are not statistically significant. Even so, within the model, 2.8% of the variability of MTD is explained.
As presented above, the respondents were grouped into four age categories.
However, as only 10% of the sample are members of generation Baby Boomers, we
analysed the differences between the three remaining generations, X, Y, and Z,
due to group size disproportion. The first conducted test was to compare the
constrained and the free model, the model in which all paths were free to vary.
The chi-square value of the constrained model was 775.30, while the Chi-square
value of the free model was 741.06. The ANOVA showed statistically significant
differences between the two models, p
| Generation | ||||||||||
| X | Y | Z | ||||||||
| Related behaviour | Predictor | Std coef | p-value | R2 | Std coef | p-value | R2 | Std coef | p-value | R2 |
| Positive review and recommendation in person (PIP) | Tangible | 0.206 | 0.107 | 0.163 | 0.013 | 0.923 | 0.041 | –1.548 | 0.070 | 0.449 |
| Intangible | 0.251 | 0.038 | 0.195 | 0.137 | 1.427 | 0.059 | ||||
| Positive online review and recommendation (POL) | Tangible | 0.381 | 0.010 | 0.133 | 0.098 | 0.451 | 0.150 | 0.425 | 0.348 | 0.181 |
| Intangible | –0.031 | 0.794 | 0.329 | 0.010 | 0.001 | 0.999 | ||||
| Willingness to visit destination again (VDA) | Tangible | 0.144 | 0.277 | 0.039 | 0.104 | 0.450 | 0.034 | –0.460 | 0.367 | 0.043 |
| Intangible | 0.076 | 0.533 | 0.108 | 0.407 | 0.476 | 0.331 | ||||
| Willingness to permanently move to destination (MTD) | Tangible | 0.120 | 0.355 | 0.054 | 0.012 | 0.931 | 0.008 | 0.428 | 0.383 | 0.052 |
| Intangible | 0.142 | 0.246 | 0.083 | 0.528 | –0.253 | 0.590 | ||||
Within the model for Generation X, out of eight analysed paths, only two are statistically significant. We detected the positive impact of Intangible constituents of reputation on positive recommendation in person (PIP) and the positive impact of Tangible constituents of reputation on positive recommendation online (POL). On the other hand, in the model for Generation Y, only one statistically significant path was found. We detected the positive impact of Intangible constituents of reputation on positive recommendation online (POL). Finally and most interestingly, there were no statistically significant paths in the model for Generation Z. Members of the youngest generation are unaffected by the reputation’s tangible and intangible constituents. Namely, other factors have a more profound impact on their behaviour.
What is also notable to compare are the R2s between the age groups. For example, the quality of POL and VDA models does not differ between groups. However, there are visible differences between the PIP and VDA models. Looking at the PIP model, most variability is explained in the model of Generation Z. Although the two reputation constituents in the model are not statistically significant, they explain as much as 44.9% of the variability. Although not common, this situation might indicate that sometimes variables have a complementary mutual explanatory effect, which is not apparent when looking at the variables individually. At the same time, just 4.1% of the variability of PIP is explained within Generation Y. This shows that the members of the middle generation are not impressed by the reputation. The same generation members are not motivated to move to a destination (MTD) with an R2 of just 0.8%. On the contrary, Generation X and Z members are somewhat motivated by reputation (R2 is around 5% for both generations).
As presented above, the respondents were grouped into three income categories:
Low income, Average income, and High income. The same procedure was used as
presented in the previous section. The chi-square value of the constrained model
was 853.80, while the Chi-square value of the free model was 813.91. The ANOVA
showed statistically significant differences between the two models, p
| Income | ||||||||||
| Low income | Average income | High income | ||||||||
| Related behaviour | Predictor | Std coef | p-value | R2 | Std coef | p-value | R2 | Std coef | p-value | R2 |
| Positive review and recommendation in person (PIP) | Tangible | 0.334 | 0.066 | 0.149 | –0.202 | 0.068 | 0.038 | –0.330 | 0.241 | 0.047 |
| Intangible | 0.076 | 0.610 | 0.222 | 0.035 | 0.350 | 0.208 | ||||
| Positive online review and recommendation (POL) | Tangible | 0.272 | 0.113 | 0.169 | 0.205 | 0.057 | 0.087 | 0.874 | 0.004 | 0.276 |
| Intangible | 0.182 | 0.217 | 0.124 | 0.212 | –0.676 | 0.026 | ||||
| Willingness to visit destination again (VDA) | Tangible | 0.056 | 0.739 | 0.026 | 0.015 | 0.885 | 0.022 | –0.384 | 0.140 | 0.338 |
| Intangible | 0.121 | 0.438 | 0.141 | 0.171 | 0.840 | 0.005 | ||||
| Willingness to permanently move to destination (MTD) | Tangible | 0.059 | 0.724 | 0.028 | –0.010 | 0.927 | 0.011 | 0.425 | 0.113 | 0.157 |
| Intangible | 0.125 | 0.426 | 0.109 | 0.286 | –0.036 | 0.886 | ||||
Interestingly, no statistically significant paths were found in the model for those with low income. Members of this segment are not affected by the reputation’s tangible and intangible constituents. In the second group, where we observed those with average income, one statistically significant relationship was found. We detected the impact of intangible constituents on positive review and recommendation in person (PIP). The last model showed as many as three statistically significant paths. Looking at the model of positive online review and recommendation (POL), both tangible and intangible constituents of reputation proved to be statistically significant predictors. However, their impacts differ. The more satisfied these respondents are with tangible constituents, the more open they are to giving positive reviews and recommendations online. On the contrary, the more these respondents are satisfied with intangible constituents, the less open they are to providing positive reviews and recommendations online.
What is also notable to compare are the obtained R2s between the income groups. The explained levels of variability visibly vary between groups. Regarding PIP, most of its variability was explained in the low-income group (R2low = 14.9%). This might signal that lower-income individuals are more open to talking and sharing their travel experiences. Most variability of POL, VDA, and MTD is explained in the group with high income, 27.6%, 33.8%, and 15.7%, respectively. Such a result indicates that the destination’s reputation highly influences these individuals.
Prior research was either focused on proving that certain elements influence reputation (Ďaďo et al, 2020; Papadimitriou et al, 2018), that overall reputation affects the competitiveness and attractiveness of tourist destinations (Cillo et al, 2021; Darwish and Burns, 2019; Su et al, 2020) and has an impact on individual specific subsequent tourist intentions and behaviours towards a destination (Hassan and Soliman, 2021; Wang et al, 2021; Yamashita and Takata, 2020). However, this research provides a detailed insight into the correlation of individual constituents of reputation with numerous and various specific intentions and behaviours of tourists, which is important for the efficient management of urban tourist destinations. Also, the research explains this relationship considering tourists’ demographic characteristics.
As the conducted research and the proposed model lead to as many as twelve research hypotheses, an omnibus presentation on the research results and the acceptance and rejection of the research hypothesis is given in Table 8.
| Hypothesis | Sub-hypothesis | Overall model |
| H1 | H1.a | Reject |
| H1.b | Accept | |
| H1.c | Reject | |
| H1.d | Reject | |
| H2 | H2.a | Accept |
| H2.b | Reject | |
| H2.c | Accept | |
| H2.d | Reject | |
| Hypothesis | Sub-hypothesis | Multigroup analysis |
| H3 | H3.a | Accept |
| H3.b | Accept |
The research results have shown a certain level of relationship between the quality of experiences related to the constituents of reputation and the subsequent intentions and behaviours of the respondents. This finding indicates the importance of reputation for urban tourist destinations, which aligns with previous findings of some authors in the field (Shirvani Dastgerdi and De Luca, 2019; Su et al, 2018). The following can be concluded by observing the verification results of the overall model. Constituents of reputation are statistically significant predictors of certain behaviours toward the urban tourist destination. Therefore, hypotheses H1 and H2cannot be accepted, as not all observed relationships are statistically significant. Interestingly, in the four equations of tourist behaviour, there is no equation in which both tangible and intangible constituents are statistically significant predictors. The two predictors, Tangible and Intangible constituents, have a low explanatory power of the four behaviours toward the urban tourist destination, which ranges from 2.8% (MTD) to 12.9% (POL). Even if the explained variabilities are low, such a result could have been expected, bearing in mind that multiple factors impact the individuals’ behaviour related to a tourist destination. Low R2 was also obtained in the study by Abubakar and Mavondo (2014), who also used SEM analysis to model customer satisfaction and positive word of mouth on a tourist destination.
In addition to the above, the results related to the influence of age and income, as demographic indicators, on the examined variables can be of importance. The results of the multigroup SEM analysis showed that age and income moderate the relationships between tangible and intangible reputation constituents and the consequent behaviour of tourists, thus leading to acceptance of H3.
The research showed that the X generation tourists are more under the impression of the tangible aspects of a tourist destination, which motivates them to leave comments in the virtual space. When they are talking with friends, family, and acquaintances, they turn to talking about intangible aspects of a tourist destination. On the other hand, the millennial generation is more under the impression of the intangible aspects of a tourist destination, which motivates them to leave comments in the virtual space.
A valuable insight and implication can be the difference between tourists with different income levels in relation to intentions and behaviour towards urban tourist destinations. Considering that they have lower income when choosing a travelling destination, this category of tourists might not consider the destination’s reputation as much as price affordability, length of stay, and other budget-related aspects. On the other hand, the more respondents with average income are satisfied with intangible constituents, they are more open to giving positive review and recommendation in person they are. Also, it is important to notice that tourists with higher income are more comfortable talking about the destination they visited than talking about how they felt while visiting the destination. At the same time, these respondents are under the influence of intangible constituents when deciding to visit the same destination again. Presumably, if they have a higher income, they can afford to visit the same place again, so their previous experiences at a destination are impactful.
Having in mind the discussed results, several managerial implications can be formulated. For DMO, it is of particular importance that in the strategic process of creating and managing a good reputation of an urban tourist destination, they pay special attention to the management of quality experiences related to the constituents of the reputation, since their perception by tourists will increase the possibility for desired intentions and behaviours. This finding for destination management organisations implies the need to carefully create various interesting content such as festivals, events, entertainment, sightseeing tours, cultural and historical sights, and other activities. Concerning this, the above-mentioned contents should be made as attractive as possible to ensure tourists’ high-quality experiences, which will lead to a good reputation and consequently desired intentions and behaviours. Finally, the DMO should conduct marketing and public relations activities to establish adequate cooperation and quality relations with investors, the local population, tourism service providers, local governments, and all other key stakeholders on which the good reputation of the destination depends. Also, starting from the fact that tourism is an important activity for cities, it can be concluded that the consequent intentions and behaviours of tourists are important, both for urban tourist destinations and for the city itself, and its recognition, positioning on the global market and, consequently, the economy. The results also indicate that DMOs should create targeted marketing strategies for Generation X and Millennials. Gen X is more influenced by tangible aspects when leaving online comments, while Millennials focus on intangible aspects. For Gen X, it is recommended to emphasise tangible elements in online marketing materials, while highlighting intangible experiences for Millennials. The same accounts for the income-based segmentation. DMOs should keep in mind that low-income tourists focus on affordability and value propositions, that average-income tourists emphasise intangible experiences to encourage positive reviews and recommendations. In contrast, high-income tourists highlight both tangible and intangible aspects, with a focus on unique experiences that encourage repeat visits. Also, attention should be given to the online reputation management (Proserpio and Zervas, 2017) and actively manage both tangible and intangible aspects of the destination’s online presence. Additionally, it is advisable to encourage and monitor user-generated content, as well as work on repeat visitor strategies (Campo-Martínez et al, 2010).
The research presented in this paper offers empirical proof of a certain level of causality between identified reputation constituents and future intentions and behaviours. The results confirm the statement of Krstić et al (2016) about the importance of understanding the relationship between tangible and intangible aspects of reputation and consequent behaviour in the development of critical determinants of the travel and tourism sector’s competitiveness.
The relationship between the quality of experiences related to the constituents of reputation and subsequent intentions and behaviours is proven to be influenced by tourists’ demographics - their age and income. The intentions and behaviours of generation X, Y, and Z tourists differ concerning the impact of tangible and intangible constituents of reputation. Findings also confirm the differences between the respondents with low, average, and high incomes.
Given the increasing influence of social media, primarily the information conveyed by user-generated content, it is clear that destination management organisations should pay special attention to this type of reputational benefit for urban tourist destinations. Encouraging tourists to share their positive perception and experiences, especially with intangible reputational constituents of the urban tourist destination such as being safe, interesting, authentic and pleasant via social media will positively affect its competitiveness and attractiveness for other tourists.
The results of the study should be interpreted in light of its limitations. One limitation of the study is the sample. The research was focused solely on one CEE country (the Republic of Serbia) and one city (Belgrade). This approach, analysing only the perceptions of respondents from one city, can be seen in the literature. It includes the cases of Krakow (Kowalczyk-Anioł, 2023), Lisbon (Costa et al, 2020) and others. It would be interesting to conduct a similar study in other cities in Serbia or in the region and explore the differences in tourists’ behaviour and intentions, for example, Cillo et al (2021) observed three Italian destinations.
The second limitation is the specific touristic destination the respondents were answering the questions about. The respondents were asked to assess the tangible and intagible constitutients of the reputation of a destination they have visited and perceived as having a good reputation, while it could also be useful to capture the insights on the repondents’ perception of destinations with bad reputation. Ali et al (2021) did such a study, exploring the destination’s negative e-reputation in Marrakech, Morocco.
Several future directions of the study emerge. One direction would be the segmentation of tourists based on their pattern behaviour related to tangible and intangible aspects of reputation using advanced grouping algorithms of biclustering (Nikolić et al, 2022). Such an approach leads to creating specific, more precisely defined and explained segments, as respondents who behave similarly in relation to a certain subset of behaviour traits are grouped. Another direction could be to simulate the behaviour of tourists based on their perception of reputation constituents. For that, agent-based simulation (ABS) could be applied as shown by Živojinović and Zornić (2022).
Considering the results of the presented study and the managerial implications which derive from it, this study could be a valuable contribution to the tourism marketing and management literature within the CEE region that fills the literature gap detected and can act as an impetus for further research on the topic of tourist destination reputation management.
The data is available on a reasonable request after contacting the corresponding authors.
The introductory section was written by all authors equally. VP and TV performed the literature review and participated in model development. MM developed the hypothesis. VP, TV, and MKS designed the questionnaire, while VP was in charge for the data collection. MM was primarily responsible for the research methodology, data analysis, results presentation and interpretation. The discussion and conclusion were mainly written by MKS with the input of other co-authors. All authors contributed to editorial changes in the manuscript. All authors read and approved the final manuscript. All authors have participated sufficiently in the work and agreed to be accountable for all aspects of the work.
The authors would like to express their sincere gratitude to the Reviewers, whose insightful comments and suggestions greatly contributed to the development of this manuscript.
This research received no external funding.
The authors declare no conflict of interest.
References
Publisher’s Note: IMR Press stays neutral with regard to jurisdictional claims in published maps and institutional affiliations.