


 , Ruihui Zhou 2, Jianbin Guo 3
1 College of Accounting, Ningbo University of Finance & Economics, 315175 Ningbo, Zhejiang, China
2 College of Finance & Information, Ningbo University of Finance & Economics, 315175 Ningbo, Zhejiang, China
3 College of Economics and Management, Nanchang Hangkong University, 330063 Nanchang, Jiangxi, China
Abstract
Against the backdrop of global attention to sustainable development, in-depth research on the relationship between executive equity incentives and sustainable financial growth holds significant theoretical and practical value. Based on agency theory, this paper utilizes a long-term sample of Chinese A-share listed companies from 2006 to 2023 and employs a combined research method of propensity score matching (PSM) and difference-in-differences (DID) to conduct theoretical analysis and empirical testing. Theoretical analysis shows that equity incentives promote sustainable financial growth in companies by aligning the residual control rights of executives with the residual claim rights, and that two mainstream modes of equity incentive differ in their effects due to distinct contractual arrangements for human capital and physical capital investment by executives. Empirical results indicate that executive equity incentive events have a significant positive effect on corporate sustainable financial growth, both in the short and long term. Among these, restricted stock exhibits a significantly better incentive effect than stock options, performing better in both intensity and duration of the incentive effect. This study expands the research perspective on executive incentives and corporate sustainability and provides critical insights and recommendations for corporate governance practices, policy-making, and academic research.
Keywords
- corporate executives
- equity incentives
- equity incentive modes
- sustainable financial growth
With the global emphasis on sustainable development intensifying, corporate sustainable development has become a central concern for governments, academics, and practitioners worldwide. However, a prerequisite for achieving long-term corporate sustainability goals is sustainable financial growth, which is not only essential for the survival and development of enterprises but also critical to fulfilling businesses’ social responsibilities and promoting macroeconomic growth. A financially distressed firm can hardly address social responsibility effectively, let alone commit to long-term sustainability goals. Undoubtedly, whether pursuing sustainability through environmental, social, and governance (ESG) practices or directly engaging in corporate social responsibility (CSR), sustainable financial growth serves as a fundamental condition. Nevertheless, existing literature on corporate sustainability primarily focuses on corporate ESG performance (Zeng et al, 2023), ESG investment (Zhang and Yang, 2024), ESG disclosure (Khamisu and Paluri, 2024), and the determinants of achieving ESG sustainability goals (Wei and Xu, 2025), while paying limited attention to the crucial prerequisite of corporate sustainability, namely the sustainable financial growth of enterprises.
What does sustainable financial growth mean? According to Higgins (1977), it refers to the maximum rate at which a company’s sales can grow without depleting financial resources and without issuing new stocks, which is equal to the product of net profit margin on sales, asset turnover rate, equity multiplier, and earnings retention rate (Liu and Wang, 2024). However, Van Horne (1988), another financial scholar, believes that the sustainable growth rate is the maximum annual growth rate of a company’s sales based on the target values of operating profit margin, asset turnover rate, debt ratio, and dividend payout ratio (Liu and Xie, 2021). Although there are differences in the expression of definitions, both definitions refer to the sustainable growth of enterprise finance, which is different from macroeconomic sustainable growth that has received significant attention in academia, and also different from the sustainable growth of non-financial performance such as corporate environmental and social responsibility. Therefore, in order to distinguish and emphasize the corporate financial perspective, this paper uses the term “sustainable financial growth”.
Obviously, from the definition of sustainable financial growth for enterprises and the financial perspective of maximizing the interests of principals (shareholders), it is necessary to jointly reduce agency costs (such as increasing asset turnover) and improve business performance (such as increasing net profit margin on sales), and at the same time increase the equity multiplier and retained earnings, in order to improve the sustainable financial growth rate of enterprises as a whole. This contrasts with traditional short-term financial metrics such as return on equity (ROE) and return on assets (ROA), which focus solely on current performance. Sustainable financial growth rates emphasize long-term development needs, taking into account existing profitability, current earnings retention and distribution, asset utilization efficiency, and existing equity reserves, and therefore represent a more comprehensive financial performance variable reflecting long-term development capacity. Gleißner et al (2022) posit that sustainable financial growth is solely concerned with a company’s long-term financial security and is a crucial component of overall sustainability goals. Consequently, targeting the enhancement of sustainable financial growth rates as an incentive objective is a critical approach to guiding executives to focus on shareholder interests and commit to achieving long-term corporate sustainability goals.
To achieve sustainable financial growth, enterprises require effective governance structures and incentive mechanisms. Among these, executive equity incentives, as a crucial compensation mechanism, have long been considered an effective means of mitigating agency problems between owners and managers (Bebchuk and Fried, 2010; Chen, 2018; Jensen and Meckling, 1976; Zhao and Lu, 2024). Through interest bundling, they can encourage corporate executives to work hard to maximize shareholders’ interests while meeting participation constraints and incentive compatibility constraints, thereby improving corporate financial performance (Jensen and Meckling, 1976). Studies by Lian et al (2011) and Qu and Zhu (2017) have found that executive equity incentives significantly promote the growth of short-term financial performance metrics such as ROE and ROA. Bebchuk and Fried (2010) and Gopalan et al (2014) also found that the lock-up period stipulated in the equity incentive contract induces executives to pursue long-term interests, thus generating a continuous incentive effect. In this regard, Chen (2018) analyzed a sample of Chinese listed companies and conducted empirical tests, finding that executive equity incentives had a significant effect on short-term financial performance such as net profit margin on total assets (ROA) for three years. Meanwhile, some other literature focuses on the impact of equity incentives on earnings management (Fu et al, 2020), R&D investment (Hu and Hong, 2023), information disclosure and forecasting (Liu, 2017), among other factors. The latest research has begun to focus on the impact of executive equity incentives on corporate innovation performance (Bian et al, 2024), ESG performance (Zeng et al, 2023) and social responsibility performance (Zhao et al, 2024).
It can be seen that equity incentive mechanisms have received extensive attention, but research has primarily focused on the impact of equity incentives on short-term financial performance (such as ROE or ROA), innovation investment, or non-financial performance (such as ESG or CSR) in enterprises. Targeted research exploring the influence of equity incentives on sustainable financial growth, as well as the heterogeneous effects of different incentive modes, remains scarce, lacking systematic theoretical analysis and empirical validation. One potential reason for this gap may lie in the relatively recent adoption of formal incentive policies in Chinese enterprises. Consequently, there is an urgent need to confirm whether such policies are effective in improving short-term financial performance, rather than addressing the issue of financially sustainable growth from a long-term perspective.
It is worth noting that the Chinese capital market has undergone profound reforms over the past decade, especially in the areas of executive compensation and corporate governance, sharing similar historical processes with other large emerging market economies such as India, Indonesia, Malaysia, and Vietnam. However, China’s vast capital market and the government’s policy support for encouraging enterprises to implement equity incentive plans (with the equity incentive system formally introduced in January 2006) provide a quasi-natural experiment, lending this study greater representativeness and theoretical value. As more and more Chinese companies operate in the global market and other emerging economies promote sustainable development strategies while improving corporate governance systems, understanding the impact of equity incentives on corporate sustainable financial growth and sustainability goals has broader international implications. In this context, this paper selects a sample of Chinese A-share listed companies from 2006 to 2023 for empirical research, employing a combined research methodology of propensity score matching (PSM) and difference-in-differences (DID) to examine the average treatment effect and net effect of equity incentives and their different modes on the sustainable financial growth rate, as well as the duration of the incentive effect.
The results show: (1) Compared with the matched control group sample, the treatment group sample implementing equity incentives exhibits significant average treatment effects and net effects after the DID analysis on sustainable financial growth, with restricted stock incentives, where executives pre-invest with money in the incentive equity, demonstrating a significantly better incentive effect than stock options, where incentive equity is granted to executives free of charge. (2) From the long-term dynamic effect of the DID test results, equity incentive implementation has a significant positive impact on promoting the corporate sustainable financial growth rate within 1–4 periods after implementation, and the duration of the incentive effect of restricted stock is significantly longer than that of stock options. Furthermore, further research has also found that corporate sustainable financial growth capability is indeed an important prerequisite for achieving sustainability goals (such as ESG performance), and sustainable financial growth is an important mediating variable between executive incentives and the achievement of long-term sustainability goals. The findings of this research offer multifaceted implications for modern corporate governance practices, policy formulation, and academic research. Specifically, the research provides valuable theoretical references and practical guidance for corporate governance under the concept of sustainable development, the optimization of executive incentive contract structures, the selection of equity-based incentive modes, and academic research on corporate sustainability.
This research makes the following three primary contributions: First, using an 18-year panel dataset, this paper examines the long-term impact of equity incentive plans on the sustainable financial growth of Chinese A-share listed companies. By focusing on the financial capacity to achieve sustainability goals from the perspective of sustainable development theory, this study extends the existing literature that primarily examines the impact of equity incentives on traditional short-term financial performance and often overlooks the heterogeneous effects of different incentive modes. Second, the research provides a mechanistic analysis of how equity incentives, and their varying modes, influence a firm’s capacity for sustainable financial growth. This analysis offers valuable practical and theoretical insights for investors, policymakers, and academics interested in sustainable development within the Chinese capital market. For example, we analyze the differences in rights, obligations, and risk-bearing capacity between stock options and restricted stock, the two dominant incentive modes, based on executives’ opportunistic behavior and risk-taking propensity under scenarios involving investments of human capital (non-collateralizable) and physical capital (collateralizable). This provides valuable insights for understanding the differing incentive modes at play. Furthermore, our findings on the effectiveness of different equity incentive modes offer policy implications for designing and optimizing equity incentive schemes. Investors can utilize our results to assess the impact of corporate equity incentives on long-term sustainable financial growth, thereby informing more precise investment strategies. Third, this study enriches the understanding of equity incentive applications and their incentive effects within the context of sustainable development in the Chinese capital market. It provides new theoretical perspectives and empirical evidence for future research on the relationship between corporate incentive mechanisms and sustainability goals. Our findings also offer valuable policy and practical insights for similar emerging economies, such as India, Indonesia, Malaysia, and Vietnam, which face comparable challenges in promoting sustainable development strategies and enhancing corporate governance.
The remainder of this paper is structured as follows: Section 2 provides the theoretical analysis and research hypotheses; Section 3 outlines the design of the study; Section 4 presents the empirical results; and Section 5 concludes with a discussion of the findings and their implications.
In modern corporate governance, the principal-agent problem is a key factor influencing firm performance and sustainable development (Alchian and Demsetz, 1972; Jensen and Meckling, 1976). According to agency theory, executives, as agents, make operational decisions and take actions that directly affect the firm’s strategic direction and performance (Fama and Jensen, 1983; Jensen and Meckling, 1976). Under conditions of information asymmetry, agency contracts are incomplete (Grossman and Hart, 1986; Hart and Moore, 1990), creating opportunities for executives to pursue their own self-interest at the expense of shareholder value, thus generating agency costs (Holmström, 1979; Jensen and Murphy, 1990; Murphy, 1985). A fundamental approach to mitigating this agency problem is to grant executives, as agents, a share in the firm’s residual earnings—that is, to grant them residual claim rights—aligning their incentives with those of the principals (Alchian and Demsetz, 1972; Fama and Jensen, 1983; Grossman and Hart, 1986). Equity incentives are a quintessential practical application of this theoretical concept (Jensen and Meckling, 1976). The underlying logic is to provide agents with residual claim rights, subject to participation constraints, thereby incentivizing them to act in an incentive-compatible manner based on their own self-interest, ultimately leading to a Nash equilibrium that maximizes the interests of both principals and agents (Holmström and Milgrom, 1987; Holmström, 1982; Murphy, 1985). The direct result is that agents, by exerting greater effort, reduce agency costs and simultaneously increase both their own and the principals’ returns (Murphy, 1999; Shleifer and Vishny, 1997). This, in turn, establishes both subjective and objective conditions for the firm to achieve long-term sustainable development goals. Subjectively, it strengthens executives’ willingness to exert effort and adopt a long-term perspective. Objectively, it enhances the firm’s capacity for sustainable financial growth, thus providing the financial resources necessary to pursue long-term sustainable development goals, such as ESG and CSR performance.
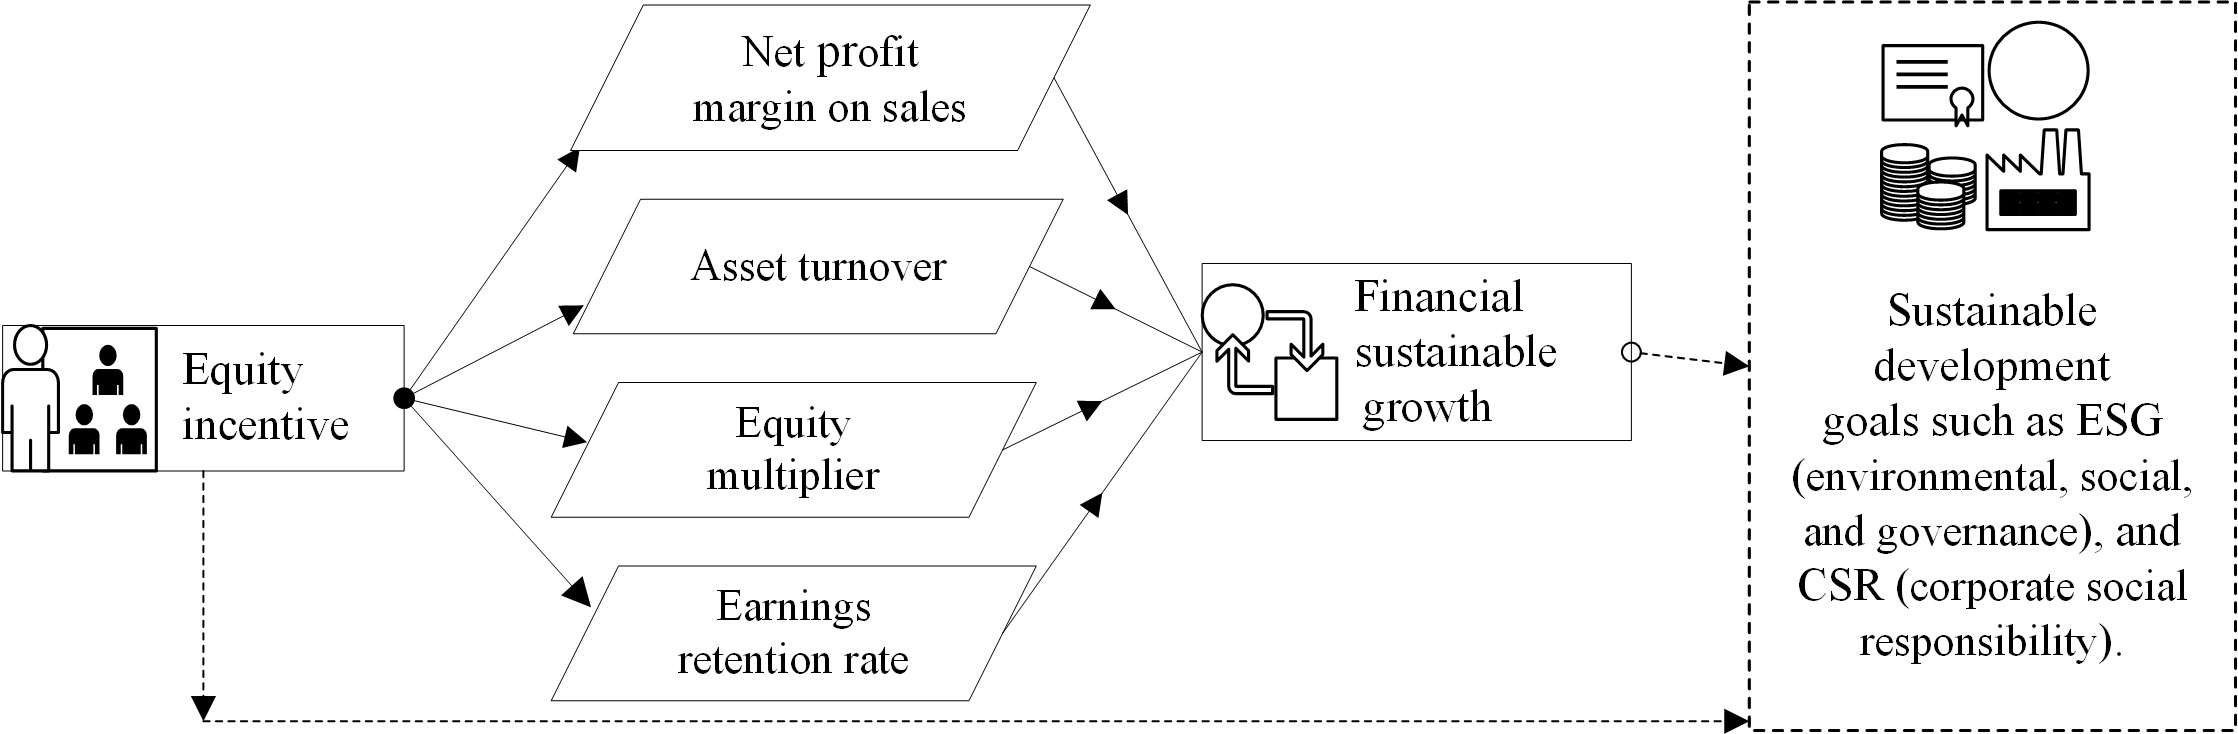
The models of sustainable financial growth demonstrate that a firm’s sustainable growth rate depends on several factors, including net profit margin on sales, asset turnover, financial leverage (equity multiplier), and earnings retention rate (Higgins, 1977; Van Horne, 1988). Within the incentive framework of sustainable development goals, if executive equity incentives positively influence these four factors, they are likely to promote sustainable financial growth. This logical relationship is illustrated in Fig. 1. Equity incentives may not only directly influence corporate sustainable development goals (e.g., ESG performance) but also indirectly affect them through the mediating path of sustainable financial growth. This mediating variable, the sustainable financial growth rate, is determined by the four factors mentioned above. The theoretical logic of equity incentives suggests that by motivating executives to reduce agency costs and improve operational performance, these incentives can positively impact the determinants of sustainable financial growth. The existing literature on executive equity incentives and firm performance often uses asset turnover as a proxy for agency costs and return on equity (ROE) as a measure of operating performance. Notably, ROE is the product of net profit margin on sales, asset turnover, and equity multiplier, and equity incentives are shown to enhance these short-term financial performance measures (Chen, 2018; Lian et al, 2011; Zhao and Lu, 2024).
 Fig. 1.
Analysis path of the impact of equity incentives on sustainable financial growth.
From the perspective of the action mechanism of the four influencing factors through which equity incentives affect sustainable financial growth, Coles et al (2006) find that after implementing equity incentives, executives, in pursuit of maximizing returns corresponding to their residual claim rights, place greater emphasis on product innovation and market expansion. They enhance product quality, optimize marketing strategies, and enhance profitability, thereby increasing net profit margin on sales. Simultaneously, they are motivated to strengthen internal management, optimize operational processes, and achieve sales growth without increasing resource inputs, thus improving asset turnover (Bloom and Van Reenen, 2010). Furthermore, they pay closer attention to corporate financing and profit distribution policies. On the one hand, their willingness to bear risk increases, potentially leading them to utilize debt financing strategically to enhance financial leverage (Coles et al, 2006; Graham and Harvey, 2001). On the other hand, they prioritize internal capital accumulation, adjusting the earnings retention rate to provide greater financial support for future development (La Porta et al, 2000). These efforts not only contribute to improved short-term performance but, more importantly, positively influence long-term sustainable development by driving an increase in the sustainable financial growth rate.
The preceding theoretical analysis suggests that the implementation of equity incentive plans in listed companies will generally have a significant positive effect on promoting sustainable financial growth. Given that most equity incentive agreements include vesting or waiting periods exceeding three years, aligning executives’ interests with the long-term interests of the company, the motivation for executives to reduce agency costs and improve operating performance will remain consistent with that of external shareholders over an extended period. Therefore, the positive effect of executive equity incentives on sustainable financial growth is likely to be sustained. This assertion is supported by existing research on the lasting impact of executive equity incentives on short-term firm performance. For instance, Chen (2018) found a significant positive effect on ROA over a period of 3–4 years attributable to executive equity incentives. Accordingly, the following hypotheses are proposed:
H1: Equity incentive events have a significant positive effect on promoting sustainable financial growth.
H2: The positive effect of equity incentive events on promoting sustainable financial growth is lasting and observable over an extended period.
Both stock options and restricted stock represent two primary modes of equity incentives because they possess distinct functional characteristics (Li, 2008). Otherwise, combining the two into one would lower policy costs. Existing research identifies key differences between these two primary equity incentive modes in terms of their rights and obligations: (1) Stock options, being option-based, do not require an upfront physical capital investment from the recipient. Vesting periods are typically shorter, often granting the right to exercise options after one year, provided the stipulated vesting conditions are met. However, if these conditions are not met, there is no obligation to exercise. Specifically, if the stock price falls below the exercise price, executives can avoid losses by choosing not to exercise, thus avoiding downside risk. This offers a convex payoff profile without a penalty function. Therefore, the rights and obligations associated with stock options are asymmetrical (Lovett et al, 2022; Xu et al, 2017), potentially providing greater opportunity for managerial opportunism (Barzel, 1977; Zhang, 2016). (2) Restricted stock, being stock-based, requires recipients to purchase shares upfront at a predetermined price (For example, the China Securities Regulatory Commission’s “Administrative Measures for Equity Incentives of Listed Companies” stipulates that the grant price of restricted stock cannot be less than 50% of the average trading price of the company’s stock on a specific date). During the lock-up period, regardless of stock price fluctuations, the shares cannot be sold. After the lock-up period, a multi-year unlocking period, typically exceeding three years, is generally implemented. Throughout both the lock-up and unlocking periods, the recipient bears the full risk and reward of stock price movements. The contract delivers a linear payoff profile with a penalty function. Therefore, the rights and obligations of restricted stock are symmetrical (Hua et al, 2023; Li, 2008), which satisfies the efficiency principle of equivalence or basic equivalence between the benefits and risks of the incentive object (Xu et al, 2017), and enables senior executives to assume the classical role of combining management rights and ownership.
Based on the functional characteristics of stock options and restricted stock, the incentive effect of stock options is characterized by asymmetric returns and risks (unlimited upside potential but limited downside risk), which enhances executives’ willingness to take risks. This is because executives receive residual claim rights free of charge upfront, corresponding to managerial human capital (Hua et al, 2023). Due to the non-collateralizable nature of human capital, executives do not bear substantial loss risks, which provides greater opportunistic space for executives (Barzel, 1977; Zhang, 2016), thus increasing executives’ propensity for risk-taking and leading to a stronger short-term orientation. Executives are especially sensitive to short-term stock price fluctuations, which can significantly affect the value of stock options. Therefore, executives might choose managerial decisions that can rapidly increase the stock price, such as overinvesting in projects that can improve performance in the short term but are detrimental to the firm’s long-term competitiveness or engaging in earnings management to meet exercise conditions (Bergstresser and Philippon, 2006). While these actions may improve the firm’s financial performance in the short term, they may, in the long run, damage the firm’s sustainable development capacity and weaken its capacity for sustainable financial growth. In contrast, the restricted stock incentive mode requires executives to invest physical capital upfront to purchase shares and bear all the risks associated with stock price fluctuations during the lock-up and unlocking period, making executives’ interests more closely aligned with those of shareholders, with more symmetrical rights and obligations (Bettis et al, 2005; Bryan et al, 2000). Therefore, when making decisions, executives consider not only short-term interests but also the firm’s long-term development because their personal wealth is closely linked to the firm’s long-term value. For example, executives will make more prudent investment decisions, prioritizing projects that are conducive to the firm’s long-term development and value enhancement, even if these projects may not bring significant performance improvement in the short term (Balsam and Miharjo, 2007; Edmans et al, 2017; Hall and Murphy, 2003). Simultaneously, when facing risks, executives will take more active measures to cope because they cannot avoid losses by abandoning their rights to exercise like stock options (Coles et al, 2006). This pattern of behavior helps the firm maintain a stable development trend, improves the firm’s long-term competitiveness, and thus has a more positive and lasting impact on the firm’s sustainable financial growth.
According to the above theoretical analysis, we expect that different equity incentive modes will have significantly different effects on promoting sustainable financial growth. Overall, the incentive effect of restricted stock is likely to be superior to that of stock options. Furthermore, due to the differences in risk-bearing and interest alignment between the two incentive modes, the duration of their effects may also differ. Restricted stock, with its longer vesting and lock-up periods and inherent downside risk, encourages executives to focus on the long-term stable development of the company. Consequently, the duration of its incentive effect is likely to exceed that of stock options. Therefore, we propose the following hypotheses:
H3: Different equity incentive modes have different effects on promoting sustainable financial growth. In general, the incentive effect of restricted stock is superior to that of stock options.
H4: The duration of the incentive effects on sustainable financial growth varies across different equity incentive modes. In general, the incentive effect of restricted stock lasts longer than that of stock options.
The implementation of equity incentive plans by listed companies may be a self-selection process. Firm performance and other characteristics may jointly influence the adoption of such plans, potentially introducing sample selection bias into ordinary least squares (OLS)-based empirical models of equity incentive effects. In recent years, an increasing number of scholars have adopted PSM, a method widely used in evaluating macroeconomic policy effects, to mitigate this endogeneity issue. This method overcomes the limitations of traditional variable matching techniques, which struggle with high-dimensional matching, effectively reducing sample selection bias (Qu and Zhu, 2017). However, PSM only matches based on a limited set of observable covariates. Perfect matching is rarely achieved, meaning that pre-existing differences in outcome variables between treatment and control groups before equity incentives are implemented may not be fully eliminated. Furthermore, the effect of unobservable covariates cannot be excluded. To address this limitation, DID estimation can effectively control for both pre-existing differences and time trends in unobservable factors. DID, a well-established method originating from natural experiment research, isolates the net effect of a treatment by comparing the changes in outcomes over time between the treatment and control groups. Therefore, we employ a combined approach of PSM and DID to empirically examine the effect and duration of equity incentive events, as well as the differential effects of various equity incentive modes, on corporate sustainable financial growth.
Based on the research objectives and hypotheses of this paper, we first use PSM to identify a control group sample matched with the treatment group sample. Therefore, it is necessary to specify the logistic regression model involved in PSM. The model specification follows the general practice of existing studies (Chen, 2018; Lian et al, 2011; Qu and Zhu, 2017). To avoid reverse causality or sample self-selection endogeneity, and also considering that equity incentive implementation decisions are usually based on various characteristics of the firm in the past, we employ variables related to firm-specific characteristics, firm financial characteristics, corporate internal governance, and shareholder governance in the previous year as the determinants of equity incentive implementation. A binary logistic regression model is constructed with the occurrence of an equity incentive event (represented by TREATED) as the dependent variable. PSM is then used to obtain the average treatment effect on the treated (ATT) of the treatment group sample relative to the control group sample for equity incentives and their different modes. Next, we employ the DID method, using PSM-matched treatment and control group samples, to examine the overall incentive effect of equity incentives and their different modes on corporate sustainable financial growth. Specifically, we use fixed-effects OLS regression on the PSM-matched sample, with the sustainable financial growth rate as the dependent variable, equity incentive events and different modes of equity incentives as independent variables, and the aforementioned variables related to firm-specific characteristics, firm financial characteristics, corporate internal governance, and shareholder governance in the previous year as control variables. Finally, we conduct a period-by-period DID analysis to assess the persistent incentive effects of equity incentives and their different modes. We perform the fixed-effects OLS regressions separately for each period after the equity incentive event, against the first observed period before the equity incentive event. The regression models also use the aforementioned variables related to firm-specific characteristics, firm financial characteristics, corporate internal governance, and shareholder governance in the previous year as control variables. These econometric models are specified as follows:
(1) Logistic regression model for the occurrence of equity incentive events:
(2) DID regression model for the effect of equity incentives and different incentive modes:
In Eqns. 1,2, the subscript it denotes firm i in period
t, and i, t-1 denotes firm i in period
t-1. µ represents the fixed effect of
firm-specific characteristics, and
where NPM represents net profit margin on sales, TAT
represents total asset turnover, EM represents the equity multiplier,
and ERT represents the earnings retention ratio. In Eqn. 3 (Van Horne
model), the equity multiplier is calculated using ending net assets, while in
Eqn. 4 (Higgins
model), it is calculated using beginning net assets. In the DID
regression model (Eqn. 2), the interaction term
TREATED
| Variable type | Variable name | Variable symbol | Variable definition |
| Outcome variables | Van Horne sustainable growth rate | VSGR | Calculated using the Van Horne sustainable growth rate formula |
| Higgins sustainable growth rate | HSGR | Calculated using the Higgins sustainable growth rate formula | |
| Explanatory variable | Equity incentive implementation | INCENT | 1 if an equity incentive plan is implemented in the initial period, 0 otherwise |
| Stock options incentive mode | OPTION | 1 if a stock options incentive plan is implemented in the initial period, 0 otherwise | |
| Restricted stock incentive mode | RESTOCK | 1 if a restricted stock incentive plan is implemented in the initial period, 0 otherwise | |
| Control variables | Total assets | LNTA | Natural logarithm of total assets |
| Leverage ratio | LEV | Ratio of total liabilities to total assets at year-end | |
| Return on equity | ROE | Ratio of net income to year-end net assets | |
| Operating revenue growth rate | ORGR | Year-on-year growth rate of operating income | |
| Management compensation | LNMPAY | Natural logarithm of total compensation for directors, supervisors, and executives | |
| Management ownership | MMSR | Ratio of shares held by directors, supervisors, and executives to total shares outstanding | |
| Ceo duality | DUAL | 1 if the chairman and CEO are the same person, 0 otherwise | |
| Board size | BOARD | Total number of board members | |
| Proportion of independent directors | INBOARD | Ratio of independent directors to total board members | |
| Largest shareholder ownership | SHARE1 | Ratio of shares held by the largest shareholder to total shares outstanding | |
| Institutional investor ownership | INSTITUHP | Ratio of shares held by institutional investors to total shares outstanding | |
| Equity concentration | ECONCENT | Sum of squared ownership percentages of the top ten shareholders | |
| Equity balance | EBALANCE | Ratio of the second largest shareholder’s ownership to the largest shareholder’s ownership | |
| Firm ownership type | STATE | 1 if state-controlled, 0 otherwise | |
| Stock market sector | MARKET | 1 for main board, 2 for small and medium-sized enterprise board, 3 for growth enterprise board, 4 for science and technology enterprise board | |
| Industry | INDUSTRY | Classified according to the China Securities Regulatory Commission’s 2012 “Guidelines for Industry Classification of Listed Companies” |
This paper collects data from Chinese A-share listed companies spanning 18 years
from 2006 to 2023 from the China Stock Market & Accounting Research (CSMAR)
Database as the initial research sample. The data starts from 2006 because the
Chinese government’s policy guidance on the implementation of equity incentives
for listed companies officially came into effect in January 2006. Following prior
literature (Chen, 2018; Lian et al, 2011), we exclude financial firms
(banks, insurance, and securities companies), companies issuing B stocks only
(companies whose stocks are denominated in RMB but subscribed and traded in
foreign currencies), observations of treatment group companies in years when no
equity incentives were implemented (to avoid self-matching in PSM), and
observations with significant missing data. Additionally, we exclude samples that
implemented both stock options and restricted stock in the same year, samples
that did not enter the implementation phase, and samples implementing stock
appreciation rights (accounting for less than 0.1% of the sample). This process
yields 24,682 initial control group observations that have never implemented
equity incentives and 4027 observations from the first year of equity incentive
implementation. Combining these results yields a total of 28,709 observations
used as the research sample for Logit regression estimation in PSM. Using
nearest-neighbor one-to-one matching without replacement (with a caliper of
0.01), 2817 observations of the treated group were successfully matched. Thus, we
obtain 5634 matched paired observations after the equity incentive event (i.e.,
when Time = 1, 2817
Table 2 reports the descriptive statistics of the relevant variables. The results show that the average number of observations in the first year of equity incentive implementation is 14% (covering 2588 listed companies), accounting for approximately 50.55% of all listed companies (as of December 31, 2023, the total number of A-share listed companies in China was 5120), indicating a sufficient number of treatment and control group companies for PSM. Among the first-year implementation samples, approximately 46.9% adopted the stock option incentive mode, and 53.1% adopted the restricted stock incentive mode. This suggests that over the past 18 years, Chinese listed companies have generally preferred restricted stock when choosing equity incentive modes. Therefore, it is necessary to identify the differences in the incentive effects of different equity incentive modes to provide policy recommendations for listed companies to make more reasonable decisions. Furthermore, among the independent variables, the standard deviations of the firm-specific characteristic variables are relatively small. However, the standard deviations are relatively large for the financial characteristics variables that reflect performance and for most of the corporate internal governance and shareholder governance variables. This implies that there is likely a sample self-selection bias endogeneity problem related to whether an equity incentive event occurs. This demonstrates the rationality of using a combined research methodology of PSM and DID, which can effectively eliminate the endogeneity problem of sample self-selection bias.
| Variables | Observations | Mean | Standard deviation | Minimum | Median | Maxim |
| VSGR | 28,709 | 0.0476 | 0.1545 | –0.6835 | 0.0493 | 0.5566 |
| HSGR | 28,709 | 0.0294 | 0.1495 | –0.7739 | 0.0413 | 0.4129 |
| INCENT | 28,709 | 0.1403 | 0.3473 | 0 | 0 | 1 |
| OPTION | 28,709 | 0.0658 | 0.2480 | 0 | 0 | 1 |
| RESTOCK | 28,709 | 0.0744 | 0.2625 | 0 | 0 | 1 |
| LNTA | 28,709 | 21.9601 | 1.4042 | 18.9503 | 21.8023 | 26.1129 |
| LEV | 28,709 | 0.4450 | 0.2245 | 0.0510 | 0.4322 | 1.0361 |
| ROE | 28,709 | 0.0464 | 0.1790 | –1.1023 | 0.0663 | 0.3669 |
| ORGR | 28,709 | 0.3814 | 1.1605 | –0.7774 | 0.0980 | 7.8018 |
| LNMPAY | 28,709 | 15.1820 | 0.8281 | 12.9945 | 15.2124 | 17.3269 |
| MMSR | 28,709 | 0.0889 | 0.1716 | 0 | 0 | 0.6708 |
| DUAL | 28,709 | 0.3229 | 0.4676 | 0 | 0 | 1 |
| BOARD | 28,709 | 10.0458 | 2.7059 | 0 | 9 | 31 |
| INBOARD | 28,709 | 0.3762 | 0.0722 | 0 | 0.3636 | 0.8000 |
| SHARE1 | 28,709 | 0.3547 | 0.1543 | 0.0845 | 0.3326 | 0.7498 |
| INSTITUHP | 28,709 | 0.3846 | 0.2594 | 0.0016 | 0.3848 | 0.9164 |
| ECONCENT | 28,709 | 0.1718 | 0.1196 | 0.0148 | 0.1426 | 0.5568 |
| EBALANCE | 28,709 | 0.3491 | 0.2885 | 0.0090 | 0.2626 | 0.9964 |
| STATE | 28,709 | 0.4318 | 0.4953 | 0 | 0 | 1 |
| MARKET | 28,709 | 1.5410 | 0.8409 | 1 | 1 | 4 |
Note: The total sample size of 28,709 includes 24,682 initial control group observation that never implemented equity incentives and 4027 observations in the first year of equity incentives implementation (including 1890 stock option implementation observations and 2137 restricted stock implementation observations).
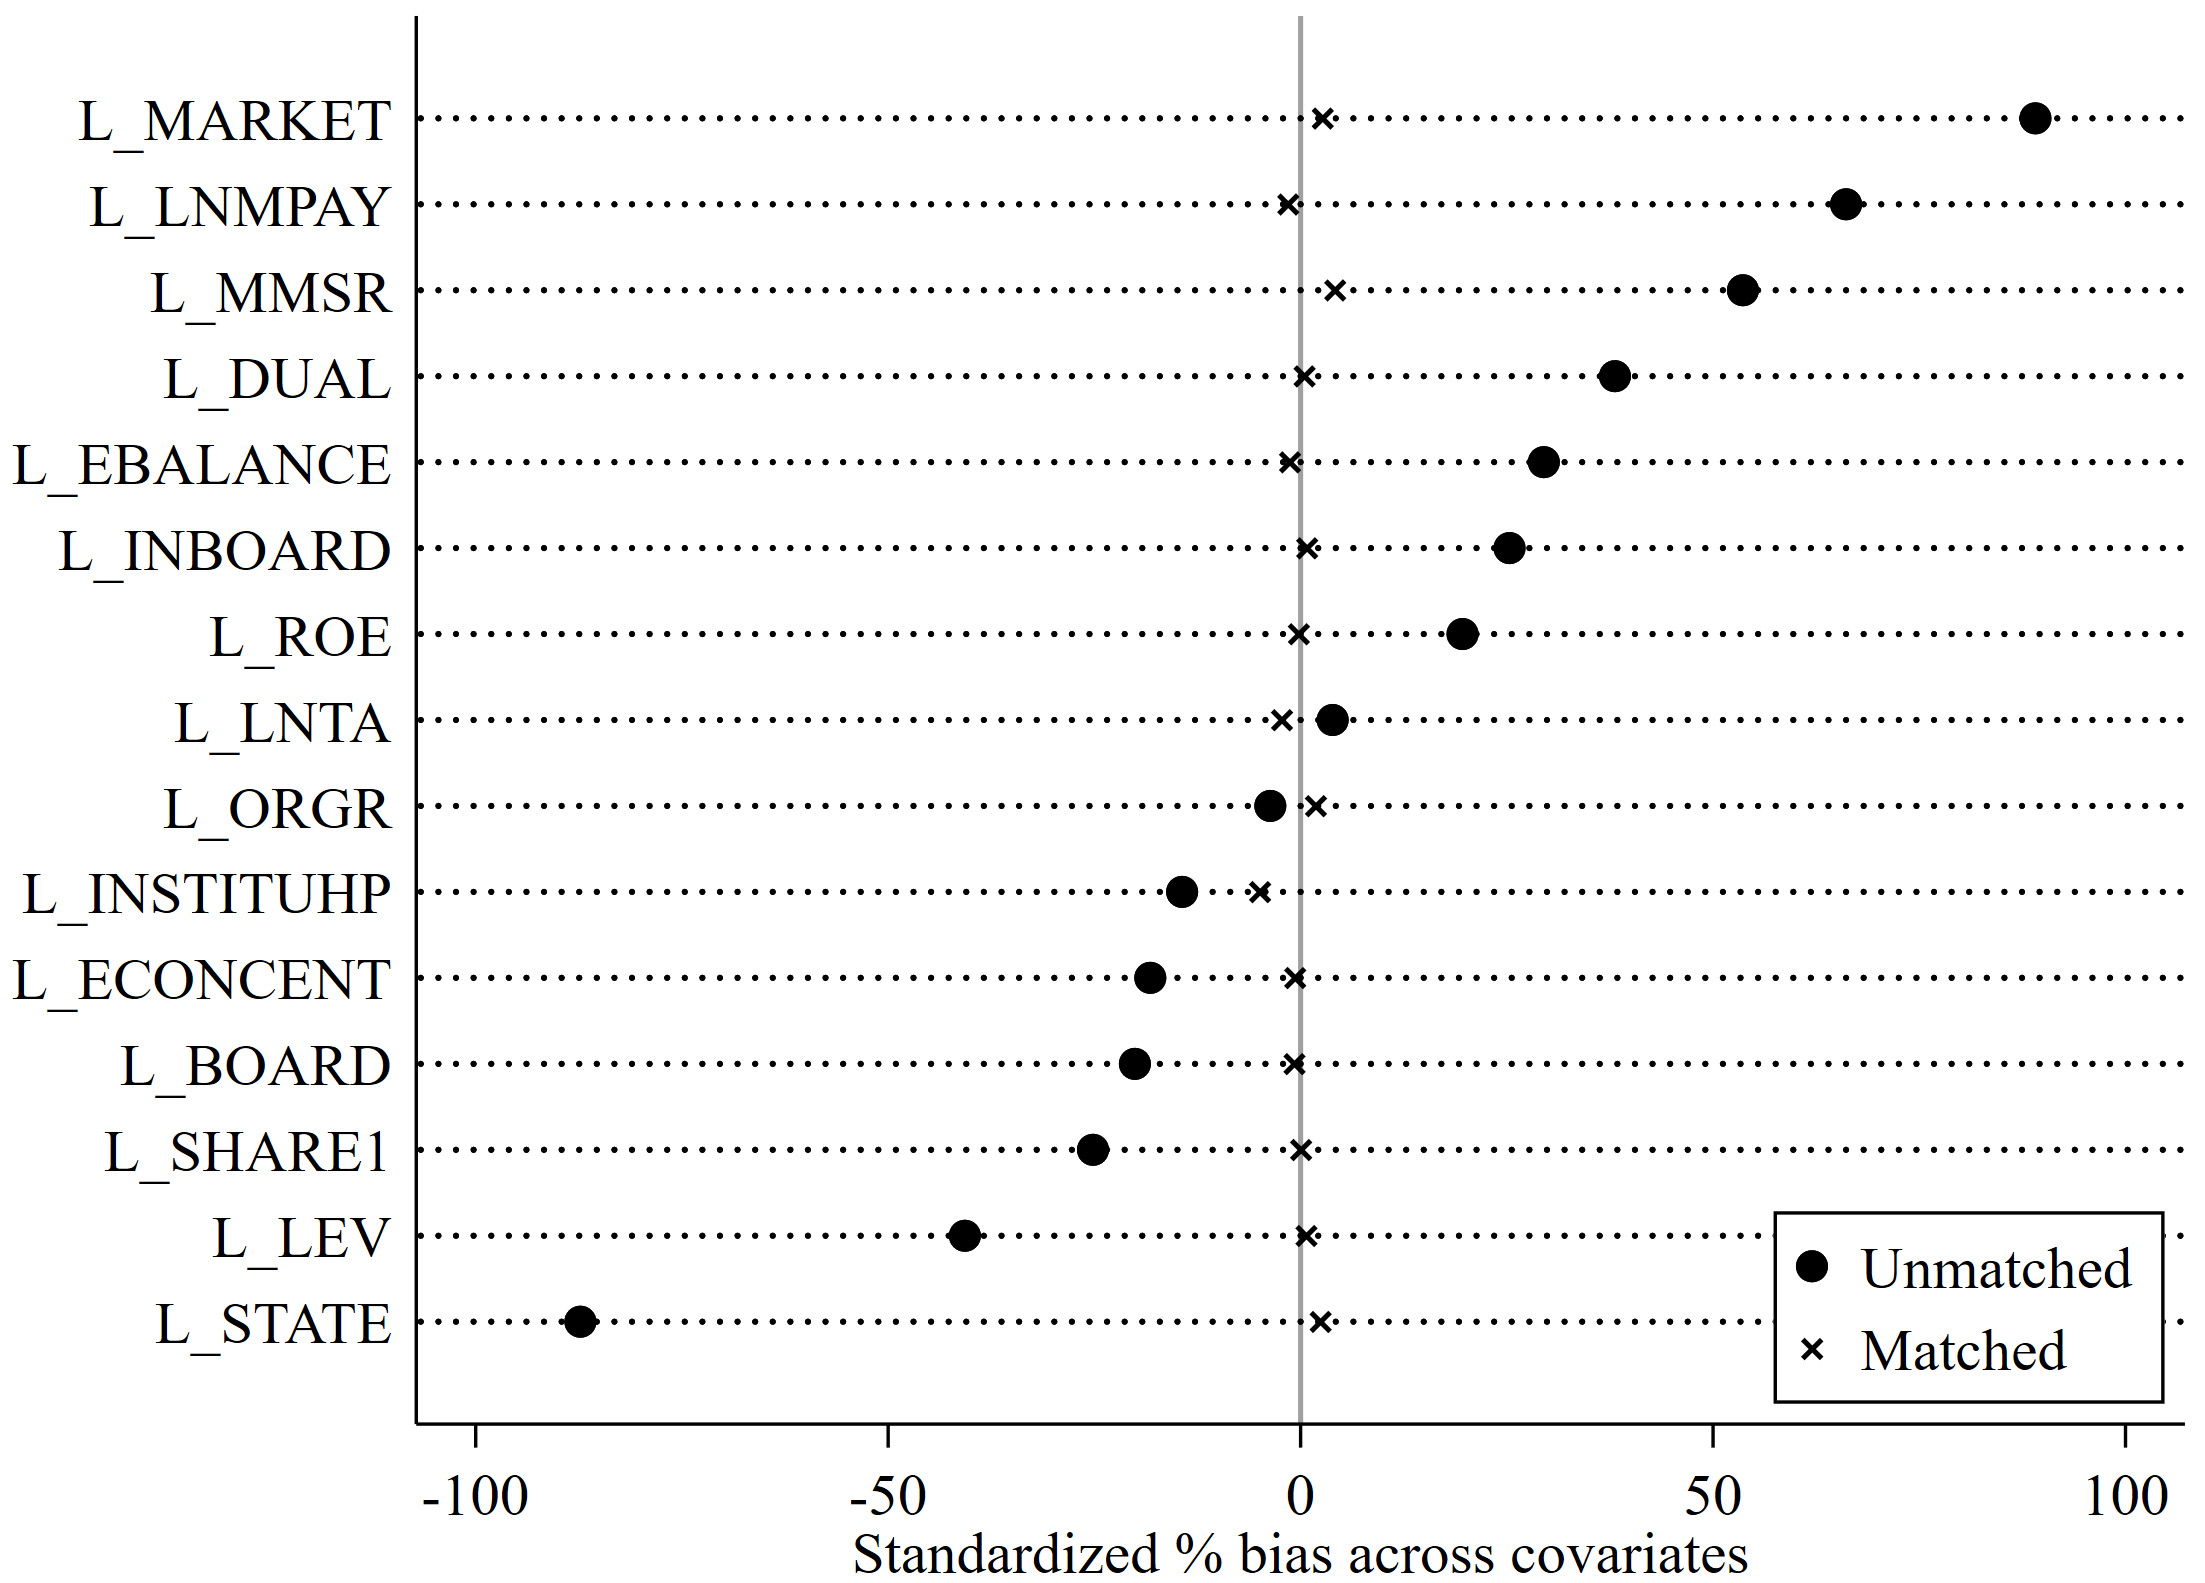
Certain conditions must be satisfied when using PSM to match the treatment group sample to the control group sample. First, the logistic regression model used to estimate the propensity scores must have sufficient estimation efficiency. The estimation efficiency of the logistic regression model is primarily evaluated using the area under the curve (AUC) metric. Generally, when the AUC is greater than 0.5, the closer it is to 1, the greater its explanatory power (Huang and Ling, 2005). Second, it is necessary to ensure that the matched treatment and control group samples satisfy the balancing hypothesis and the common support hypothesis. The balancing hypothesis requires that there are no significant differences between the means of the independent variables used in the logistic regression for the matched treatment and control group samples. Their standardized bias should typically be less than 10% (Rosenbaum and Rubin, 1983). The common support hypothesis requires that the propensity score values of the matched treatment and control group samples have a common range and share similar probability distribution characteristics. In other words, compared to before matching, the logistic regression model of the matched combined sample should no longer have explanatory power, and the AUC value should be close to 0.5 (Huang and Ling, 2005).
Based on the above principles, this paper validates the effectiveness of PSM by verifying the logistic regression model’s estimation efficiency, the balancing hypothesis of the matched combined samples, and the common support hypothesis: (1) The logistic regression model analysis results (see Table 3) show that whether it is the logistic regression result of the full sample composed of the two equity incentive modes (see Table 3, column (1)), the logistic regression result of the stock option sample (see Table 3, column (2)), or the logistic regression result of the restricted stock sample (see Table 3, column (3)), the AUC values are all greater than 0.8, indicating that the logistic regression models specified in this paper have ideal estimation efficiency (Fawcett, 2006; Iyer et al, 2016). (2) The balancing hypothesis test results for the matched combined sample (see Table 4 and Fig. 2) show that within the matched combined sample, the standardized bias of the independent variables used for logistic regression between the treatment and control group samples is no longer significant. Compared to the unmatched sample, the standardized bias of most independent variables has been reduced by more than 90%. Fig. 2 clearly shows the magnitude of the significant reduction in standardized bias of each independent variable. Therefore, the matched combined samples meet the balancing hypothesis requirements. (3) The common support hypothesis test results for the matched combined sample (see Fig. 3) show that compared to the significantly different probability distribution characteristics of the propensity score values of the treatment and control group samples before matching (see Fig. 3a), the probability distribution characteristics of the propensity score values of the treatment and control group samples in the matched combined sample are basically consistent (see Fig. 3b). Thus, the combined sample of matched pairs satisfies the common support hypothesis. Finally, the validation results regarding whether PSM eliminates sample self-selection endogeneity (see Fig. 4) show that when performing logistic regression with the propensity score estimates of the combined sample before matching and the dummy variable for whether equity incentives were implemented, the corresponding AUC value reaches 0.8310 (see Fig. 4a), and the logistic regression model has strong explanatory power. However, the AUC value of the logistic regression model of the matched combined sample is 0.5012 (see Fig. 4b), which is extremely close to 0.5, and the logistic regression model almost no longer has explanatory power. At this point, the treatment and control group samples can theoretically be regarded as homogeneous (random) before the occurrence of equity incentive events, and the sample self-selection endogeneity problem is basically eliminated. The above test results indicate that the PSM used in this paper is effective.
| Models | (1) | (2) | (3) |
| Samples | Full sample | Stock options sample | Restricted stock sample |
| L_LNTA | 0.2821*** | 0.3450*** | 0.2495*** |
| (11.92) | (9.63) | (8.80) | |
| L_LEV | –0.4360*** | –0.0747 | –0.5017*** |
| (–3.56) | (–0.42) | (–3.36) | |
| L_ROE | 0.7526*** | 0.4274** | 1.0797*** |
| (4.78) | (2.07) | (4.99) | |
| L_ORGR | 0.0547** | 0.0807*** | 0.0311 |
| (2.49) | (2.74) | (1.09) | |
| L_LNMPAY | 0.6954*** | 0.6839*** | 0.6367*** |
| (18.54) | (12.44) | (13.86) | |
| L_MMSR | 0.7011*** | 0.2098 | 0.9817*** |
| (4.50) | (0.93) | (5.04) | |
| L_DUAL | 0.1911*** | 0.3439*** | 0.0746 |
| (4.45) | (5.55) | (1.41) | |
| L_BOARD | –0.0115 | –0.0289** | 0.0039 |
| (–1.31) | (–2.14) | (0.38) | |
| L_INBOARD | 1.1324*** | 0.5067 | 1.4650*** |
| (4.03) | (1.21) | (4.33) | |
| L_SHARE1 | –0.5428 | –2.0227*** | 0.2312 |
| (–1.13) | (–2.73) | (0.40) | |
| L_INSTITUHP | 0.0132 | –0.1034 | –0.0507 |
| (0.11) | (–0.58) | (–0.32) | |
| L_ECONCENT | –0.2719 | 0.8334 | –0.8125 |
| (–0.48) | (0.95) | (–1.20) | |
| L_EBALANCE | –0.2566** | –0.5260*** | –0.1479 |
| (–2.47) | (–3.42) | (–1.17) | |
| L_STATE | –1.3857*** | –1.6680*** | –1.2442*** |
| (–21.10) | (–15.68) | (–15.65) | |
| L_MARKET | 0.5426*** | 0.9837*** | 0.1570*** |
| (21.49) | (26.04) | (4.83) | |
| Constant | –20.8717*** | –22.8257*** | –20.1730*** |
| (–26.17) | (–16.87) | (–19.89) | |
| YEAR | Yes | Yes | Yes |
| INDUSTRY | Yes | Yes | Yes |
| N | 25,787 | 23,431 | 22,846 |
| Pseudo R2 | 0.2710 | 0.3592 | 0.1954 |
| χ2 | 5907.9980 | 4555.2688 | 2715.2686 |
| AUC | 0.8523 | 0.9011 | 0.8197 |
Note: “L_” denotes a one-period lag. Values in parentheses are t-statistics for two-tailed tests. ** and *** indicate significance at the 5% and 1% levels, respectively. AUC, area under the curve.
| Variables | Matching status (before/after) | Mean | % reduct | t-test | |||
| Treated | Control | %bias | |bias| | t | p | ||
| L_LNTA | Before | 22.0580 | 22.0060 | 3.90 | 1.95 | 0.0510* | |
| After | 22.0390 | 22.0700 | –2.30 | 41.20 | –0.89 | 0.3720 | |
| L_LEV | Before | 0.3833 | 0.4690 | –40.70 | –20.32 | 0.0000*** | |
| After | 0.3896 | 0.3882 | 0.70 | 98.30 | 0.27 | 0.7900 | |
| L_ROE | Before | 0.0718 | 0.0393 | 19.60 | 9.38 | 0.0000*** | |
| After | 0.0696 | 0.0700 | –0.20 | 98.80 | –0.11 | 0.9140 | |
| L_ORGR | Before | 0.3728 | 0.4127 | –3.70 | –1.72 | 0.0850* | |
| After | 0.3606 | 0.3407 | 1.80 | 50.00 | 0.78 | 0.4360 | |
| L_LNMPAY | Before | 15.5890 | 15.0850 | 66.10 | 33.32 | 0.0000*** | |
| After | 15.5300 | 15.5420 | –1.50 | 97.70 | –0.60 | 0.5490 | |
| L_MMSR | Before | 0.1529 | 0.0622 | 53.60 | 30.85 | 0.0000*** | |
| After | 0.1480 | 0.1410 | 4.20 | 92.20 | 1.40 | 0.1620 | |
| L_DUAL | Before | 0.4613 | 0.2804 | 38.10 | 20.78 | 0.0000*** | |
| After | 0.4388 | 0.4366 | 0.40 | 98.80 | 0.16 | 0.8720 | |
| L_BOARD | Before | 9.7231 | 10.2610 | –20.10 | –10.26 | 0.0000*** | |
| After | 9.7703 | 9.7909 | –0.80 | 96.20 | –0.30 | 0.7650 | |
| L_INBOARD | Before | 0.3918 | 0.3730 | 25.30 | 13.71 | 0.0000*** | |
| After | 0.3905 | 0.3899 | 0.80 | 97.00 | 0.28 | 0.7800 | |
| L_SHARE1 | Before | 0.3204 | 0.3578 | –25.20 | –12.87 | 0.0000*** | |
| After | 0.3271 | 0.3271 | 0.00 | 99.90 | 0.01 | 0.9900 | |
| L_INSTITUHP | Before | 0.3521 | 0.3885 | –14.40 | –7.58 | 0.0000*** | |
| After | 0.3532 | 0.3657 | –4.90 | 65.60 | –1.83 | 0.0680* | |
| L_ECONCENT | Before | 0.1515 | 0.1722 | –18.20 | –9.15 | 0.0000*** | |
| After | 0.1561 | 0.1569 | –0.70 | 96.30 | –0.27 | 0.7890 | |
| L_EBALANCE | Before | 0.4115 | 0.3273 | 29.50 | 15.40 | 0.0000*** | |
| After | 0.4042 | 0.4079 | –1.30 | 95.60 | –0.49 | 0.6240 | |
| L_STATE | Before | 0.1375 | 0.5123 | –87.30 | –40.86 | 0.0000*** | |
| After | 0.1548 | 0.1445 | 2.40 | 97.30 | 1.08 | 0.2790 | |
| L_MARKET | Before | 2.0866 | 1.3596 | 89.10 | 54.23 | 0.0000*** | |
| After | 1.9787 | 1.9570 | 2.70 | 97.00 | 0.89 | 0.3710 | |
Note: “L_” denotes a one-period lag. * and *** indicate significance at the 10% and 1% levels, respectively.
 Fig. 2.
The magnitude of changes in standardized mean differences of matching covariates before and after propensity score matching (PSM).
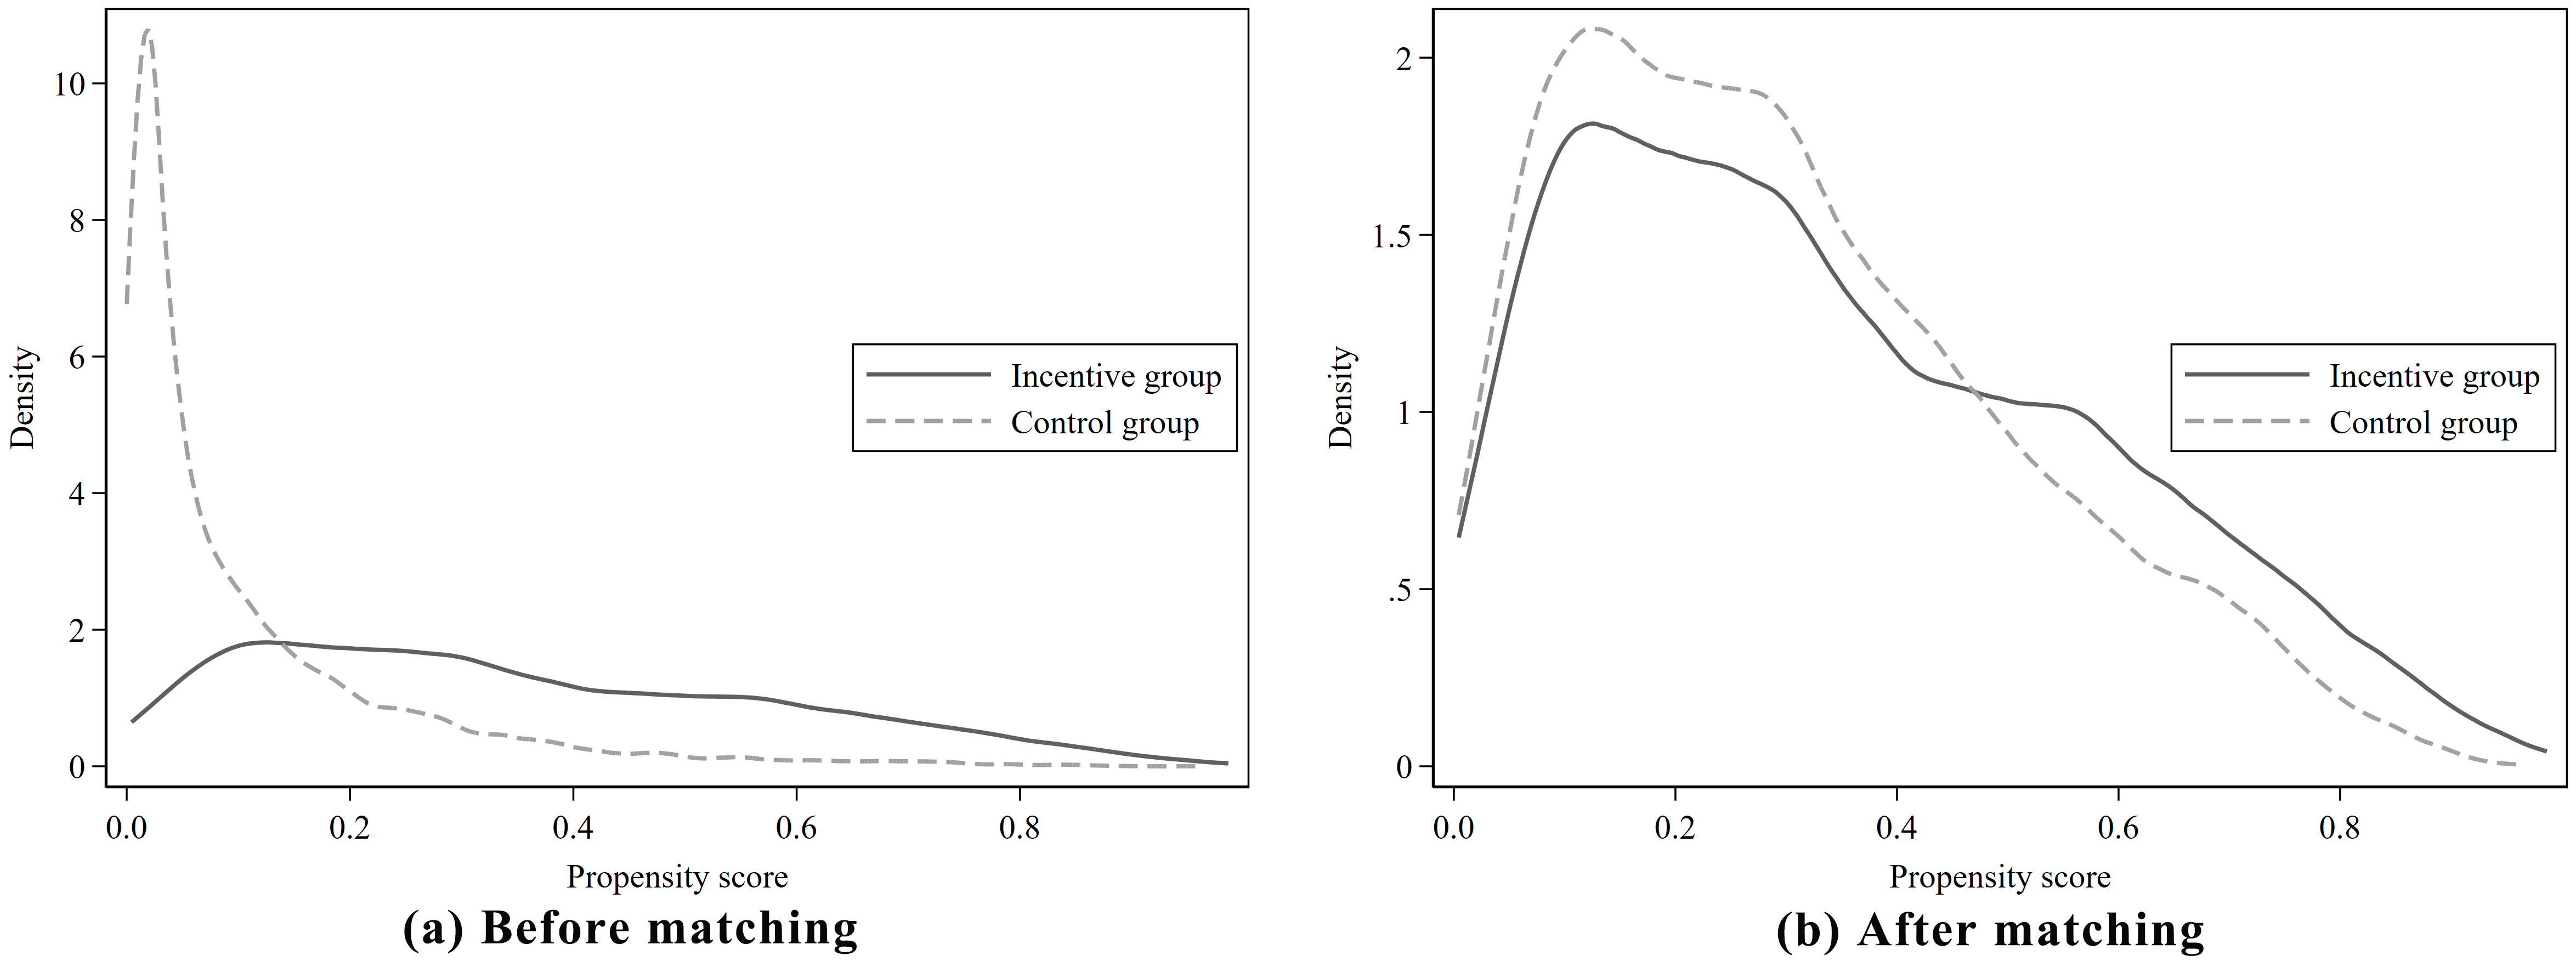 Fig. 3.
Kernel density plots of propensity scores for treatment and control groups before and after PSM ((a) and (b), respectively).
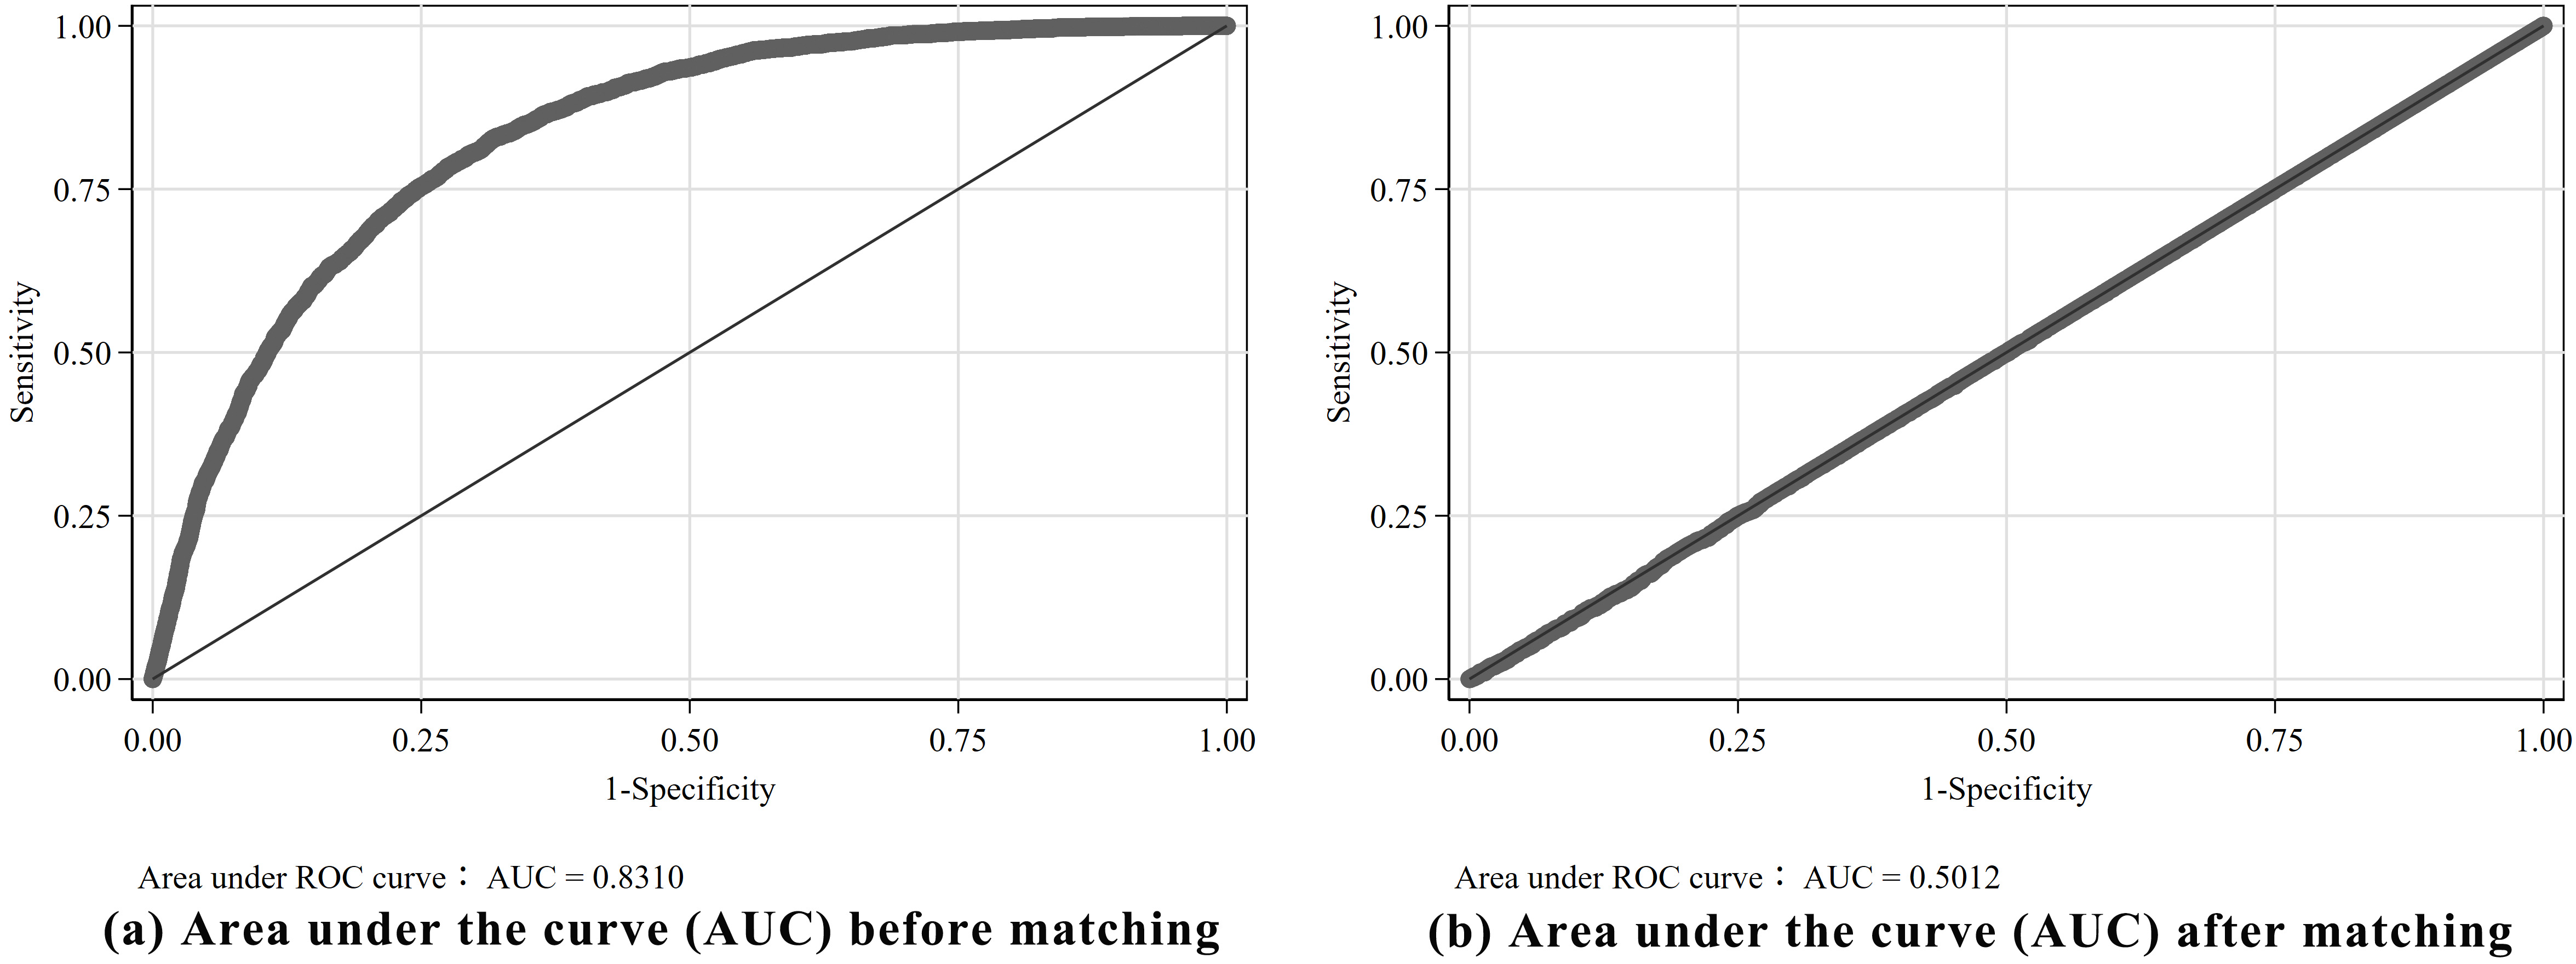 Fig. 4.
Validation of propensity score model predictive power: AUC before and after PSM ((a) and (b), respectively).
After obtaining the combined sample formed by the treatment and control groups through PSM, we further calculate the average treatment effect on the treated (ATT) of the treatment and control group samples. Table 5 reports the ATT and its significance for the treatment group relative to the control group for the full sample of equity incentives, the stock option sample, and the restricted stock sample, respectively. The results reported in Table 5 show that the sustainable financial growth rate of the treatment group is significantly greater than that of the control group before matching, and this situation remains significant after matching. Notably, the ATT value and significance of the stock option sample are significantly smaller than those of the restricted stock sample. The above results preliminarily indicate that, at least in the first year of equity incentive implementation, executive equity incentives have a significant positive incentive effect on corporate sustainable financial growth, and this positive impact mainly comes from the restricted stock incentive mode. That is, the incentive effect of the restricted stock incentive mode is significantly better than that of the stock option incentive mode. Thus, research hypotheses H1 and H3 are preliminarily confirmed.
| Variables | Matching (before/after) | Treated group | Control group | ATT | Standard error | t-statistics |
| VSGR (full sample) | Before | 0.0699 | 0.0354 | 0.0345 | 0.0030 | 11.51*** |
| After | 0.0699 | 0.0409 | 0.0290 | 0.0037 | 7.94*** | |
| VSGR (stock options sample) | Before | 0.0615 | 0.0356 | 0.0258 | 0.0044 | 5.87*** |
| After | 0.0616 | 0.0482 | 0.0134 | 0.0057 | 2.35** | |
| VSGR (restricted stock sample) | Before | 0.0767 | 0.0350 | 0.0418 | 0.0039 | 10.64*** |
| After | 0.0765 | 0.0510 | 0.0255 | 0.0044 | 5.76*** |
Note: Nearest neighbor matching with 1:1 pairing without replacement and a caliper of 0.01 was used. ** and *** indicate significance at the 5% and 1% levels, respectively.
However, the ATT is simply a comparison of the average value of the outcome variable, the corporate sustainable financial growth rate, without considering the influence of other factors. Moreover, the above results test the effect only in the first year of equity incentive implementation. Therefore, it is necessary to further add the main control variables to conduct a multivariate OLS DID regression analysis on the three groups of samples as a whole. The corresponding regression results are reported in Table 6, where columns (1), (3), and (5) are the regression results without including control variables for the full sample, the stock option sample, and the restricted stock sample, respectively, and columns (2), (4), and (6) are the regression results after including control variables for the corresponding samples. The results in Table 6 show that regardless of whether control variables are considered, equity incentive events in the full sample and the two incentive mode subsamples have a significant positive impact on changes in the sustainable financial growth rate. Among them, after considering control variables, the marginal incentive effects are 0.0232, 0.0205, and 0.0243, respectively, all significant at the 1% level, and the incentive effect of restricted stock is significantly better than that of stock options. In summary, research hypothesis H1 is confirmed, indicating that equity incentive events of listed companies have a significant incentive effect on promoting corporate sustainable financial growth overall. Research hypothesis H3 is also confirmed, demonstrating that different equity incentive modes have distinct incentive effects on promoting corporate sustainable financial growth, with the restricted stock incentive mode being more effective than that of the stock option incentive mode.
| Samples | Full sample | Stock options sample | Restricted stock sample | |||
| Models | (1) | (2) | (3) | (4) | (5) | (6) |
| Variables | VSGR | VSGR | VSGR | VSGR | VSGR | VSGR |
| TREATED×TIME | 0.0192*** | 0.0232*** | 0.0192*** | 0.0205*** | 0.0190*** | 0.0243*** |
| (5.16) | (6.30) | (3.20) | (3.44) | (3.97) | (5.11) | |
| TIME | –0.0055* | –0.0050 | –0.0099** | –0.0068 | –0.0026 | –0.0032 |
| (–1.77) | (–1.62) | (–1.99) | (–1.38) | (–0.64) | (–0.82) | |
| L_LNTA | –0.0610*** | –0.0567*** | –0.0640*** | |||
| (–18.56) | (–11.15) | (–14.59) | ||||
| L_LEV | 0.1560*** | 0.1926*** | 0.1346*** | |||
| (14.41) | (11.10) | (9.64) | ||||
| L_ROE | 0.0573*** | 0.0493*** | 0.0640*** | |||
| (8.73) | (4.87) | (7.36) | ||||
| L_ORGR | 0.0060*** | 0.0066*** | 0.0054*** | |||
| (5.15) | (3.66) | (3.46) | ||||
| L_LNMPAY | –0.0043 | –0.0081 | –0.0014 | |||
| (–1.23) | (–1.45) | (–0.32) | ||||
| L_MMSR | 0.0435*** | 0.0337 | 0.0524*** | |||
| (3.28) | (1.53) | (3.13) | ||||
| L_DUAL | 0.0029 | –0.0000 | 0.0052 | |||
| (0.91) | (–0.00) | (1.28) | ||||
| L_BOARD | 0.0007 | –0.0003 | 0.0012* | |||
| (1.38) | (–0.34) | (1.91) | ||||
| L_INBOARD | –0.0134 | –0.0250 | –0.0037 | |||
| (–0.88) | (–1.01) | (–0.20) | ||||
| L_SHARE1 | 0.0142 | –0.0073 | 0.0224 | |||
| (0.52) | (–0.17) | (0.63) | ||||
| L_INSTITUHP | 0.0139 | 0.0280* | 0.0038 | |||
| (1.42) | (1.89) | (0.29) | ||||
| L_ECONCENT | 0.0065 | 0.0765 | –0.0316 | |||
| (0.18) | (1.33) | (–0.68) | ||||
| L_EBALANCE | –0.0036 | 0.0016 | –0.0027 | |||
| (–0.42) | (0.12) | (–0.25) | ||||
| L_STATE | –0.0202*** | –0.0243* | –0.0165 | |||
| (–2.58) | (–1.95) | (–1.63) | ||||
| Constant | 0.2968*** | 1.4747*** | 0.1807** | 1.3878*** | 0.3221*** | 1.5144*** |
| (2.60) | (11.01) | (2.40) | (9.88) | (2.71) | (10.04) | |
| Year fixed | Yes | Yes | Yes | Yes | Yes | Yes |
| Industry fixed | Yes | Yes | Yes | Yes | Yes | Yes |
| N | 24,363 | 24,363 | 9783 | 9783 | 14,580 | 14,580 |
| R2 | 0.0467 | 0.0756 | 0.0520 | 0.0845 | 0.0516 | 0.0795 |
Note: “L_” denotes a one-period lag. t-statistics are presented in parentheses. *, **, and *** indicate significance at the 10%, 5%, and 1% levels, respectively.
Considering that equity incentives are designed as a long-term incentive system, and that the vesting period of most corporate equity incentive plans is less than 6 years (the proportion of sample companies with vesting period contractual arrangements for both modes of incentives less than 6 years is greater than 95%), this paper conducts multi-period DID tests on the financial lasting incentive effect within six years of equity incentive implementation. First, multi-period DID tests are conducted on the paired combined sample of the full sample of equity incentives, and the test results are reported in Table 7. Subsequently, multi-period DID tests are conducted separately on the paired samples of stock options and restricted stock, and the test results are reported in Tables 8,9, respectively.
| Incentive periods | Year 1 | Year 2 | Year 3 | Year 4 | Year 5 | Year 6 |
| Models | (1) | (2) | (3) | (4) | (5) | (6) |
| Variables | VSGR | VSGR | VSGR | VSGR | VSGR | VSGR |
| TREATED×TIME | 0.0242*** | 0.0194*** | 0.0190*** | 0.0163** | 0.0154 | –0.0240 |
| (6.45) | (4.25) | (3.46) | (2.48) | (1.53) | (–0.79) | |
| TIME | –0.0137*** | –0.0051 | –0.0078 | –0.0201* | –0.0078 | –0.0183 |
| (–3.17) | (–0.84) | (–0.91) | (–1.86) | (–0.47) | (–0.35) | |
| L_LNTA | –0.0592*** | –0.0640*** | –0.0578*** | –0.0526*** | –0.0426*** | –0.0106 |
| (–8.57) | (–10.67) | (–10.01) | (–9.06) | (–5.25) | (–0.51) | |
| L_LEV | 0.1568*** | 0.1729*** | 0.1397*** | 0.0867*** | 0.0770*** | –0.0086 |
| (7.58) | (8.95) | (7.11) | (4.07) | (2.60) | (–0.12) | |
| L_ROE | –0.1808*** | 0.1955*** | 0.2616*** | 0.2550*** | 0.3063*** | 0.1073 |
| (–15.14) | (15.43) | (19.26) | (16.52) | (11.82) | (1.49) | |
| L_ORGR | 0.0087*** | 0.0124*** | 0.0085*** | 0.0059** | 0.0028 | –0.0074 |
| (4.96) | (5.73) | (3.61) | (2.05) | (0.67) | (–0.77) | |
| L_LNMPAY | –0.0031 | –0.0130** | –0.0099 | 0.0058 | 0.0052 | 0.0224 |
| (–0.46) | (–2.07) | (–1.55) | (0.83) | (0.55) | (0.92) | |
| L_MMSR | 0.0348 | 0.0275 | 0.0087 | 0.0320 | –0.0433 | 0.0765 |
| (1.21) | (1.15) | (0.40) | (1.34) | (–1.20) | (0.68) | |
| L_DUAL | 0.0084 | 0.0028 | 0.0040 | 0.0004 | –0.0139 | 0.0016 |
| (1.30) | (0.50) | (0.67) | (0.06) | (–1.49) | (0.06) | |
| L_BOARD | 0.0018** | 0.0014 | 0.0009 | 0.0013 | 0.0015 | –0.0162*** |
| (2.27) | (1.56) | (0.79) | (1.12) | (0.89) | (–3.09) | |
| L_INBOARD | –0.0913*** | –0.0165 | –0.0409 | –0.0167 | 0.0190 | –0.1854 |
| (–3.55) | (–0.59) | (–1.27) | (–0.45) | (0.34) | (–1.15) | |
| L_SHARE1 | –0.0649 | –0.0610 | 0.0079 | –0.0042 | 0.1022 | 0.1749 |
| (–1.38) | (–1.23) | (0.14) | (–0.07) | (1.09) | (0.66) | |
| L_INSTITUHP | 0.0062 | –0.0035 | 0.0034 | 0.0054 | 0.0152 | 0.0395 |
| (0.39) | (–0.22) | (0.20) | (0.29) | (0.61) | (0.68) | |
| L_ECONCENT | –0.0307 | 0.0602 | 0.0090 | –0.0634 | –0.1120 | –0.2607 |
| (–0.46) | (0.94) | (0.13) | (–0.82) | (–0.98) | (–0.84) | |
| L_EBALANCE | –0.0340* | 0.0092 | –0.0108 | –0.0121 | –0.0313 | –0.0607 |
| (–1.80) | (0.57) | (–0.68) | (–0.73) | (–1.29) | (–0.97) | |
| L_STATE | –0.0198 | –0.0365** | –0.0141 | –0.0124 | –0.0616*** | 0.0214 |
| (–1.04) | (–2.34) | (–0.99) | (–0.84) | (–2.99) | (0.32) | |
| Constant | 1.4908*** | 1.6410*** | 1.5978*** | 1.6512*** | 0.9529*** | 0.2329 |
| (6.24) | (7.86) | (7.39) | (6.81) | (4.25) | (0.45) | |
| Year fixed | Yes | Yes | Yes | Yes | Yes | Yes |
| Industry fixed | Yes | Yes | Yes | Yes | Yes | Yes |
| N | 11,268 | 10,422 | 9495 | 8126 | 4051 | 1087 |
| R2 | 0.1052 | 0.1463 | 0.1896 | 0.2257 | 0.2867 | 0.2485 |
Note: “L_” denotes a one-period lag. t-statistics are presented in parentheses. *, **, and *** indicate significance at the 10%, 5%, and 1% levels, respectively.
| Incentive periods | Year 1 | Year 2 | Year 3 | Year 4 | Year 5 | Year 6 |
| Models | (1) | (2) | (3) | (4) | (5) | (6) |
| Variables | VSGR | VSGR | VSGR | VSGR | VSGR | VSGR |
| TREATED×TIME | 0.0200*** | 0.0180** | 0.0097 | 0.0111 | –0.0013 | –0.0840 |
| (3.38) | (2.32) | (1.02) | (0.97) | (–0.08) | (–1.47) | |
| TIME | –0.0141** | –0.0131 | 0.0011 | –0.0258 | –0.0075 | –0.0590 |
| (–2.32) | (–1.39) | (0.08) | (–1.61) | (–0.31) | (–0.58) | |
| L_LNTA | –0.0634*** | –0.0635*** | –0.0629*** | –0.0319*** | –0.0572*** | 0.0168 |
| (–6.02) | (–6.47) | (–6.92) | (–3.59) | (–4.43) | (0.38) | |
| L_LEV | 0.2017*** | 0.2284*** | 0.1353*** | 0.0791** | 0.3326*** | 0.1225 |
| (6.34) | (7.03) | (4.17) | (2.16) | (6.74) | (0.81) | |
| L_ROE | –0.1494*** | 0.1911*** | 0.2697*** | 0.1773*** | 0.4079*** | –0.1658 |
| (–7.92) | (9.34) | (12.78) | (7.30) | (10.91) | (–1.15) | |
| L_ORGR | 0.0074*** | 0.0173*** | 0.0086** | 0.0055 | –0.0025 | –0.0022 |
| (2.85) | (4.99) | (2.31) | (1.22) | (–0.41) | (–0.10) | |
| L_LNMPAY | –0.0082 | –0.0163 | –0.0195* | 0.0049 | 0.0011 | 0.0102 |
| (–0.78) | (–1.58) | (–1.81) | (0.43) | (0.07) | (0.23) | |
| L_MMSR | –0.0375 | 0.0062 | –0.0310 | 0.0860** | –0.0119 | 0.1075 |
| (–0.83) | (0.15) | (–0.80) | (2.10) | (–0.21) | (0.55) | |
| L_DUAL | 0.0094 | –0.0049 | 0.0051 | –0.0026 | –0.0125 | 0.0544 |
| (0.90) | (–0.52) | (0.51) | (–0.25) | (–0.86) | (0.95) | |
| L_BOARD | 0.0027** | –0.0019 | –0.0036* | 0.0011 | 0.0012 | –0.0381*** |
| (2.13) | (–1.25) | (–1.90) | (0.59) | (0.49) | (–3.91) | |
| L_INBOARD | –0.0897** | 0.0185 | –0.0613 | –0.0940 | 0.0285 | –0.3953 |
| (–2.19) | (0.38) | (–1.11) | (–1.50) | (0.31) | (–1.11) | |
| L_SHARE1 | –0.1434* | –0.1289 | 0.0777 | 0.0112 | 0.1249 | 0.2449 |
| (–1.91) | (–1.48) | (0.88) | (0.11) | (0.79) | (0.52) | |
| L_INSTITUHP | 0.0203 | –0.0073 | 0.0132 | 0.0128 | –0.0024 | 0.0857 |
| (0.84) | (–0.28) | (0.50) | (0.45) | (–0.06) | (0.81) | |
| L_ECONCENT | –0.0094 | 0.1065 | –0.1135 | 0.0006 | –0.0584 | –0.2861 |
| (–0.09) | (0.98) | (–1.06) | (0.00) | (–0.32) | (–0.50) | |
| L_EBALANCE | –0.0671** | 0.0034 | –0.0198 | –0.0196 | 0.0662* | 0.0055 |
| (–2.26) | (0.13) | (–0.77) | (–0.70) | (1.72) | (0.04) | |
| L_STATE | –0.0254 | –0.0277 | –0.0231 | –0.0067 | –0.1071*** | 0.0045 |
| (–0.85) | (–1.16) | (–0.95) | (–0.27) | (–3.30) | (0.03) | |
| Constant | 1.5430*** | 1.4230*** | 1.7715*** | 0.6271** | 1.1156*** | –0.0662 |
| (5.33) | (4.94) | (6.92) | (2.40) | (3.03) | (–0.07) | |
| Year fixed | Yes | Yes | Yes | Yes | Yes | Yes |
| Industry fixed | Yes | Yes | Yes | Yes | Yes | Yes |
| N | 4668 | 4240 | 3793 | 3235 | 1840 | 487 |
| R2 | 0.1482 | 0.1708 | 0.2476 | 0.2486 | 0.4044 | 0.3395 |
Note: “L_” denotes a one-period lag. t-statistics are presented in parentheses. *, **, and *** indicate significance at the 10%, 5%, and 1% levels, respectively.
| Incentive periods | Year 1 | Year 2 | Year 3 | Year 4 | Year 5 | Year 6 |
| Models | (1) | (2) | (3) | (4) | (5) | (6) |
| Variables | VSGR | VSGR | VSGR | VSGR | VSGR | VSGR |
| TREATED×TIME | 0.0266*** | 0.0192*** | 0.0250*** | 0.0153* | 0.0286** | –0.0081 |
| (5.39) | (3.39) | (3.63) | (1.86) | (2.26) | (–0.25) | |
| TIME | –0.0143** | 0.0007 | –0.0111 | –0.0053 | –0.0145 | –0.0663 |
| (–2.03) | (0.08) | (–0.88) | (–0.32) | (–0.61) | (–1.24) | |
| L_LNTA | –0.0582*** | –0.0681*** | –0.0599*** | –0.0615*** | –0.0367*** | –0.0360 |
| (–6.13) | (–8.83) | (–7.82) | (–7.82) | (–3.55) | (–1.42) | |
| L_LEV | 0.1217*** | 0.1456*** | 0.1393*** | 0.0874*** | –0.0860** | –0.0907 |
| (4.40) | (6.05) | (5.58) | (3.32) | (–2.38) | (–1.03) | |
| L_ROE | –0.2018*** | 0.2170*** | 0.2654*** | 0.3289*** | 0.2699*** | 0.2537*** |
| (–12.86) | (13.32) | (14.67) | (16.07) | (7.48) | (2.88) | |
| L_ORGR | 0.0091*** | 0.0084*** | 0.0069** | 0.0033 | 0.0023 | –0.0101 |
| (3.69) | (3.04) | (2.24) | (0.86) | (0.40) | (–1.10) | |
| L_LNMPAY | 0.0033 | –0.0067 | –0.0060 | 0.0065 | 0.0191 | 0.0682** |
| (0.37) | (–0.86) | (–0.74) | (0.74) | (1.55) | (2.28) | |
| L_MMSR | 0.0859** | 0.0365 | 0.0351 | 0.0014 | –0.0552 | –0.0274 |
| (2.31) | (1.28) | (1.34) | (0.05) | (–1.21) | (–0.21) | |
| L_DUAL | 0.0106 | 0.0080 | 0.0024 | 0.0007 | –0.0073 | –0.0276 |
| (1.28) | (1.18) | (0.33) | (0.08) | (–0.62) | (–0.98) | |
| L_BOARD | 0.0010 | 0.0033*** | 0.0030** | 0.0018 | 0.0018 | –0.0001 |
| (0.99) | (3.02) | (2.17) | (1.21) | (0.84) | (–0.02) | |
| L_INBOARD | –0.0994*** | –0.0382 | –0.0087 | 0.0156 | 0.0067 | –0.0325 |
| (–3.00) | (–1.13) | (–0.22) | (0.34) | (0.10) | (–0.21) | |
| L_SHARE1 | –0.0292 | –0.0553 | –0.0515 | 0.0324 | –0.0894 | –0.1367 |
| (–0.47) | (–0.92) | (–0.70) | (0.40) | (–0.76) | (–0.41) | |
| L_INSTITUHP | 0.0004 | 0.0059 | –0.0170 | –0.0042 | 0.0047 | 0.0249 |
| (0.02) | (0.29) | (–0.76) | (–0.17) | (0.13) | (0.37) | |
| L_ECONCENT | –0.0642 | 0.0357 | 0.1225 | –0.1468 | 0.0118 | –0.1230 |
| (–0.74) | (0.45) | (1.32) | (–1.47) | (0.08) | (–0.33) | |
| L_EBALANCE | –0.0111 | 0.0168 | 0.0025 | –0.0046 | –0.0848*** | –0.2246*** |
| (–0.46) | (0.84) | (0.12) | (–0.22) | (–2.74) | (–2.93) | |
| L_STATE | –0.0160 | –0.0453** | –0.0046 | –0.0158 | –0.0415 | 0.0530 |
| (–0.64) | (–2.20) | (–0.26) | (–0.84) | (–1.56) | (0.81) | |
| Constant | 1.3685*** | 1.4878*** | 1.5146*** | 1.9857*** | 0.9583*** | 0.0836 |
| (4.79) | (6.58) | (6.32) | (6.96) | (3.31) | (0.14) | |
| Year fixed | Yes | Yes | Yes | Yes | Yes | Yes |
| Industry fixed | Yes | Yes | Yes | Yes | Yes | Yes |
| N | 6600 | 6182 | 5702 | 4891 | 2211 | 600 |
| R2 | 0.1013 | 0.1790 | 0.1976 | 0.2739 | 0.3428 | 0.5494 |
Note: “L_” denotes a one-period lag. t-statistics are presented in parentheses. *, **, and *** indicate significance at the 10%, 5%, and 1% levels, respectively.
The results reported in Table 7 show that, for the full sample, executive equity incentives not only have a significant positive incentive effect on corporate sustainable financial growth in the first year of implementation, but also have a lasting incentive effect for at least 4 years after the implementation of equity incentives. Among them, the effects in the first to third years are significant at the 1% level, and the effect in the fourth year is significant at the 5% level. The marginal incentive effects are 0.0242, 0.0194, 0.0190, and 0.0163, respectively, and generally show a decreasing trend year by year, which is consistent with the law of diminishing marginal returns. Thus, research hypothesis H2 is confirmed, indicating that equity incentives generally have a lasting incentive effect on promoting corporate sustainable financial growth, but the incentive effect generally weakens year by year.
The results reported in Table 8 show that the incentive effect of the stock option incentive mode has a shorter duration, and it can only play an incentive role in the first two years after the equity incentive event is implemented. The effect in the first year is significant at the 1% level, and the effect in the second year is significant at the 5% level, with marginal incentive effects of 0.02 and 0.018, respectively. The results reported in Table 9 show that the restricted stock incentive mode has a lasting incentive effect over the first five years after the equity incentive event. Among them, the effects in the first to third years are significant at the 1% level, the effect in the fourth year is significant at the 10% level, and the effect in the fifth year is significant at the 5% level, with marginal incentive effects of 0.0266, 0.0192, 0.0250, 0.0153, and 0.0286, respectively. Notably, incentive effects in the first two years are higher in intensity and significance than those in the stock option incentive mode. This result indicates that research hypothesis H4 is confirmed, indicating that different equity incentive modes have different durations of incentive effects on promoting corporate sustainable financial growth. Overall, the duration of the incentive effect of the restricted stock incentive mode is longer than that of the stock option incentive mode.
The preceding sections have conducted empirical tests on the incentive effects of executive equity incentives and their different modes on corporate sustainable financial growth using a combined research method of PSM and DID. The results of the tests fully confirm the hypotheses of this paper. However, when using PSM, could the results be driven by the specific matching technique, rendering them coincidental? Are the conclusions robust when alternative matching techniques are used? Furthermore, is there any specificity in using the Van Horne sustainable growth rate (VSGR) in the DID analysis, and are the test results still robust when the Higgins sustainable growth rate (HSGR) is used? Additional empirical tests are needed to address these questions. Therefore, this paper replaces the matching technique of PSM and supplements the ATT test with the Higgins sustainable growth rate (HSGR). Moreover, VSGR is replaced by HSGR in the DID test for robustness testing. Specifically, in applying PSM, we use both radius matching and kernel matching techniques and perform ATT tests for both VSGR and HSGR simultaneously. The results of the tests are given in Table 10. The results reported in Table 10 show that regardless of the matching technique used and regardless of whether VSGR or HSGR is used, the conclusions shown by the ATT test results are consistent with the previous findings. Finally, the robustness test results of the DID using HSGR are shown in Tables 11,12, and the results are still consistent with the previous research conclusions. Therefore, the conclusions of this paper are robust.
| Outcome variable | Samples | Matching modes | Treatment group | Control group | ATT | Standard error | t-statistics |
| VSGR | Full sample | Before matching | 0.0699 | 0.0354 | 0.0345 | 0.0030 | 11.51*** |
| Radius matching | 0.0700 | 0.0450 | 0.0250 | 0.0034 | 7.39*** | ||
| Kernel matching | 0.0700 | 0.0452 | 0.0248 | 0.0034 | 7.28*** | ||
| Stock options sample | Before matching | 0.0615 | 0.0356 | 0.0258 | 0.0044 | 5.87*** | |
| Radius matching | 0.0616 | 0.0390 | 0.0226 | 0.0052 | 4.33*** | ||
| Kernel matching | 0.0616 | 0.0387 | 0.0229 | 0.0053 | 4.35*** | ||
| Restricted stock sample | Before matching | 0.0767 | 0.0350 | 0.0418 | 0.0039 | 10.64*** | |
| Radius matching | 0.0767 | 0.0491 | 0.0276 | 0.0034 | 8.01*** | ||
| Kernel matching | 0.0767 | 0.0492 | 0.0276 | 0.0035 | 7.97*** | ||
| HSGR | Full sample | Before matching | 0.0555 | 0.0247 | 0.0309 | 0.0034 | 9.05*** |
| Radius matching | 0.0556 | 0.0300 | 0.0257 | 0.0038 | 6.77*** | ||
| Kernel matching | 0.0556 | 0.0303 | 0.0253 | 0.0038 | 6.64*** | ||
| Stock option sample | Before matching | 0.0469 | 0.0248 | 0.0220 | 0.0050 | 4.40*** | |
| Radius matching | 0.0469 | 0.0242 | 0.0227 | 0.0058 | 3.91*** | ||
| Kernel matching | 0.0469 | 0.0239 | 0.0230 | 0.0058 | 3.94*** | ||
| Restricted stock sample | Before matching | 0.0626 | 0.0242 | 0.0383 | 0.0045 | 8.57*** | |
| Radius matching | 0.0626 | 0.0336 | 0.0289 | 0.0038 | 7.56*** | ||
| Kernel matching | 0.0626 | 0.0337 | 0.0289 | 0.0038 | 7.52*** |
Note: A caliper of 0.01 was used for both radius and kernel matching. *** indicate significance at the 1% levels.
| Samples | Full sample | Stock options sample | Restricted stock sample | |||
| Models | (1) | (2) | (3) | (4) | (5) | (6) |
| Variables | HSGR | HSGR | HSGR | HSGR | HSGR | HSGR |
| TREATED×TIME | 0.0196*** | 0.0225*** | 0.0212*** | 0.0217*** | 0.0180*** | 0.0224*** |
| (5.49) | (6.32) | (3.73) | (3.82) | (3.88) | (4.83) | |
| TIME | –0.0054* | –0.0053* | –0.0084* | –0.0071 | –0.0031 | –0.0037 |
| (–1.80) | (–1.78) | (–1.78) | (–1.52) | (–0.80) | (–0.96) | |
| Control variables | No | Yes | No | Yes | No | Yes |
| N | 24,363 | 24,363 | 9783 | 9783 | 14,580 | 14,580 |
| R2 | 0.0560 | 0.0753 | 0.0669 | 0.0843 | 0.0608 | 0.0831 |
Note: t-statistics are presented in parentheses. * and *** indicate significance at the 10% and 1% levels, respectively. To conserve space, the coefficients and t-statistics for the control variables are not shown.
| Incentive periods | Year 1 | Year 2 | Year 3 | Year 4 | Year 5 | Year 6 |
| Models | (1) | (2) | (3) | (4) | (5) | (6) |
| Variables | HSGR | HSGR | HSGR | HSGR | HSGR | HSGR |
| A. Full sample | ||||||
| TREATED×TIME | 0.0246*** | 0.0190*** | 0.0176*** | 0.0106* | 0.0147 | –0.0197 |
| (6.88) | (4.34) | (3.33) | (1.65) | (1.52) | (–0.69) | |
| TIME | –0.0167*** | –0.0111* | –0.0104 | –0.0227** | –0.0102 | –0.0268 |
| (–4.04) | (–1.91) | (–1.24) | (–2.15) | (–0.64) | (–0.55) | |
| Control variables | Yes | Yes | Yes | Yes | Yes | Yes |
| N | 11,268 | 10,422 | 9495 | 8126 | 4051 | 1087 |
| R2 | 0.1111 | 0.1334 | 0.2010 | 0.2334 | 0.3442 | 0.3529 |
| B. Stock options sample | ||||||
| TREATED×TIME | 0.0216*** | 0.0201*** | 0.0097 | 0.0089 | –0.0032 | –0.0748 |
| (3.82) | (2.69) | (1.06) | (0.82) | (–0.19) | (–1.38) | |
| TIME | –0.0154*** | –0.0214** | –0.0162 | –0.0361** | –0.0195 | –0.0545 |
| (–2.65) | (–2.36) | (–1.29) | (–2.35) | (–0.81) | (–0.56) | |
| Control variables | Yes | Yes | Yes | Yes | Yes | Yes |
| N | 4668 | 4240 | 3793 | 3235 | 1840 | 487 |
| R2 | 0.1466 | 0.1598 | 0.2718 | 0.2882 | 0.4165 | 0.3962 |
| C. Restricted stock sample | ||||||
| TREATED×TIME | 0.0265*** | 0.0174*** | 0.0218*** | 0.0102 | 0.0265** | 0.00001 |
| (5.67) | (3.20) | (3.28) | (1.25) | (2.14) | (0.00) | |
| TIME | –0.0175*** | –0.0033 | –0.0062 | –0.0009 | –0.0069 | –0.0534 |
| (–2.63) | (–0.40) | (–0.51) | (–0.05) | (–0.30) | (–0.98) | |
| Control variables | Yes | Yes | Yes | Yes | Yes | Yes |
| N | 6600 | 6182 | 5702 | 4891 | 2211 | 600 |
| R2 | 0.1171 | 0.1658 | 0.1936 | 0.2553 | 0.3819 | 0.5566 |
Note: t-statistics are presented in parentheses. *, **, and *** indicate significance at the 10%, 5%, and 1% levels, respectively. To conserve space, the coefficients and t-statistics for the control variables are not shown.
4.4.2.1 Considering Potential Omitted Variable Bias: Executives Tenure
Existing research suggests that executive tenure, particularly for the chairperson and CEO, can influence firm financial performance within the Chinese corporate governance framework. Pan and Guo (2019) found an inverted U-shaped relationship between firm performance and chairperson tenure, and a positive relationship with expected tenure. Chen (2011) argued that longer CEO tenure contributes to greater stability and efficiency within the top management team, reduces conflict, and thus improves performance. Wei et al (2018) suggested that longer-tenured executives may also develop stronger social and business networks, which can help address complex issues related to knowledge, technology, and social capital accumulation, thereby enhancing financial performance. However, contradictory evidence also exists. For instance, Hamori and Koyuncu (2015) found a negative relationship between CEO tenure and firm performance. Despite these differing findings, the evidence supporting the influence of executive tenure on firm performance is substantial. Consequently, Chen (2018) argued that executive tenure is a crucial omitted variable that should not be ignored in empirical tests of equity incentive effects. To mitigate this potential omitted variable bias, this study incorporates both chairperson and CEO tenure into further empirical testing.
Table 13 presents the results of the DID analysis examining the overall incentive effect of equity incentives and different equity incentive modes on promoting sustainable financial growth, after controlling for executive tenure. The results indicate that chairperson tenure (represented by CHMTENURE) generally negatively affects sustainable financial growth, while CEO tenure (represented by CEOTENURE) generally has a positive effect. Importantly, these effects, whether positive or negative, significant or insignificant, do not alter the previous conclusions regarding the positive effect of equity incentives and their different modes on promoting sustainable financial growth. Table 14 presents the DID analysis examining the lasting incentive effect of equity incentives and their different modes on promoting sustainable financial growth, after controlling for executive tenure. Panel A presents the results for the full sample, Panel B for the stock option sample, and Panel C for the restricted stock sample. The results in Table 14 demonstrate that neither chairperson nor CEO tenure alters the variation characteristics of the lasting incentive effects of equity incentives, regardless of the equity incentive mode or the sample considered. These findings remain consistent with the previous analyses, indicating that the study’s conclusions are robust to the inclusion of executive tenure.
| Samples | Full sample | Stock options sample | Restricted stock sample | |||
| Models | (1) | (2) | (3) | (4) | (5) | (6) |
| Variables | VSGR | VSGR | VSGR | VSGR | VSGR | VSGR |
| TREATED×TIME | 0.0197*** | 0.0233*** | 0.0197*** | 0.0206*** | 0.0196*** | 0.0244*** |
| (5.29) | (6.32) | (3.28) | (3.46) | (4.09) | (5.13) | |
| TIME | –0.0054* | –0.0050 | –0.0100** | –0.0071 | –0.0024 | –0.0032 |
| (–1.73) | (–1.62) | (–2.01) | (–1.44) | (–0.61) | (–0.80) | |
| CHMTENURE | –0.0018*** | –0.0010** | –0.0022*** | –0.0014* | –0.0016*** | –0.0008 |
| (–4.20) | (–2.34) | (–3.06) | (–1.92) | (–2.95) | (–1.48) | |
| CEOTENURE | 0.0007 | 0.0010** | 0.0020*** | 0.0022*** | –0.0003 | 0.0001 |
| (1.61) | (2.35) | (3.00) | (3.27) | (–0.55) | (0.28) | |
| Control variables | No | Yes | No | Yes | No | Yes |
| N | 24,363 | 24,363 | 9783 | 9783 | 14,580 | 14,580 |
| R2 | 0.0476 | 0.0760 | 0.0538 | 0.0860 | 0.0525 | 0.0797 |
Note: t-statistics are presented in parentheses. *, **, and *** indicate significance at the 10%, 5%, and 1% levels, respectively. To conserve space, the coefficients and t-statistics for the control variables are not shown.
| Incentive periods | Year 1 | Year 2 | Year 3 | Year 4 | Year 5 | Year 6 |
| Models | (1) | (2) | (3) | (4) | (5) | (6) |
| Variables | VSGR | VSGR | VSGR | VSGR | VSGR | VSGR |
| A. Full sample | ||||||
| TREATED×TIME | 0.0246*** | 0.0198*** | 0.0190*** | 0.0164** | 0.0158 | –0.0254 |
| (6.57) | (4.34) | (3.46) | (2.50) | (1.57) | (–0.83) | |
| TIME | –0.0111** | –0.0039 | –0.0078 | –0.0197* | –0.0082 | –0.0262 |
| (–2.54) | (–0.64) | (–0.89) | (–1.81) | (–0.49) | (–0.49) | |
| CHMTENURE | –0.0039*** | –0.0024*** | –0.0002 | –0.0009 | –0.0011 | 0.0023 |
| (–3.97) | (–2.79) | (–0.26) | (–0.94) | (–0.88) | (0.64) | |
| CEOTENURE | –0.0010 | 0.0012 | 0.0002 | 0.0008 | 0.0022* | 0.0022 |
| (–1.20) | (1.55) | (0.26) | (0.95) | (1.78) | (0.59) | |
| Control variables | Yes | Yes | Yes | Yes | Yes | Yes |
| N | 11,268 | 10,422 | 9495 | 8126 | 4051 | 1087 |
| R2 | 0.1085 | 0.1478 | 0.1896 | 0.2260 | 0.2887 | 0.2535 |
| B. Stock options sample | ||||||
| TREATED×TIME | 0.0205*** | 0.0177** | 0.0096 | 0.0112 | –0.0011 | –0.0771 |
| (3.48) | (2.28) | (1.01) | (0.98) | (–0.07) | (–1.35) | |
| TIME | –0.0103* | –0.0143 | 0.0020 | –0.0258 | –0.0080 | –0.0798 |
| (–1.67) | (–1.51) | (0.15) | (–1.59) | (–0.33) | (–0.76) | |
| CHMTENURE | –0.0056*** | –0.0009 | 0.0004 | –0.0008 | –0.0006 | 0.0018 |
| (–3.47) | (–0.64) | (0.27) | (–0.49) | (–0.29) | (0.24) | |
| CEOTENURE | –0.0003 | 0.0026** | –0.0014 | 0.0013 | 0.0012 | 0.0112 |
| (–0.23) | (1.98) | (–1.04) | (0.98) | (0.59) | (1.58) | |
| Control variables | Yes | Yes | Yes | Yes | Yes | Yes |
| N | 4668 | 4240 | 3793 | 3235 | 1840 | 487 |
| R2 | 0.1531 | 0.1725 | 0.2482 | 0.2493 | 0.4048 | 0.3676 |
| C. Restricted stock sample | ||||||
| TREATED×TIME | 0.0269*** | 0.0198*** | 0.0249*** | 0.0155* | 0.0296** | –0.0032 |
| (5.45) | (3.51) | (3.62) | (1.88) | (2.33) | (–0.10) | |
| TIME | –0.0124* | 0.0034 | –0.0116 | –0.0048 | –0.0135 | –0.0596 |
| (–1.76) | (0.41) | (–0.92) | (–0.29) | (–0.57) | (–1.11) | |
| CHMTENURE | –0.0029** | –0.0030*** | –0.0007 | –0.0008 | –0.0019 | 0.0052 |
| (–2.33) | (–2.99) | (–0.66) | (–0.70) | (–1.11) | (1.35) | |
| CEOTENURE | –0.0012 | 0.0004 | 0.0012 | 0.0004 | 0.0022 | –0.0063 |
| (–1.09) | (0.40) | (1.21) | (0.34) | (1.35) | (–1.57) | |
| Control variables | Yes | Yes | Yes | Yes | Yes | Yes |
| N | 6600 | 6182 | 5702 | 4891 | 2211 | 600 |
| R2 | 0.1036 | 0.1816 | 0.1982 | 0.2742 | 0.3450 | 0.5607 |
Note: t-statistics are presented in parentheses. *, **, and *** indicate significance at the 10%, 5%, and 1% levels, respectively. To conserve space, the coefficients and t-statistics for the control variables are not shown.
4.4.2.2 2SLS Regression with Instrumental Variables
While the PSM-DID approach mitigates sample selection bias and omitted variable bias, and the inclusion of lagged financial performance as a control variable addresses reverse causality concerns, the occurrence of equity incentive events in the current period might still be influenced by sustainable financial growth. To address this issue, an instrumental variable (IV) 2SLS regression analysis is employed.
Existing research suggests that companies often emulate peer firms within their industry when deciding whether and how to implement equity incentive plans (Zhi et al, 2014). Zhao (2016) found significant herding behavior in executive compensation among Chinese non-financial listed companies, a finding also corroborated by Faulkender and Yang (2010) using U.S. data. This supports the existence of a herding effect in equity incentive plan adoption. Therefore, when launching equity incentive plans, listed companies are likely to refer to the practices of other firms in the same industry, particularly industry leaders. Consequently, the equity incentive implementation behavior of industry leaders should be positively correlated with the implementation behavior of firms in the treatment group sample. However, the implementation behavior of leading firms generally does not have a direct impact on the financial performance of treatment group sample firms, making it a suitable instrumental variable. Because only one leading firm can be selected within each industry, the single equity incentive event of the leading firm cannot directly serve as an instrumental variable for other firms in the treatment group sample within the same industry. Therefore, this study uses the time lag (represented by TREATED_LTPERIOD) between the year the treatment group sample firm implemented its equity incentive plan and the year the industry-leading firm implemented its equity incentive plan as a proxy variable. A shorter time lag suggests a higher likelihood that the treatment group sample firm was influenced by the industry leader and followed its lead in implementing an equity incentive plan. Thus, TREATED_LTPERIOD is expected to be negatively correlated with the probability of a firm implementing an equity incentive plan (i.e., the dependent variable in Eqn. 1 and the main explanatory variable TREATED in Eqn. 2).
In the first stage of the 2SLS analysis, the instrumental variable
TREATED_LTPERIOD is used to predict the fitted value (represented by
TREATED_hat) of the main explanatory variable TREATED using
Eqn. 1. The results (Table 15) show a significant negative correlation between
TREATED_LTPERIOD and TREATED. The Pseudo R2,
| Model | (1) | (2) | (3) |
| Variables | INCENT | OPTION | RESTOCK |
| TREATED_LTPERIOD | –0.0636*** | –0.0484*** | –0.0734*** |
| (–6.85) | (–3.60) | (–6.17) | |
| Control variables | Yes | Yes | Yes |
| N | 25,791 | 23,718 | 23,124 |
| Pseudo R2 | 0.2417 | 0.3271 | 0.1659 |
| χ2 | 5272.9251 | 4167.5422 | 2315.3835 |
| AUC | 0.8377 | 0.8888 | 0.8002 |
Note: ① Values in parentheses are two-tailed t-statistics. *** indicate significance at the 1% levels. ② Regression results for control variables are omitted for brevity. ③ AUC, area under the curve. ④ The total number of sample observations is 28,709, with 4027 samples implementing equity incentives (the number of successfully matched treatment group samples through PSM is 2817, but the total number of samples implementing equity incentives should be used when calculating the probability of each observation implementing equity incentives). Of these, 1890 samples implemented stock options, and 2137 implemented restricted stock. The number of samples without equity incentives is 24,682. The initial sample sizes for the full equity incentive sample, stock option sample, and restricted stock sample regressions in this table are 28,709 (4027 + 24,682), 26,572 (1890 + 24,682), and 26,819 (2137 + 24,682), respectively. However, due to the one-period lag, the actual sample sizes used in the regressions are 25,791, 23,718, and 23,124, respectively.
| Samples | Full sample | Stock options sample | Restricted stock sample | |||
| Models | (1) | (2) | (3) | (4) | (5) | (6) |
| Variables | VSGR | VSGR | VSGR | VSGR | VSGR | VSGR |
| TREATED×TIME | 0.0357*** | 0.0446*** | 0.0374*** | 0.0398*** | 0.0342** | 0.0484*** |
| (3.55) | (4.46) | (2.61) | (2.81) | (2.34) | (3.32) | |
| TREATED | –0.0630*** | –0.0140 | –0.0768** | –0.0190 | –0.0486* | –0.0077 |
| (–2.92) | (–0.57) | (–2.34) | (–0.51) | (–1.65) | (–0.23) | |
| TIME | –0.0008 | 0.0004 | –0.0064 | –0.0032 | 0.0029 | 0.0030 |
| (–0.29) | (0.12) | (–1.38) | (–0.69) | (0.78) | (0.82) | |
| Control variables | No | Yes | No | Yes | No | Yes |
| N | 24,363 | 24,363 | 9783 | 9783 | 14,580 | 14,580 |
| R2 | 0.0461 | 0.0747 | 0.0519 | 0.0841 | 0.0507 | 0.0784 |
Note: t-statistics are presented in parentheses. *, **, and *** indicate significance at the 10%, 5%, and 1% levels, respectively. To conserve space, the coefficients and t-statistics for the control variables are not shown.
| Incentive periods | Year 1 | Year 2 | Year 3 | Year 4 | Year 5 | Year 6 |
| Models | (1) | (2) | (3) | (4) | (5) | (6) |
| Variables | VSGR | VSGR | VSGR | VSGR | VSGR | VSGR |
| A. Full sample | ||||||
| TREATED×TIME | 0.0378*** | 0.0397*** | 0.0417** | 0.0352* | 0.0101 | –0.1771 |
| (3.75) | (3.12) | (2.48) | (1.69) | (0.30) | (–1.22) | |
| TREATED | –0.1354*** | –0.0205 | 0.0549 | 0.0051 | 0.1812** | 0.4076 |
| (–3.07) | (–0.51) | (1.08) | (0.09) | (2.14) | (1.32) | |
| TIME | –0.0055 | 0.0003 | –0.0027 | –0.0154 | –0.0038 | –0.0232 |
| (–1.36) | (0.05) | (–0.32) | (–1.45) | (–0.24) | (–0.45) | |
| Control variables | Yes | Yes | Yes | Yes | Yes | Yes |
| N | 11,268 | 10,422 | 9495 | 8126 | 4051 | 1087 |
| R2 | 0.1018 | 0.1448 | 0.1897 | 0.2252 | 0.2900 | 0.2526 |
| B. Stock options sample | ||||||
| TREATED×TIME | 0.0265* | 0.0459** | 0.0398 | 0.0465 | –0.0529 | –0.8592*** |
| (1.90) | (2.35) | (1.46) | (1.30) | (–0.95) | (–2.72) | |
| TREATED | –0.1495** | 0.0008 | 0.0034 | –0.0197 | 0.2232* | 1.4165** |
| (–2.38) | (0.01) | (0.04) | (–0.20) | (1.66) | (2.24) | |
| TIME | –0.0066 | –0.0088 | 0.0024 | –0.0240 | –0.0090 | –0.1056 |
| (–1.21) | (–0.99) | (0.19) | (–1.56) | (–0.39) | (–1.08) | |
| Control variables | Yes | Yes | Yes | Yes | Yes | Yes |
| N | 4668 | 4240 | 3793 | 3235 | 1840 | 487 |
| R2 | 0.1471 | 0.1709 | 0.2485 | 0.2494 | 0.4079 | 0.3780 |
| C. Restricted stock sample | ||||||
| TREATED×TIME | 0.0562*** | 0.0313* | 0.0454** | 0.0133 | 0.0647 | –0.0610 |
| (3.70) | (1.80) | (2.09) | (0.52) | (1.58) | (–0.45) | |
| TREATED | –0.1584** | –0.0285 | 0.0326 | 0.0774 | 0.0536 | 0.1912 |
| (–2.47) | (–0.52) | (0.50) | (1.10) | (0.50) | (0.59) | |
| TIME | –0.0081 | 0.0059 | –0.0041 | 0.0010 | –0.0086 | –0.0661 |
| (–1.18) | (0.73) | (–0.33) | (0.06) | (–0.37) | (–1.24) | |
| Control variables | Yes | Yes | Yes | Yes | Yes | Yes |
| N | 6600 | 6182 | 5702 | 4891 | 2211 | 600 |
| R2 | 0.0979 | 0.1765 | 0.1956 | 0.2737 | 0.3427 | 0.5507 |
Note: t-statistics are presented in parentheses. *, **, and *** indicate significance at the 10%, 5%, and 1% levels, respectively. To conserve space, the coefficients and t-statistics for the control variables are not shown.
The empirical results above show that executive equity incentives and their different modes have played a significant role in promoting corporate sustainable financial growth. However, do companies with higher sustainable financial growth rates truly have better sustainable development performance? For example, do they have better performance in ESG (Environmental, Social, and Governance), which represents sustainable development goals? Furthermore, is sustainable financial growth a mediating variable between the implementation of executive equity incentives and long-term sustainable development goals? That is, can sustainable financial growth explain the mechanism by which executive equity incentives affect corporate sustainable development goals such as ESG performance? This is both a natural and interesting continuation of this research and the background from which the central question of this paper originates. Thus, further research is needed to establish a comprehensive research cycle. Therefore, this paper introduces ESG performance, which represents sustainable development goals, as a dependent variable and uses a mediation effect test model to examine the impact of sustainable financial growth on corporate ESG performance to verify the mediating mechanism of sustainable financial growth between executive equity incentives and long-term sustainable development goals. Referring to the mediation effect test model constructed by Wen and Ye (2014), the model is as follows:
Eqn. 5 characterizes whether executive equity incentives promote corporate ESG
performance. Eqn. 6 is used to characterize whether executive equity incentives
promote sustainable financial growth. Eqn. 7 is used to characterize whether
sustainable financial growth contributes to promoting ESG performance, after
controlling for the direct effect of executive equity incentives on ESG.
Table 18 reports the mediation effect test results of the role of sustainable financial growth on executive equity incentives promoting ESG performance. Column (1) presents the regression results of Eqn. 5, showing that executive equity incentives have a significant positive impact on the achievement of corporate sustainable development goals at the 1% significance level. Column (2) presents the regression results of Eqn. 6, also showing that executive equity incentives positively promote corporate sustainable financial growth at the 1% significance level. Column (3) presents the regression results of Eqn. 7. It can be seen that, at the 1% significance level, sustainable financial growth not only has a significant positive impact on corporate ESG performance but also reveals that the direct effect of executive equity incentives on corporate ESG performance diminishes, shifting to exert its effect through the mediating role of sustainable financial growth. This result fully validates the theoretical logic of this paper, namely, that corporate sustainable financial growth is an important prerequisite for achieving corporate sustainable development goals, and executive incentives are an important driving force for corporate sustainable financial growth. When studying the long-term sustainable development of enterprises, it is necessary to focus on the fundamental prerequisite of sustainable financial growth. In addition, this paper also conducted mediation effect tests on the two subsamples of stock options and restricted stock. The results further show that the mediating effect of sustainable financial growth on executive equity incentives influencing sustainable development goals such as ESG performance mainly exists in the restricted stock sample. This further strengthens the test results of the previous PSM-DID research method; that is, restricted stock not only has a better incentive effect on sustainable financial growth than stock options but also has a stronger mediating effect in promoting sustainable development goals such as ESG performance compared to stock options.
| Model | (1) | (2) | (3) |
| Variable | ESG | VSGR | ESG |
| INCENT | 0.8032*** | 0.0098*** | 0.7730*** |
| (13.36) | (5.89) | (12.90) | |
| VSGR | 3.0819*** | ||
| (13.04) | |||
| L_LNTA | 1.0183*** | 0.0042*** | 1.0053*** |
| (28.20) | (4.21) | (27.93) | |
| L_LEV | –4.8734*** | –0.0174*** | –4.8196*** |
| (–25.73) | (–3.32) | (–25.54) | |
| L_ROE | 6.5061*** | 0.3080*** | 5.5568*** |
| (32.62) | (55.74) | (26.25) | |
| L_ORGR | –0.0509 | 0.0027*** | –0.0592* |
| (–1.41) | (2.68) | (–1.65) | |
| L_LNMPAY | 0.8158*** | 0.0112*** | 0.7813*** |
| (14.86) | (7.38) | (14.27) | |
| L_MMSR | 3.3101*** | 0.0624*** | 3.1177*** |
| (13.59) | (9.25) | (12.82) | |
| L_DUAL | –0.0220 | –0.0038** | –0.0104 |
| (–0.36) | (–2.22) | (–0.17) | |
| L_BOARD | –0.1200*** | –0.0010*** | –0.1168*** |
| (–9.72) | (–3.04) | (–9.50) | |
| L_INBOARD | 3.6228*** | 0.0222** | 3.5544*** |
| (9.32) | (2.06) | (9.18) | |
| L_SHARE1 | 1.2733* | 0.1228*** | 0.8949 |
| (1.74) | (6.07) | (1.23) | |
| L_INSTITUHP | 1.1392*** | 0.0418*** | 1.0104*** |
| (6.04) | (8.00) | (5.37) | |
| L_ECONCENT | –1.0652 | –0.1493*** | –0.6050 |
| (–1.23) | (–6.24) | (–0.70) | |
| L_EBALANCE | 0.4653*** | 0.0083** | 0.4397*** |
| (3.18) | (2.05) | (3.01) | |
| L_STATE | 1.0762*** | 0.0009 | 1.0735*** |
| (11.70) | (0.35) | (11.71) | |
| Constant | 35.9460*** | –0.2249*** | 36.6392*** |
| (31.60) | (–7.14) | (32.30) | |
| YEAR | Yes | Yes | Yes |
| INDUSTRY | Yes | Yes | Yes |
| N | 23,255 | 23,255 | 23,255 |
| R2 | 0.2490 | 0.2126 | 0.2544 |
| F | 78.3281 | 63.7990 | 79.8204 |
Note: ① “L_” denotes a one-period lag. t-statistics are presented in parentheses; The double tail test T-value in parentheses, *, **, *** represent significant at the level of 10%, 5% and 1% respectively. ② Since the collected ESG data of China Securities began in 2009, the number of sample observations for regression was 23,255, which was lower than 24,363 in the full-sample regression.
Based on data from Chinese listed companies from 2006 to 2023, this paper examines the impact of executive equity incentive events and their various modes on corporate sustainable financial growth. By employing a combined research method of PSM and DID, we confirm our hypotheses and obtain a series of significant findings with both theoretical and practical implications.
First, equity incentive events, in general, have a significant incentive effect on promoting corporate sustainable financial growth. This finding is consistent with agency theory, which suggests that by granting equity incentives, executives obtain residual claims, thereby aligning their interests with those of shareholders and motivating them to adopt long-term-oriented business strategies. Consistent with the findings of existing empirical studies showing that equity incentives affect traditional financial performance indicators such as return on equity (ROE) and return on assets (ROA), this effect is attributed to both the shared theoretical foundation and the same incentive theory logic. Moreover, traditional financial performance factors such as net profit margin on sales and asset turnover ratio are also important determinants of the sustainable financial growth rate (financial sustainable growth rate = net profit margin on sales * asset turnover ratio * equity multiplier * earnings retention ratio). However, it must be pointed out that the empirical results of this paper differ from those of existing studies on the relationship between equity incentives and sustainable financial growth. For example, Xu et al (2020) found that there is no significant correlation between executive equity incentives and corporate sustainable financial growth when equity incentives are used as a moderating variable to influence the relationship between innovation investment and sustainable financial growth. In response to this, we argue that, in addition to the difference between using equity incentives as a moderating variable in Xu et al (2020) and as the main explanatory variable in this paper, there are two other reasons. First, the definition of equity incentives is different. This paper uses the quasi-natural event of whether equity incentives are implemented, while Xu et al (2020) use the proportion of executive shareholdings, which refers to the stocks already held by executives, which differs from the future, formal, and periodic equity incentive events referred to in this paper. Clearly, compared to stocks that need to be earned through future efforts, the incentive effect of stocks already held by executives may be limited. For example, Lakonishok and Lee (2001) found that stocks already held by executives, due to the lack of exercise waiting periods stipulated in equity incentive events, are more likely to induce executives to engage in opportunistic behavior such as stock arbitrage, thereby weakening the incentive effect of shareholding. Second, the samples of empirical studies differ. This paper is based on a sample of companies from all industries, while Xu et al (2020) only focus on labor-intensive energy companies, which may imply that industry is an important moderating variable.
Second, the incentive effect of equity-based compensation is sustained over a long period, lasting at least four years after the equity incentive event occurs. This indicates that equity-based compensation not only motivates executives to take proactive actions in the short term but also encourages them to focus on the long-term development of the enterprise. This provides new empirical evidence for the long-term incentives characteristics of equity-based compensation and complements the existing research that primarily focuses on the short-term financial performance improvement effects of equity incentives.
Third, we compared the incentive effects of two main modes of equity incentives: restricted stock and stock options. The results show that restricted stock has a significantly better incentive effect than stock options. This finding can be explained by the differences in rights, obligations, and risk-bearing capacity between restricted stock and stock options, which are consistent with the conclusions of mainstream literature. However, the theoretical perspective of this finding is different from that of existing empirical literature. This paper focuses on the risk-bearing capacity of human capital and physical capital, as well as the contractual arrangements made before or after investment of the two types of capital. This paper argues that restricted stock requires executives to invest in equity incentives in advance, which is essentially a dual investment of executives’ physical capital and human capital. This dual investment enables executives to take on credible and greater loss risks while obtaining equity incentives, thereby motivating them to improve corporate sustainable financial growth. In contrast, stock options are granted to executives for free in advance, corresponding only to the executives’ human capital (which cannot be mortgaged). Due to the lack of a risk-bearing mechanism associated with the dual investment of the two types of capital, the incentive effect of stock options is relatively weak. Through this analytical perspective, this paper thoroughly analyzes the incentive mechanisms of the two modes of equity incentives, reveals a deeper level of corporate governance logic, enriches the theory of equity incentives, emphasizes the importance of matching equity incentive modes with the long-term development goals of enterprises, and provides a new theoretical basis for optimizing corporate governance structures.
Furthermore, this study found that sustainable financial growth plays a significant mediating role in the promotion of corporate ESG performance by executive equity incentives. This finding provides a mechanistic explanation for the conclusions of existing empirical literature on equity incentives promoting corporate ESG performance (Zeng et al, 2023), implying that sustainable financial growth is an indispensable link in achieving corporate sustainability goals. From the perspective of sustainability research, sustainable financial growth is an indispensable part of studies on executive equity incentives and corporate sustainability.
In conclusion, this study not only enriches the theoretical literature on executive equity incentives and corporate sustainable financial growth but also provides multidimensional insights, which, based on a series of meaningful conclusions drawn in this paper, offer valuable guidance for corporate governance practices, policymaking, and academic research: (1) Equity incentives serve as a crucial institutional mechanism for modern corporate executives to participate in residual sharing and align residual control rights with residual claim rights. They are effective incentive systems that incentivize executives to enhance the firm’s capacity for sustainable growth in the interest of shareholders. Therefore, when designing incentive structures to pursue sustainability goals, firms should fully consider the incentive impact of equity incentives on the financial sustainability of the company and incorporate equity incentive contracts into executive compensation packages. (2) The ex-ante arrangement of incentive modes within equity incentive contracts is the key to determining the efficiency of equity incentives. Equity incentive contracts with ex-ante free grants of residual claim rights, such as stock options, may lead to efficiency losses. In contrast, restricted stock incentive contracts that require executives to make ex-ante investments in physical capital have more lasting incentive effects. This is because the incentive mode of restricted stock aligns with the dual investments of executives’ human capital and physical capital, thereby exerting a stronger dual governance effect of both incentives and constraints. Therefore, when designing equity incentive contracts, firms should carefully consider the choice of incentive mode. For companies pursuing sustainable growth, restricted stock incentives should be prioritized, or stock options can be reasonably combined to fully leverage their advantages and strengthen the incentive effect. (3) Governments and firms should adhere to the goal of corporate sustainable development when formulating equity incentive policies. To maximize the role of equity incentives in promoting long-term sustainable development, sustainable financial growth should be included in the performance evaluation criteria for equity incentives, rather than focusing solely on traditional short-term financial performance measures. Only by promoting the realization of financial sustainability can enterprises actively fulfill their social responsibilities and thus facilitate environmental and socio-economic sustainability. Furthermore, the findings of this study provide theoretical support for the claim that sustainable financial growth is a crucial aspect of research on executive incentives and corporate sustainability. Research on equity incentives for modern corporate executives should focus on the issue of corporate sustainability and more strongly emphasize the design and implementation of management incentive contracts from a long-term sustainability perspective.
However, it should be noted that the conclusions of this study are based on a Chinese sample, and the specific institutional context of China may limit the applicability of the conclusions and implications of this study to other economies. For example, the widespread control of listed companies by major shareholders in China and the special arrangements of rights and responsibilities in the governance structure of the board of directors and the supervisory board are very different from those of emerging economies such as India, Indonesia, Malaysia, and Vietnam, which may affect the decision-making motives of equity incentive plans and the design of equity incentive contracts. Therefore, caution should be exercised when referring to the conclusions and implications of this paper. Moreover, the empirical study in this paper does not consider the potential impact of various external risk factors on the impact of equity incentives on sustainable financial growth, such as changes in the macroeconomic environment and market risk fluctuations over the 18-year period from 2006 to 2023. It also does not perform a group-wise test of the differences in the impact of equity incentives across industries and across companies of different sizes, nor does it explore the synergistic effects of equity incentives and traditional salary incentives on sustainable financial growth. These dimensions may, to some extent, affect the applicability of the conclusions of the study to different scenarios. In future research, we can further explore the differences in equity incentives in different macroeconomic and political environments, different industries, and companies of different sizes, as well as the synergistic effect of equity incentives and other incentive mechanisms, in order to more comprehensively understand the impact of equity incentives on corporate sustainable financial growth and its role in achieving corporate sustainable development goals.
The datasets used and/or analyzed during the current study are available from the corresponding author on reasonable request.
YH designed the research study, performed the research, analyzed the data, and wrote the initial draft of the article. YH and RZ revised the entire manuscript. JG undertook the data processing work. All authors read and approved the final manuscript. All authors have participated sufficiently in the work and agreed to be accountable for all aspects of the work.
We sincerely thank the reviewers for their very valuable and professional comments.
This research was funded by: (1) The Philosophy and Social Science Planning Project of Zhejiang Province, Project Number: 24NDJC06Z, Philosophy and Social Science Work Office of Zhejiang Province; (2) The National Social Science Fund of China, Project Number: 23BGL247, National Office for Philosophy and Social Sciences of China.
The authors declare no conflict of interest.
References
Publisher’s Note: IMR Press stays neutral with regard to jurisdictional claims in published maps and institutional affiliations.