
 , Yangyang Wang 1, Chao Ge 3,*
1 School of Accounting, Hangzhou Dianzi University, 310018 Hangzhou, Zhejiang, China
2 International College, Krirk University, 10220 Bangkok, Thailand
3 School of Economics, Shenzhen Polytechnic University, 518055 Shenzhen, Guangdong, China
Abstract
State-owned capital participation is a form of mixed-ownership reform that integrates state capital into private enterprises, exerting significant influence on their operations and development. This study examines the phenomenon of state-owned capital participation in Chinese private enterprises and its impact on tax avoidance behavior. The key findings reveal that state capital involvement significantly curtails tax avoidance among private firms, with a more pronounced effect in regions where the private economy is underdeveloped, when state-owned shareholders are non-financial institutions, or when they appoint directors and supervisors. However, whether the state-owned shareholder has a central enterprise background does not exert a notable influence. Furthermore, the study finds that tax avoidance undermines the long-term value of enterprises. State capital participation effectively mitigates tax avoidance by increasing government subsidies, facilitating bank credit loans, and restraining controlling shareholders from engaging in “tunneling” activities. The findings of this study help clarify debates surrounding mixed-ownership reform and provide valuable Chinese insights for advancing private enterprise reforms to promote high-quality development.
Keywords
- private enterprises
- tax avoidance
- mixed ownership
Since the implementation of the reform and opening-up policy, China’s economy has experienced sustained and rapid growth. The private economy has evolved from nonexistence to becoming a powerful force. As a vital component and driving force of China’s economy, the private sector has always been highly valued by the Chinese government. In July 2023, the “Opinions of the Central Committee of the Communist Party of China and the State Council on Promoting the Development and Growth of the Private Economy” explicitly emphasized the continuous optimization of the environment for private economic development and the enhancement of legal safeguards for its growth.
Compared to the state-owned economy, the private economy boasts advantages such as clear property rights and the ability to allocate resources based on market demands effectively (Xiao et al, 2024). The private economy contributes over 50% of China’s tax revenue, more than 60% of its GDP, over 70% of technological innovations, and over 80% of urban employment and accounts for more than 90% in terms of the number of enterprises (The data is quoted from the Chinese government website). However, the private sector still faces “credit discrimination” in the market (Bai et al, 2021; Lu et al, 2012) despite repeated governmental policies emphasizing equal treatment of enterprises of all ownership types in resource access based on the principle of ‘competitive neutrality’. Nevertheless, challenges such as “difficult and expensive financing” persist (He et al, 2022). The fundamental obstacle to the development of the private economy lies in the lack of protection of property rights and checks and balances, which ultimately restrict private enterprises from achieving higher levels of growth.
To foster the growth and prosperity of the private economy, China has implemented mixed-ownership reforms in private enterprises—known as reverse mixed-ownership reform—encouraging state-owned shareholders to invest in private firms to achieve a harmonious integration of state and private capital (He et al, 2022). However, in the course of policy implementation, the influence of state capital participation on private enterprise behavior is not unidirectional. On the one hand, it grants these companies access to substantial resources, alleviating their financing constraints (Wu, 2017) and allowing them to enjoy the same policy benefits as state-owned enterprises (Bai et al, 2021; Ge and Qiu, 2007; Lu et al, 2012). Moreover, the participation of state shareholders in the governance of private enterprises enhances the quality of accounting information (Zhao and Mao, 2023), contributing to checks and balances against “tunneling” behaviors by non-state majority shareholders (Zhang et al, 2023). On the other hand, state capital participation may lead to an overreliance on governmental support, causing private enterprises to lose their entrepreneurial drive and risk becoming “zombie companies” (Shao et al, 2022). Additionally, state capital involvement may label these enterprises with a “state-owned” identity, placing them under the dual pressure of pursuing their development while fulfilling broader “social responsibility” objectives, thereby shifting their development focus (Huang et al, 2024). Thus, the extent to which state capital participation influences the economic behavior and outcomes of mixed-ownership private enterprises remains an area requiring deeper exploration.
Tax avoidance encompasses a range of economic activities undertaken by enterprises to minimize their tax burden (Hanlon and Slemrod, 2009). While such practices can yield tax savings and alleviate financing constraints for private enterprises, they may also erode the tax base (Freedman, 2003; Friese et al, 2006) and exacerbate agency problems (Desai and Dharmapala, 2006), such as rent extraction by insiders at the expense of minority shareholders. The degree of aggressiveness in tax avoidance among private enterprises is of particular concern due to its broad implications—for businesses, the state, and minority shareholders alike. However, the question of whether state capital participation serves to foster or curtail tax avoidance, and the underlying mechanisms driving this relationship, remains insufficiently explored in the existing literature.
This study posits that state capital participation serves to restrain tax avoidance in mixed-ownership private enterprises. This effect operates through two primary mechanisms: “resource acquisition” and “heterogeneous shareholder governance”, both of which shape the tax avoidance behavior of such enterprises. On the one hand, the “resource acquisition” hypothesis suggests that state capital participation not only brings direct resources such as capital, human resources, and technology to private mixed-ownership enterprises (Shen et al, 2020) but also provides access to policy-related resources such as subsidies, financing, and tax incentives due to their “state-owned” status (Wu et al, 2012). The benefits derived from enhanced resource acquisition reduce the motivation for these enterprises to engage in tax avoidance in pursuit of tax-related gains. On the other hand, the “heterogeneous shareholder governance” hypothesis posits that state capital participation alters the previously dominant position of private shareholders (Edmans and Manso, 2011; Jiang et al, 2018), creating a structure where multiple major shareholders of different natures balance one another, which is preferable to a single dominant shareholder (Bloch and Hege, 2003). By participating in the corporate governance of mixed-ownership private enterprises through economic reforms, state shareholders can supervise and counterbalance the decisions of non-state majority shareholders. Under such a governance structure, where heterogeneous shareholders mutually check each other, the likelihood of non-state majority shareholders extracting rents from external stakeholders through tax avoidance diminishes. Therefore, state capital participation can effectively suppress tax avoidance behavior in mixed-ownership private enterprises.
Based on the above analysis, this study employs a sample of Chinese publicly listed private enterprises spanning the period from 2009 to 2023, from the dual perspectives of the “resource acquisition” hypothesis and the “heterogeneous shareholder governance” hypothesis, how state capital participation influences corporate tax avoidance. The research findings indicate that, compared to private enterprises that have not undergone mixed-ownership reform, state capital participation effectively curtails the aggressiveness of corporate tax avoidance. Moreover, the higher the proportion of state-owned equity, the lower the level of tax avoidance in mixed-ownership private enterprises. Further analysis reveals that the effectiveness of state capital participation in curbing tax avoidance is contingent upon various factors, including the external environment in which private enterprises operate, the nature of state-owned shareholders, and their governance approaches.
The potential contributions of this study are as follows. First, grounded in the resource effect hypothesis and the heterogeneous shareholder governance hypothesis, this study seeks to elucidate the mechanisms through which mixed-ownership reform influences tax avoidance, thereby mitigating the prevailing divergences in scholarly discourse on the subject. While existing literature has explored the impact of mixed-ownership reform on corporate tax avoidance to some extent (Long et al, 2024; Tanya, 2016; Wang et al, 2021), prior studies have primarily focused on the participation of non-state shareholders in state-owned enterprises (Long et al, 2024; Wang et al, 2021) or examined the effects of state-owned enterprise privatization on tax avoidance (Tanya, 2016). Although a limited number of studies have investigated the introduction of state capital and its influence on corporate tax avoidance (Aparicio and Kim, 2023), their analyses have largely been confined to governance mechanisms, lacking a comprehensive discussion of the resource acquisition aspect of state ownership.
This study, by integrating both the resource acquisition mechanism and heterogeneous shareholder governance, provides a more holistic examination of the pathways through which state ownership exerts its influence. Furthermore, it delves deeper into the classifications of state-owned shareholders and their distinct governance approaches. By clarifying the specific mechanisms underlying state capital participation and delineating its effects on tax avoidance in various scenarios, this study enriches the existing literature on mixed-ownership reform and corporate tax avoidance.
Second, this study, from the perspective of state capital participation, delves into the factors influencing tax avoidance in mixed-ownership enterprises, enriching the related literature on tax avoidance determinants. The factors influencing tax avoidance are diverse, potentially driven by motives for tax savings (Edwards et al, 2016; Khan et al, 2017) or by insider rent-seeking behaviors (Bauer et al, 2020; Chan et al, 2016). Therefore, understanding the true drivers of corporate tax avoidance requires multifaceted consideration. By examining the “resource acquisition hypothesis” and the “heterogeneous major shareholder governance” hypothesis, this study thoughtfully considers the various motives behind tax avoidance, arriving at credible conclusions that provide valuable empirical evidence for understanding tax avoidance motives and governance.
Finally, this study draws on the shock event of China’s mixed-ownership reform to offer Chinese insights into corporate economic system reform. The results suggest that the presence of non-state equity is not necessarily the greater, the better. In an environment characterized by information asymmetry and property rights discrimination, private enterprises can achieve “state ownership” through the introduction of state capital, not only leveraging the advantages of the private economy but also benefiting from the resource advantages and oversight mechanisms of state capital, thus attaining higher-quality development.
The literature on the impact of state capital participation on privatized mixed-ownership enterprises can be broadly categorized into two aspects: resource acquisition and heterogeneous shareholder governance.
The “resource acquisition” hypothesis suggests that state capital participation brings much-needed resources, such as capital and technology, to privatized mixed-ownership enterprises, helping them overcome financial difficulties. Hao and Gong argue that state-owned equity inherently carries political attributes, allowing state capital participation to deepen political connections between privatized mixed-ownership enterprises and the government (Hao and Gong, 2017). These political ties help reduce the tax burden (Adhikari et al, 2006) and grant tax incentives (Wu et al, 2012). Due to their weaker position in terms of property rights protection (Bai et al, 2006a; Liu, 2009), private enterprises are often vulnerable to political expropriation. However, after undergoing mixed-ownership reform, private enterprises form a symbiotic relationship with the government, reducing the risk of political expropriation and increasing cash holdings (Kusnadi et al, 2015). Moreover, private firms with political connections are more likely to receive preferential access to government resources (Cull et al, 2015; Li et al, 2008), which enhances their public image and increases external financing opportunities (Wu, 2017). Additionally, state capital participation injects government credit into privatized enterprises, providing implicit guarantees and increasing their likelihood of securing bank loan approvals (Khwaja and Mian, 2005), even at lower interest rates (Jia et al, 2023). As a result, privatized mixed-ownership enterprises that introduce state-owned equity can optimize their debt structures, alleviating their resource shortages (Wang et al, 2022).
The “heterogeneous shareholder governance” hypothesis examines how state capital, as a heterogeneous shareholder in private enterprises, influences corporate governance. Private and state-owned capital each possess unique strengths and weaknesses in terms of operational efficiency, institutional regulations, and risk management. The combination of the two can create a synergy that produces a governance effect greater than the sum of its parts (He et al, 2022). For example, state-owned shareholders tend to act more prudently. As heterogeneous shareholders, they reduce the likelihood of private enterprises adopting high-risk financial policies in pursuit of high profits (Bernile et al, 2018), thereby mitigating managerial short-sightedness (Chen and Bao, 2024).
According to the theory of multiple-majority-shareholder governance, when a company has several large shareholders, a system of mutual oversight and checks can develop, alleviating the issue of majority shareholders “tunneling” the resources of minority shareholders (Attig et al, 2008; Boateng and Huang, 2017), thus protecting the interests of all shareholders (Casado et al, 2016). Moreover, the disparity between the identities of state and non-state shareholders, with state shareholders being more independent, results in stronger governance and supervisory effects. Additionally, private enterprises that undergo mixed-ownership reform with state capital participation tend to exhibit higher levels of corporate social responsibility disclosure (Guo et al, 2019) and greater transparency in information disclosure (Cui et al, 2018; Gulzar et al, 2018), reducing the occurrence of fraudulent activities (Zhang et al, 2023). This also suppresses the short-term profit-seeking behavior often seen in non-state majority shareholders with excessive control (Zhong et al, 2016). Furthermore, when necessary, state shareholders can leverage the threat of exit to signal negative information to the market, thereby curbing the self-serving behaviors of controlling shareholders (Calomiris et al, 2010).
Private enterprises, due to credit discrimination and difficulties in external financing, are more prone to financial distress compared to state-owned enterprises. Under financial pressure, they are more likely to resort to tax avoidance strategies to preserve cash flow and sustain normal business operations (Edwards et al, 2016; Khan et al, 2017). Beyond financial pressures, tax avoidance may also result from the self-serving behavior of controlling shareholders. In China’s capital markets, ownership structures are more concentrated, particularly in private enterprises (Jiang and Kim, 2020). While high ownership concentration can alleviate agency problems between shareholders and management, it also provides opportunities for controlling shareholders to expropriate the interests of minority shareholders. Tax avoidance, by complicating a company’s financial information and business activities (Balakrishnan et al, 2019; Chan et al, 2016), creates additional tax-saving cash flows, which controlling shareholders can exploit to divert corporate resources (Bauer et al, 2020). Therefore, the “tunneling” behavior of controlling shareholders is a significant driver of tax avoidance in privatized mixed-ownership enterprises (Chan et al, 2016).
State capital, due to its inherent political attributes, can secure preferential access to societal resources (Cull et al, 2015; Li et al, 2008). The introduction of state capital improves the financing environment of privatized mixed-ownership companies, thereby reducing their incentives for tax avoidance. Furthermore, the entry of state shareholders restructures the ownership structure of private companies (Luo et al, 2011), creating a governance framework where the complementary strengths of state and non-state controlling shareholders provide checks and balances, thereby curbing self-serving behaviors of non-state controlling shareholders.
Hence, this study argues that the introduction of state capital can influence the tax avoidance behavior of privatized mixed-ownership companies through two mechanisms: the “resource acquisition effect” and the “heterogeneous shareholder governance effect”.
Private enterprises in China generally face varying degrees of financing constraints, with external financing being difficult to secure and often limited in amount. They also suffer from severe credit discrimination (Brandt and Li, 2003) as societal financial resources tend to flow toward state-owned enterprises at lower debt financing costs and on a larger scale (Bai et al, 2006a). A key reason for this significant disparity is the difference in property ownership attributes (Wernerfelt, 1984). When state capital intervenes in private enterprises, state equity becomes a crucial link between privatized mixed-ownership enterprises and the government (Yu et al, 2017). Since the government controls the distribution of valuable resources such as administrative approvals and fiscal funds (Fan et al, 2007), mixed-ownership private enterprises benefit from higher levels of policy resource allocation (Ntim and Soobaroyen, 2013).
Furthermore, when state capital participates in private enterprises, it sends a positive signal to the market, indicating the company’s strong potential for growth (He et al, 2022). Owing to the high level of social trust enjoyed by state-owned capital due to its government backing, its involvement provides an implicit credit guarantee for private enterprises, reducing the financing disadvantages faced by mixed-ownership private firms (Khwaja and Mian, 2005).
Once private enterprises benefit from the resources brought by state capital participation, the necessity of relying on tax avoidance to ease financial pressure diminishes. Before the infusion of state capital, private enterprises might have needed to engage in tax avoidance to accumulate higher cash reserves (Edwards et al, 2016) in order to alleviate operational pressure from a lack of funds. However, after the injection of state capital, the financing environment of mixed-ownership private enterprises improves, reducing the urgency of capital needs and, consequently, shrinking the benefits derived from tax avoidance. This results in a decline in the use of tax avoidance strategies (Armstrong et al, 2015).
State capital differs from private capital, which is solely driven by profit maximization, as it bears a greater policy burden (Liao et al, 2022), requiring it to uphold public interests and maintain social stability (Bai et al, 2006b). Tax avoidance, with its negative externalities, undermines government fiscal revenues and public welfare (Freedman, 2003; Friese et al, 2006). As representatives of state capital, state shareholders are tasked with upholding the principle of “protecting public interests”, and thus, when participating in the decision-making processes of mixed-ownership private enterprises, they are more likely to consider the broader societal impact of corporate actions (Khaw et al, 2016). Consequently, state shareholders guide mixed-ownership private enterprises to align their operations with national strategic goals (Li et al, 2021), thereby reducing behaviors such as tax avoidance that harm public interests.
Additionally, the introduction of state capital restructures the ownership of private enterprises (Luo et al, 2011), creating a governance structure where the complementary strengths of state and non-state controlling shareholders provide mutual checks and balances. In homogenous shareholder structures, voting power is determined by the number of shares held, and minority shareholders often struggle to supervise and check the actions of controlling shareholders (Kim et al, 2007). However, in mixed-ownership private enterprises, even if state shareholders hold fewer shares, they still exert significant influence over decision-making due to their political background, which non-state shareholders cannot easily disregard (Grosman et al, 2016). This enables state shareholders to continue playing a supervisory role in mixed-ownership private enterprises, curbing the “tunneling” behaviors of controlling shareholders and, in turn, reducing tax avoidance practices.
In summary, this study proposes the following hypothesis for empirical testing:
H1: State capital participation reduces the level of tax avoidance in mixed-ownership private enterprises.
In 2008, China enacted a corporate income tax rate reform. To mitigate the potential impact of this reform on corporate tax avoidance, this study selects publicly listed private enterprises on the Shanghai and Shenzhen A-share markets from 2009 to 2023 as the research sample, processed according to the following criteria: (1) exclusion of firms in the financial sector, (2) removal of ST, *ST, PT, and delisted companies, (3) elimination of firms with missing or abnormal data for relevant variables, (4) Excluding data where the total profit is less than or equal to zero, and instances where the effective tax rate is below zero or exceeds one (5) winsorization of continuous variables at the 1% and 99% levels to mitigate the influence of extreme values. The data is sourced from the CSMAR and Wind databases, yielding a final sample of 17,177 valid firm-year observations. Robust standard errors were employed in all models to address heteroscedasticity.
The dependent variable in this study is the level of tax avoidance in privatized mixed-ownership enterprises, measured using the book-tax difference(BTD), as referenced from the research of Lei et al (2022). The formula for BTD is as follows: BTD = (Pre-tax Accounting Profit - Taxable Income) / Total Assets, where Taxable Income = (Income Tax Expense - Deferred Income Tax Expense) / Statutory Income Tax Rate.
To ensure robustness, in the robustness check section, this study also adopts the difference between the nominal tax rate and the effective tax rate (RATE) as per the methodology of Long et al (2024). The nominal tax rate refers to the statutory income tax rate applicable to the firm after accounting for tax incentives, while the effective tax rate is calculated as the current period’s income tax expense divided by the total profit for the year. A higher value of these metrics indicates a higher degree of tax avoidance in privatized mixed-ownership enterprises.
According to the guidelines issued by the China Securities Regulatory Commission, such as the “Guidelines for Standardized Operation of Listed Companies on Stock Exchanges” and the “Stock Listing Rules”, shareholders holding more than 5% of a listed company’s shares are entitled to propose the convening of shareholder meetings and participate in major decision-making processes. Moreover, shareholders with 5% or more ownership must issue a public notice in advance when increasing or decreasing their holdings. Therefore, this study defines privatized mixed-ownership enterprises based on whether state-owned shareholders hold 5% or more of the shares and generates two key independent variables: StateDummy and StateRate.
StateDummy takes the value of 1 if one of the top ten shareholders of a mixed-ownership private company is a state-owned shareholder holding 5% or more of the shares; otherwise, it is 0.
StateRate represents the combined shareholding percentage of state-owned shareholders holding 5% or more among the top ten shareholders of the mixed-ownership private company (In identifying the status and shareholding ratio of state-owned shareholders, this study primarily relies on information pertaining to the top ten shareholders as provided by the CSMAR database. For further details, please refer to Appendix Table 20).
Referring to the methodologies of Attig et al (2009), Long et al (2024), and Wang et al (2021), the following control variables are incorporated: firm size (Size), leverage ratio (Lev), return on total assets (Roa), intangible asset ratio (Intang), fixed asset ratio (Ppe), years since listing (ListAge), cash flow ratio (Cashflow), revenue growth rate (Growth), and equity balance (Balance). Considering the impact of China’s pre-tax super deduction policy for R&D expenses and the varying degrees of tax incentives across industries, this study also controls for the R&D expenditure ratio (Invest) and tax incentives (Discount). The study further controls for year effects (Year) and industry effects (Industry). The detailed definitions and descriptions of the variables are provided in Table 1.
| Type | Name | Symbol | Definition |
| Dependent Variable | Tax Avoidance Level | BTD | (Pre-tax Accounting Profit – Taxable Income)/Total Assets |
| Independent Variables | State Capital Participation | Statedummy | Binary indicator: 1 if a state-owned shareholder holds 5% or more of the shares, otherwise 0 |
| Staterate | The cumulative shareholding percentage of state-owned shareholders holding more than 5%, divided by 100 | ||
| Control Variables | Firm Size | Size | Natural logarithm of total assets |
| Return on Assets | Roa | Net Profit/Total Assets | |
| Leverage Ratio | Lev | Total Liabilities/Total Assets | |
| Intangible Assets Ratio | Intang | Intangible Assets/Total Assets | |
| Fixed Assets Ratio | Ppe | Fixed Assets/Total Assets | |
| Revenue Growth Rate | Growth | (Current Year Revenue – Previous Year Revenue)/Previous Year Revenue | |
| Firm Age | ListAge | Natural logarithm of the number of years since listing | |
| Operating Cash Flow Ratio | Cashflow | Operating Cash Flow/Total Assets | |
| Ownership Balance | Balance | (Shareholding Percentage of Top Ten Shareholders/Shareholding Percentage of Largest Shareholder) – 1 | |
| R&d Expenditure Ratio | Invest | R&d Expenditure/Total Assets | |
| Tax Preferences | Discount | All tax refunds/(all tax refunds + all taxes paid) | |
| Industry | Ind | Fixed effects for the industry | |
| Year | Year | Fixed effects for the year |
To examine the impact of the degree of mixed-ownership reform in private enterprises on their level of tax avoidance, the following baseline regression model is constructed:
Where BTD is the dependent variable, Staterate/Statedummy are the key independent variables, Controls represent the control variables, and Year and Ind denote the fixed effects for year and industry, respectively.
Table 2 presents the descriptive statistics of the variables used in this study. Table 2 presents the descriptive statistics of the variables used in this study. As shown, the mean and median values of BTD are 0.004 and 0.002, respectively. The fact that both the mean and median of BTD are greater than zero indicates that a majority of publicly listed private enterprises engage in some degree of tax avoidance, a finding consistent with those reported by Lei et al (2022) and Long et al (2024).
| VarName | Mean | SD | P25 | Median | P75 |
| BTD | 0.004 | 0.026 | –0.010 | 0.002 | 0.017 |
| Statedummy | 0.071 | 0.257 | 0.000 | 0.000 | 0.000 |
| Staterate | 0.008 | 0.032 | 0.000 | 0.000 | 0.000 |
| Discount | 0.209 | 0.216 | 0.024 | 0.138 | 0.330 |
| Invest | 0.027 | 0.023 | 0.014 | 0.023 | 0.034 |
| Lev | 0.338 | 0.174 | 0.196 | 0.324 | 0.466 |
| Ppe | 0.185 | 0.120 | 0.091 | 0.167 | 0.260 |
| Intang | 0.041 | 0.034 | 0.019 | 0.033 | 0.053 |
| ListAge | 1.594 | 0.911 | 1.099 | 1.609 | 2.303 |
| Cashflow | 0.056 | 0.064 | 0.018 | 0.054 | 0.092 |
| Growth | 0.194 | 0.312 | 0.014 | 0.141 | 0.301 |
| Balance | 1.111 | 0.834 | 0.505 | 0.899 | 1.482 |
| Roa | 0.061 | 0.040 | 0.032 | 0.054 | 0.081 |
| Size | 21.834 | 1.040 | 21.069 | 21.690 | 22.450 |
Note: The sample in this paper contains a total of 17,177 enterprise -year observations. SD is the standard deviation, P25 is the 25th percentile, and P75 is the 75th percentile.
The mean and median values of the state capital participation dummy variable (Statedummy) are 0.071 and 0, respectively, with a standard deviation (SD) of 0.257. Meanwhile, the mean value of the state ownership ratio (Staterate) is 0.008, with a median of 0 and an SD of 0.032. These figures suggest that the proportion of state ownership in private enterprises remains relatively low, indicating a limited extent of mixed-ownership reform. Moreover, there is considerable variation in state capital participation across private enterprises. These findings align with the results reported by He et al (2022). All other variables fall within reasonable ranges, as detailed in Table 2.
To preliminarily examine the correlations among the variables, this study conducted a Pearson correlation analysis, with the results presented as Appendix Table 21. The correlation coefficients between the state ownership variables (Statedummy and Staterate) and the tax avoidance behavior of private firms are –0.027 and –0.022, respectively, both of which are statistically significant at the 1% level. This suggests that, without controlling for other variables, there is a preliminary negative association between state ownership participation and the tax avoidance behavior of private firms. However, the exact nature of this relationship requires further investigation through multivariate analysis, controlling for other potential confounding variables. Additionally, the Variance Inflation Factor (VIF) values for all variables are less than 10, indicating the absence of multicollinearity issues among the variables. This confirms that the variables are sufficiently independent and suitable for multivariate regression analysis.
The results in Table 3 illustrate the impact of state capital participation on tax avoidance behavior in privatized mixed-ownership enterprises. Column (1) reports the effect of the presence of state capital participation (Statedummy) on tax avoidance behavior (BTD) in mixed-ownership private firms. Column (2) presents the effect of the proportion of state capital participation (Staterate) on tax avoidance in these enterprises.
| (1) | (2) | |
| BTD | BTD | |
| Statedummy | –0.002** | |
| (–2.55) | ||
| Staterate | –0.017*** | |
| (–2.98) | ||
| Discount | 0.014*** | 0.014*** |
| (16.30) | (16.30) | |
| Invest | 0.122*** | 0.122*** |
| (7.92) | (8.00) | |
| Lev | –0.008*** | –0.008*** |
| (–5.60) | (–5.57) | |
| Ppe | 0.017*** | 0.017*** |
| (9.27) | (9.27) | |
| Intang | –0.021*** | –0.021*** |
| (–3.44) | (–3.46) | |
| ListAge | 0.002*** | 0.002*** |
| (7.12) | (7.14) | |
| Cashflow | –0.029*** | –0.029*** |
| (–7.43) | (–7.41) | |
| Growth | –0.003*** | –0.003*** |
| (–4.29) | (–4.31) | |
| Balance | 0.000** | 0.000** |
| (2.03) | (2.09) | |
| Roa | 0.222*** | 0.222*** |
| (27.93) | (27.97) | |
| Size | 0.000 | 0.000 |
| (1.05) | (1.03) | |
| _cons | –0.023*** | –0.022*** |
| (–4.22) | (–4.21) | |
| Year | Yes | Yes |
| Ind | Yes | Yes |
| N | 17,177 | 17,177 |
| Adj. R2 | 0.210 | 0.210 |
Note: The values in parentheses are t-statistics adjusted using robust standard errors. ** and *** denote significance at the 5% and 1% levels, respectively.
In Column (1), the coefficient of Statedummy is –0.002 and is
statistically significant at the 5% level, indicating that the degree of tax
avoidance in mixed-ownership private enterprises is 0.2% lower than that of
non-mixed private enterprises. In Column (2), the coefficient of
Staterate is –0.017, also significantly negative at the 1% level,
suggesting that for each standard deviation increase in the proportion of state
capital participation, the extent of tax avoidance decreases by 13.6% relative
to its mean (–0.017
As discussed earlier, state capital participation brings both direct resources, such as fiscal subsidies, and indirect resources, such as credit financing, to mixed-ownership private enterprises, thus alleviating the financial pressures that may drive these firms to engage in risky tax avoidance practices. To test this pathway, this study uses government subsidies adjusted for operating income (Zhao and Mao, 2023) and bank credit loans adjusted for operating revenue (Loan), which serve as the relevant proxy variable. The rationale for selecting credit loans lies in their nature—being granted solely based on the borrower’s creditworthiness without requiring additional collateral. This measure provides a more direct and unambiguous reflection of the benefits derived from state capital participation in mixed-ownership private enterprises through credit infusion. Consequently, it offers a clearer depiction of how state capital participation effectively curtails tax avoidance behavior in these enterprises.
Table 4 examines the resource acquisition pathway through which state capital participation curbs tax avoidance in mixed-ownership private enterprises. Columns (1) and (2) report the effect of state capital participation on government subsidy resources (Subsidy) for mixed-ownership private enterprises. The coefficients of Statedummy and Staterate are 0.002 and 0.009, respectively, with statistical significance maintained at a minimum of the 5% level. This indicates that the adoption of mixed-ownership reform enables private enterprises to gain preferential access to policy resources, such as government subsidies.
| (1) | (2) | (3) | (4) | |
| Subsidy | Loan | |||
| Statedummy | 0.002*** | 0.014** | ||
| (3.75) | (2.53) | |||
| Staterate | 0.009** | 0.169*** | ||
| (2.25) | (3.19) | |||
| Discount | 0.004*** | 0.004*** | –0.001 | –0.001 |
| (6.02) | (5.95) | (–0.22) | (–0.19) | |
| Invest | 0.071*** | 0.071*** | –0.392*** | –0.395*** |
| (7.32) | (7.35) | (–4.08) | (–4.26) | |
| Lev | –0.016*** | –0.016*** | 0.109*** | 0.108*** |
| (–16.47) | (–16.46) | (10.32) | (10.23) | |
| Ppe | –0.003** | –0.003** | 0.122*** | 0.122*** |
| (–2.45) | (–2.42) | (8.49) | (8.48) | |
| Intang | 0.027*** | 0.027*** | 0.067 | 0.067 |
| (6.09) | (6.09) | (1.42) | (1.40) | |
| ListAge | –0.001*** | –0.001*** | 0.002 | 0.002 |
| (–5.19) | (–5.05) | (1.05) | (0.98) | |
| Cashflow | –0.007*** | –0.007*** | –0.205*** | –0.205*** |
| (–2.96) | (–3.00) | (–8.20) | (–8.23) | |
| Growth | –0.003*** | –0.003*** | –0.031*** | –0.031*** |
| (–6.11) | (–6.13) | (–7.46) | (–7.38) | |
| Balance | 0.000*** | 0.000*** | 0.002 | 0.002 |
| (2.98) | (3.20) | (1.25) | (1.04) | |
| Roa | –0.010** | –0.010** | –0.235*** | –0.236*** |
| (–2.38) | (–2.40) | (–5.69) | (–5.72) | |
| Size | –0.000** | –0.000** | 0.001 | 0.001 |
| (–2.55) | (–2.51) | (0.62) | (0.68) | |
| _cons | 0.028*** | 0.028*** | 0.047 | 0.045 |
| (8.67) | (8.62) | (1.34) | (1.30) | |
| Year | Yes | Yes | Yes | Yes |
| Ind | Yes | Yes | Yes | Yes |
| N | 17,118 | 17,118 | 8542 | 8542 |
| Adj. R2 | 0.203 | 0.203 | 0.118 | 0.119 |
Note: The values in parentheses are t-statistics adjusted using robust standard errors. ** and *** denote significance at the 5% and 1% levels, respectively.
Columns (3) and (4) report the impact of state capital participation on the credit resources (Loan) available to mixed-ownership private enterprises. The coefficients of Statedummy and Staterate are 0.014 and 0.169, respectively, with significance at the 5% and 1% levels. These results suggest that state capital participation effectively enhances the creditworthiness of mixed-ownership private enterprises, facilitating their access to greater financing opportunities.
These findings indicate that state capital participation reduces tax avoidance in mixed-ownership private enterprises through the resource acquisition pathway.
As previously analyzed, state capital participation can curb tax avoidance in mixed-ownership private enterprises by reducing controlling shareholders’ “tunneling” activities. Since related-party transactions can obscure the process of transferring benefits to controlling shareholders, they have become one of the primary means for controlling shareholders to expropriate the interests of minority shareholders (Almutairi et al, 2023; Park, 2018; Qu et al, 2020). Referring to the approach of Cai and Gao (Cai, 2010), this study measures the degree of expropriation by controlling shareholders using the ratio of total related-party transactions to total assets (RPT).
Table 5 examines the governance pathway through which state capital participation restrains tax avoidance in mixed-ownership private enterprises by mitigating controlling shareholders’ tunneling activities. Columns (1) and (2) report the effect of state capital participation on controlling shareholders’ tunneling activities in mixed-ownership private enterprises. The coefficients of Statedummy and Staterate are –0.016 and –0.113, respectively, with statistical significance maintained at a level of at least 5%, indicating that state capital participation can effectively suppress controlling shareholders’ expropriation of minority shareholders’ interests. This also confirms that state capital participation reduces tax avoidance in mixed-ownership private enterprises through the heterogeneous shareholder governance pathway.
| (1) | (2) | |
| RPT | RPT | |
| Statedummy | –0.016*** | |
| (–2.59) | ||
| Staterate | –0.113** | |
| (–2.20) | ||
| Discount | –0.016* | –0.015* |
| (–1.83) | (–1.82) | |
| Invest | –0.441*** | –0.441*** |
| (–6.29) | (–6.29) | |
| Lev | 0.482*** | 0.482*** |
| (34.20) | (34.20) | |
| Ppe | 0.032* | 0.032* |
| (1.83) | (1.83) | |
| Intang | 0.035 | 0.035 |
| (0.60) | (0.59) | |
| ListAge | –0.007*** | –0.007*** |
| (–2.83) | (–2.87) | |
| Cashflow | –0.122*** | –0.122*** |
| (–3.30) | (–3.28) | |
| Growth | –0.012** | –0.012** |
| (–2.09) | (–2.10) | |
| Balance | –0.013*** | –0.013*** |
| (–6.21) | (–6.24) | |
| Roa | –0.055 | –0.054 |
| (–0.96) | (–0.95) | |
| Size | –0.017*** | –0.017*** |
| (–7.15) | (–7.16) | |
| _cons | 0.407*** | 0.408*** |
| (8.29) | (8.31) | |
| Year | Yes | Yes |
| Ind | Yes | Yes |
| N | 16,525 | 16,525 |
| Adj. R2 | 0.171 | 0.171 |
Note: The values in parentheses are t-statistics adjusted using robust standard errors. *, **, and *** denote significance at the 10%, 5%, and 1% levels, respectively. RPT, the ratio of total related-party transactions to total assets.
The external environment in which an enterprise operates plays a pivotal role in shaping its growth and development. One of the reasons private enterprises struggle to secure sufficient resources is due to “credit discrimination” (Bai et al, 2021; Lu et al, 2012). A lack of resources tends to foster behaviors such as tax avoidance, whereas access to ample resources diminishes the likelihood of such actions. The higher the level of private economic development in a region, the less discrimination private enterprises face in capital markets and the broader their avenues for acquiring resources (Liu and Li, 2023). Consequently, the resource effect brought by state capital participation becomes less appealing to private enterprises. It can thus be hypothesized that in regions with more developed private economies, the tax avoidance suppression effect of mixed-ownership reform on private enterprises will be weaker.
To verify this hypothesis, this study follows the approach of Zhu and Lin (2022), using the non-state economy development index from Fan Gang’s “Marketization Index Report” to represent the level of private economic development. The data is divided into two sub-samples—regions with high private economic development and regions with low private economic development—based on the annual industry median for group testing. As shown in Table 6, the results confirm that in regions with lower levels of private economic development, state capital participation has a stronger suppressive effect on the tax avoidance behavior of mixed-ownership private enterprises.
| (1) | (2) | (3) | (4) | |
| Low Level of Private Economic Development | High Level of Private Economic Development | |||
| BTD | BTD | BTD | BTD | |
| Statedummy | –0.003*** | –0.000 | ||
| (–3.43) | (–0.01) | |||
| Staterate | –0.027*** | –0.003 | ||
| (–3.79) | (–0.37) | |||
| Discount | 0.016*** | 0.016*** | 0.012*** | 0.012*** |
| (12.62) | (12.61) | (10.13) | (10.13) | |
| Invest | 0.108*** | 0.107*** | 0.134*** | 0.134*** |
| (6.53) | (6.51) | (4.98) | (5.02) | |
| Lev | –0.011*** | –0.011*** | –0.005** | –0.005** |
| (–5.55) | (–5.50) | (–2.33) | (–2.32) | |
| Ppe | 0.020*** | 0.020*** | 0.014*** | 0.014*** |
| (7.81) | (7.77) | (5.22) | (5.23) | |
| Intang | –0.019** | –0.019** | –0.026*** | –0.026*** |
| (–2.24) | (–2.27) | (–2.95) | (–2.96) | |
| ListAge | 0.002*** | 0.002*** | 0.001*** | 0.001*** |
| (5.99) | (6.04) | (3.70) | (3.72) | |
| Cashflow | –0.030*** | –0.030*** | –0.029*** | –0.029*** |
| (–5.50) | (–5.46) | (–5.11) | (–5.11) | |
| Growth | –0.002** | –0.002** | –0.005*** | –0.005*** |
| (–2.00) | (–2.03) | (–4.30) | (–4.30) | |
| Balance | 0.001* | 0.001* | 0.000 | 0.000 |
| (1.82) | (1.85) | (0.68) | (0.73) | |
| Roa | 0.212*** | 0.213*** | 0.231*** | 0.231*** |
| (19.61) | (19.65) | (19.59) | (19.60) | |
| Size | 0.000 | 0.000 | 0.000 | 0.000 |
| (1.18) | (1.14) | (0.85) | (0.85) | |
| _cons | –0.025*** | –0.025*** | –0.024*** | –0.024*** |
| (–3.52) | (–3.48) | (–2.91) | (–2.92) | |
| Year | Yes | Yes | Yes | Yes |
| Ind | Yes | Yes | Yes | Yes |
| N | 8840 | 8840 | 8337 | 8337 |
| Adj. R2 | 0.200 | 0.200 | 0.229 | 0.229 |
Note: The values in parentheses are t-statistics adjusted using robust standard errors. *, **, and *** denote significance at the 10%, 5%, and 1% levels, respectively.
4.4.2.1 Financial vs. Non-Financial State-Owned Shareholders
The state-owned entities investing in private enterprises can be broadly categorized into financial institutions (including banks, securities firms, insurance companies, trusts, funds, and venture capital) and non-financial institutions (such as state-owned enterprises and government-affiliated institutions). Unlike other state-owned entities, financial institutions primarily seek investment returns rather than actively engaging in corporate governance. To mitigate risks, financial institutions tend to diversify their investments across multiple private enterprises rather than holding substantial equity in any single firm. As a result, their supervisory and governance role in mixed-ownership private enterprises often remains superficial, making it challenging for them to oversee and regulate complex and deceptive tax avoidance behaviors effectively.
To empirically test this hypothesis, this study distinguishes between state-owned shareholders affiliated with financial institutions (Finmix) and those belonging to non-financial institutions (NoFinmix), separately examining their influence on tax avoidance in mixed-ownership private enterprises. As shown in Table 7, state-owned shareholders from financial institutions exhibit no significant impact on tax avoidance behavior, whereas non-financial state-owned shareholders exert a pronounced restraining effect.
| (1) | (2) | (3) | (4) | |
| Finmix | NoFinmix | |||
| BTD | BTD | BTD | BTD | |
| Statedummy | –0.000 | –0.005*** | ||
| (–0.46) | (–3.63) | |||
| Staterate | –0.009 | –0.038*** | ||
| (–1.08) | (–3.66) | |||
| Discount | 0.013*** | 0.013*** | 0.014*** | 0.014*** |
| (7.55) | (7.54) | (4.55) | (4.55) | |
| Invest | 0.085*** | 0.086*** | 0.104*** | 0.099*** |
| (3.65) | (3.70) | (2.71) | (2.59) | |
| Lev | –0.007*** | –0.007** | –0.002 | –0.001 |
| (–2.58) | (–2.58) | (–0.47) | (–0.26) | |
| Ppe | 0.024*** | 0.024*** | 0.014** | 0.014** |
| (7.12) | (7.12) | (2.18) | (2.22) | |
| Intang | –0.017 | –0.017 | –0.070*** | –0.072*** |
| (–1.49) | (–1.48) | (–3.56) | (–3.60) | |
| ListAge | 0.003*** | 0.003*** | 0.002*** | 0.002*** |
| (5.30) | (5.30) | (2.78) | (2.73) | |
| Cashflow | –0.037*** | –0.037*** | –0.059*** | –0.059*** |
| (–4.98) | (–4.98) | (–4.33) | (–4.26) | |
| Growth | –0.004*** | –0.004*** | –0.001 | –0.001 |
| (–2.70) | (–2.72) | (–0.55) | (–0.63) | |
| Balance | 0.001** | 0.001** | –0.001 | –0.001 |
| (2.21) | (2.31) | (–0.99) | (–0.86) | |
| Roa | 0.231*** | 0.231*** | 0.255*** | 0.258*** |
| (17.83) | (17.83) | (8.20) | (8.36) | |
| Size | 0.000 | 0.000 | –0.000 | –0.000 |
| (0.98) | (0.99) | (–0.39) | (–0.52) | |
| _cons | –0.030*** | –0.030*** | –0.006 | –0.004 |
| (–3.34) | (–3.36) | (–0.36) | (–0.25) | |
| Year | Yes | Yes | Yes | Yes |
| Ind | Yes | Yes | Yes | Yes |
| N | 5496 | 5496 | 1643 | 1643 |
| Adj. R2 | 0.215 | 0.215 | 0.223 | 0.224 |
Note: The values in parentheses are t-statistics adjusted using robust standard errors. ** and *** denote significance at the 5% and 1% levels, respectively.
4.4.2.2 Central State-Owned Enterprises vs. Local State-Owned Shareholders
Central state-owned enterprises (SOEs) operate under strict oversight and regulation by the central government, adhering to a cautious, disciplined, and rigorous approach to enforcing tax laws and policies (Chen et al, 2009). This regulatory rigor extends to the mixed-ownership private enterprises they invest in, exerting substantial constraints on their tax avoidance behaviors.
Local state-owned shareholders, on the other hand, benefit from inherent geographical proximity, enabling more frequent and direct interactions with local mixed-ownership private enterprises. This proximity allows them to closely monitor the firms’ operational and financial activities closely, facilitating more targeted oversight of their tax practices. Furthermore, Shleifer and Vishny (1997) highlighted the government’s “grabbing hand” nature, whereby political connections may enable the expropriation of shareholder wealth in publicly listed firms—an aspect that could also influence tax avoidance behaviors in mixed-ownership private enterprises.
Regardless of whether a state-owned shareholder originates from a central SOE or a local SOE, both are government-affiliated entities with a strong incentive to ensure tax compliance. Tax collection not only fulfills directives from higher authorities but also serves as a crucial factor in bureaucratic promotion, given that tax performance is a key metric in evaluating Chinese officials (Luo and Qin, 2021). Additionally, tax enforcement can sometimes align with personal interests (Cheung et al, 2010).
Based on these considerations, it can be inferred that both central state-owned shareholders (CENTR) and local state-owned shareholders (STATE) play a constraining role in tax avoidance within mixed-ownership private enterprises. To empirically validate this hypothesis, this study conducts a baseline regression within two subgroups. As shown in Table 8, both central and local state-owned shareholders effectively curb tax avoidance behaviors in mixed-ownership private enterprises. However, from an economic significance perspective, central SOE shareholders appear to exert a stronger influence.
| (1) | (2) | (3) | (4) | |
| CENTR | STATE | |||
| BTD | BTD | BTD | BTD | |
| Statedummy | –0.005** | –0.002** | ||
| (–2.03) | (–2.31) | |||
| Staterate | –0.044** | –0.018*** | ||
| (–2.06) | (–2.72) | |||
| Discount | 0.016** | 0.015** | 0.013*** | 0.013*** |
| (2.29) | (2.23) | (8.77) | (8.78) | |
| Invest | –0.048 | –0.050 | 0.083*** | 0.084*** |
| (–0.52) | (–0.55) | (3.99) | (4.06) | |
| Lev | 0.016* | 0.016* | –0.007*** | –0.007*** |
| (1.70) | (1.69) | (–3.12) | (–3.09) | |
| Ppe | 0.039*** | 0.038*** | 0.021*** | 0.021*** |
| (4.00) | (3.93) | (6.87) | (6.87) | |
| Intang | 0.015 | 0.014 | –0.027*** | –0.028*** |
| (0.41) | (0.38) | (–2.64) | (–2.66) | |
| ListAge | –0.004 | –0.004 | 0.003*** | 0.003*** |
| (–1.51) | (–1.52) | (6.82) | (6.81) | |
| Cashflow | –0.065*** | –0.063*** | –0.043*** | –0.042*** |
| (–2.84) | (–2.74) | (–6.36) | (–6.34) | |
| Growth | –0.002 | –0.002 | –0.003** | –0.003*** |
| (–0.47) | (–0.50) | (–2.54) | (–2.58) | |
| Balance | –0.000 | –0.000 | 0.001* | 0.001* |
| (–0.16) | (–0.09) | (1.71) | (1.80) | |
| Roa | 0.422*** | 0.420*** | 0.233*** | 0.233*** |
| (9.70) | (9.56) | (19.04) | (19.09) | |
| Size | –0.000 | 0.000 | 0.000 | 0.000 |
| (–0.09) | (0.00) | (0.46) | (0.44) | |
| _cons | –0.021 | –0.024 | –0.023*** | –0.022*** |
| (–0.54) | (–0.64) | (–2.81) | (–2.80) | |
| Year | Yes | Yes | Yes | Yes |
| Ind | Yes | Yes | Yes | Yes |
| N | 413 | 413 | 6726 | 6726 |
| Adj. R2 | 0.420 | 0.421 | 0.207 | 0.208 |
Note: The values in parentheses are t-statistics adjusted using robust standard errors. *, **, and *** denote significance at the 10%, 5%, and 1% levels, respectively.
4.4.3.1 Appointment of Directors, Supervisors, and Executives
The appointment of directors, supervisors, and senior executives is a key mechanism through which state-owned shareholders participate in the governance of mixed-ownership private enterprises. By appointing board members and executives, state-owned shareholders disrupt the monopoly of non-state shareholders over the board of directors and the supervisory board, fostering a more diverse and balanced governance structure (Xiao et al, 2024). A diversified board and supervisory system can significantly enhance governance efficiency, mitigate agency problems (Ahmed, 2015), provide additional resources (Karim et al, 2023), and introduce more valuable decision-making insights (Pfeffer and Salancik, 2003).
Furthermore, the appointment of directors and executives helps alleviate information asymmetry between state-owned and non-state shareholders (Gull et al, 2018). Given that state-owned shareholders often enter as external investors, they inherently face a knowledge gap in understanding the operations of mixed-ownership private enterprises. Assigning directors and executives enables state-owned shareholders to gain deeper insights into the firm’s business activities, reducing the time and cost required to familiarize themselves with its operations. This, in turn, strengthens their supervisory and governance role, thereby exerting a more effective constraint on tax avoidance behavior.
To empirically examine this effect, the sample is divided into two subgroups based on whether state-owned shareholders have appointed directors, supervisors, or executives (DJG vs. NoDJG). As shown in Table 9, state-owned shareholders who appoint senior executives demonstrate superior governance effectiveness compared to those who do not, exerting a stronger inhibitory effect on tax avoidance within mixed-ownership private enterprises.
| (1) | (2) | (3) | (4) | |
| DJG | NoDJG | |||
| BTD | BTD | BTD | BTD | |
| Statedummy | –0.006*** | –0.001 | ||
| (–4.46) | (–1.24) | |||
| Staterate | –0.044*** | –0.013 | ||
| (–4.44) | (–1.10) | |||
| Discount | 0.014*** | 0.015*** | 0.012*** | 0.012*** |
| (4.23) | (4.32) | (7.61) | (7.61) | |
| Invest | 0.032 | 0.033 | 0.111*** | 0.111*** |
| (1.25) | (1.36) | (5.70) | (5.70) | |
| Lev | –0.015*** | –0.014** | –0.005** | –0.005** |
| (–2.73) | (–2.55) | (–2.14) | (–2.13) | |
| Ppe | 0.018*** | 0.017*** | 0.022*** | 0.023*** |
| (2.83) | (2.67) | (6.83) | (6.84) | |
| Intang | –0.050** | –0.055** | –0.027** | –0.027** |
| (–2.17) | (–2.37) | (–2.47) | (–2.47) | |
| ListAge | 0.003*** | 0.003*** | 0.003*** | 0.003*** |
| (3.80) | (3.66) | (5.07) | (5.08) | |
| Cashflow | –0.044*** | –0.041*** | –0.043*** | –0.042*** |
| (–2.82) | (–2.64) | (–5.96) | (–5.95) | |
| Growth | –0.001 | –0.002 | –0.003*** | –0.003*** |
| (–0.48) | (–0.64) | (–2.62) | (–2.62) | |
| Balance | –0.000 | –0.000 | 0.001* | 0.001* |
| (–0.58) | (–0.43) | (1.86) | (1.84) | |
| Roa | 0.234*** | 0.237*** | 0.237*** | 0.237*** |
| (7.39) | (7.57) | (18.60) | (18.61) | |
| Size | 0.001 | 0.001 | 0.000 | 0.000 |
| (1.34) | (1.53) | (0.75) | (0.72) | |
| _cons | –0.033** | –0.037** | –0.027*** | –0.026*** |
| (–1.97) | (–2.22) | (–3.15) | (–3.12) | |
| Year | Yes | Yes | Yes | Yes |
| Ind | Yes | Yes | Yes | Yes |
| N | 1292 | 1292 | 5847 | 5847 |
| Adj. R2 | 0.279 | 0.281 | 0.206 | 0.206 |
Note: The values in parentheses are t-statistics adjusted using robust standard errors. *, **, and *** denote significance at the 10%, 5%, and 1% levels, respectively. DJG indicates whether state-owned shareholders have appointed directors, supervisors, or senior executives.
4.4.3.2 Appointment of Directors, Supervisors, or Executives
To further investigate which type of appointment—directors, supervisors, or executives—yields the most effective governance outcomes, this study further subdivides the DJG sample into three distinct groups: appointed directors (D), appointed supervisors (J), and appointed executives (G). If state-owned shareholders appoint multiple roles simultaneously, all corresponding variables are assigned a value of 1.
As shown in Table 10, the coefficients of Statedummy and Staterate are both significantly negative in the director (D) and supervisor (J) groups, whereas in the executive (G) group, although the coefficients remain negative, they are not statistically significant. This suggests that appointing directors and supervisors yields the strongest deterrent effect on tax avoidance, while the appointment of executives, though somewhat effective, does not produce a significant impact.
| (1) | (2) | (3) | (4) | (5) | (6) | |
| D | J | G | D | J | G | |
| BTD | BTD | BTD | BTD | BTD | BTD | |
| Statedummy | –0.006*** | –0.007*** | –0.015 | |||
| (–4.28) | (–3.10) | (–0.75) | ||||
| Staterate | –0.040*** | –0.058*** | –0.123 | |||
| (–3.73) | (–3.75) | (–1.19) | ||||
| Discount | 0.015*** | 0.017*** | –0.007 | 0.015*** | 0.018*** | 0.000 |
| (3.94) | (2.97) | (–0.21) | (3.97) | (3.32) | (0.01) | |
| Invest | 0.027 | 0.004 | –0.008 | 0.029 | 0.010 | –0.006 |
| (1.19) | (0.18) | (–0.34) | (1.27) | (0.47) | (–0.27) | |
| Lev | –0.011* | –0.018** | –0.001 | –0.010* | –0.017** | –0.013 |
| (–1.91) | (–2.24) | (–0.01) | (–1.72) | (–2.08) | (–0.28) | |
| Ppe | 0.019*** | 0.023** | –0.002 | 0.018** | 0.020** | –0.016 |
| (2.68) | (2.56) | (–0.05) | (2.52) | (2.24) | (–0.34) | |
| Intang | –0.042* | –0.038 | –0.072 | –0.048* | –0.041 | –0.084 |
| (–1.70) | (–1.08) | (–0.75) | (–1.94) | (–1.15) | (–0.89) | |
| ListAge | 0.003*** | 0.003** | –0.019** | 0.003*** | 0.003** | –0.019** |
| (2.98) | (2.03) | (–2.31) | (2.82) | (2.10) | (–2.43) | |
| Cashflow | –0.039** | –0.058*** | 0.086 | –0.037** | –0.052*** | 0.075 |
| (–2.19) | (–2.87) | (0.97) | (–2.05) | (–2.61) | (0.85) | |
| Growth | –0.001 | –0.007* | 0.013 | –0.001 | –0.007* | 0.015 |
| (–0.21) | (–1.71) | (0.65) | (–0.30) | (–1.83) | (0.80) | |
| Balance | –0.000 | –0.003*** | –0.004 | –0.000 | –0.003** | –0.005 |
| (–0.27) | (–2.88) | (–0.68) | (–0.22) | (–2.57) | (–1.08) | |
| Roa | 0.218*** | 0.244*** | 0.024 | 0.221*** | 0.249*** | 0.010 |
| (6.15) | (5.74) | (0.18) | (6.30) | (5.92) | (0.08) | |
| Size | 0.000 | 0.002 | –0.014 | 0.001 | 0.002* | –0.011 |
| (0.54) | (1.65) | (–1.04) | (0.78) | (1.71) | (–0.92) | |
| _cons | –0.020 | –0.050* | 0.366 | –0.026 | –0.052** | 0.322 |
| (–1.10) | (–1.96) | (1.29) | (–1.42) | (–2.08) | (1.26) | |
| Year | Yes | Yes | Yes | Yes | Yes | Yes |
| Ind | Yes | Yes | Yes | Yes | Yes | Yes |
| N | 1117 | 669 | 76 | 1117 | 669 | 76 |
| Adj. R2 | 0.259 | 0.328 | 0.250 | 0.258 | 0.336 | 0.273 |
Note: The values in parentheses are t-statistics adjusted using robust standard errors. *, **, and *** denote significance at the 10%, 5%, and 1% levels, respectively. D indicates the appointment of directors, J indicates the appointment of supervisors, and G indicates the appointment of senior executives.
A plausible explanation for this finding is that state-appointed executives may struggle to exert meaningful oversight due to their limited familiarity with the intricate business operations of mixed-ownership private enterprises. Faced with complex processes and vast amounts of information, they may find it challenging to identify tax avoidance behaviors accurately. In contrast, supervisors and directors, positioned at the core of corporate oversight, benefit from their distinct roles and responsibilities, allowing them to gain deeper insights into critical operational areas and potential risks within mixed-ownership private enterprises.
The relationship between tax avoidance and firm value has long been a topic of polarized debate. Some studies suggest a positive correlation, arguing that tax avoidance generates tax savings, thereby enhancing shareholder wealth (Inger and Vansant, 2019), particularly in organizations with effective corporate social governance (Desai and Dharmapala, 2009). However, other research presents a contrasting perspective, contending that tax avoidance diminishes a firm’s contribution to societal welfare and contravenes business ethics (Aparicio and Kim, 2023; Hanlon and Slemrod, 2009). If shareholders ultimately bear the costs of reputational damage and tax-related risks, they may perceive tax avoidance as detrimental (Baudot et al, 2020), potentially jeopardizing the firm’s long-term viability. Under such circumstances, tax avoidance may exhibit an inverse relationship with firm value (Inger, 2014).
Moreover, tax avoidance does not necessarily yield excess cash value. In jurisdictions with strong investor protection mechanisms, the relationship between tax avoidance and firm value may even turn negative (Benkraiem et al, 2022). Most of the existing studies in this field have focused on foreign firms, and while some literature has explored the positive association between tax avoidance and firm value among Chinese listed companies (Li et al, 2017), such analyses predominantly center on state-owned enterprises, leaving a gap in the discussion regarding private enterprises.
To address this gap, this study adopts Tobin’s Q as a measure of firm value, following the approach of Elamer et al (2024). Additionally, drawing on the methodology of Dyreng et al (2008), this study employs three-year and five-year rolling averages of Tobin’s Q to capture long-term firm value better. As presented in Table 11, Columns (1)–(3) illustrate the relationship between tax avoidance and firm value over the current, three-year, and five-year periods, respectively. The results clearly indicate that as the time horizon extends, the detrimental impact of tax avoidance on firm value becomes more pronounced.
| (1) | (2) | (3) | |
| Tobin | T-Tobin | F-Tobint | |
| BTD | –0.594 | –0.633* | –0.762** |
| (–1.53) | (–1.91) | (–2.57) | |
| Discount | –0.006 | –0.005 | –0.005 |
| (–0.18) | (–0.15) | (–0.16) | |
| Invest | 8.207*** | 6.664*** | 5.986*** |
| (9.40) | (9.05) | (9.01) | |
| Lev | 0.151** | –0.033 | –0.110** |
| (2.50) | (–0.62) | (–2.24) | |
| Ppe | 0.044 | –0.206*** | –0.295*** |
| (0.60) | (–3.21) | (–5.01) | |
| Intang | 0.508** | 0.344 | 0.261 |
| (2.03) | (1.57) | (1.34) | |
| ListAge | 0.412*** | 0.433*** | 0.420*** |
| (39.20) | (45.64) | (48.15) | |
| Cashflow | 0.364** | 0.077 | –0.038 |
| (2.39) | (0.58) | (–0.32) | |
| Growth | 0.196*** | 0.197*** | 0.143*** |
| (6.72) | (7.54) | (6.21) | |
| Balance | 0.004 | 0.010 | 0.015** |
| (0.43) | (1.27) | (2.08) | |
| Roa | 9.261*** | 7.778*** | 6.821*** |
| (28.01) | (27.22) | (26.54) | |
| Size | –0.385*** | –0.300*** | –0.264*** |
| (–31.79) | (–27.90) | (–27.17) | |
| _cons | 8.910*** | 7.245*** | 6.589*** |
| (35.43) | (32.55) | (32.81) | |
| Year | Yes | Yes | Yes |
| Ind | Yes | Yes | Yes |
| N | 16,953 | 16,953 | 16,953 |
| Adj. R2 | 0.387 | 0.366 | 0.357 |
Note: The values in parentheses are t-statistics adjusted using robust standard errors. *, **, and *** denote significance at the 10%, 5%, and 1% levels, respectively.
To address potential endogeneity issues stemming from self-selection bias, this study applies the Propensity Score Matching (PSM) method to ensure that private enterprises undergoing mixed-ownership reform are comparable to those that do not. Specifically, the sample is divided into a treatment group and a control group based on whether a firm has undergone mixed-ownership reform, determined by the presence of a state-owned shareholder holding at least 5% equity (Statedummy). All control variables are used as covariates and nearest-neighbor matching is conducted using 1:1 and 1:2 matching ratios. A post-matching regression analysis is then performed on the adjusted sample.
The matching results (see Appendix Figs. 1,2) indicate significant differences between the two groups prior to matching. However, after matching, all variable differences are effectively controlled, demonstrating the validity of the matching approach. Columns (1) and (2) in Table 12 present the regression results after 1:1 matching, while Columns (3) and (4) report the results after 1:2 matching. The coefficients of the state capital participation proxies, Statedummy and Staterate, remain significantly negative, suggesting that even after alleviating self-selection bias, state capital participation continues to exert a restraining effect on tax avoidance in mixed-ownership private enterprises.
| (1) | (2) | (3) | (4) | |
| BTD | BTD | BTD | BTD | |
| Statedummy | –0.002* | –0.002** | ||
| (–1.95) | (–2.16) | |||
| Staterate | –0.016** | –0.016** | ||
| (–2.06) | (–2.35) | |||
| Discount | 0.005* | 0.005* | 0.007*** | 0.007*** |
| (1.88) | (1.88) | (3.29) | (3.29) | |
| Invest | 0.128*** | 0.127*** | 0.137*** | 0.137*** |
| (4.66) | (4.65) | (5.76) | (5.75) | |
| Lev | –0.006 | –0.006 | –0.003 | –0.003 |
| (–1.54) | (–1.49) | (–0.93) | (–0.88) | |
| Ppe | 0.019*** | 0.019*** | 0.021*** | 0.021*** |
| (3.63) | (3.62) | (5.06) | (5.04) | |
| Intang | –0.024 | –0.024 | –0.034*** | –0.034*** |
| (–1.50) | (–1.51) | (–2.68) | (–2.69) | |
| ListAge | 0.002** | 0.002** | 0.002*** | 0.002*** |
| (2.49) | (2.49) | (4.01) | (4.00) | |
| Cashflow | –0.050*** | –0.049*** | –0.046*** | –0.046*** |
| (–4.20) | (–4.14) | (–4.91) | (–4.87) | |
| Growth | –0.003 | –0.003 | –0.002 | –0.002 |
| (–1.32) | (–1.38) | (–1.19) | (–1.25) | |
| Balance | 0.000 | 0.000 | 0.000 | 0.000 |
| (0.84) | (0.92) | (0.57) | (0.63) | |
| Roa | 0.248*** | 0.249*** | 0.240*** | 0.241*** |
| (11.26) | (11.32) | (13.44) | (13.51) | |
| Size | 0.001* | 0.001* | 0.001 | 0.001 |
| (1.95) | (1.92) | (0.99) | (0.97) | |
| _cons | –0.043*** | –0.043*** | –0.030*** | –0.030*** |
| (–3.29) | (–3.29) | (–2.80) | (–2.79) | |
| Year | Yes | Yes | Yes | Yes |
| Ind | Yes | Yes | Yes | Yes |
| N | 2303 | 2303 | 3361 | 3361 |
| Adj. R2 | 0.260 | 0.260 | 0.253 | 0.253 |
Note: The values in parentheses are t-statistics adjusted using robust standard errors. *, **, and *** denote significance at the 10%, 5%, and 1% levels, respectively.
Although Propensity Score Matching (PSM) can partially mitigate endogeneity issues arising from self-selection bias, it may lead to the exclusion of unmatched control group samples during the matching process, resulting in a loss of valuable sample information. To address this limitation, this study adopts the Entropy Balancing method proposed by Hainmueller (2012), a matching approach that does not rely on the specification of a first-stage Logit model.
Entropy Balancing enhances the accuracy of matching and the robustness of the study by adjusting the distribution of covariates, ensuring that the treatment and control groups are balanced without compromising sample representativeness. This method effectively reduces the loss of information caused by sample deletion, thereby enhancing the reliability of the research findings.
A re-estimated baseline regression is conducted using the entropy-balanced sample. As shown in Table 13, the coefficients of Statedummy and Staterate remain significantly negative at the 1% level, reaffirming the robustness of the study’s conclusions.
| (1) | (2) | |
| BTD | BTD | |
| Statedummy | –0.002*** | |
| (–2.59) | ||
| Staterate | –0.018*** | |
| (–3.07) | ||
| Discount | 0.011*** | 0.011*** |
| (6.21) | (6.22) | |
| Invest | 0.067*** | 0.068*** |
| (2.62) | (2.70) | |
| Lev | –0.005* | –0.004* |
| (–1.78) | (–1.70) | |
| Ppe | 0.017*** | 0.017*** |
| (5.28) | (5.26) | |
| Intang | –0.034*** | –0.034*** |
| (–3.20) | (–3.23) | |
| ListAge | 0.002*** | 0.002*** |
| (4.36) | (4.34) | |
| Cashflow | –0.037*** | –0.037*** |
| (–4.88) | (–4.80) | |
| Growth | –0.002 | –0.002 |
| (–1.27) | (–1.39) | |
| Balance | –0.000 | –0.000 |
| (–0.58) | (–0.47) | |
| Roa | 0.257*** | 0.258*** |
| (15.96) | (16.18) | |
| Size | 0.000 | 0.000 |
| (0.96) | (0.95) | |
| _cons | –0.025*** | –0.025*** |
| (–2.95) | (–2.94) | |
| Year | Yes | Yes |
| Ind | Yes | Yes |
| N | 17,177 | 17,177 |
| Adj. R2 | 0.265 | 0.266 |
Note: The values in parentheses are t-statistics adjusted using robust standard errors. * and *** denote significance at the 10% and 1% levels, respectively.
In addition to observable factors that may lead to self-selection bias, there are also unobservable factors that could contribute to such bias. Therefore, this study employs the Heckman two-stage model to control for these biases. Specifically, the first step uses a probit model to explain the likelihood of state-owned capital participating in private enterprises, estimating the self-selection probability (IMR). This process requires the introduction of an exogenous variable.
This study follows the approach of Zeng et al (2022), utilizing the Government-Market Relationship indicator from Fan’s Marketization Index Report as an exogenous variable. This indicator comprises three sub-indices: the proportion of economic resources allocated by the market, the reduction of government intervention in enterprises, and the downsizing of government institutions. A lower index value signifies stronger government intervention, thereby increasing the likelihood of private enterprises undergoing nationalization.
Additionally, the inverse Mills ratio (IMR) is incorporated into the baseline regression model to examine how the regression results change after controlling for self-selection probability. Column (1) of Table 14 presents the results from the first-stage Heckman selection model, which aligns with the findings of Zeng et al (2022). Columns (2) and (3) illustrate the variations in regression results after controlling for self-selection probability (IMR). It can be observed that the coefficients of the proxy variables for state capital participation, Statedummy and Staterate, are both significantly negative at the 1% level, thereby confirming that the conclusions of this study are robust and not influenced by self-selection bias (Considering the endogeneity between state capital participation and the path variables, this study also employs the Heckman two-stage method for mitigation. As shown in Appendix Table 22, the coefficients and significance levels of Statedummy and Staterate remain consistent with the earlier findings, reaffirming the robustness of the results).
| (1) | (2) | (3) | |
| Statedummy | BTD | BTD | |
| Relationship | –0.052*** | ||
| (–4.86) | |||
| Statedummy | –0.002** | ||
| (–2.55) | |||
| Staterate | –0.017*** | ||
| (–2.96) | |||
| Discount | –0.327*** | 0.015*** | 0.015*** |
| (–3.98) | (10.38) | (10.36) | |
| Invest | 2.213*** | 0.117*** | 0.117*** |
| (3.45) | (6.88) | (6.96) | |
| Lev | 0.074 | –0.008*** | –0.008*** |
| (0.63) | (–5.60) | (–5.57) | |
| Ppe | 0.249 | 0.017*** | 0.017*** |
| (1.61) | (8.22) | (8.24) | |
| Intang | –0.285 | –0.019*** | –0.019*** |
| (–0.58) | (–3.01) | (–3.02) | |
| ListAge | 0.201*** | 0.001** | 0.002** |
| (8.42) | (2.16) | (2.19) | |
| Cashflow | –0.423 | –0.029*** | –0.029*** |
| (–1.44) | (–6.70) | (–6.69) | |
| Growth | –0.112** | –0.003*** | –0.003*** |
| (–2.12) | (–3.68) | (–3.72) | |
| Balance | 0.259*** | –0.000 | –0.000 |
| (16.23) | (–0.24) | (–0.20) | |
| Roa | –0.563 | 0.221*** | 0.222*** |
| (–1.07) | (26.65) | (26.68) | |
| Size | 0.035* | 0.000 | 0.000 |
| (1.73) | (0.94) | (0.94) | |
| IMR | –0.003 | –0.002 | |
| (–0.69) | (–0.66) | ||
| _cons | –0.964* | –0.016 | –0.017 |
| (–1.94) | (–1.24) | (–1.26) | |
| Year | Yes | Yes | Yes |
| Ind | Yes | Yes | Yes |
| N | 16,485 | 16,485 | 16,485 |
| Adj. R2 | 0.204 | 0.204 |
Note: The values in parentheses are t-statistics adjusted using robust standard errors. *, **, and *** denote significance at the 10%, 5%, and 1% levels, respectively.
To further mitigate endogeneity concerns and eliminate potential confounding factors such as firm size and profitability, this study rigorously verifies the impact of state capital participation on mixed-ownership private enterprises. Following the methodologies of Wang et al (2021), Ren et al (2024), and Zhu et al (2024), the study employs the average state ownership ratio of other firms within the same province and industry (Mean_State) as an instrumental variable.
Column (1) of Table 15 presents the first-stage results of the instrumental variable approach, where the coefficient of Mean_State is significantly positive. This finding indicates that the degree of state ownership participation in mixed-ownership private enterprises increases as state ownership participation in other private enterprises within the same province and industry rises.
| (1) | (2) | |
| First | Second | |
| VARIABLES | Staterate | BTD |
| Mean_State | 0.860*** | |
| (27.19) | ||
| Staterate | –0.049*** | |
| (–3.54) | ||
| Discount | –0.002* | 0.014*** |
| (–1.92) | (16.03) | |
| Invest | 0.044** | 0.124*** |
| (2.10) | (8.29) | |
| Lev | 0.004** | –0.008*** |
| (2.27) | (–5.53) | |
| Ppe | 0.003 | 0.018*** |
| (1.31) | (9.38) | |
| Intang | –0.014** | –0.021*** |
| (–2.08) | (–3.40) | |
| ListAge | 0.002*** | 0.002*** |
| (7.15) | (7.18) | |
| Cashflow | –0.001 | –0.029*** |
| (–0.34) | (–7.35) | |
| Growth | –0.003*** | –0.004*** |
| (–3.48) | (–4.59) | |
| Balance | 0.004*** | 0.001*** |
| (11.91) | (2.67) | |
| Roa | 0.001 | 0.221*** |
| (0.15) | (27.76) | |
| Size | 0.000 | 0.000 |
| (0.88) | (1.17) | |
| Observations | 17,095 | 17,095 |
| R-squared | 0.132 |
Note: The values in parentheses are t-statistics adjusted using robust standard errors. *, **, and *** denote significance at the 10%, 5%, and 1% levels, respectively.
Column (2) displays the second-stage results, showing that the coefficient of Staterate remains significantly negative at the 1% level. This suggests that after controlling for reverse causality and other confounding factors, the study’s main conclusions remain robust.
To further assess the validity of the instrumental variable, both the underidentification test and the weak instrument test are conducted. The Kleibergen-Paap rk LM statistic yields a p-value of 0.000, while the Kleibergen-Paap rk Wald F statistic reaches 739.238—far exceeding the critical threshold of 16.38 at the 10% significance level for weak identification. These results affirm the credibility of the instrumental variable selection and the robustness of the findings.
The Difference-in-Differences (DID) method serves as a crucial approach to mitigating endogeneity concerns by capturing the dynamic changes in tax avoidance behavior before and after state capital participation in mixed-ownership private enterprises. Given the varying timelines of state capital participation across firms, this study adopts a multi-period DID framework. Firms with a state-owned shareholder holding at least 5% equity are assigned a value of 1 for the treatment variable (Treat), while those without such shareholders are assigned 0. Additionally, the first year in which a firm acquires a major state-owned shareholder, along with all subsequent years, is marked as 1 for the time variable (Post), while prior years are assigned 0.
A fundamental prerequisite for DID analysis is the parallel trend assumption, which requires that the treatment and control groups exhibit no significant differences before state capital participation. To verify this assumption, a parallel trend test is conducted, using period -4 as the baseline to avoid collinearity issues. The results (see Appendix Fig. 3) indicate no significant differences before state capital participation, while multiple periods after participation show significant effects, with a clear downward trend, satisfying the conditions for DID estimation.
Subsequently, the interaction term (DID) between Treat and Post is incorporated into the baseline regression model. As presented in Table 16, the coefficient of DID remains significantly negative across all specifications, regardless of whether control variables are included, further reinforcing the robustness of the study’s findings.
| (1) | (2) | |
| BTD | BTD | |
| DID | –0.002*** | –0.002*** |
| (–3.01) | (–2.74) | |
| Discount | 0.014*** | |
| (16.34) | ||
| Invest | 0.122*** | |
| (7.90) | ||
| Lev | –0.008*** | |
| (–5.61) | ||
| Ppe | 0.017*** | |
| (9.29) | ||
| Intang | –0.021*** | |
| (–3.43) | ||
| ListAge | 0.002*** | |
| (7.23) | ||
| Cashflow | –0.029*** | |
| (–7.44) | ||
| Growth | –0.003*** | |
| (–4.26) | ||
| Balance | 0.000** | |
| (2.06) | ||
| Roa | 0.222*** | |
| (27.90) | ||
| Size | 0.000 | |
| (1.05) | ||
| _cons | 0.004*** | –0.023*** |
| (20.84) | (–4.23) | |
| Year | Yes | Yes |
| Ind | Yes | Yes |
| N | 17,177 | 17,177 |
| Adj. R2 | 0.087 | 0.210 |
Note: The values in parentheses are t-statistics adjusted using robust standard errors. ** and *** denote significance at the 5% and 1% levels, respectively.
In this study, the explanatory variable—the proportion of state-owned capital participation (Staterate)—is randomly assigned to private enterprises within the sample, and 2000 iterations of simulated regression tests are conducted. The distribution of the t-values for the state-owned capital participation ratio (Staterate) in the simulated regressions is shown in Appendix Fig. 4. It is evident that the regression coefficients estimated from the random samples are concentrated around zero and follow a normal distribution, with almost all simulated t-values located to the right of the baseline regression t-value (–2.98). Therefore, it can be concluded that the inhibitory effect of state-owned capital participation on the tax avoidance behavior of privatized companies is not significantly influenced by other omitted variables, thereby affirming the robustness of the research findings.
Although mixed-ownership reform was initiated relatively early, its initial implementation primarily followed a forward-mixed model, wherein non-state capital was introduced into state-owned enterprises. It was not until the Decision of the Central Committee of the Communist Party of China on Several Major Issues Concerning Comprehensively Deepening Reform in 2013 explicitly stated that ”mixed-ownership economies involving cross-shareholding and mutual integration of state-owned capital, collective capital, and non-public capital” should be promoted, that the reform framework was broadened. This signaled that mixed-ownership reform was no longer limited to the entry of private capital into state-owned enterprises but also encompassed state capital participation in non-state-owned enterprises, marking the formal initiation of reverse mixed-ownership reform.
Furthermore, considering the potential impact of government policies such as the Interim Measures for the Allocation and Management of Newly Added Local Government Debt Limits and the Notice on Further Regulating Local Government Debt and Financing Activities issued by China’s Ministry of Finance in 2017, along with external shocks such as the COVID-19 pandemic and the state capital investment company reform launched in 2020, this study narrows the sample period to 2013–2017 to ensure a more precise assessment of the impact of state capital participation on tax avoidance behavior in mixed-ownership private enterprises. As shown in Columns (1) and (2) of Table 17, the coefficients of Statedummy and Staterate remain significantly negative, confirming that after excluding the influence of other policy interventions, the study’s conclusions remain robust.
| (1) | (2) | |
| BTD | BTD | |
| Statedummy | –0.002* | |
| (–1.76) | ||
| Staterate | –0.019** | |
| (–1.97) | ||
| Discount | 0.011*** | 0.011*** |
| (6.99) | (6.99) | |
| Invest | 0.060*** | 0.061*** |
| (2.60) | (2.66) | |
| Lev | –0.007*** | –0.007*** |
| (–2.79) | (–2.77) | |
| Ppe | 0.009*** | 0.009*** |
| (3.06) | (3.04) | |
| Intang | –0.023** | –0.023** |
| (–2.07) | (–2.09) | |
| ListAge | 0.003*** | 0.003*** |
| (5.17) | (5.19) | |
| Cashflow | –0.020*** | –0.020*** |
| (–3.07) | (–3.04) | |
| Growth | –0.002* | –0.002** |
| (–1.95) | (–1.99) | |
| Balance | 0.000 | 0.000 |
| (1.26) | (1.29) | |
| Roa | 0.171*** | 0.172*** |
| (12.62) | (12.65) | |
| Size | 0.000 | 0.000 |
| (0.99) | (0.99) | |
| _cons | –0.028*** | –0.028*** |
| (–2.84) | (–2.84) | |
| Year | Yes | Yes |
| Ind | Yes | Yes |
| N | 5292 | 5292 |
| Adj. R2 | 0.128 | 0.128 |
Note: The values in parentheses are t-statistics adjusted using robust standard errors. *, **, and *** denote significance at the 10%, 5%, and 1% levels, respectively.
To ensure the reliability of the research conclusions and minimize the impact of variable selection errors, this study substitutes the explanatory variables. Following the method of Long et al (2024), the difference between the nominal tax rate and the actual tax rate (RATE) is used as a measure. The results, as shown in columns (1) and (2) of Table 18, indicate that the coefficient for Statedummy is –0.009 and the coefficient for Staterate is –0.058, both remaining significant at the 1% level. These results are consistent with those previously obtained.
| (1) | (2) | |
| RATE | RATE | |
| Statedummy | –0.009*** | |
| (–3.32) | ||
| Staterate | –0.058*** | |
| (–2.85) | ||
| Discount | 0.028*** | 0.028*** |
| (8.82) | (8.85) | |
| Invest | 0.224*** | 0.224*** |
| (5.73) | (5.75) | |
| Lev | –0.005 | –0.005 |
| (–0.90) | (–0.89) | |
| Ppe | 0.021*** | 0.021*** |
| (3.00) | (2.99) | |
| Intang | –0.045** | –0.046** |
| (–1.96) | (–1.98) | |
| ListAge | –0.002** | –0.002** |
| (–2.04) | (–2.12) | |
| Cashflow | –0.116*** | –0.116*** |
| (–8.89) | (–8.86) | |
| Growth | 0.000 | 0.000 |
| (0.11) | (0.10) | |
| Balance | 0.001* | 0.001* |
| (1.86) | (1.76) | |
| Roa | 0.485*** | 0.485*** |
| (20.08) | (20.10) | |
| Size | 0.003*** | 0.003*** |
| (3.03) | (3.00) | |
| _cons | –0.081*** | –0.081*** |
| (–4.19) | (–4.17) | |
| Year | Yes | Yes |
| Ind | Yes | Yes |
| N | 17,177 | 17,177 |
| Adj. R2 | 0.112 | 0.111 |
Note: The values in parentheses are t-statistics adjusted using robust standard errors. *, **, and *** denote significance at the 10%, 5%, and 1% levels, respectively.
Significant differences in economic and resource conditions exist across various provinces, which may influence the conclusions of this study. To ensure the robustness of the findings, provincial fixed effects were introduced after controlling for industry and year. The results, as displayed in Table 19, show no substantial deviation from the previous outcomes, thereby affirming the robustness of the conclusions.
| (1) | (2) | |
| BTD | BTD | |
| Statedummy | –0.002** | |
| (–2.39) | ||
| Staterate | –0.016*** | |
| (–2.81) | ||
| Discount | 0.015*** | 0.015*** |
| (16.22) | (16.22) | |
| Invest | 0.129*** | 0.129*** |
| (7.91) | (7.99) | |
| Lev | –0.008*** | –0.008*** |
| (–5.55) | (–5.52) | |
| Ppe | 0.016*** | 0.016*** |
| (8.53) | (8.53) | |
| Intang | –0.020*** | –0.020*** |
| (–3.18) | (–3.19) | |
| ListAge | 0.002*** | 0.002*** |
| (6.62) | (6.64) | |
| Cashflow | –0.028*** | –0.028*** |
| (–7.20) | (–7.18) | |
| Growth | –0.003*** | –0.003*** |
| (–4.26) | (–4.28) | |
| Balance | 0.000* | 0.000* |
| (1.74) | (1.80) | |
| Roa | 0.222*** | 0.222*** |
| (27.76) | (27.79) | |
| Size | 0.000 | 0.000 |
| (1.02) | (1.01) | |
| _cons | –0.022*** | –0.022*** |
| (–4.13) | (–4.13) | |
| Year | Yes | Yes |
| Province | Yes | Yes |
| Ind | Yes | Yes |
| N | 17,177 | 17,177 |
| Adj. R2 | 0.214 | 0.214 |
Note: The values in parentheses are t-statistics adjusted using robust standard errors. *, **, and *** denote significance at the 10%, 5%, and 1% levels, respectively.
This study examines the impact of state-owned capital participation on the tax avoidance behavior of private enterprises from two perspectives: the governance effect of heterogeneous shareholders and the resource effect. The study reveals that state-owned capital participation can effectively curb tax avoidance in privatized private enterprises. The empirical results indicate that this is primarily achieved by enhancing the credit loan capacity of these enterprises, providing government subsidies, and mitigating controlling shareholders’ “tunneling” activities. Further analysis reveals that the restraining effect of state capital participation on tax avoidance diminishes when mixed-ownership private enterprises operate in regions with a higher level of private economic development.
Moreover, after distinguishing among different types of state-owned shareholders, administrative levels, and governance behaviors, several key findings emerge. State-owned shareholders affiliated with financial institutions fail to curb tax avoidance in mixed-ownership private enterprises effectively. Additionally, whether a state-owned shareholder originates from a central state-owned enterprise (SOE) makes no significant difference in restraining tax avoidance behavior. However, state-owned shareholders that appoint directors, supervisors, or executives demonstrate superior governance effectiveness in mitigating tax avoidance compared to those that do not, with the appointment of directors and supervisors proving particularly effective.
Finally, in examining the relationship between tax avoidance and firm value, this study finds that tax avoidance inflicts more severe long-term damage on the corporate value of private enterprises.
To ensure the robustness of the findings, a series of validation methods—including Propensity Score Matching (PSM), Entropy Balancing, the Heckman two-stage model, the Instrumental Variable (IV) approach, and Difference-in-Differences (DID) analysis—have been employed. The results consistently confirm that state capital participation effectively curtails tax avoidance in mixed-ownership private enterprises.
This study has several implications, as follows.
First, this study, focusing on listed private enterprises, reveals that tax avoidance is a widespread phenomenon. However, listed private enterprises represent only a small fraction of all businesses, with the majority being non-listed enterprises. Non-listed firms receive less attention and face weaker regulatory pressure, which heightens their motivation for tax avoidance. Therefore, further research is warranted to explore how to regulate tax avoidance behavior more comprehensively and deeply across a broader range of enterprises.
Second, for Chinese private enterprises, mixed ownership is an emerging trend, and the intertwining of state and private equity will become increasingly common. Introducing state-owned capital not only provides various resources to privatized companies but also helps curb the “tunneling” behavior of private shareholders. Thus, from a long-term development perspective, the participation of state-owned capital in private enterprises is more beneficial. Private shareholders, especially controlling shareholders, should not resist the entry of state capital for the sake of short-term gains. The benefits derived from the growth and expansion of the company far outweigh the risks and potential downsides of tax avoidance. While tax avoidance may yield short-term profit gains, it ultimately undermines long-term corporate value, posing an impediment to the sustainable growth and expansion of private enterprises.
Third, for the government, state capital is finite. Although increased state capital participation can help curb tax avoidance and other improper behaviors in private enterprises, unquestioningly increasing investments is not a prudent approach. Excessive investment would overburden state resources and deviate from the original intent of state capital participation, which is to support the growth of private enterprises, not to control them. Therefore, state shareholders in private companies should consider how to leverage the advantages that private shareholders lack, such as political connections, to achieve deeper governance of private enterprises and aid their growth without over-reliance on state capital. For instance, the appointment of directors and supervisors, as discussed in this study, can serve as an effective mechanism to assist state-owned shareholders in governing private enterprises.
The data presented in this study are sourced from the CSMAR database (https://data.csmar.com/) and the Wind database (https://www.wind.com.cn). Readers may access and download the relevant datasets directly from these platforms. In the revised manuscript, we have provided a comprehensive description of the data sources and processing methods, enabling readers to replicate and analyze the data as needed independently.
CG designed the research study. YW performed the research and analyzed the data. WS provided help and advice on how to improve this manuscript. WS, YW, and CG wrote the manuscript. All authors read and approved the final manuscript. All authors have participated sufficiently in the work and agreed to be accountable for all aspects of the work.
Not applicable.
We would like to thank the two anonymous reviewers for their constructive suggestions.
1. Hangzhou Dianzi University Artificial Intelligence Enabled Teaching Pilot Program (Course Name: Financial Management). 2. General Research Project of Zhejiang Provincial Department of Education (No. 2023-005) and the Zhejiang Graduate Education Society (No. 2023-005). 3. The university-level scientific research start-up project of Shenzhen Polytechnic University in 2023: “Internal control and high-quality development of Enterprises: Based on the whole-process perspective of Government subsidies” supported by “the Research Foundation of Shenzhen Polytechnic under Grant 6023312001S”. 4. University-level Youth Innovation Project, Research on Internal Control of China’s Anti-Dumping Involved Enterprises Based on Carbon Emission Reduction and Carbon Information (Project No. 6022310011S).
The authors declare no conflict of interest.
See Tables 20,21,22, Figs. 1,2,3,4.
| State-Owned Shareholders | Shareholders are formed through direct control by the government via relevant departments such as the State-Owned Assets Supervision and Administration Commission (SASAC) or through state-controlled industrial enterprises and government-owned investment management companies. |
| Private Shareholders | Domestic non-state-owned corporate entities. |
| Institutional Investors (Natural Persons or Family-Owned Entities) | Financial investment companies such as securities firms, insurance companies, trusts, banks, and funds. This category excludes state-owned financial institutions such as the National Social Security Fund, Central Huijin Investment Ltd., and the four major state-owned asset management companies, which are classified under state-owned shareholders. |
| Foreign Shareholders | Shareholders consist of legal entities, foreign-invested enterprises, or overseas individuals holding shares in publicly listed Chinese companies, as per relevant legal provisions. |
| Individual and Family-Owned Shareholders | Shareholders are formed through investments made by domestic individuals or family-owned entities within China. |
| Others | Shareholders that do not fall under the five categories mentioned above. |
| BTD | Staterate | Statedummy | Discount | Invest | Lev | Ppe | Intang | ListAge | Cashflow | Growth | Balance | Roa | Size | |
| BTD | 1 | |||||||||||||
| Staterate | –0.027*** | 1 | ||||||||||||
| Statedummy | –0.022*** | 0.909*** | 1 | |||||||||||
| Discount | 0.150*** | –0.048*** | –0.045*** | 1 | ||||||||||
| Invest | 0.209*** | 0.012 | 0.017** | 0.146*** | 1 | |||||||||
| Lev | –0.115*** | 0.032*** | 0.036*** | 0.043*** | –0.104*** | 1 | ||||||||
| Ppe | –0.004 | 0.023*** | 0.016** | 0.115*** | –0.165*** | 0.156*** | 1 | |||||||
| Intang | –0.079*** | 0.022*** | 0.020*** | –0.059*** | –0.089*** | 0.099*** | 0.168*** | 1 | ||||||
| ListAge | 0.007 | 0.078*** | 0.088*** | –0.059*** | –0.034*** | 0.371*** | 0.168*** | 0.139*** | 1 | |||||
| Cashflow | 0.151*** | 0.006 | –0.01 | 0.020*** | 0.108*** | –0.108*** | 0.194*** | 0.062*** | 0.105*** | 1 | ||||
| Growth | 0.021*** | –0.013* | –0.009 | 0.001 | 0.033*** | 0.117*** | –0.056*** | –0.012 | –0.046*** | –0.019** | 1 | |||
| Balance | 0.027*** | 0.108*** | 0.112*** | 0.008 | 0.087*** | –0.063*** | –0.103*** | –0.053*** | –0.107*** | –0.045*** | 0.057*** | 1 | ||
| Roa | 0.314*** | –0.004 | –0.019** | –0.081*** | 0.191*** | –0.334*** | –0.101*** | –0.090*** | –0.158*** | 0.491*** | 0.210*** | 0.004 | 1 | |
| Size | 0.044*** | 0.036*** | 0.045*** | 0.011 | –0.070*** | 0.519*** | 0.099*** | 0.058*** | 0.521*** | 0.108*** | 0.058*** | –0.060*** | –0.023*** | 1 |
| Vif | 1.02 | 1.03 | 1.08 | 1.12 | 1.70 | 1.19 | 1.06 | 1.53 | 1.53 | 1.13 | 1.05 | 1.80 | 1.76 |
Note: The values in parentheses are t-statistics adjusted using robust standard errors. *, **, and *** denote significance at the 10%, 5%, and 1% levels, respectively.
| (1) | (2) | (3) | (4) | (5) | (6) | (7) | |
| Statedummy | Loan | Loan | Subsidy | Subsidy | RPT | RPT | |
| Relationship | –0.052*** | ||||||
| (–4.86) | |||||||
| Statedummy | 0.014** | 0.002*** | –0.016*** | ||||
| (2.42) | (3.58) | (–2.69) | |||||
| Staterate | 0.166*** | 0.008** | –0.117** | ||||
| (3.12) | (2.21) | (–2.28) | |||||
| Discount | –0.327*** | 0.031*** | 0.031*** | 0.014*** | 0.014*** | –0.006 | –0.007 |
| (–3.98) | (2.80) | (2.83) | (13.80) | (13.81) | (–0.51) | (–0.53) | |
| Invest | 2.213*** | –0.603*** | –0.606*** | 0.012 | 0.012 | –0.520*** | –0.517*** |
| (3.45) | (–5.11) | (–5.28) | (1.15) | (1.15) | (–5.80) | (–5.78) | |
| Lev | 0.074 | 0.103*** | 0.102*** | –0.018*** | –0.018*** | 0.480*** | 0.480*** |
| (0.63) | (9.36) | (9.28) | (–18.34) | (–18.34) | (33.30) | (33.30) | |
| Ppe | 0.249 | 0.102*** | 0.101*** | –0.011*** | –0.011*** | 0.007 | 0.007 |
| (1.61) | (6.33) | (6.32) | (–7.58) | (–7.59) | (0.34) | (0.36) | |
| Intang | –0.285 | 0.084* | 0.083* | 0.031*** | 0.031*** | 0.053 | 0.052 |
| (–0.58) | (1.72) | (1.71) | (6.87) | (6.88) | (0.87) | (0.86) | |
| ListAge | 0.201*** | –0.019*** | –0.019*** | –0.007*** | –0.007*** | –0.015*** | –0.015*** |
| (8.42) | (–3.32) | (–3.36) | (–13.69) | (–13.69) | (–2.72) | (–2.70) | |
| Cashflow | –0.423 | –0.160*** | –0.161*** | 0.007*** | 0.007*** | –0.105*** | –0.105*** |
| (–1.44) | (–5.70) | (–5.72) | (2.75) | (2.73) | (–2.68) | (–2.67) | |
| Growth | –0.112** | –0.020*** | –0.019*** | 0.001* | 0.001* | –0.007 | –0.007 |
| (–2.12) | (–3.87) | (–3.80) | (1.70) | (1.72) | (–1.09) | (–1.12) | |
| Balance | 0.259*** | –0.024*** | –0.024*** | –0.007*** | –0.007*** | –0.023*** | –0.023*** |
| (16.23) | (–3.44) | (–3.49) | (–11.45) | (–11.45) | (–3.41) | (–3.38) | |
| Roa | –0.563 | –0.185*** | –0.185*** | 0.004 | 0.004 | –0.029 | –0.029 |
| (–1.07) | (–4.21) | (–4.23) | (0.90) | (0.89) | (–0.49) | (–0.48) | |
| Size | 0.035* | –0.003 | –0.002 | –0.001*** | –0.001*** | –0.020*** | –0.020*** |
| (1.73) | (–1.25) | (–1.20) | (–7.87) | (–7.86) | (–7.68) | (–7.68) | |
| IMR | –0.117*** | –0.117*** | –0.034*** | –0.034*** | –0.051* | –0.050* | |
| (–3.77) | (–3.78) | (–12.71) | (–12.77) | (–1.78) | (–1.74) | ||
| _cons | –0.964* | 0.421*** | 0.419*** | 0.138*** | 0.138*** | 0.589*** | 0.586*** |
| (–1.94) | (3.88) | (3.87) | (14.70) | (14.74) | (5.75) | (5.72) | |
| Year | Yes | Yes | Yes | Yes | Yes | Yes | Yes |
| Ind | Yes | Yes | Yes | Yes | Yes | Yes | Yes |
| N | 16,485 | 8226 | 8226 | 16,428 | 16,428 | 15,858 | 15,858 |
| Adj. R2 | 0.117 | 0.119 | 0.215 | 0.214 | 0.173 | 0.173 |
Note: The values in parentheses are t-statistics adjusted using robust standard errors. *, **, and *** denote significance at the 10%, 5%, and 1% levels, respectively.
 Fig. 1.
 Propensity score matching 1:1 matching results.
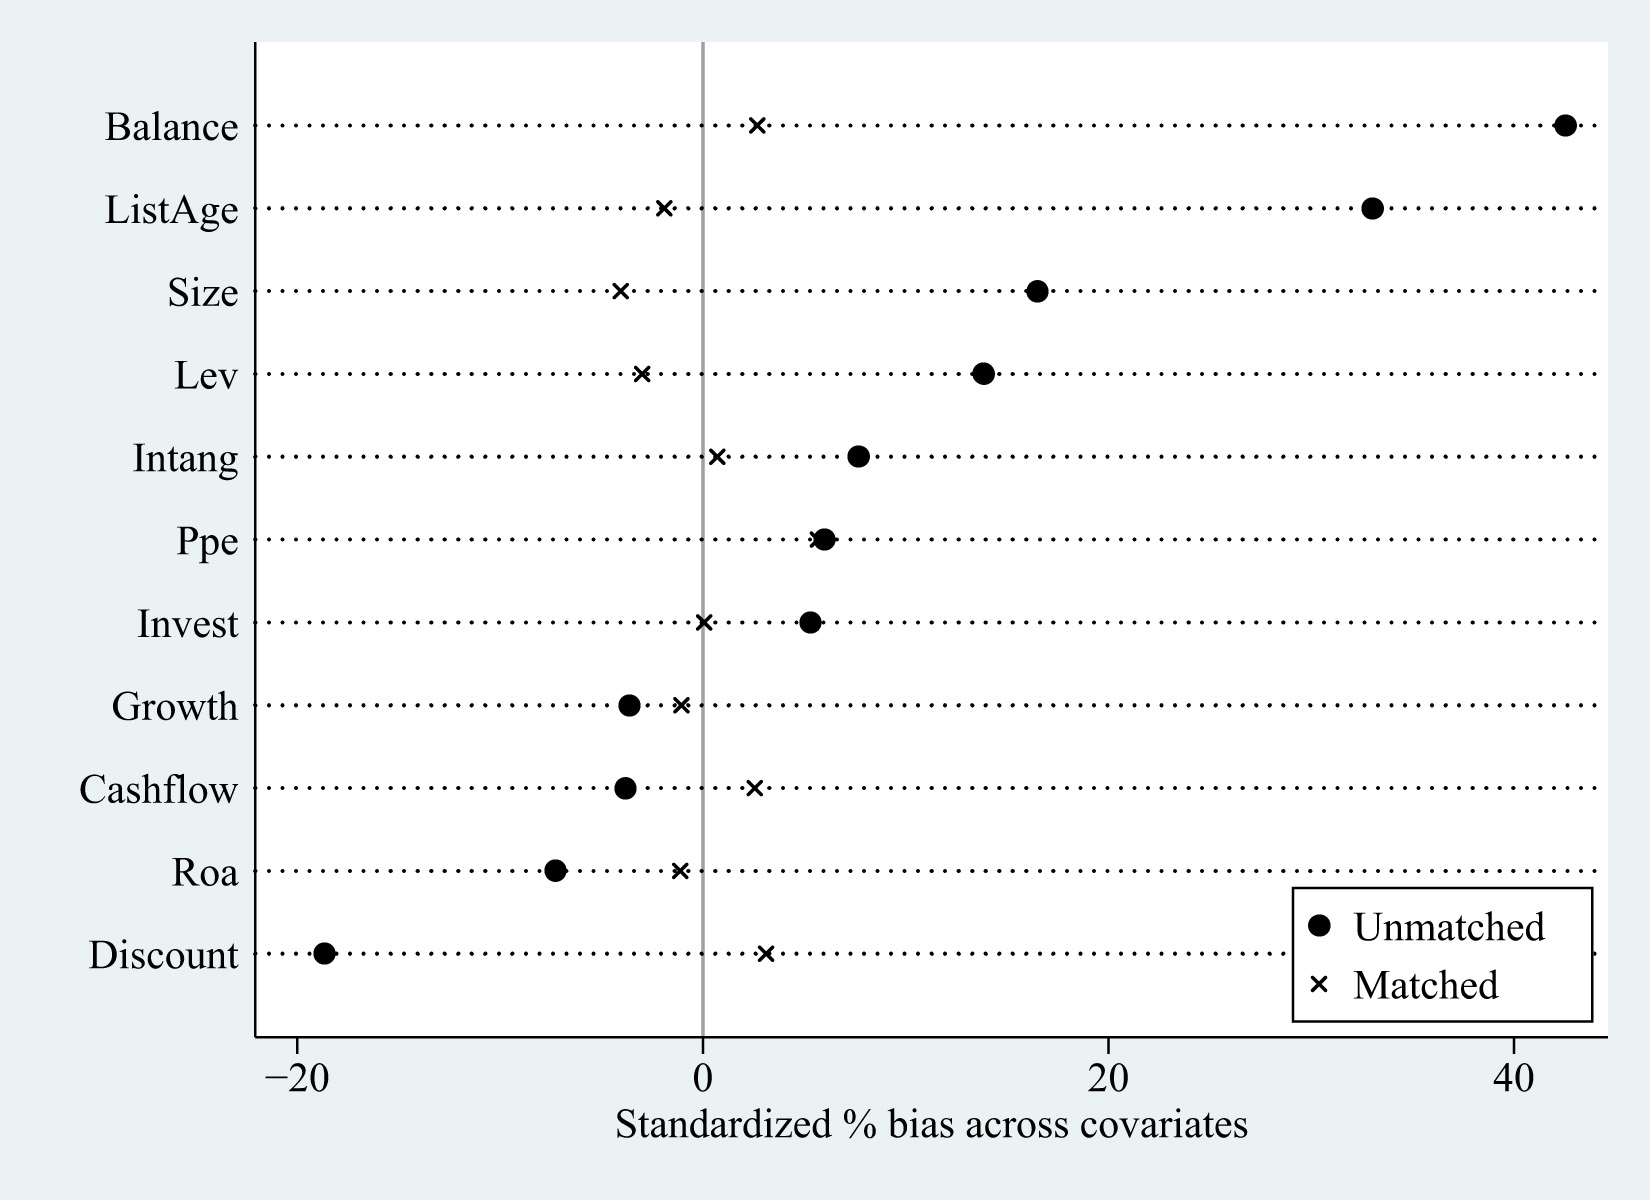 Fig. 2.
 Propensity score matching 1:2 matching results.
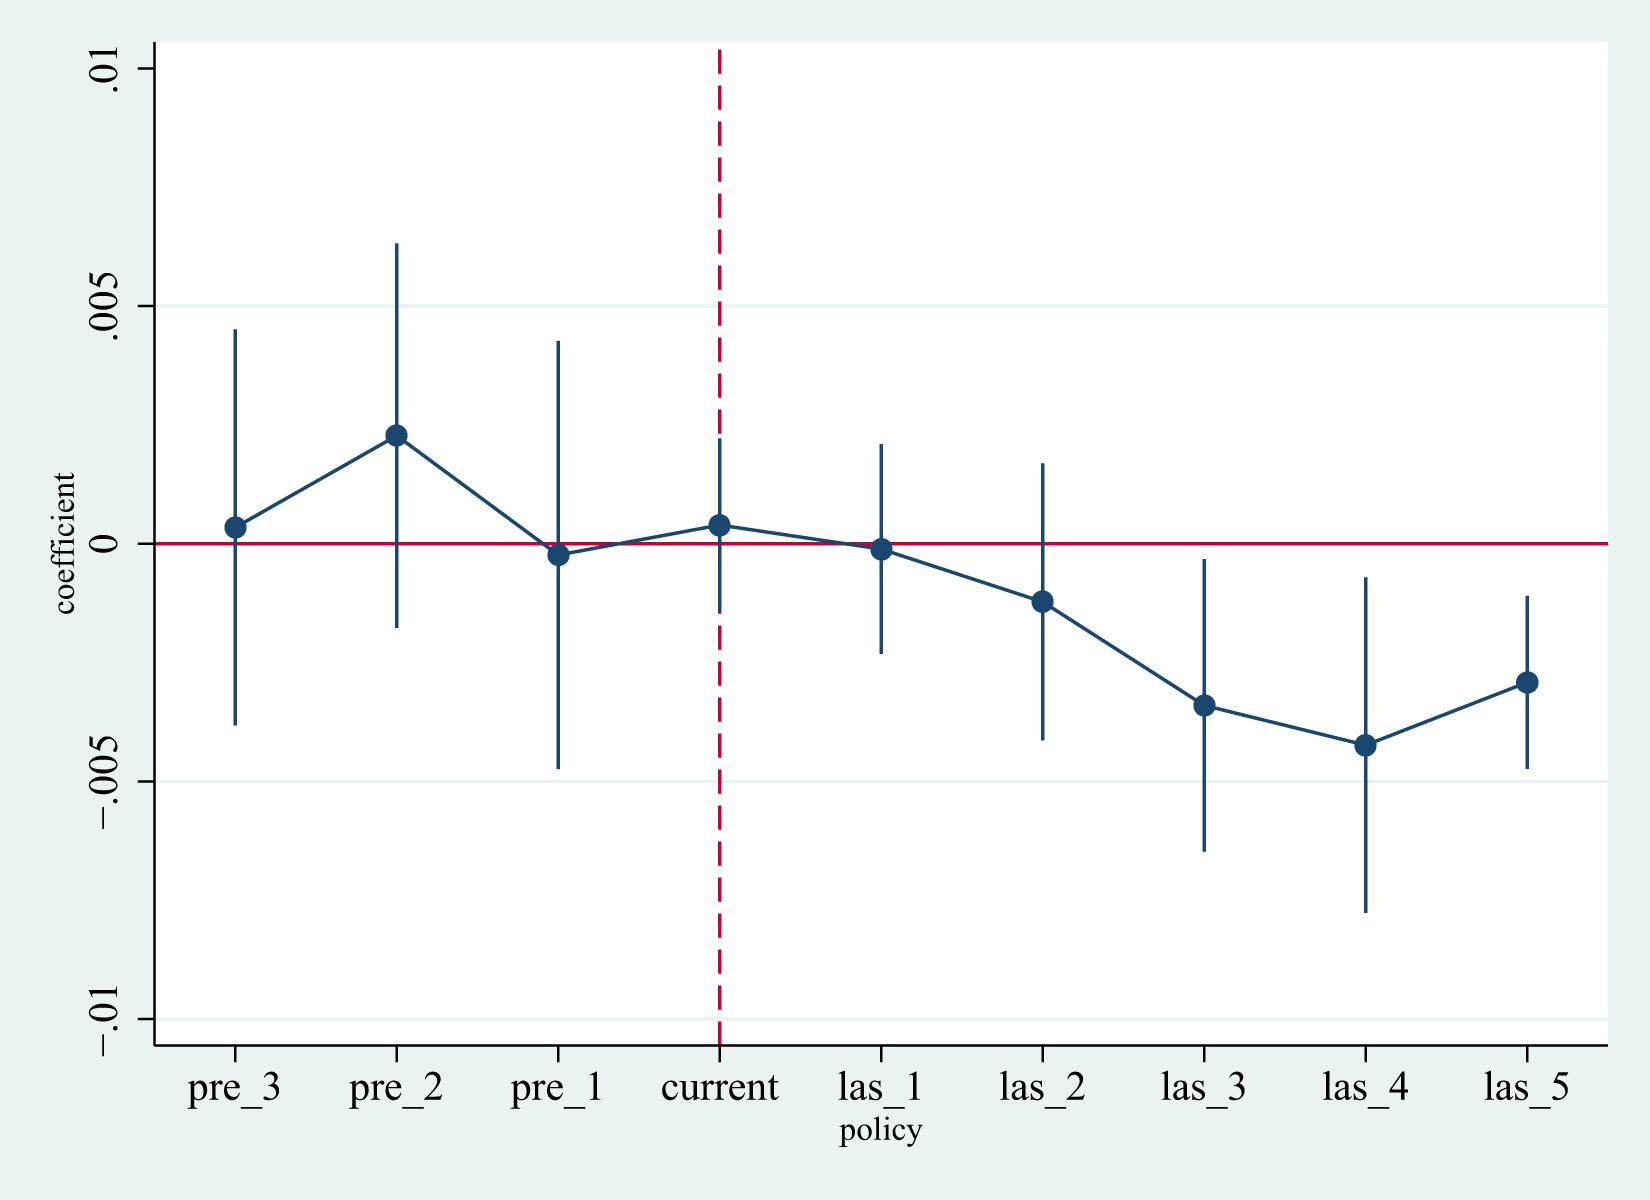 Fig. 3.
 Parallel trend test.
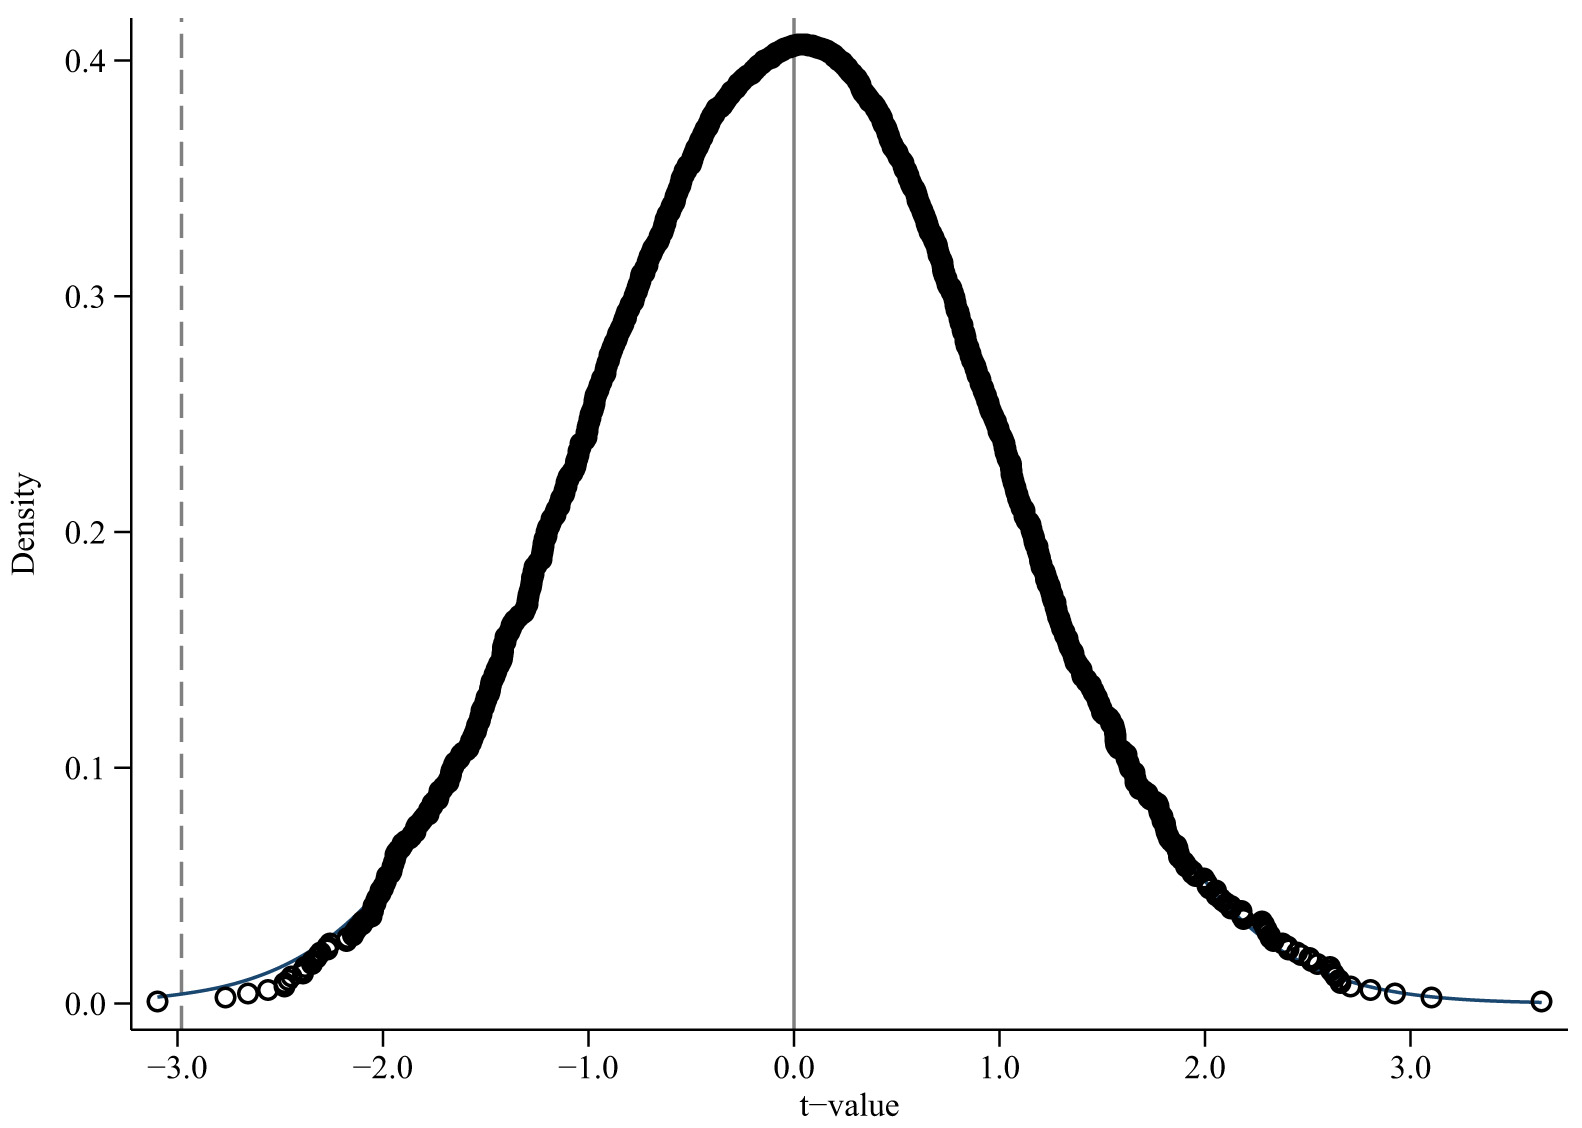 Fig. 4.
 Placebo test.
References
Publisher’s Note: IMR Press stays neutral with regard to jurisdictional claims in published maps and institutional affiliations.