


 , José A. Rodríguez-Martínez 1,*
1 Department of Biology, University of Puerto Rico-Río Piedras, 00931 San Juan, Puerto Rico
Abstract
Genome-wide association studies (GWAS) have mapped over 90% of disease- and
quantitative-trait-associated variants within the non-coding genome. Non-coding
regulatory DNA (e.g., promoters and enhancers) and RNA (e.g., 5
Graphical Abstract
Keywords
- non-coding variants
- gene regulation
- transcription factors
- massively parallel reporter assay
- RNA processing
The haploid human genome is ~3.2 billion base pairs, with about 98% comprising non-protein-coding DNA [1, 2, 3, 4]. Genome-wide association studies (GWAS) have revealed that over 90% of disease- and trait-associated variants have been mapped within the non-coding genome [5, 6, 7, 8, 9]. This raises the question: How do single-nucleotide mutations outside the protein-coding genome impact cellular and organismal phenotype? A possible reason is that the non-coding genome potentially regulates gene expression [9, 10]. Cis-regulatory elements (CREs) are non-coding DNA sequences that regulate gene expression, including promoters, enhancers, insulators, and silencers. Promoters are near the transcription start site (TSS), where the transcriptional machinery is recruited to form the pre-initiation complex [11, 12, 13]. Enhancers are one of the most abundant CREs responsible for enhancing transcription and regulating the spatial and temporal expression of genes in a tissue-specific manner [14]. They can be located as far as megabases upstream or downstream from the target gene and have been shown to physically interact with the promoters of the target genes through protein-mediated DNA looping [12, 15].
An early example of a non-coding single-nucleotide variant/polymorphism
(SNV/SNP) associated with a human disease was reported in 1982 in the
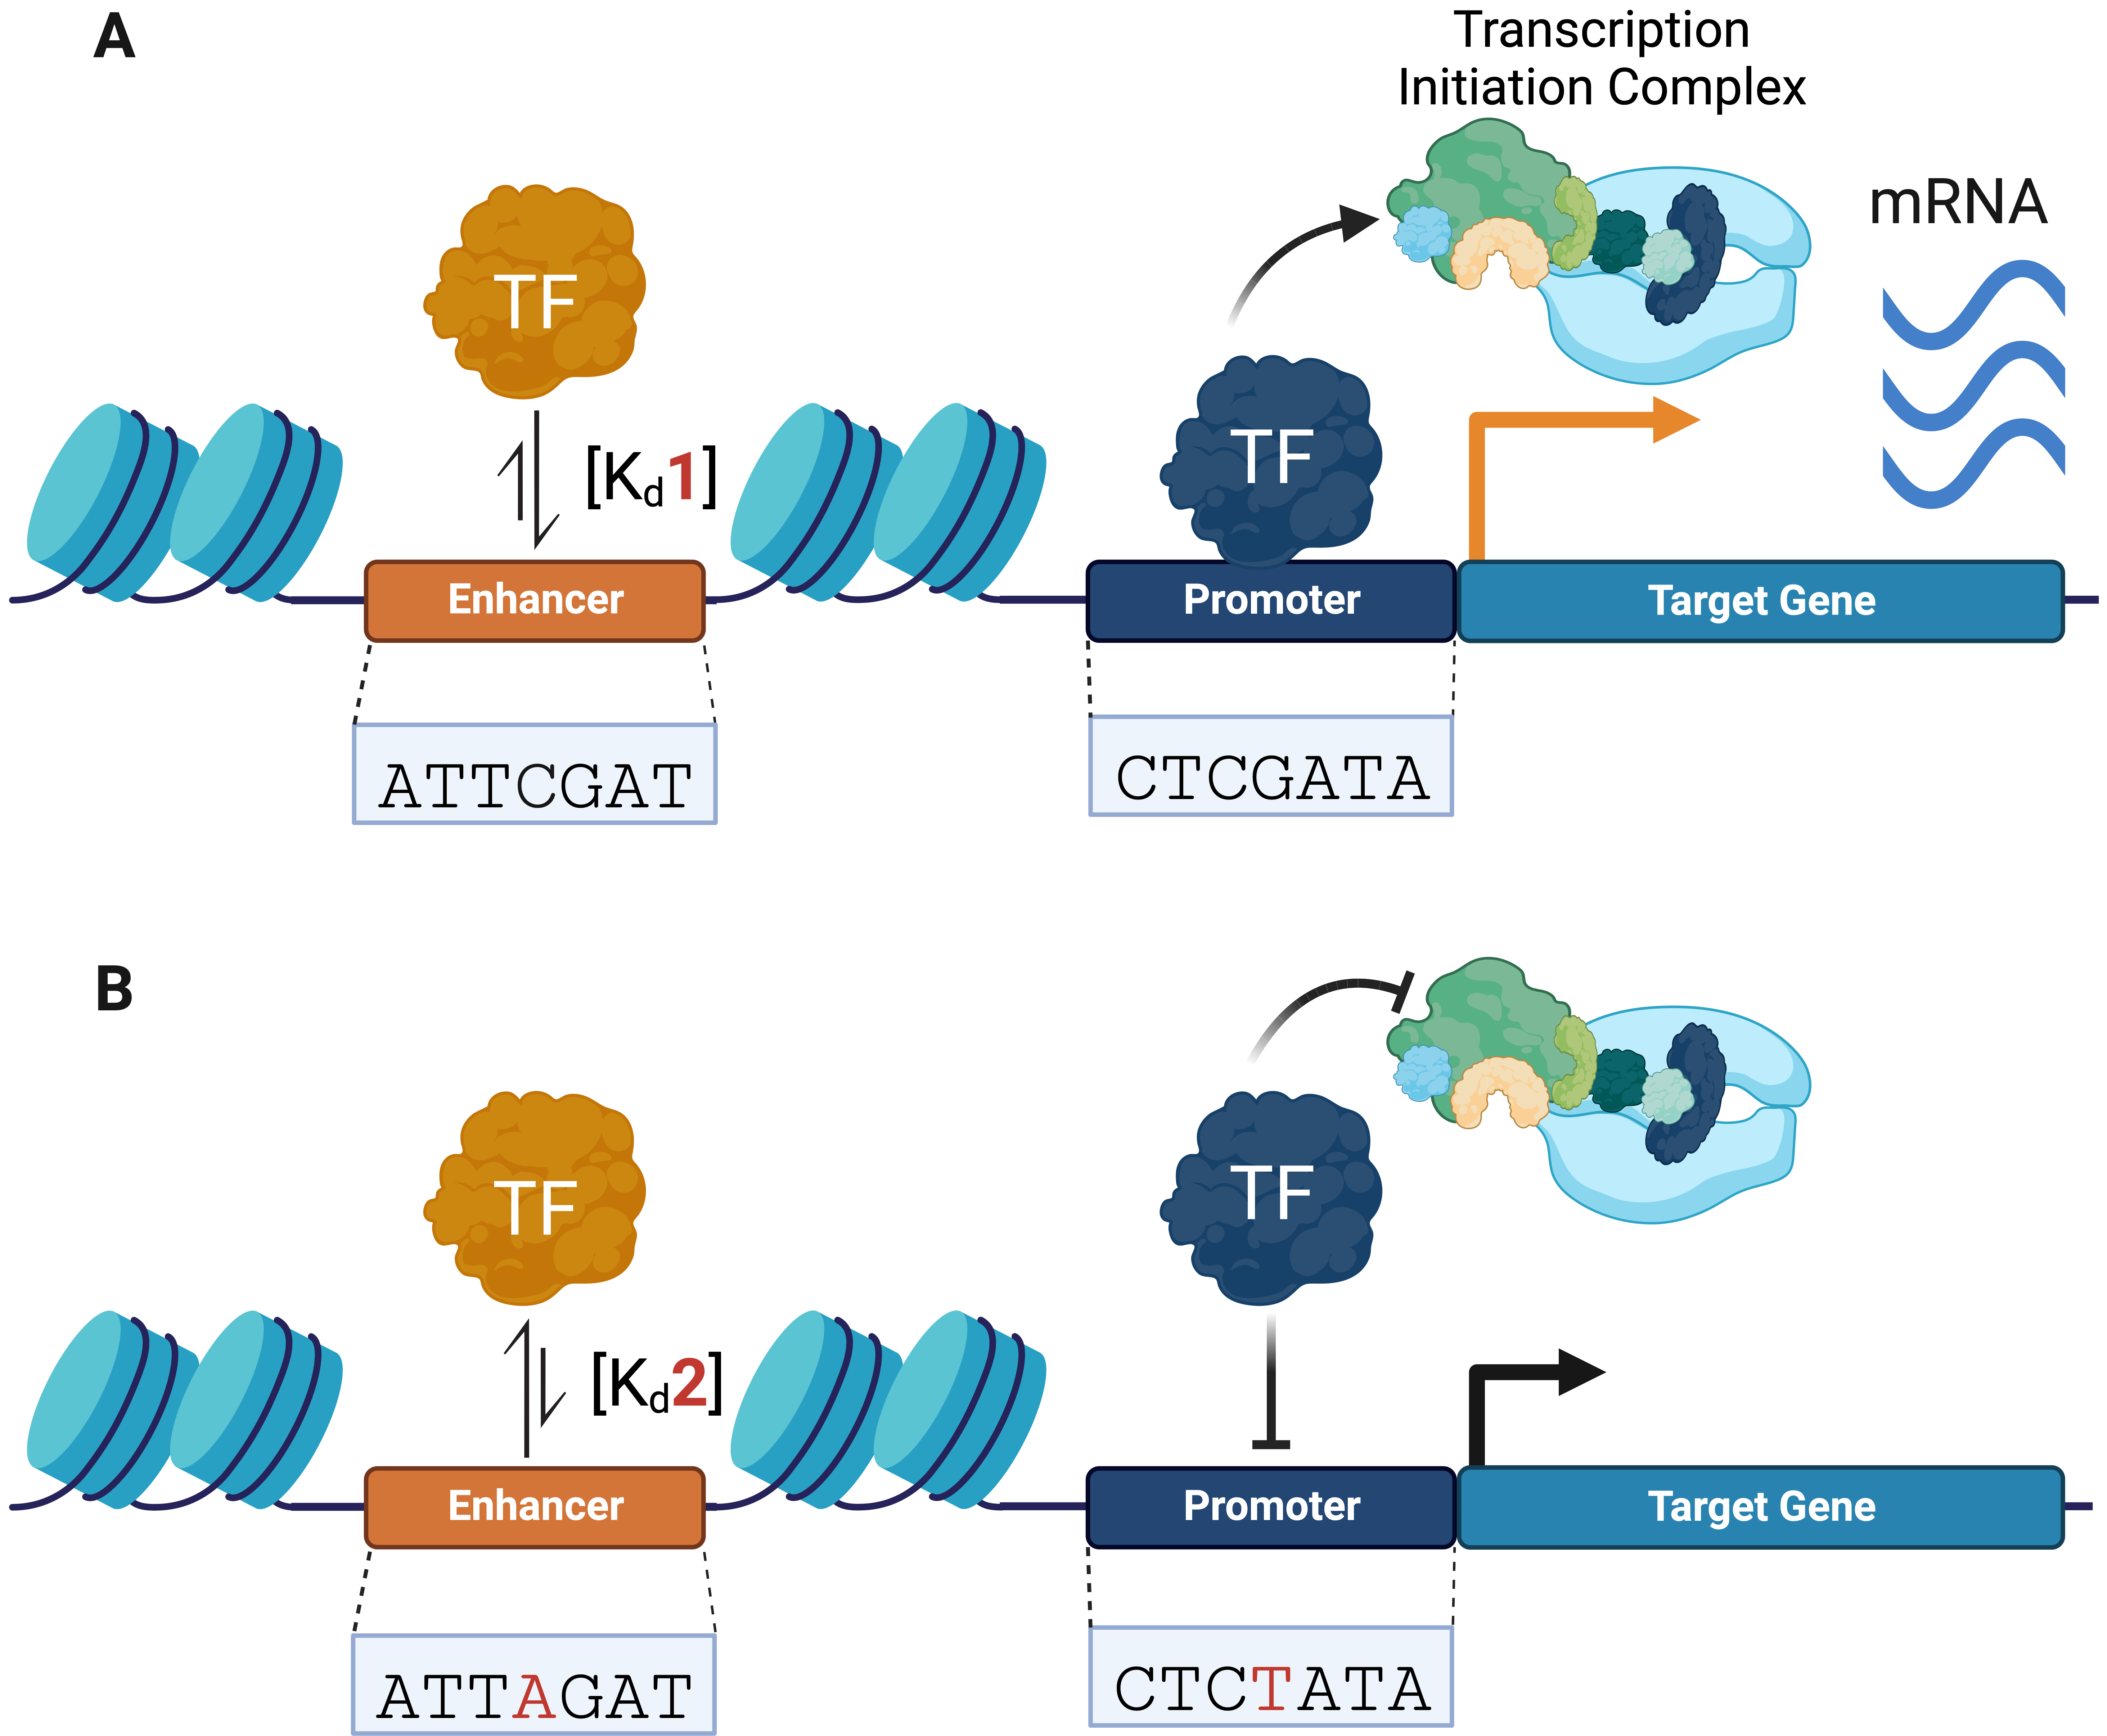
SNVs can modulate genomic binding by regulatory proteins, such as transcription factors (TFs), which are sequence-specific DNA-binding proteins that bind to CREs (e.g., promoters and enhancers) and recruit the transcriptional machinery needed to regulate gene expression (Fig. 1A) [20, 21, 22, 23]. TFs target their specific binding sites through their DNA binding domains (DBDs), which in eukaryotes recognize short sequences of 6–12 bp [24, 25, 26]. Non-coding SNVs have been shown to alter TF-DNA recognition, leading to gene dysregulation (Fig. 1B) [6, 27, 28]. These variants can increase or decrease the affinity of TFs for a specific DNA sequence through the creation or disruption of TF-binding motifs [29, 30, 31].
 Fig. 1.
Non-coding variants can alter transcription factor (TF)–DNA binding activity, transcriptional machinery recruitment, and gene expression. (A) TFs bind to regulatory DNA (e.g., promoters and enhancers) and recruit transcriptional machinery to initiate gene expression. (B) Non-coding variants can change TF–DNA binding affinities, altering transcriptional complex recruitment and gene expression. Changes in TF–DNA binding affinities are represented by equilibrium arrows. Changes in gene expression are represented by a black (decrease) and orange (increase) arrow.
Previous studies have determined changes in TF affinity through its binding site
with in vitro assays, such as electrophoretic mobility shift assays
(EMSA) [32]. Recently, Peña-Martínez et al. [33] identified
five cardiovascular disease/trait-associated SNPs (rs7350789, rs61216514,
rs7719885, rs747334, and rs3892630) predicted to alter the cardiac TF NKX2-5 DNA
binding affinity and validated these predictions through EMSA. Although EMSA can
be implemented to evaluate how non-coding SNPs can impact the formation of the
TF-DNA complex and quantify changes in dissociation constant (K
The Fordyce lab developed microfluidic-based high-throughput approaches to
determine differences in TF affinities through Binding Energy Topography by
sequencing (BET-seq) [43] and simultaneous transcription factor affinity
measurements via microfluidic protein arrays (STAMMP) [44]. BET-seq can estimate
Gibbs free energy of binding (
Jung et al. [45] developed high-performance fluorescence anisotropy (HiP-FA), a microscopy-based fluorescence polarization method using fluorophore-labeled DNA. TF–DNA complexes have a larger molecular weight than the unbound DNA, resulting in a decreased rotational speed and increased FA. Using HiP-FA, Jung et al. [45] determined the DNA-binding specificity for 26 purified TF DBDs from Drosophila and changes in affinity for all 33 possible 1-mismatch variants in the homeobox protein Bicoid (Bcd) 11-mer consensus sequence. Bray et al. [46] developed the Customizable Approach to Survey Complex Assembly at DNA Elements (CASCADE), a PBM-based method to profile cofactor recruitment by TFs through antibody labeling. They used CASCADE to profile cofactor recruitment at 1712 SNPs associated with eQTLs and chromatin accessibility (caQTLs) changes that altered binding motifs for multiple ETS–family TF–cofactor complexes in myeloid cells. Through this approach, Bray et al. [46] found that non-coding variants also impact cofactor recruitment, which is essential in regulating gene expression. Yan et al. [47] developed SNP-SELEX, a high-throughput multiplexed TF–DNA binding assay, and evaluated the differential binding of 270 human TFs on 95,886 type-2 diabetes-associated SNPs (permutated to all four bases and included SNPs in linkage disequilibrium). An oligo pool was synthesized with 40 bp genomic DNA centered on the SNP and flanking regions for polymerase chain reaction (PCR) amplification and barcoding for sequencing. Using full-length TFs and DBDs, they performed six rounds of enrichment and measured 828 million TF–DNA interactions [47].
Despite the advancements in high-throughput assays to measure changes in binding
affinity, the number of TF (
Predictions using PWMs assume nucleotides contribute to binding in an additive and independent manner but ignore sequence features such as dinucleotides, DNA shape, and complex intracellular patterns [64, 65, 66]. Nishizaki et al. [67] developed an SNP effect matrix pipeline (SEMpl), a computational approach that considers data of TF endogenous binding (ChIP-seq), chromatin accessibility (DNase-seq), and TF-binding patterns (PWMs) to predict intracellular-binding patterns more accurately. SEMpl significantly outperforms the traditional PWM models at predicting changes in affinity by non-coding SNPs using in vitro validation through EMSA [67]. However, the previously mentioned techniques are less effective at predicting tissue-specific binding events altered by non-coding variants. Boytsov et al. [68] recently developed ANANASTRA, an upgraded version of ADASTRA [69], a web server that can accurately predict allele-specific binding events of TFs in different cell types [68]. This program requires inputs from four databases: allele-specific binding events from GTRD (ChIP-seq data) [70], binding patterns from HOCOMOCO (TF motif predictions) [71], a list of variants from dbSNP (rs-IDs) [48], and tissue-specific context from the GTEx project (eQTL) [72].
Machine learning models, such as support vector machine (SVM) and deep learning-based convolutional neural networks (CNN), have been widely used to predict changes in TF binding due to SVMs [73, 74, 75]. VandenBosch et al. [76] used ATAC-seq data to train a gapped k-mer SVM (gkm-SVM) model to predict changes in TF binding to all possible SNPs on 3773 human retinal CREs. Alternatively, CNNs, such as DeepFun [77] and AgentBind [78], are deep learning-based frameworks trained with ChIP-seq and DNase-seq to accurately predict tissue and cell type-specific TF differential binding because of non-coding variants. To further predict the functionality of non-coding SNPs, Wang et al. [79] developed DeFine, a CNN that also implements Hi-C data to map genes affected by risk variants while quantifying real-valued TF binding intensities.
Non-coding variants can impact cellular/organismal phenotypes as a downstream
effect of altering TF–DNA binding by changing gene expression and the
dysregulation of gene regulatory networks (GRNs) (Fig. 1B). Gene reporter assays
are a popular method for quantifying the impact of regulatory variants by
measuring the promoter and enhancer activity on a reporter gene [80, 81]. Jiang
et al. [82] identified three novel regulatory SNVs from 195 conotruncal
heart defect patients that impaired GATA6 binding at the promoter of
TBX1, resulting in decreased expression as determined by a
dual-luciferase reporter assay. Many of the traditional enzyme-mediated gene
reporter assays, such as luciferase [83] and
Massively parallel reporter assays (MPRA) are an emerging high-throughput
technique that substitutes standard enzyme assays with mRNA expression detection
[85]. A library of thousands of regulatory elements or genomic-variant candidates
is cloned into an expression vector with unique barcodes that can be quantified
through DNA and RNA sequencing to determine the gene expression fold change or
through flow cytometry in the case of fluorescent proteins. Lu et al.
[86] used MPRA to evaluate 3073 GWAS systemic lupus erythematosus (SLE)-risk
variants and observed allele-dependent enhancer activity in 16% of the risk
variants. Through this approach, they nominated 51 causal variants in 27 SLE-risk
loci with allelic impact on gene regulation. Another high-throughput assay to
measure regulatory element activity is self-transcribing active regulatory region
sequencing (STARR-seq). In STARR-seq, candidate CREs are cloned downstream of a
minimal promoter and an open reading frame, removing the need to use barcodes by
directly sequencing the transcribed element [87]. Toropainen et al. [88]
used a multiplex STARR-seq assay to evaluate the enhancer activity of 34,344
vascular disease trait GWAS variants and observed allele-specific enhancer
activity for 5711 SNPs. For example, rs17293632:C
Experimental MPRA datasets have been implemented to train predictive models to enhance the prediction of functional non-coding variants. Yang et al. [90] developed presence-only with an elastic net penalty (PO-EN), a semi-supervised model that integrates MPRA data with epigenetic features (chromatin accessibility, methylation, histone modifications, etc.) to predict the regulatory effects of genetic variants. The developers of PO-EN reported greater accuracy at identifying GWAS SNPs with differential enhancer activity in a tissue- and cell-specific manner than other deep-learning models. Dong et al. [91] developed Score of Unified Regulatory Feature (SURF), a computational model that incorporates MPRA data to Regulome DB [92] functional genomics features (e.g., chromatin accessibility, histone variants, and TFBS) to predict the effect of variants on gene expression. SURF was tested in the Fifth Critical Assessment of Genome Interpretation (CAGI5) regulation saturation challenge. SURF outperformed other models in predicting the effect of 17,500 SNPs in disease-associated promoters and enhancers [91]. Movva et al. [93] developed a CNN-based method that utilizes MPRA data to predict and interpret the transcriptional regulatory activity of non-coding variants, Deep RegulAtory GenOmic Neural Network (MPRA-DragoNN). MPRA-DragoNN successfully predicted patterns in TF activity and gene expression events affected by reduced LDL cholesterol level-associated variants from GWAS [93].
For over 30 years, DNA looping has been used to model how distal regulatory elements, such as enhancers, are brought near promoters to regulate gene expression (Fig. 2A) [94]. Advances in chromosome conformation capture (3C) technologies, such as circular 3C (4C) and 3C carbon copy (5C), have led to a better understanding of genome conformation, dynamics, and physical proximity between genomic elements [95, 96, 97]. These methods rely on restriction enzyme digestion of crosslinked chromatin and ligation of proximal elements to determine spatial proximity between genomic regions [98]. Coupled with massively parallel DNA sequencing, 3C assays have fueled widespread adoption and increased understanding of the genome structure on varying scales [97]. The human genome is organized in topologically associating domains (TADs), which provide an additional level of gene regulation by allowing distal CREs to interact with target promoters [99]. Understanding long-range genomic interactions is necessary to understand the potentially disruptive role of CRE variants in human diseases (Fig. 2B). High-throughput chromosome conformation capture (Hi-C) methods have proven more effective at identifying functional variants than mapping the nearest gene of GWAS single nucleotide polymorphisms (SNPs) [100]. CREs are capable of long-range interactions over one megabase (Mb) through DNA looping, skipping several genes [15, 101].
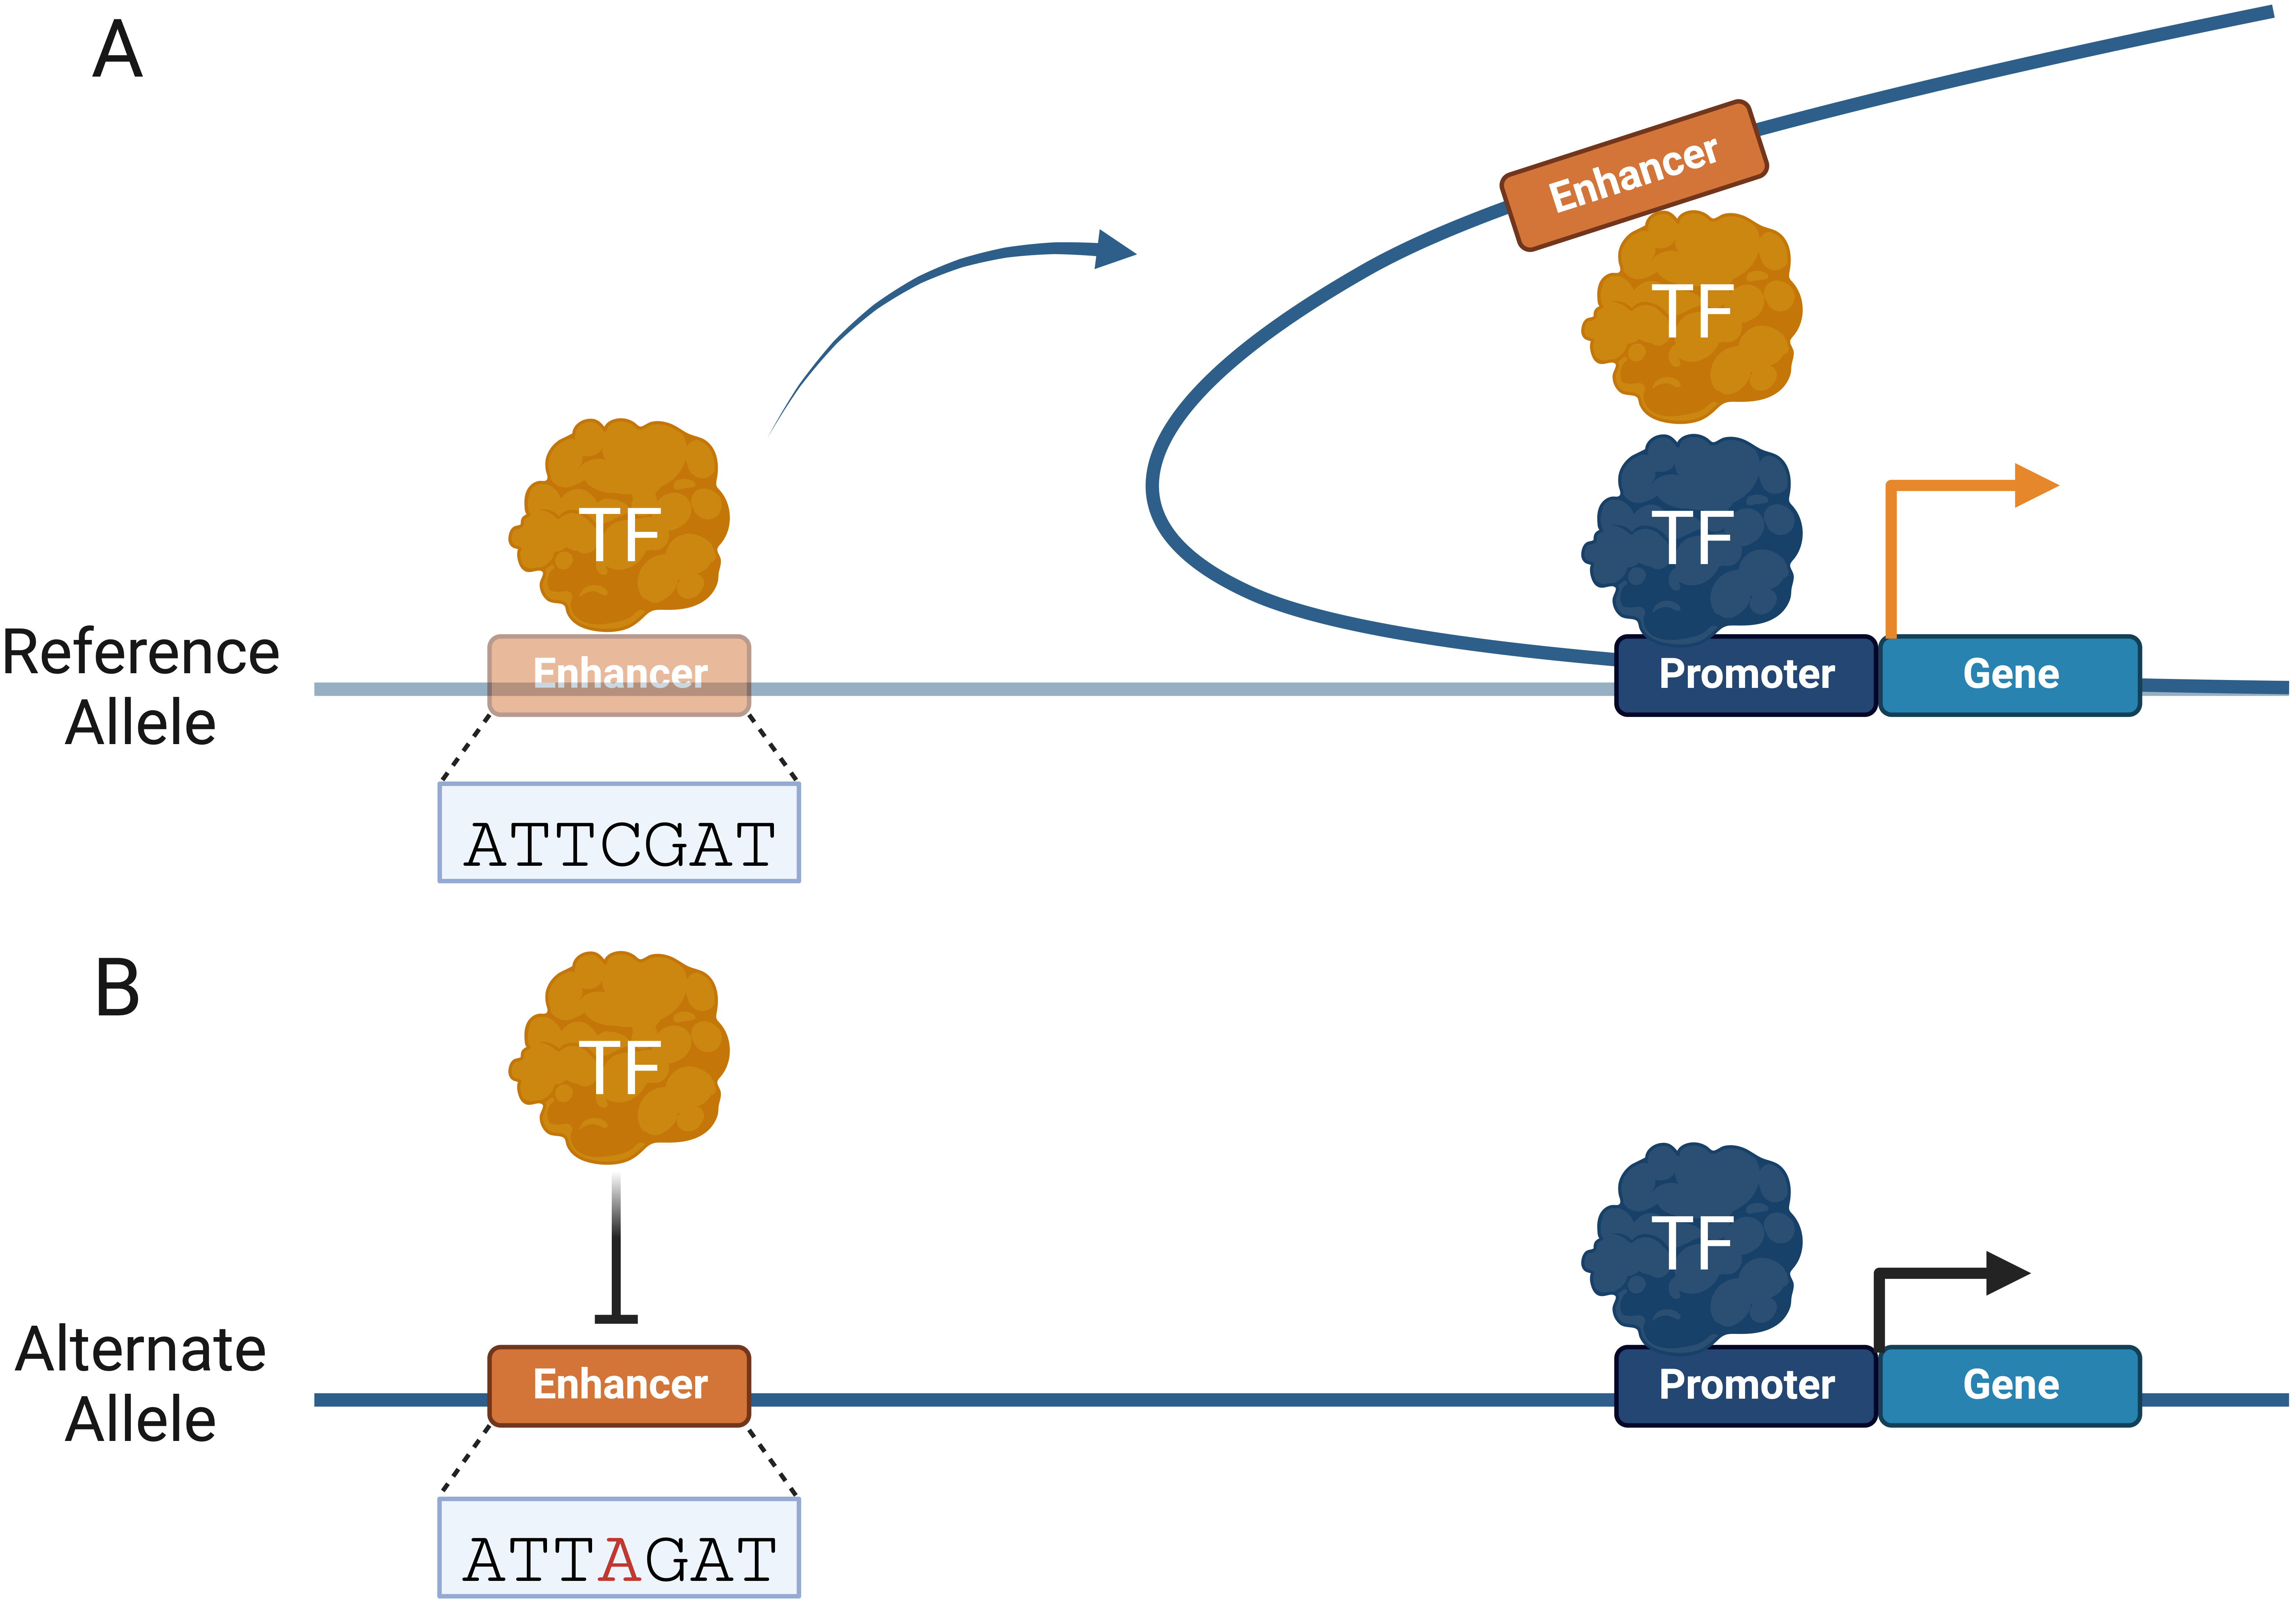 Fig. 2.
Non-coding variants can alter Cis-regulatory element (CRE) interactome. (A) TFs facilitate promoter–enhancer interactions by forming topologically associating domains (TADs) to regulate gene expression. (B) Non-coding variants can alter TAD boundaries and CRE interactions that regulate gene expression. Changes in gene expression are represented by an orange (increase) and black (decrease) arrow.
Promoter-capture Hi-C (PCHi-C) measures the frequency of genome-wide promoter interactions [102]. Orlando et al. [103] screened 19,023 promoter fragments to identify non-coding driver SNVs that alter the colorectal cancer (CRC) cell regulatory landscape. They identified a recurrently mutated CRE that resulted in increased interactions with the ETV1 promoter and a significant upregulation of ETV1, commonly overexpressed in CRC. Selvarajan et al. [104] used PCHi-C to determine the effect of genome-wide coronary artery disease (CAD)-associated non-coding SNPs within liver-specific enhancers. They identified 1277 potential CAD-causal SNPs with allele-specific regulatory activity and 621 target genes that may contribute to CAD phenotypes (compared to only 138 with eQTL analysis). They found PCHi-C to be a powerful technique for identifying target genes affected by non-coding variants, outperforming previous methods such as expression quantitative trait loci (eQTL) analysis.
Contrary to promoters, some enhancers have been shown to regulate the expression
of multiple genes [105]. As such, PCHi-C has been adapted to understand how the
enhancer-to-enhancer interactome is affected by genomic variations. Madsen
et al. [106] used an enhancer-capture Hi-C (ECHi-C) capture array
(library of 76,846 121nt RNA probes) to study the effects of genomic variants on
human mesenchymal stem cells (hMSC) differentiation to adipocytes. Through this
approach, they captured 17,235 putative active enhancers at 0, 1, and 10 days of
adipocyte differentiation and observed that most eQTL variants increase enhancer
interactomes. They found that the variant rs41281051: T
There have been significant advances in experimental approaches to understanding
non-coding variant effects on phenotypes. However, due to the overwhelming number
of identified GWAS SNPs in the human genome (
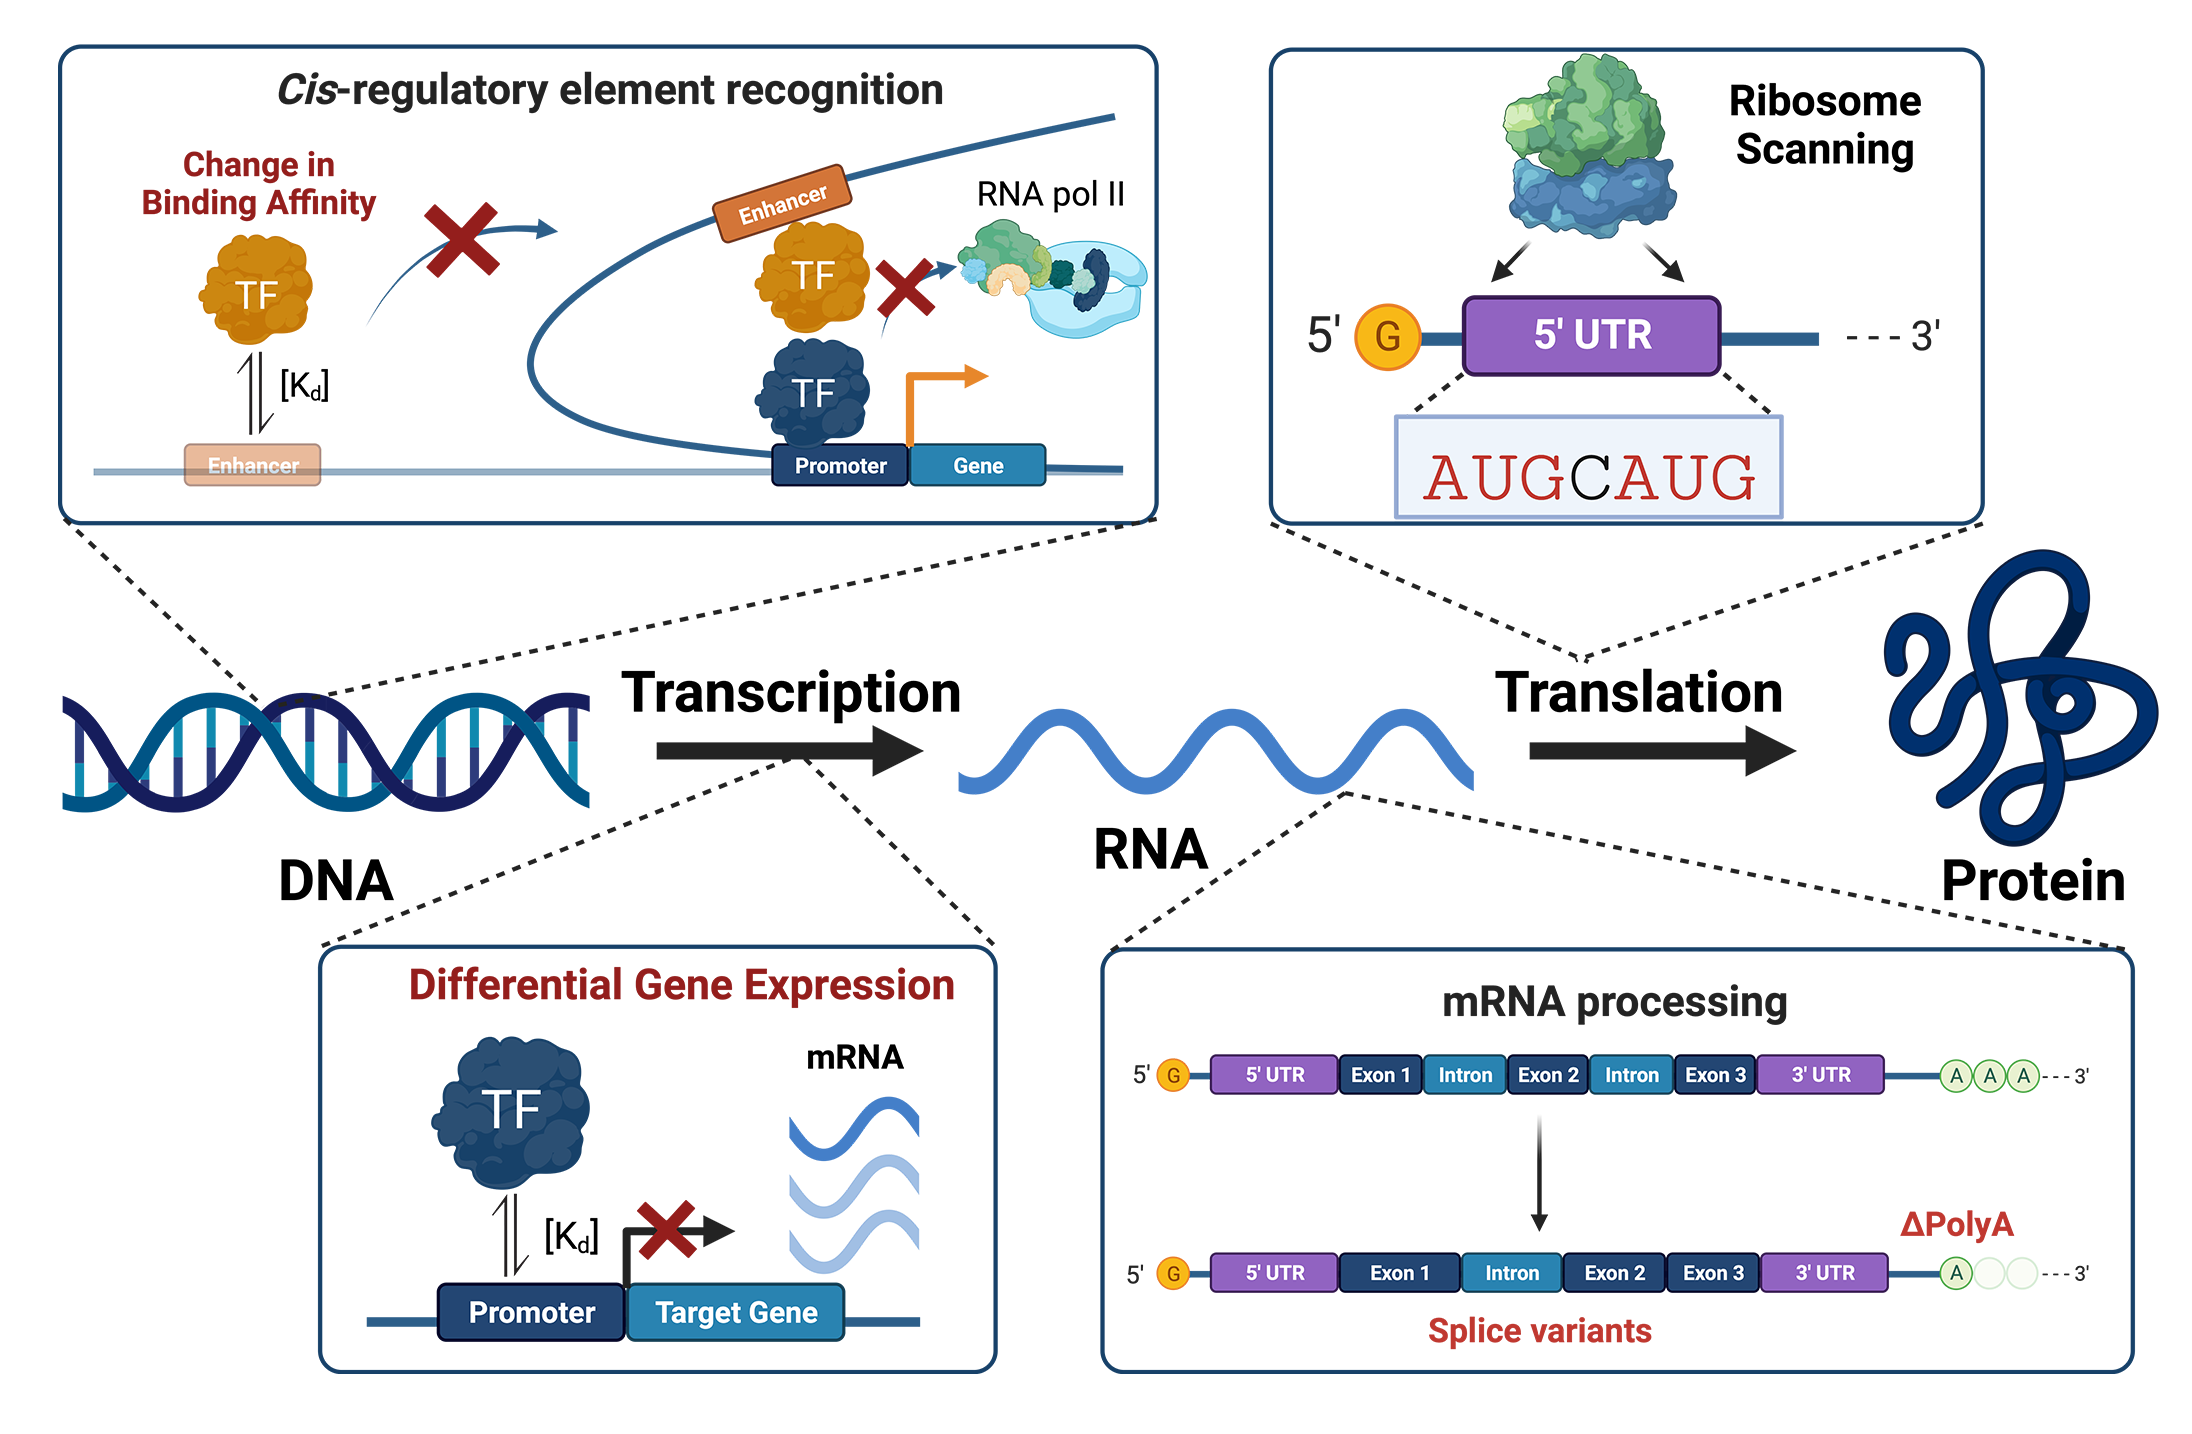
Non-coding variants can occur within the 5
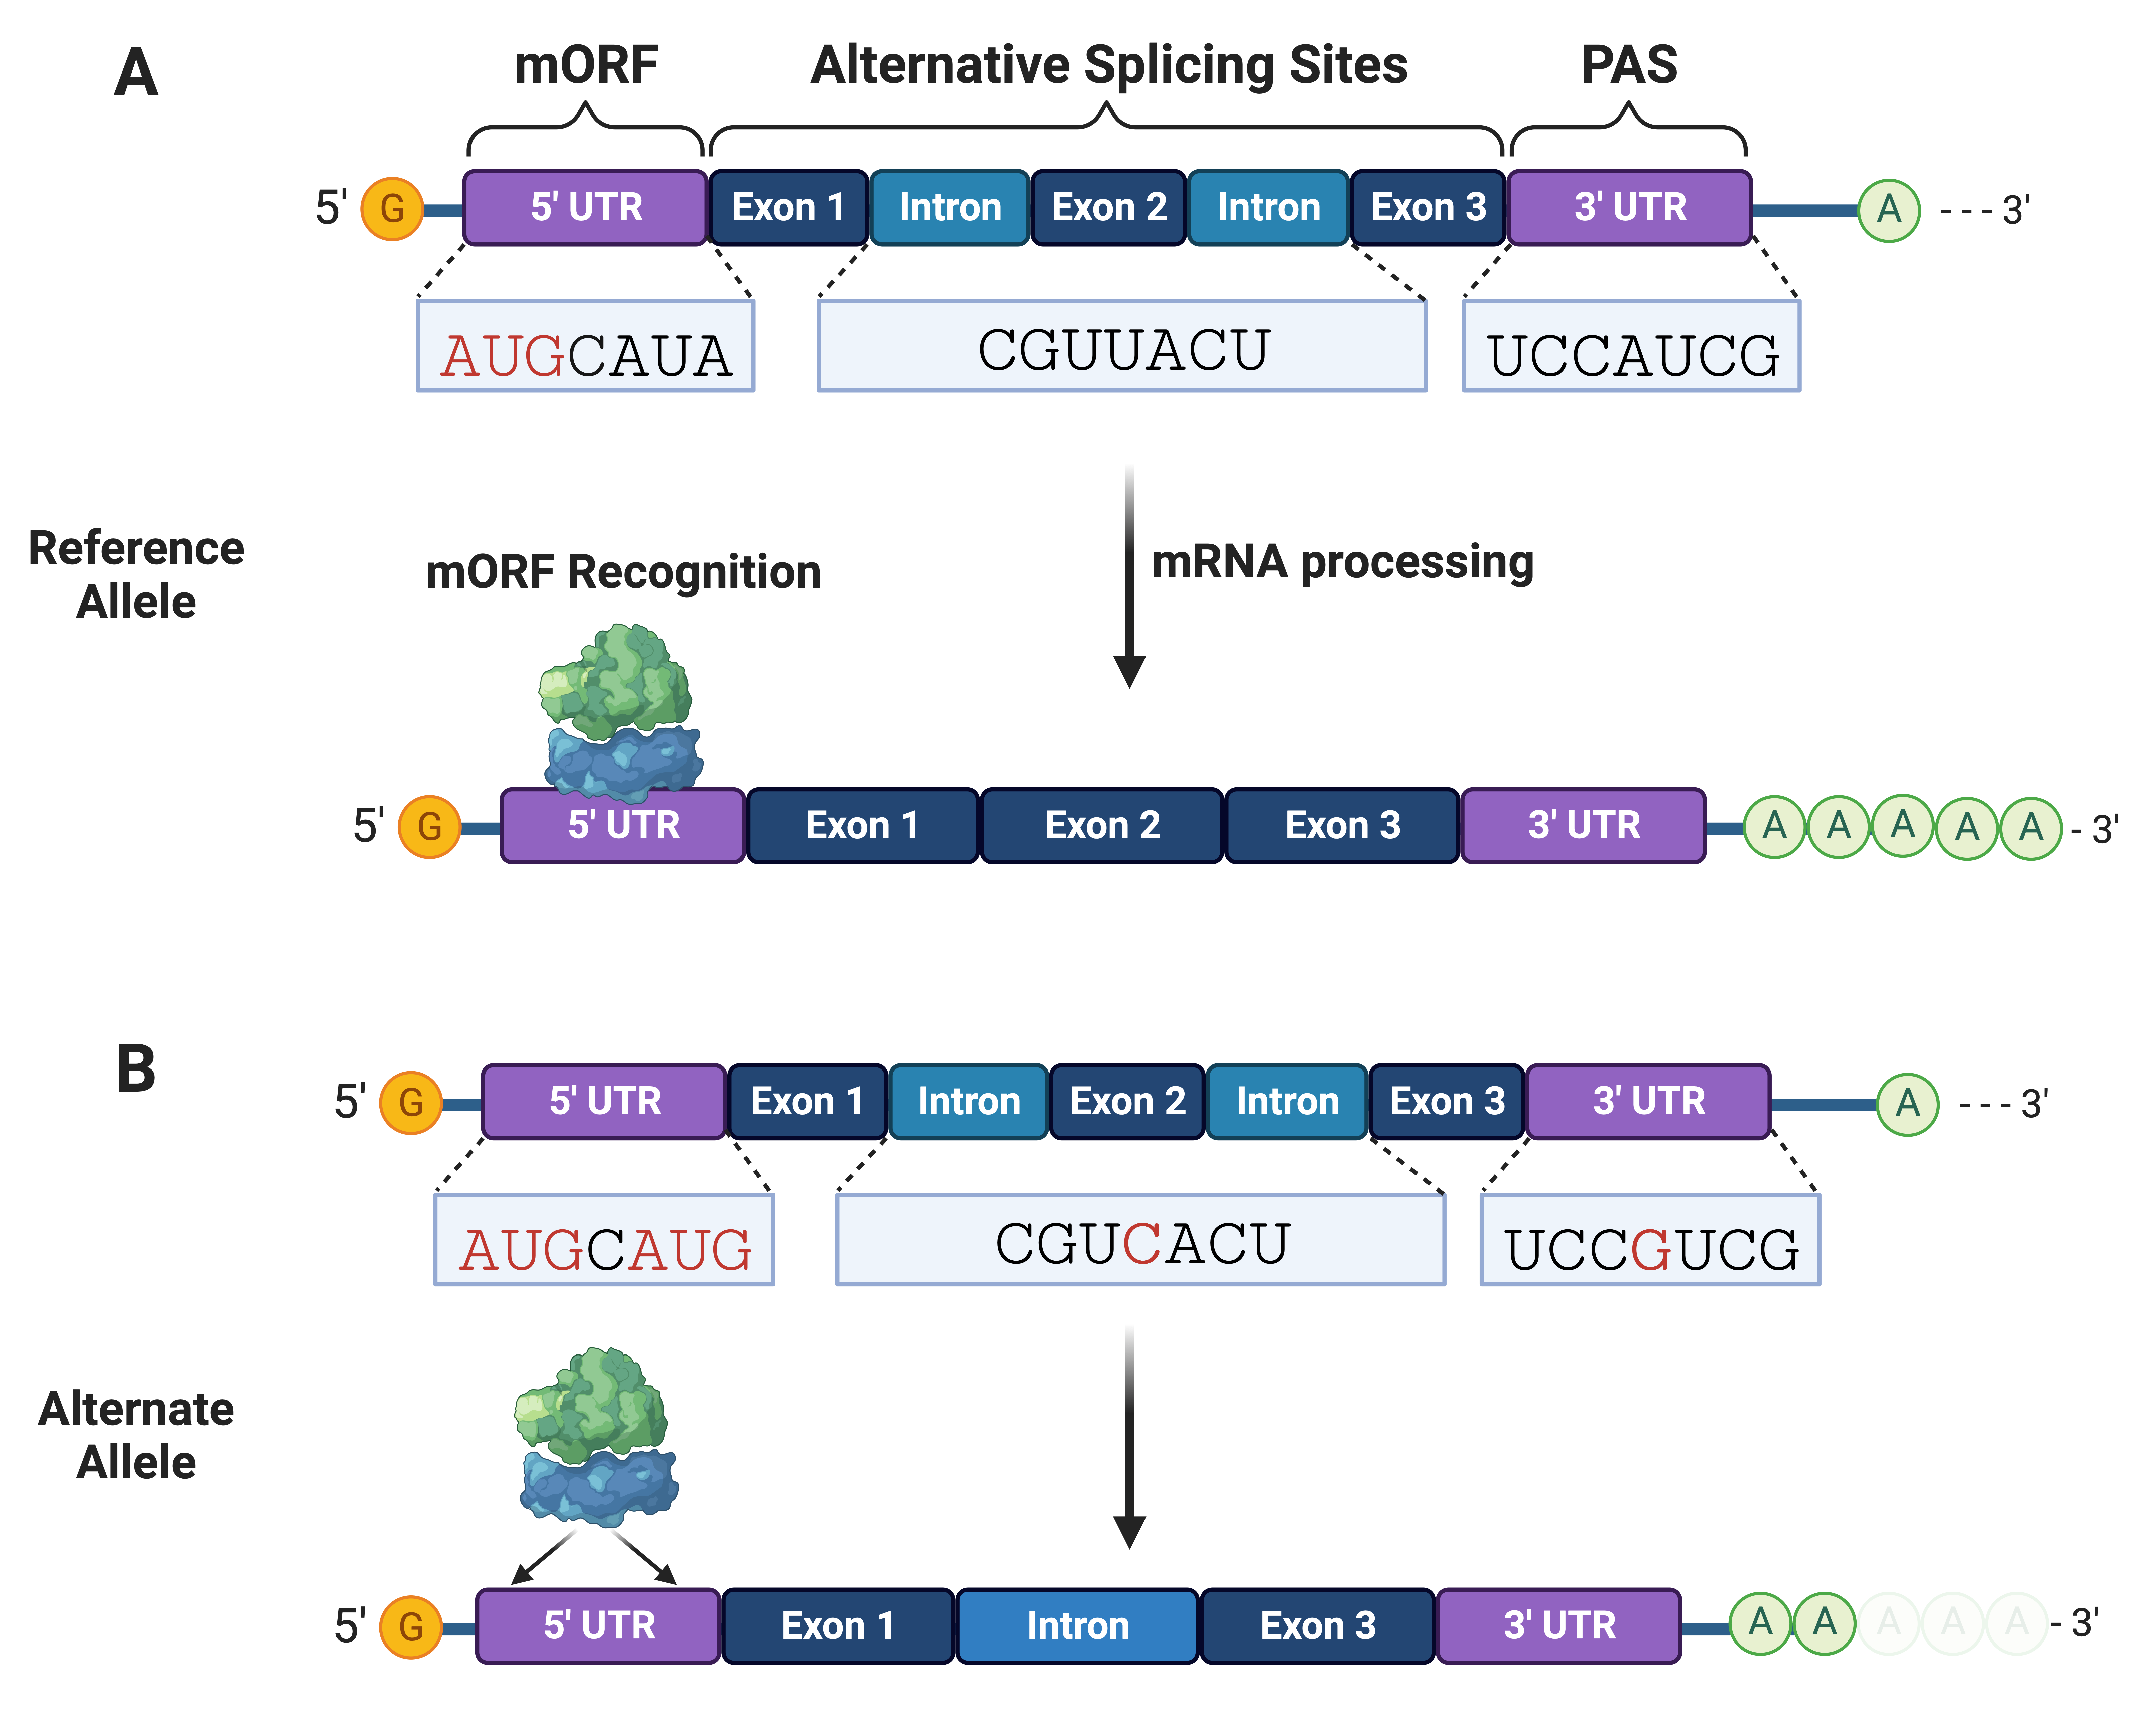 Fig. 3.
Non-coding variants can disrupt mRNA processing and translation initiation. (A) mRNA interactions with RNA-binding proteins and ribosomes are needed for processing (e.g., splicing and adenylation) and translation initiation, respectively. (B) Non-coding variants can alter splice and polyadenylation sites needed for stable mRNA processing and expression of functional protein isoforms. mRNA variants can create translation sites that compete with the main open reading frame (mORF). PAS, polyadenylation sites.
Variants within the 5
With the overwhelming number of non-coding variants, computational approaches
have been developed to identify and prioritize functional variants that occur in
mRNA untranslated regions. Chen et al. [119] developed a computational
pipeline coupled with experimental validation to identify functional variants
within polyadenylation sites (PAS). By implementing four resources of human
polyadenylation maps and two disease-associated databases, they identified 68
pathogenic variants within PAS that were validated using a modified luciferase
reporter vector (mpCHECK2) designed to evaluate polyadenylation in gene
expression [119]. Paggi et al. [120] developed a deep learning-based
computational method to predict mRNA splicing points known as the Long Short-term
memory network Branchpoint Retriever (LaBranchoR). LaBranchoR predictions
identified 106 pathogenic variants affecting mRNA splicing, showing a substantial
overlap of pathogenic variants from ClinVar and the Human Gene Mutation Database
(HGMD) [120]. In contrast, Sample et al. [121] developed Optimus
5-Prime, a CNN trained on data from polysome profiling and RNA-seq, to predict
the effect of 5
Technological advances and reduced costs in DNA sequencing have resulted in an
ever-increasing number of disease/trait-associated variants. This has resulted in
a need to develop innovative computational and experimental strategies to
determine the role and causal mechanisms of non-coding variants in human diseases
and quantitative traits. The first challenge is to select or prioritize from the
existing GWAS variants (
This manuscript aimed to discuss the vast advancements in functional assays to identify causal variants for multiple human diseases and propel collaborations to describe their complete genetic mechanisms. In the future, we believe that these computational and experimental methods will be combined to achieve a genome-wide understanding of the role of SNV in human diseases. For instance, 97% of congenital heart disease (CHD)-associated variants have been mapped within the non-coding genome, including intronic, intergenic, UTRs, and regulatory regions [127, 128, 129, 130, 131, 132]. Elucidating the genome-wide impact of these non-coding variants in complex biological systems, from human cardiomyocytes to CHD patients, will require a combination of methods to assay all levels of genetic regulation. Thus, a combined analysis of high-throughput technology is required to understand the impact of CHD-associated SNVs on chromatin structure (e.g., HiChIP [101]), TF–DNA and TF–cofactor interactions (e.g., CASCADE [46] and SNP-SELEX [47]), gene expression (e.g., MPRA [86] and STARR-seq [88]), RNA processing (e.g., MPRAu [118]), and translation (e.g., PLUMAGE [117]). The findings generated by such an integrative approach can produce crucial data needed to train effective models, which prioritize the functional impact of genomic variants that can be scaled to multiple diseases. Going further, knowing the causal mechanism of pathogenic SNVs is crucial for treating or even curing diseases through gene editing by CRISPR-based methods [133, 134, 135].
Recent advancements have allowed us to understand and identify functional non-coding variants that can play a role in human diseases. Although these mutations occur outside the protein-coding genome, they can impact on phenotype by altering how regulatory proteins, such as TFs and RBP, interact with CREs and dysregulate gene expression. Non-coding variants can impact different stages of gene regulation by affecting (i) chromatin interactions (promoter and enhancer interactomes), (ii) TF affinity for their binding sites, (iii) transcriptional activity of target genes, (iv) post-transcriptional regulation (mRNA stability and splicing), and (v) translation initiation (ribosome recognition).
New methods have been developed to perform high-throughput functional evaluations of variants to determine causal mechanisms linked to human diseases (Table 1, Ref. [43, 44, 45, 46, 47, 82, 86, 88, 89, 101, 103, 104, 106, 113, 114, 115, 116, 117, 118]). Changes in chromatin interaction maps, TF–DNA binding affinity, gene expression, and translation efficiency provide evidence to support the role of many disease-associated variants. However, with the overwhelming and increasing number of variants in the non-coding genome, identifying functional variants remains challenging. Experimental data has been implemented to design computational approaches to predict and identify functional pathogenic variants. Computational pipelines and machine learning tools (SVMs and CNNs) can decipher tissue- and cell-specific patterns to predict variants with functional activity and prioritize in vitro validation (Table 2, Ref. [55, 67, 68, 74, 77, 78, 79, 90, 91, 93, 108, 109, 111, 119, 120, 121]).
| Method | Throughput | Detection | Cell- and tissue-specific | Experiment | Ref | |
| CRE-interactome | PCHi-C | High | Promoter-CRE interactome, target gene | Yes | In vivo (cell line) | [103, 104] |
| ECHi-C | High | Enhancer-CRE interactome | Yes | In vivo (cell line) | [106] | |
| HiChIP | High | Cell-type CRE interactome | Yes | In vivo (cell line) | [101] | |
| TF–DNA binding | BET-seq | High | Binding free energy | No | In vitro | [43] |
| STAMMP | High | Binding affinity | No | In vitro | [44] | |
| HiP-FA | High | Binding affinity and specificity | No | In vitro | [45] | |
| CASCADE | High | Cofactor recruitment by TFs | Yes | In vivo (cell line) | [46] | |
| SNP-SELEX | High | Binding affinity | No | In vitro | [47] | |
| Gene expression | Luciferase reporter assay | Low | Bioluminescence | Yes | In vivo (cell line) | [82] |
| MPRA | High | RNA-seq/flow cytometry | Yes | In vivo (cell line) | [86] | |
| STARR-seq | High | RNA-seq | Yes | In vitro (cell) | [88] | |
| enSERT | High | lacZ staining | Yes | In vivo | [89] | |
| Post-transcriptional regulation | Luciferase reporter assay | Low | Bioluminescence | No | In vivo | [116] |
| Low | Bioluminescence | No | In vitro | [113] | ||
| Minigene splicing assays | Low | RNA-seq | No | In vitro (from patients) | [114] | |
| Patient iPSC WGS | High | RNA-seq | Yes | In vivo | [115] | |
| MPRAu | High | RNA-seq | Yes | In vitro (cells) | [118] | |
| Plumage | High | RNA-seq and bioluminescence | Yes | In vitro | [117] |
PCHi-C, promoter-capture Hi-C; ECHi-C, enhancer-capture Hi-C; HiChIP, Hi-C
library preparation followed by chromatin immunoprecipitation; BET-seq, Binding
Energy Topography by sequencing; STAMMP, simultaneous transcription factor
affinity measurements via microfluidic protein arrays; HiP-FA, high-performance
fluorescence anisotropy; CASCADE, Customizable Approach to Survey Complex
Assembly at DNA Elements; MPRA, massively parallel reporter assays; STARR-seq,
self-transcribing active regulatory region sequencing; iPSC, induced pluripotent
stem cell; WGS, whole-genome sequencing; MPRAu, Massively Parallel Reporter Assay
for 3
| Program | Type | Training data | Prediction | Cell- and tissue-specific | Ref | |
| CRE interactions | DeepHiC | Deep learning | Hi-C | Long-range chromatin interactions | Yes | [108] |
| SnapHiC | Computational pipeline | Hi-C | CRE interactions | Yes | [109] | |
| Arvin | Network-based predictive model | Hi-C, ChIA-PET | GRNs | Yes | [111] | |
| TF–DNA binding | atSNP | Motif-based predictive model | PWMs | TF binding | No | [55] |
| SEMpl | Computational pipeline | ChIP-seq, DNase-seq, PWMs | TF binding | No | [67] | |
| ANANASTRA | Computational pipeline | ChIP-seq, PWMs, rs-IDs, eQTL | TF binding | Yes | [68] | |
| deltaSVM | SVM | ATAC-seq | TF binding | Yes | [74] | |
| DeepFun/AgentBind | Deep neural networks | ChIP-seq, DNase-seq | TF binding | Yes | [77, 78] | |
| DeFine | CNN | ChIP-seq, Hi-C | TF binding, mapped gene | Yes | [79] | |
| Gene expression | PO-EN | Semi-supervised model | MPRA | Enhancer activity | Yes | [90] |
| SURF | Deep learning | DNase-seq, ChIP-seq, MPRA | Gene expression, TF binding | Yes | [91] | |
| MPRA-DragoNN | CNN | MPRA | Gene expression | Yes | [93] | |
| Post-transcriptional regulation | Variant PAS Pipeline | Computational pipeline | Polyadenylation maps | PAS variants | No | [119] |
| LaBranchoR | Deep learning | Splicing branchpoints | mRNA splicing points | No | [120] | |
| Optimus 5-prime | CNN | Polysome profiling, RNA-seq | Ribosome loading, gene expression | No | [121] |
SnapHiC, Single-Nucleus Analysis Pipeline for Hi-C; SEMpl, SNP effect matrix pipeline; PO-EN, presence-only with elastic net penalty; SURF, Score of Unified Regulatory Feature; PAS, polyadenylation sites; SVM, support vector machine; CNN, convolutional neural networks; PWMs, position weight matrices.
Despite all the progress in understanding the role of disease-associated variants within the non-coding regulatory genome, determining causality remains challenging. We hypothesize that the number of regulatory variants will continue to increase significantly while the molecular mechanisms of most reported variants remain unknown. The increased throughput and ability to functionally validate disease-associated non-coding variants will contribute to the rapid development of diagnostic methods and treatments for these diseases.
EGPM conceptualized the work, wrote of the original draft, and reviewed the final manuscript. JARM conceptualized the work and reviewed and edited the final manuscript. Both authors have participated sufficiently in the work to take public responsibility for appropriate portions of the content and agreed to be accountable for all aspects of the work in ensuring that questions related to its accuracy or integrity. Both authors read and approved the final manuscript. Both authors contributed to editorial changes in the manuscript.
Not applicable.
We would like to give special thanks to Yamil Miranda-Negron for his support during the preparation of the manuscript and revisions. We also thank Diego Pomales-Matos, Leandro Sanabria-Alberto, Alejandro Rivera-Madera, Jean L. Messon-Bird, Adriana C. Barreiro-Rosario, and Jeancarlos Rivera-Del Valle for their support during the preparation of the manuscript.
This project was supported by NIH-SC1GM127231. EGPM was funded by the NIH RISE Fellowship (5R25GM061151-20) and the NSF BioXFEL Fellowship (STC-1231306).
The authors declare no conflict of interest.
References
Publisher’s Note: IMR Press stays neutral with regard to jurisdictional claims in published maps and institutional affiliations.