
- Academic Editor
Background: The extracellular matrix (ECM) modeling induced by the metalloproteinases is a vital characteristic for tumor progression. Previous studies mainly focus on the functions of two subgroups of metalloproteinases: matrix metalloproteinases (MMPs) and a disintegrin and metalloproteases (ADAMs) in tumors. The roles of another important group: the ADAMs with thrombospondin motifs (ADAMTS) remain unclear. This study aimed to perform a pan-cancer analysis of procollagen N-propeptidase subgroup of ADAMTS (PNPSA). Methods: We systematically analyzed expression landscape, genomic variations, prognostic value, and cell expression clusters of PNPSA in pan-cancer based on the multiple integrated open databases. Besides, we also analyzed the impacts of expressions and genomic variations of PNPSA members on tumor immune microenvironment (TIME) and immune-related molecules in pan-cancer based on the immune-related open databases. The Gene Set Variation Analysis (GSVA) was performed to evaluate the associations of the whole PNPSA with prognosis, tumor indicators, TIME, and drug sensitivities. Meanwhile, the Kyoto Encyclopedia of Genes and Genomes (KEGG) was performed to reveal related signaling pathways. Finally, immunohistochemical staining was used to validate the differential analysis results. Results: We found a dual prognostic role of PNPSA members in pan-cancer and they were significantly correlated with TIME and immune-related molecules. Interestingly, the copy number variations (CNVs) of all PNPSA members were revealed to be negatively correlated with NK cell infiltration in most cancers. Single-cell sequencing analysis reveals expressions of PNPSA gene family members on some specific tumor and immune cells in addition to the fibroblasts. The GSVA score was found to have some predictive value for survival status in Brain Lower Grade Glioma (LGG), Mesothelioma (MESO), and Uveal Melanoma (UVM) and to be significantly correlated with tumorigenesis-related pathways such as PI3K-Akt, AGE-RAGE, etc. The GSVA score also shows some predictive value for chemotherapy and immunotherapy efficacy in some tumors. Conclusions: PNPSA was correlated with tumor development and might be potential tumor biomarker and therapeutic target.
The extracellular matrix (ECM) is a complex molecular network that surrounds cells within tissues and provides structural support for maintaining tissue integrity. The major ECM components include collagens, glycoproteins and proteoglycans. The balanced synthesis and degradation of ECM components is thought to be crucial for normal tissue homeostasis. However, this homeostasis becomes highly dysregulated during tumorigenesis due to various factors [1]. The disequilibrium of ECM components can cause additional ECM remodeling in the microenvironment of solid tumors. This remodeled ECM interacts with neighboring cells and activates diverse signaling pathways to promote tumor growth.
ECM remodeling can be induced by various metalloproteinases, including matrix metalloproteinases (MMPs), a disintegrin and metalloproteases (ADAMs), and ADAMs with thrombospondin motifs (ADAMTS) [2, 3]. MMPs are the major class of ECM-degrading protease and have been widely studied in cancer. ADAMs are transmembrane proteins with proteolytic activity that have recently been shown to regulate the shedding of membrane-bound proteins, growth factors, cytokines, ligands, and receptors. ADAMTS is a unique and novel family of secreted enzymes with characteristic thrombospondin motifs [4]. Studies on the role of ADAMTS in tumorigenesis and the tumor immune microenvironment (TIME) are still quite rare compared with studies on MMPs and ADAMs [3].
Previous studies reported that ADAMTS family members regulate angiogenesis and cell adhesion, proliferation and interaction with the ECM [5]. Moreover, the functional sites for some matricellular proteins are released following proteolytic cleavage by ADAMTS and subsequently serve as mediators of cell–cell and cell–matrix interactions in cancer [6]. The ADAMTS family can be divided into several subgroups according to their substrates. Amongst these is the procollagen N-propeptidase subgroup (PNPS), which includes ADAMTS2, ADAMTS3 and ADAMTS14. Unlike other metalloproteinases involved mainly in ECM degradation, PNPS are essential for ECM collagen formation and maturation and their elevated expression can significantly increase ECM stiffness [7]. Therefore, the PNPS of ADAMTS members (PNPSA) can influence ECM remodeling in cancer by altering ECM stiffness [7].
PNPSA members may play vital roles in tumor development. First, high expression
levels of the PNPSA family can lead to the accumulation of collagen fibrils and
increased matrix stiffness. This in turn induces cellular mechanical signals that
promote the rapid proliferation of tumor cells [2]. Second, PNPSA-induced ECM
stiffening can promote tumor metastasis through various mechanisms. For example,
phosphorylation of the ephrin receptor EPHA2 by matrix stiffening leads to LYN
kinase-mediated Twist1 phosphorylation and nuclear translocation, thereby
promoting epithelial-mesenchymal transition (EMT) and tumor cell metastasis [8].
Third, ECM stiffening can promote EMT-related cancer drug resistance [9].
Moreover, some previous studies have reported that ECM stiffening decreased the
sensitivity of hepatocellular carcinoma and ovarian cancer cells to platinum
therapy through integrin-, FAK-, Akt-, STAT3-, and YAP-dependent mechanisms [10, 11]. Fourth, ECM stiffening-related mechanical signaling through the integrin
receptor may activate TGF
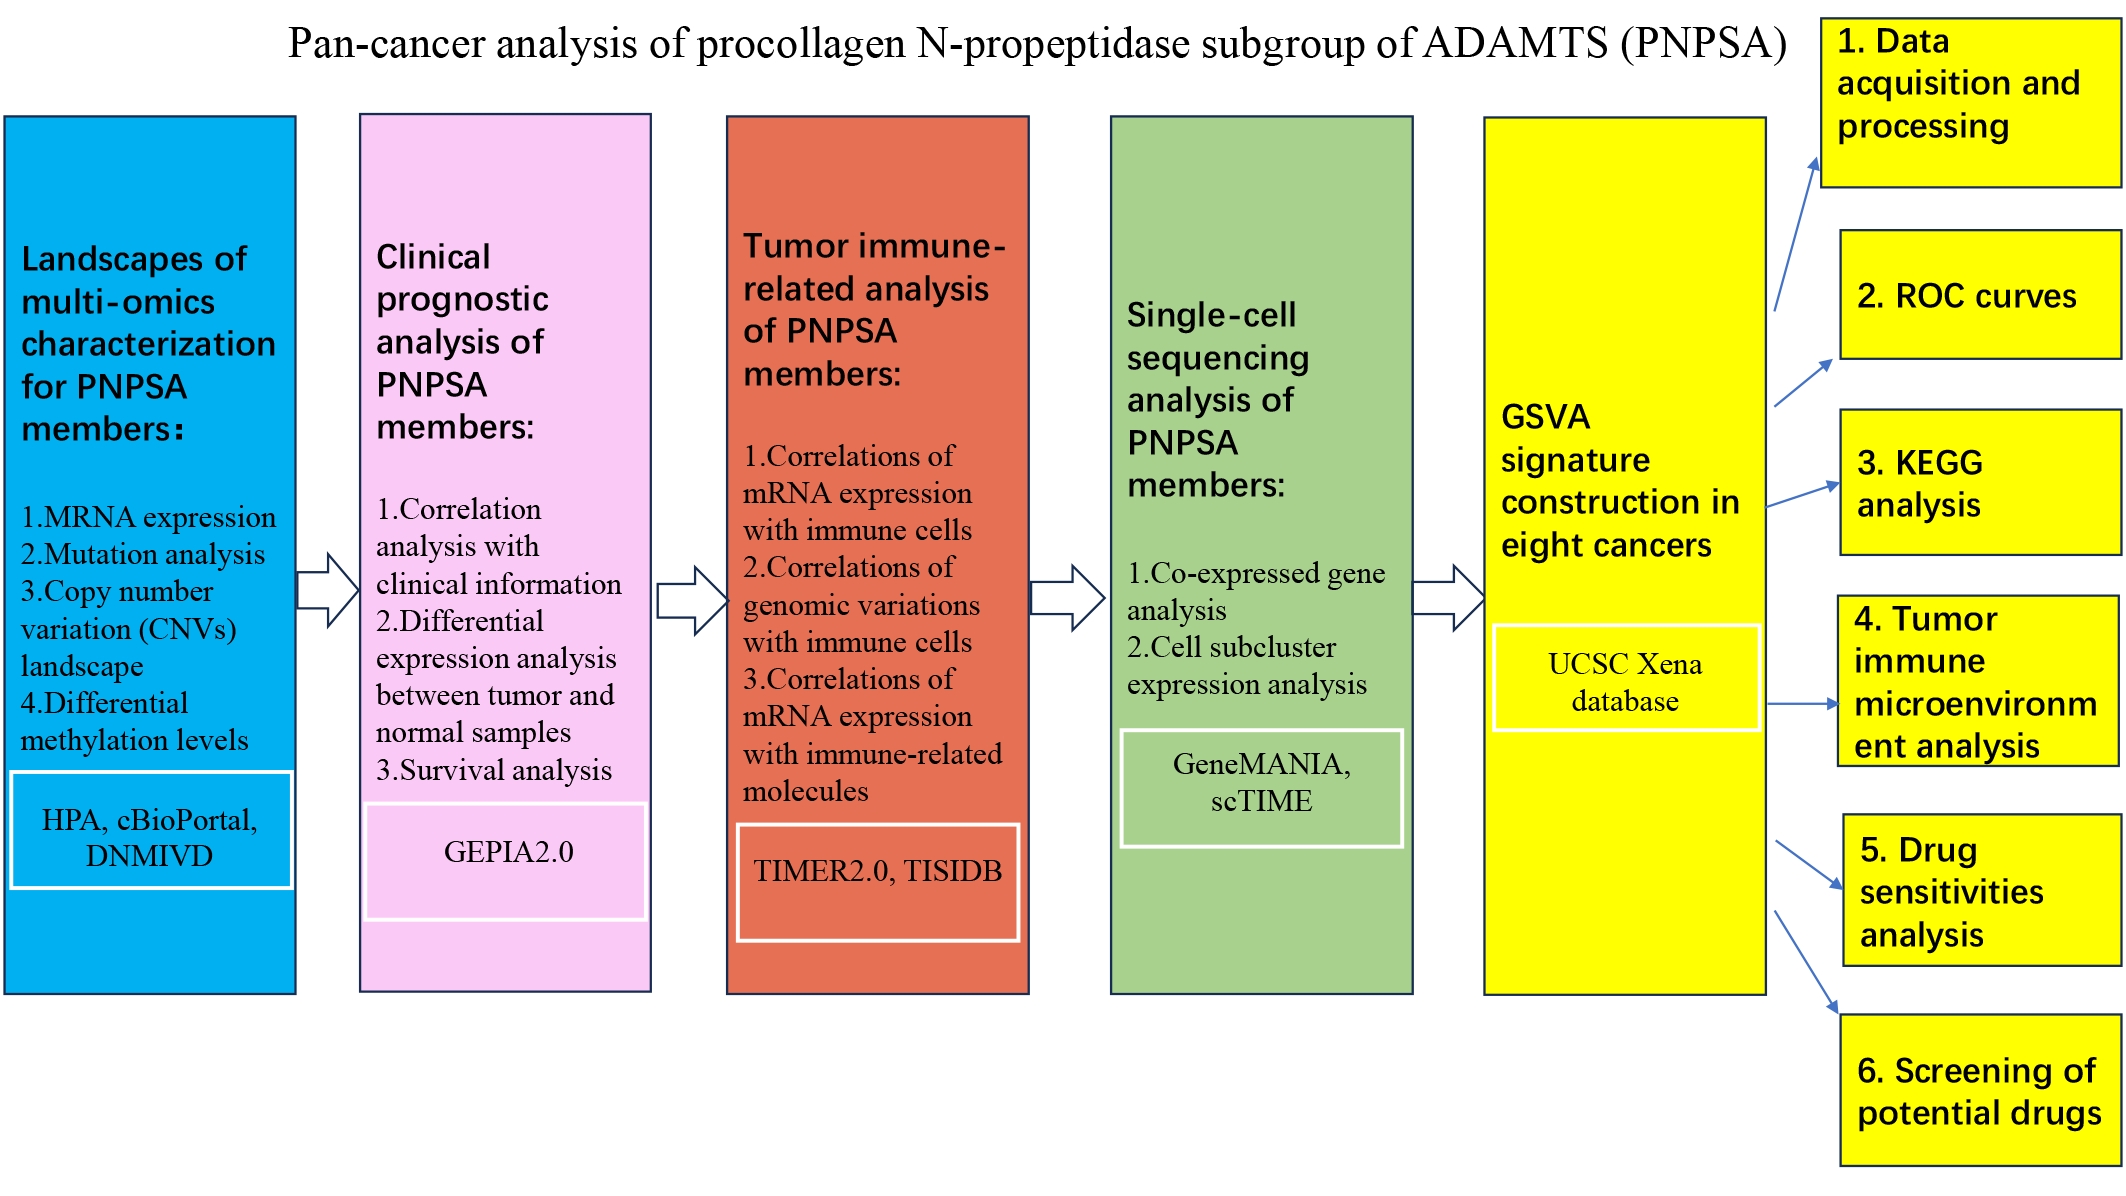 Fig. 1.
The workflow of the whole study. ADAMTS, ADAMs with thrombospondin motifs; PNPSA, procollagen N-propeptidase subgroup of ADAMTS; HPA, Human Protein Atlas; DNMIVD, DNA Methylation Interactive Visualization Database; GEPIA, Gene Expression Profiling Interactive Analysis; TIMER, Tumor Immune Estimation Resource; scTIME, single-cell tumor immune microenvironment; ROC, receiver operating characteristic; GSVA, Gene Set Variation Analysis; KEGG, Kyoto Encyclopedia of Genes and Genomes.
Transcriptomics and proteomics methods were used in the Human Protein Atlas (HPA) database to quantify gene expression in normal and tumor tissues [14, 15]. The HPA database was used to evaluate the expression of the PNPSA gene family (ADAMTS2, ADAMTS3, ADAMTS14) in pan-cancer. GEPIA2 is an updated version of the Gene Expression Profiling Interactive Analysis (GEPIA) database and provides insights into gene expression based on The Cancer Genome Atlas (TCGA, https://www.cancer.gov/ccg/research/genome-sequencing/tcga) and the Genotype-Tissue Expression Project (GTEx) databases (https://www.gtexportal.org/home/) [16]. We used the GEPIA2 database (http://gepia2.cancer-pku.cn) for differential expression analysis, tumor stage comparisons, and prognostic analysis. The cBioPortal database (https://www.cbioportal.org) is an open platform for exploring multidimensional cancer genomics data such as gene mutations and copy number variations (CNVs) [17]. It was used here to investigate PNPSA mutations and CNV landscapes across 27 common cancer types. The DNA Methylation Interactive Visualization Database (DNMIVD, http://119.3.41.228/dnmivd/) contains a large amount of DNA methylation data from the TCGA cohort and was used here to conduct differential methylation analysis of the TCGA pan-cancer data [18]. The Tumor Immune Estimation Resource (TIMER) 2.0 (http://timer.cistrome.org/) and the TISIDB databases (http://cis.hku.hk/TISIDB/) are two open platforms based on the TCGA cohorts that reveal associations between gene profiles and the immune landscape [19, 20]. The TIMER database was used in this study to examine the influence of PNPSA gene family expression and variation profiles on immune cell infiltration. The TISIDB database was used to explore associations between PNPSA expression and immune-related molecules [20]. We used the GeneMANIA database (https://genemania.org) to study the interaction network for genes co-expressed with PNPSA [21]. Finally, the single-cell tumor immune microenvironment (scTIME) portal database (http://sctime.sklehabc.com/#/home) is an online tool that reveals the tumor microenvironment landscape at the single-cell level. It was used to identify cell subpopulations with significant PNPSA gene expression [22]. The corresponding full names of tumor abbreviations from the TCGA database are shown in Supplementary Table 1.
Gene expression data for 8 cancer types in which prognosis was significantly correlated with the PNPSA gene family were downloaded from the UCSC Xena database [23]. These were Cervical squamous cell carcinoma and endocervical adenocarcinoma (CESC), Colon adenocarcinoma (COAD), Glioblastoma multiforme (GBM), Kidney renal clear cell carcinoma (KIRC), Brain Lower Grade Glioma (LGG), Mesothelioma (MESO), Uterine Corpus Endometrial Carcinoma (UCEC), and Uveal Melanoma (UVM). Paracancerous tissue samples were first deleted and the Ensemble gene IDs were then transformed into official gene symbols. Subsequently, any duplicate gene symbols were deleted and the one with the highest average expression across all samples was kept in order to maximize the gene expression information for these cancers. Raw FPKM data was normalized by log2(FPKM+1) to avoid the influence of any extreme expression values. Patients with incomplete clinical information were excluded, and samples with complete follow-up information on patient survival were retained for later analysis.
GSVA is a bioinformatics method for converting the gene expression matrix into a gene set or pathway expression matrix for evaluating the degree of enrichment for the entire gene set [24]. Specifically, Kernel estimation of the cumulative density function (KCDF) is performed first. The genes are subsequently ranked by CDF score and divided into two sets: in-gene set (target gene set) and out-of-gene set. Kolmogorov-Smirnov-like rank statistics and distributions are then calculated. Finally, the sum of the maximum spacing between two distributions represents the GSVA score for the target gene set [24]. To quantify the activity of the entire PNPSA gene family, we calculated the corresponding enrichment scores of each sample in 8 specific cancer types by GSVA based on ADAMTS2, ADAMTS3, and ADAMTS14 gene expression. GSVA was performed using the gsva function of the GSVA R package [24]. Because the RNA-seq data was normalized, the ‘kcdf = Gaussian’ and ‘method = gsva’ were selected as appropriate parameters in GSVA R package.
Survival data for pan-cancer samples was obtained from the UCSC Xena database and matched with the gene expression data [23]. The receiver operating characteristic (ROC) curve method estimates the predictive value of specific variables by setting several different critical values for continuous variables and then calculating the corresponding sensitivities and specificities for outcome events. A curve is subsequently plotted with sensitivity as the vertical coordinate and (1 - specificity) as the horizontal coordinate. The area under the ROC curve is called the AUC value and represents the predictive value [25]. To evaluate the predictive power of the entire PNPSA gene family for survival in pan-cancer, ROC curves of the GSVA score were drawn for CESC, COAD, GBM, KIRC, LGG, MESO, UCEC, and UVM using the timeROC package. The parameters were set as follows: ‘weighting = marginal’ to compute the weights, ‘cause = 1’ to represent the outcome event, and ‘times = c (12, 36, 60)’ to identify time points.
Spearman correlation analysis between the GSVA score and gene expression was
performed with the cor and cor.test functions of R software (version 4.2.2,
https://www.r-project.org/). r
The ESTIMATE algorithm is a method for estimating stromal and immune composition based on gene expression data. This algorithm identifies specific signatures related to the infiltration of stromal and immune cells from the major non-tumor constituents present in tumor tissue. Stromal and immune scores then predict the levels of infiltrating stromal and immune cells, respectively, and are calculated based on single-sample gene set enrichment analysis (ssGSEA) [29]. The stromal and immune infiltration scores were calculated by the estimate R package from RNA sequencing data and reflect the relative amounts of stromal and immune components, respectively [29]. Correlation analysis between the GSVA score and these two scores was performed in the 8 cancer types using the cor and cor.test functions in R software. To reveal the TIME landscape of these cancers, the infiltration levels of 22 specific immune cell types were calculated with the cibersort algorithm based on the CIBERSORTx database. Correlation analysis between the GSVA score and the immune cell infiltration levels was conducted with the cor and cor.test functions in R software.
The human stem cell reference dataset was downloaded using the synapser R package. The gelnet function of the gelnet R package was used to construct a predictive model to calculate the mRNAsi [30]. Specifically, RNA expression data for human stem cells was obtained from the synapser R package, and a predictive model for stem cells was constructed based on this data. The model was then used to estimate the similarity with stem cells and to calculate the mRNAsi based on our datasets. Somatic mutation data for the 8 cancer types (based on the Muse algorithm) was downloaded from the UCSC Xena database [23]. The maftools R package was used to calculate the TMB scores for these cancer types [31]. The MSI score for every sample in pan-cancer was obtained from a previous study [32]. The cor and the cor.test functions in R software were used to perform Spearman correlation analysis between the GSVA score and the common tumor indicator indexes (mRNAsi, TMB, and MSI scores).
To study the predictive value of the PNPSA gene family for sensitivity to common chemotherapy drugs, the oncoPredict R package was used to estimate the IC50 of 5-fluorouracil, cisplatin, irinotecan, docetaxel, paclitaxel, and gemcitabine in pan-cancer [33]. Reference IC50 datasets were obtained from the Genomics of Drug Sensitivity in Cancer (GDSC) database. The oncoPredict R package is able to extract experimental results for the drug sensitivities of cell lines and the corresponding gene expression matrix. OncoPredict R then constructs a predictive model that associates mRNA expression with drug sensitivity. Finally, it was used to predict the IC50 of 5-fluorouracil, cisplatin, irinotecan, docetaxel, paclitaxel, and gemcitabine for 8 specific cancer types based on their mRNA expression results in the UCSC database [33]. Correlation analysis between the GSVA score and IC50 was performed by R software and the results visualized with the corrplot R package. The Tumor Immune Dysfunction and Exclusion (TIDE) database is an open platform for the prediction of immune dysfunction and the efficacy of immunotherapy [34]. In the current study, the TIDE score obtained from the TIDE database was used as a predictive marker for the efficacy of immunotherapy in pan-cancer.
This study was approved by the Ethics Committee at the First Affiliated Hospital of Chongqing Medical University (approval No. 2020-049). Sections of tumor and corresponding paracancerous tissue from KIRC, Esophageal carcinoma (ESCA), Stomach adenocarcinoma (STAD), Liver hepatocellular carcinoma (LIHC), CESC, and Pancreatic adenocarcinoma (PAAD) were obtained from the First Affiliated Hospital of Chongqing Medical University. Xylene and absolute alcohol was used to dewax and dehydrate sections, and citrate antigen retrieval buffer (pH = 6.0) was then used for antigen retrieval in a microwave. Sections were subsequently placed into a 3% hydrogen peroxide solution and incubated for 25 min at room temperature in the dark to block endogenous peroxidase. They were then placed in PBS (pH = 7.4) and washed three times on a shaking table for 5 min each. A 3% BSA solution was added to cover the tissue, and the sections incubated for 30 min at room temperature. After washing off the blocking solution, diluted anti-ADAMTS2 antibody was added to the KIRC, ESCA, STAD, PAAD, LIHC, and CESC tissue sections. Diluted anti-ADAMTS14 antibody was also added to PAAD tissue sections. All sections were then placed in a wet box and incubated overnight at 4 °C. The next day, the corresponding secondary antibody was added and the sections incubated at room temperature for 50 min. They were then placed in PBS (pH = 7.4) and washed three times for 5 min each on a decolorizing shaker. Freshly prepared DAB dye solution was added dropwise and the staining visualized by microscopy. Hematoxylin was then used to counterstain cells, and SlideViewer software for recording final images. The IHC Profiler in ImageJ (version 1.54d, LOCI, University of Wisconsin, Madison, WI, USA) infers the degree of staining (high positive, positive, low positive, and negative) in immunohistochemically stained sections. Six views each of tumor and paracancerous tissue were selected randomly for analysis. IHC Profiler was then used to score and record the staining in tumor and corresponding paracancerous tissues from KIRC, ESCA, STAD, LIHC, CESC, and PAAD.
The BindingDB database stores interaction information between protein targets and compounds obtained from various literature and experimental data. Potential chemical compounds that target the PNPSA family were identified from this database (https://www.bindingdb.org/bind/index.jsp). The ADMETab 2.0 database (https://admetmesh.scbdd.com) can be used to calculate and predict various drug-likeness characteristics, including absorption, distribution, metabolism, excretion and toxicity [35]. This database was used to screen potential drugs from the chemical compounds according to drug-likeness characteristics. Interactions between PNPSA family members and the screened compounds were further verified using Autodock Vina for molecular docking. Briefly, the 3D structures of PNPSA members were downloaded from the UniProt database (https://www.uniprot.org). Autodock Tools software was then used to export PNPSA members as the receptor proteins, and the compounds as ligands. Finally, AutoDock Vina software was used to simulate the molecular docking, and PYMOL software to visualize the docking results [36, 37].
Differences between groups were compared with the t-test. All
correlation analyses were conducted using the Spearman or Pearson method with R
4.2.2 software. A p-value
The pattern of mRNA expression for the PNPSA gene family in pan-cancer was analyzed with the HPA database (Fig. 2A–C). The highest expression of ADAMTS2 mRNA was observed in pancreatic cancer, but a high level of expression was also found in head and neck, stomach, and breast cancers (Fig. 2A). Glioma, thyroid cancer, liver cancer, and prostate cancer expressed very low levels of ADAMTS2 (Fig. 2A). ADAMTS3 mRNA was expressed less abundantly in tumor tissue compared to ADAMTS2. The expression of ADAMTS3 was highest in glioma, renal cancer, prostate cancer, and testicular cancer, but hardly expressed in the other cancer types studied here (Fig. 2B). ADAMTS14 mRNA expression was highest in pancreatic cancer (Fig. 2C), with most cancer types showing some expression except for liver and prostate cancer. Of note, the expression levels of ADAMTS2 and ADAMTS14 appeared to show a stable ratio in pan-cancer (Fig. 2A,C). This observation suggests that ADAMTS14 may interact with ADAMTS2 to form a complex, although further verification is needed.
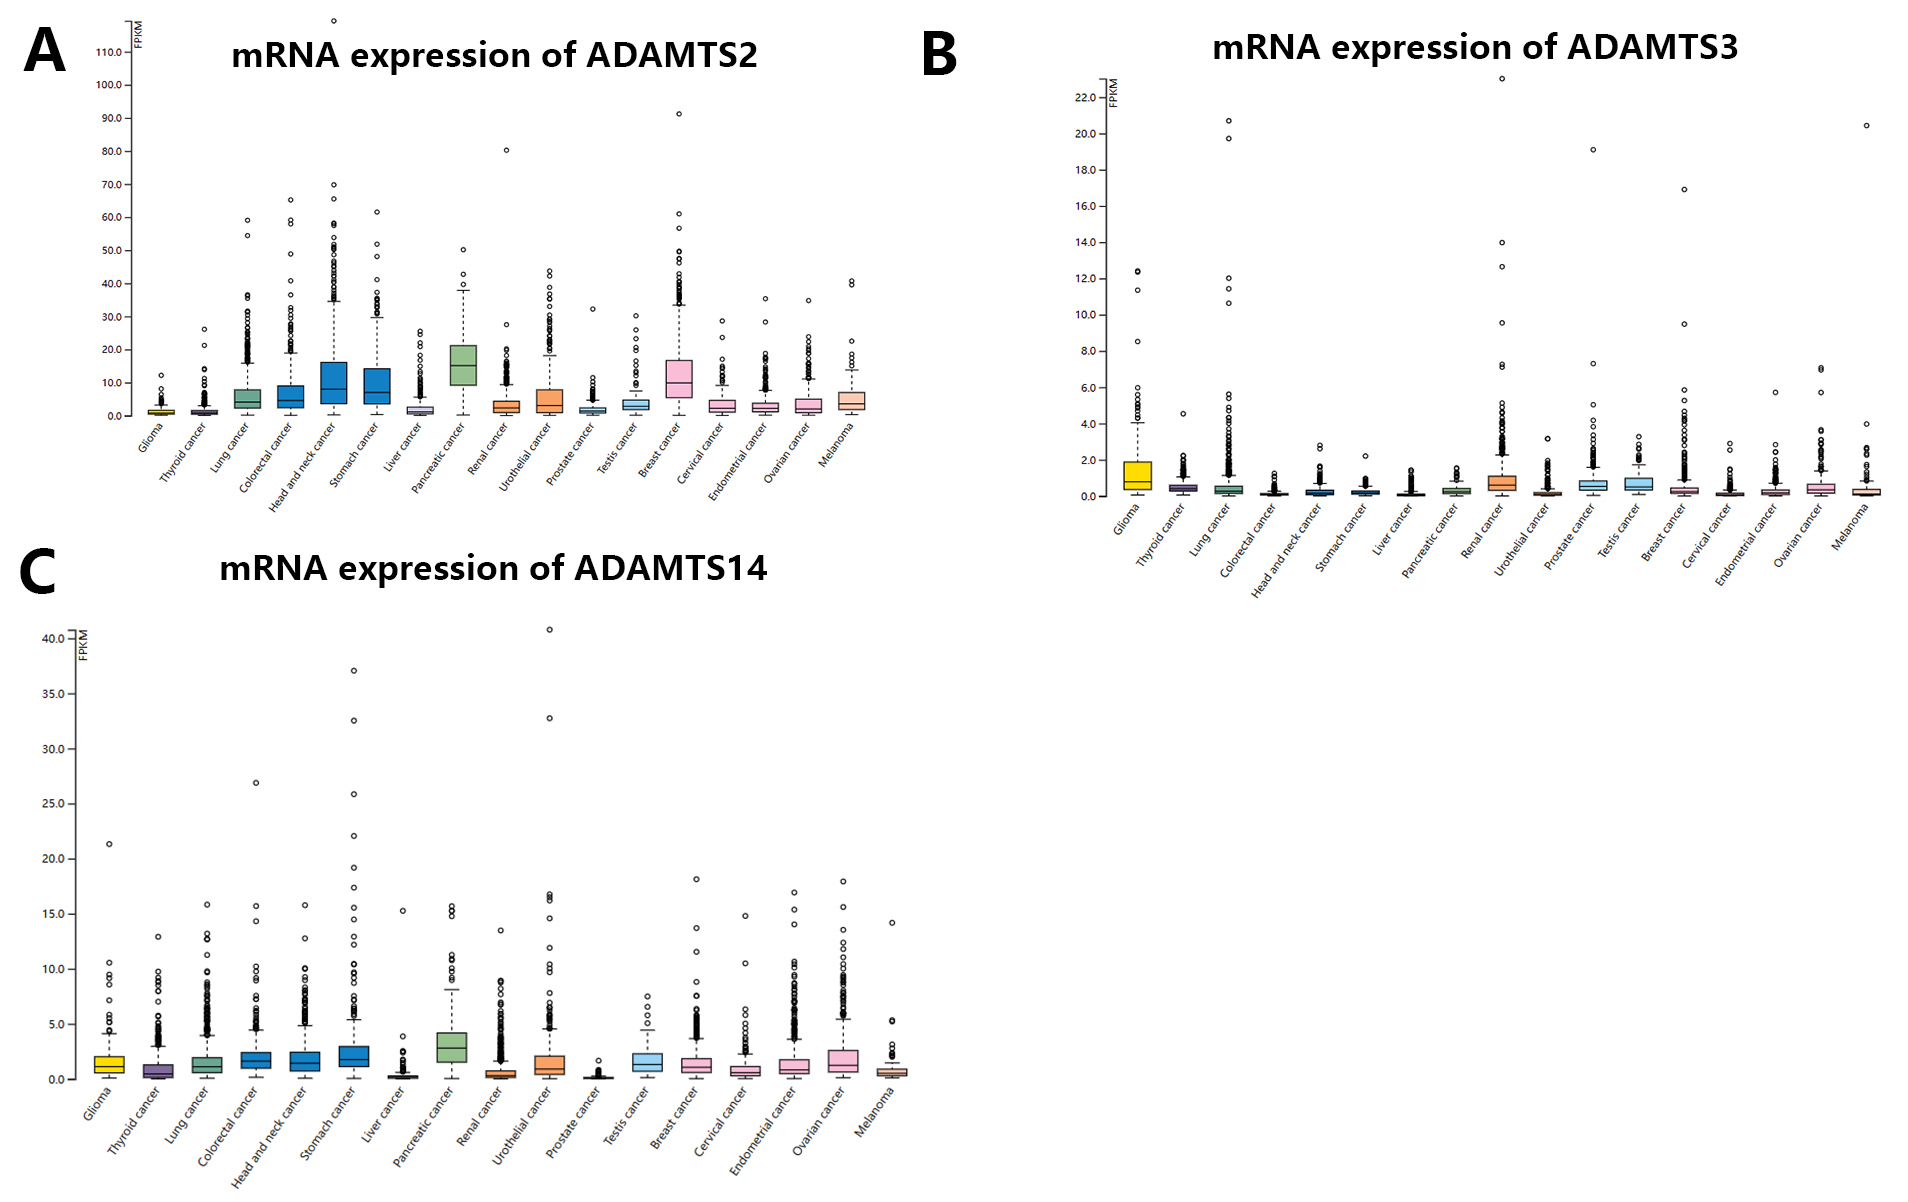 Fig. 2.
mRNA expression distribution of PNPSA gene family members in pan-cancer. (A) MRNA expression distribution of ADAMTS2 in pan-cancer. (B) MRNA expression distribution of ADAMTS3 in pan-cancer. (C) MRNA expression distribution of ADAMTS14 in pan-cancer. PNPSA, Procollagen N-propeptidase subgroup of ADAMTS.
Fig. 3A–F shows the results of the mutation analysis and CNV landscape for the PNPSA gene family derived from the cBioPortal database. Overall, mutations were uncommon, with only about half of the pan-cancers having mutations. The highest mutation frequency was 12%, and mutation frequencies for ADAMTS2, ADAMTS3, and ADAMTS14 were similarly high in lung and colorectal cancers (Fig. 3A–C). PNPSA members might therefore predict poor prognosis for colorectal and lung cancer patients, and treatment strategies that target these genes may not be effective.
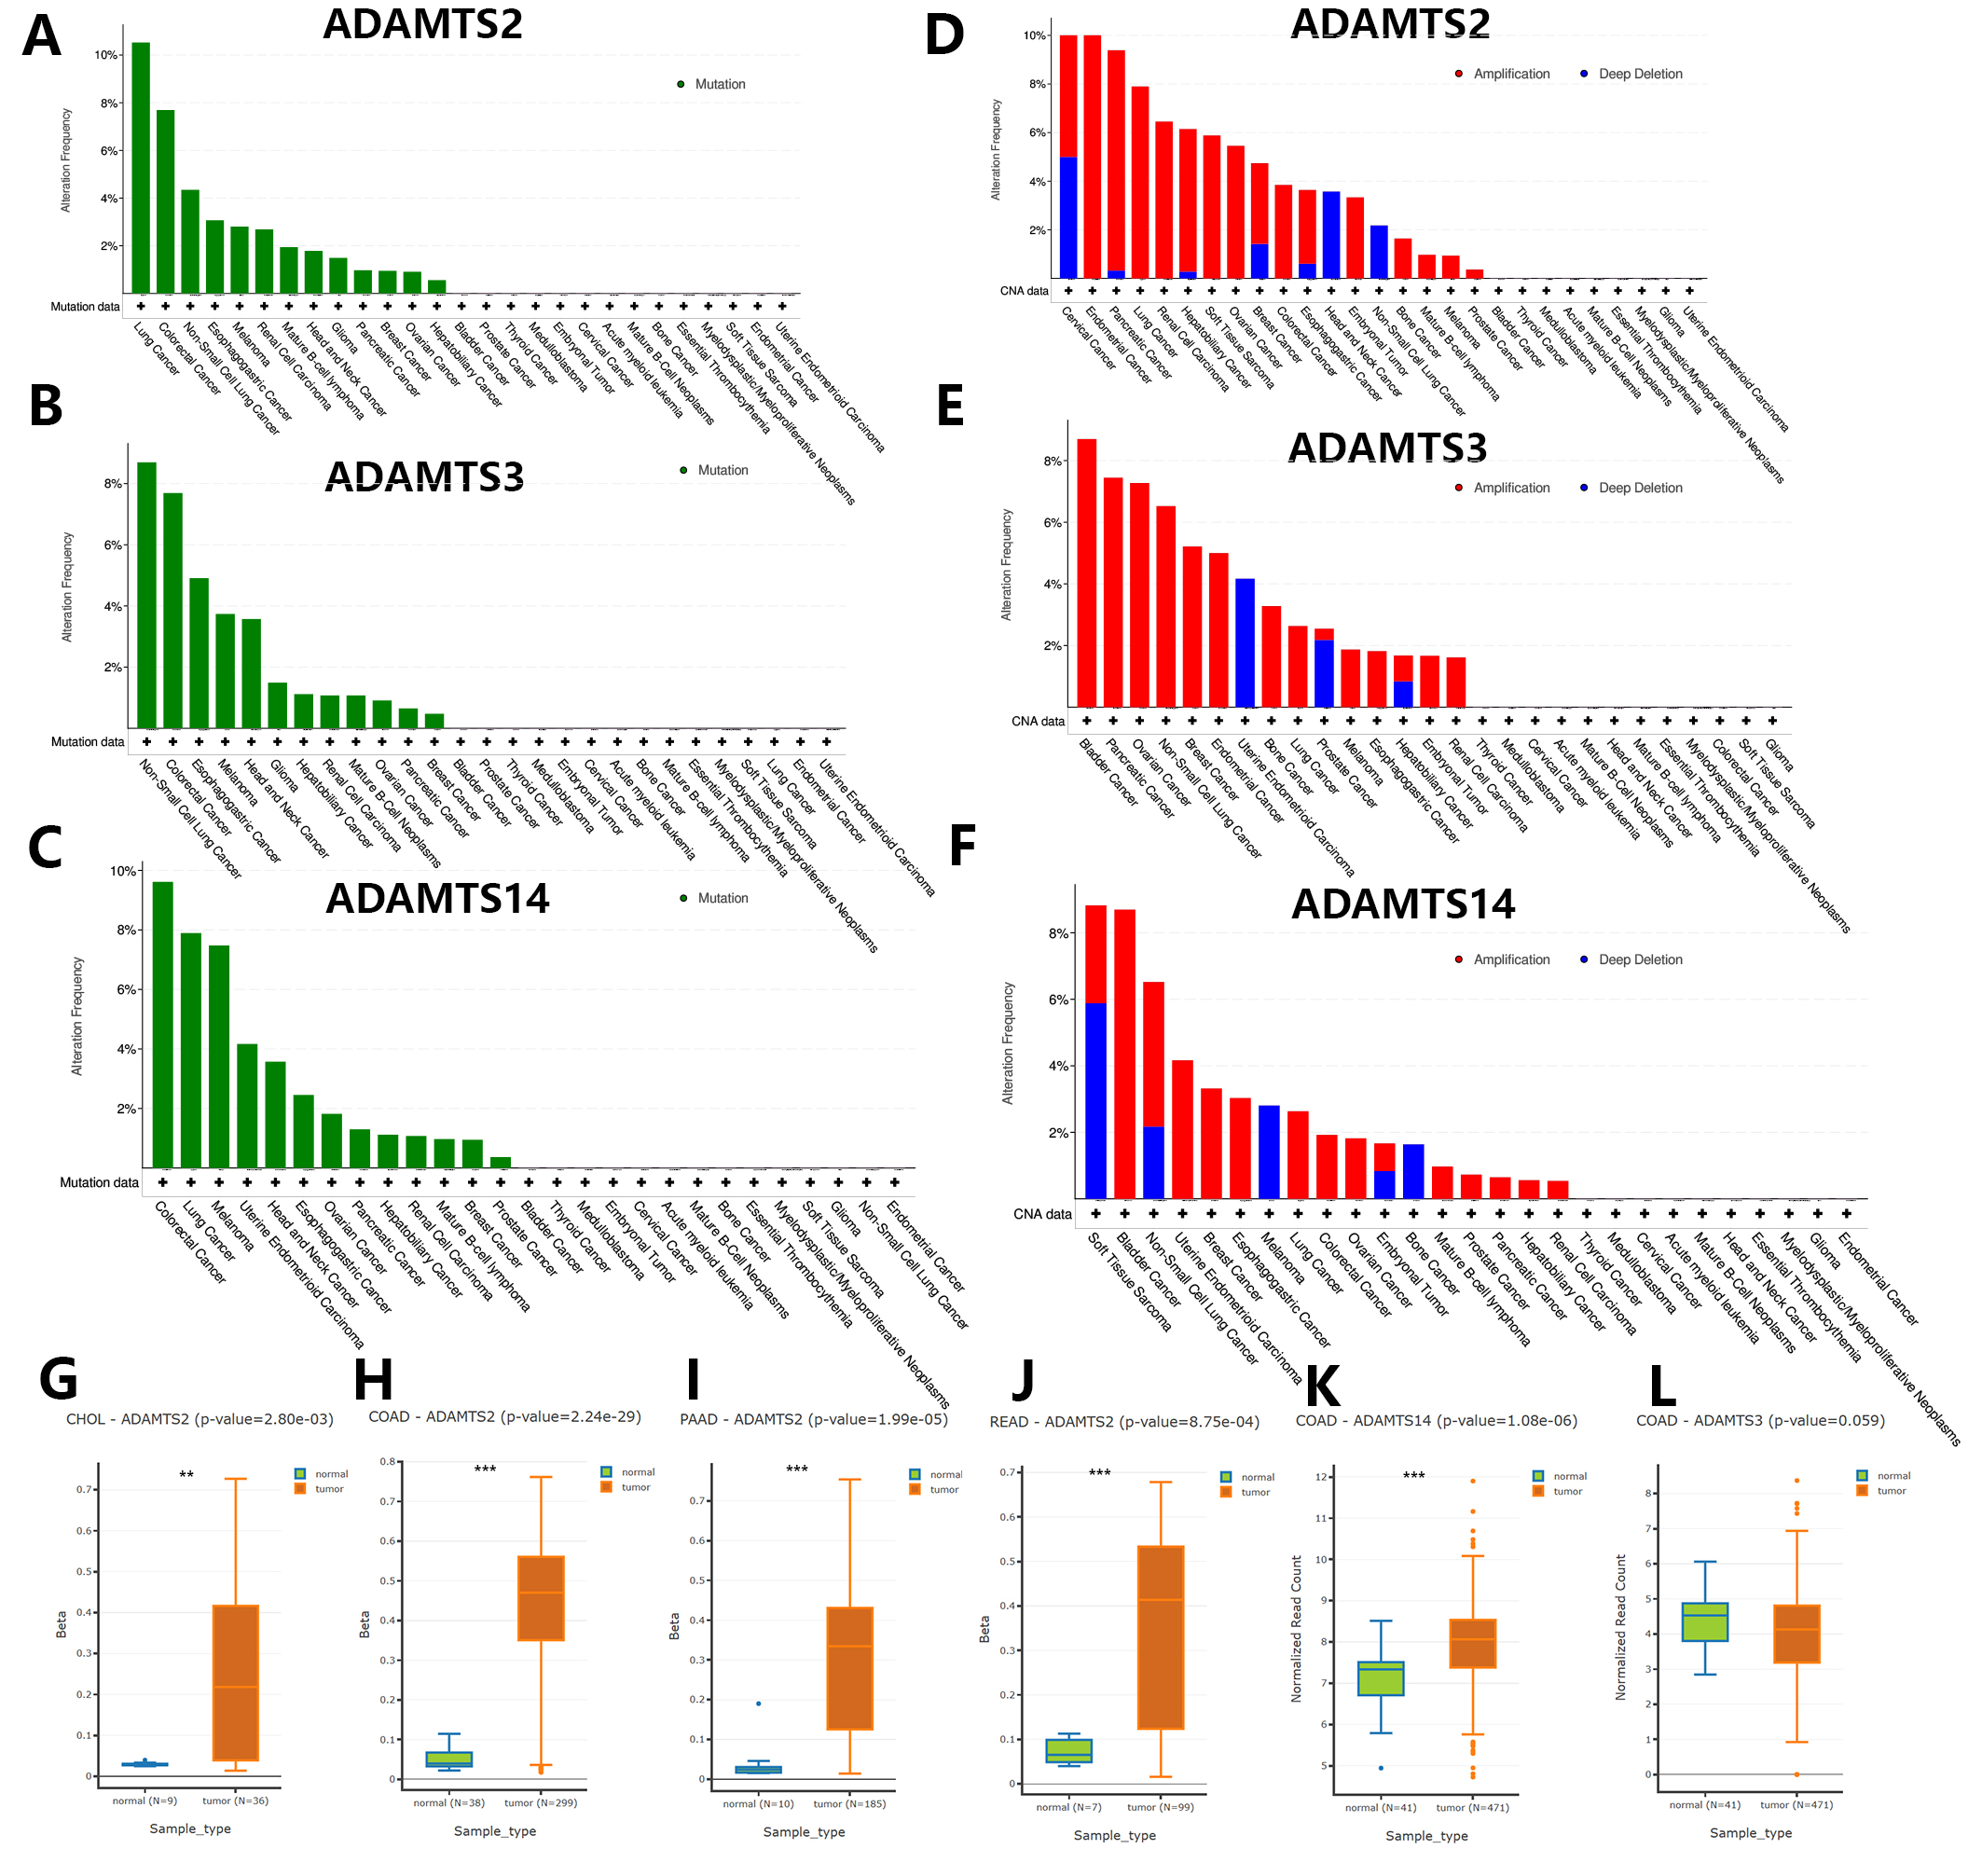 Fig. 3.
Genomic variations landscape and differential DNA
methylation analysis in pan-cancer based on the cBioPortal and DNMIVD databases.
(A–C) Gene mutation analysis of ADAMTS2, ADAMTS3, and ADAMTS14. (D–F) Copy
number variations analysis of ADAMTS2, ADAMTS3, and ADAMTS14 in pan-cancer.
(G–L) Cancers with significantly differential DNA methylation levels of PNPSA
gene family members. Definition of differentially methylated genes:
CNVs in the PNPSA gene family were more commonly observed than gene mutations in pan-cancer (Fig. 3D–F). CNVs in ADAMTS2 were most frequent in cervical and endometrial cancer (Fig. 3D), while in ADAMTS3 they were most frequent in bladder cancer (Fig. 3E) and in ADAMTS14 they were most frequent in soft tissue sarcoma (Fig. 3F). Therefore, inhibition of the corresponding gene in these tumors may result in a better treatment effect.
The analysis of differential DNA methylation was performed using the DNMIVD
database. The definition of differentially methylated genes was:
Prognostic analysis of the PNPSA gene family was conducted based on the GEPIA2.0 database. Different expressions levels for ADAMTS2, ADAMTS3, and ADAMTS14 were found at different tumor stages in all 31 TCGA cancer types (Fig. 4A–C). Moreover, the expression levels of ADAMTS2 and ADAMTS14 were positively correlated with tumor stage (Fig. 4A,C). Differences in ADAMTS2 expression according to tumor stage were observed in Bladder Urothelial Carcinoma (BLCA), ESCA, Kidney Chromophobe (KICH), Kidney renal papillary cell carcinoma (KIRP), Lung squamous cell carcinoma (LUSC), STAD, and Thyroid carcinoma (THCA) (Supplementary Fig. 1A–G). ADAMTS3 expression was significantly correlated with tumor stage in BLCA, Head and Neck squamous cell carcinoma (HNSC), THCA, and UCEC (Supplementary Fig. 1H–K), while ADAMTS14 expression was significantly correlated with tumor stage in BLCA, CHOL, KICH, KIRC, LUSC, Testicular Germ Cell Tumors (TGCT), and THCA (Supplementary Fig. 1L–R). Therefore, mRNA expression of the PNPSA family could be a potential biomarker of tumor stage in these cancer types.
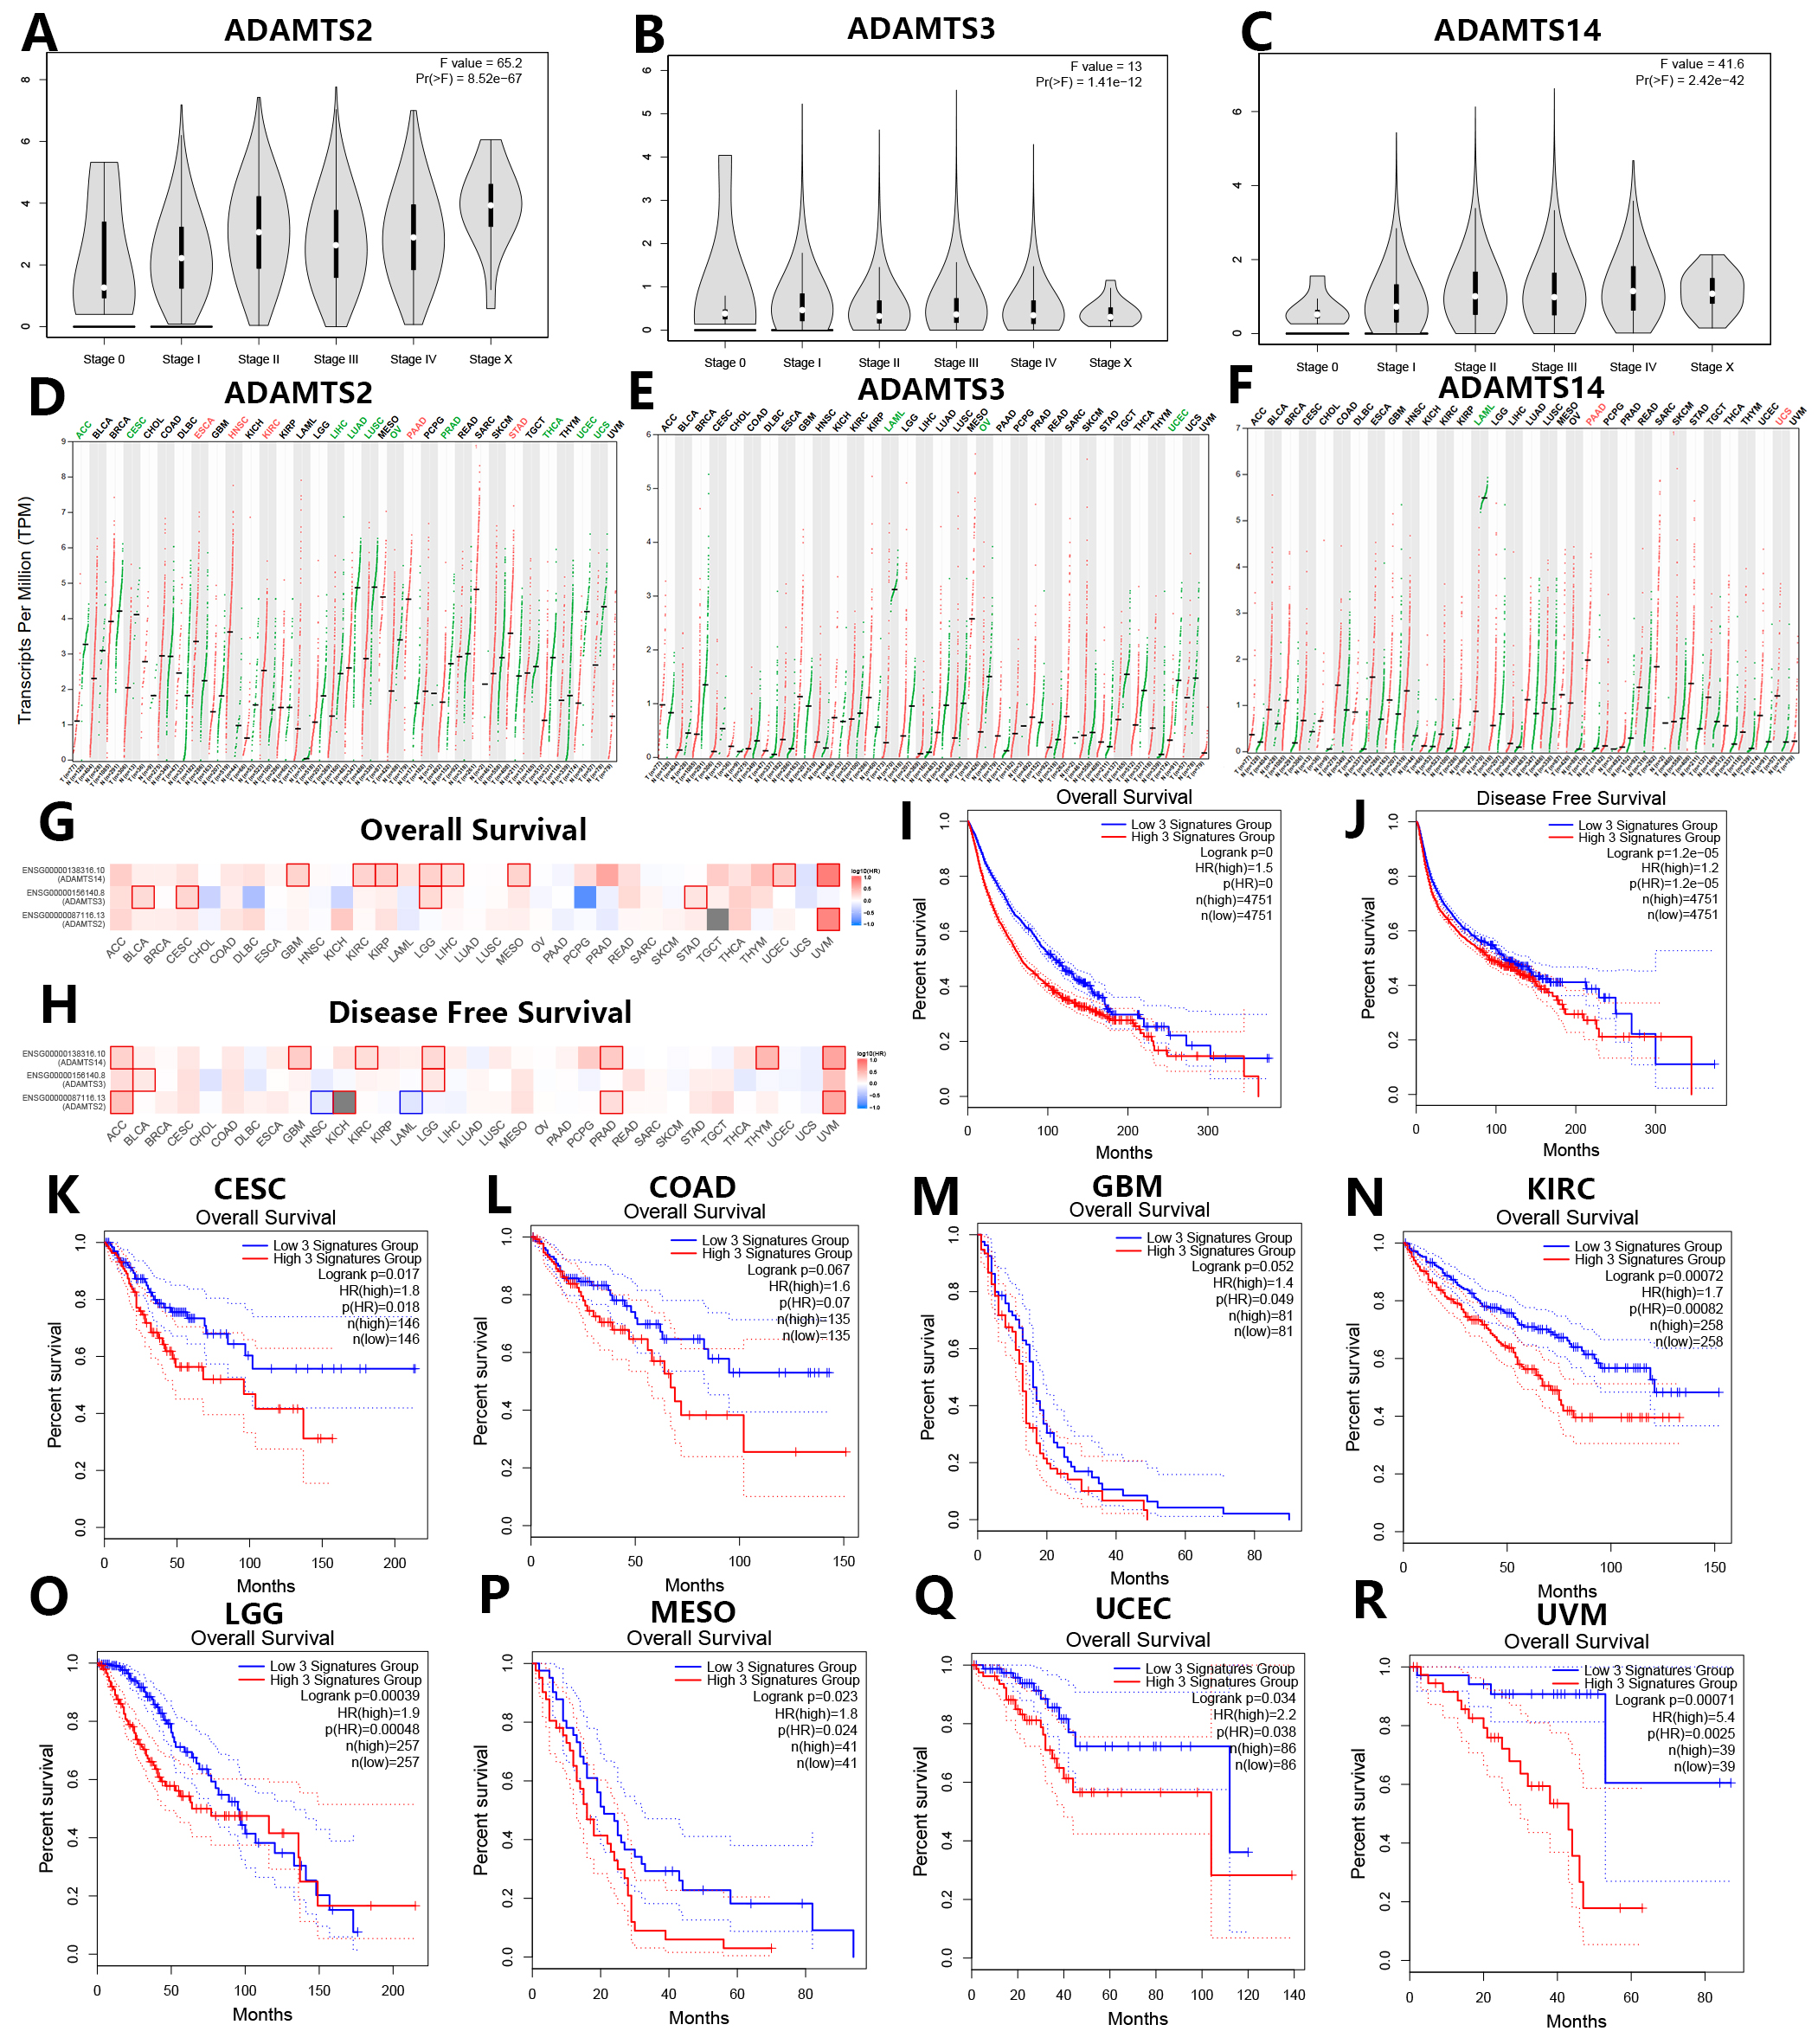 Fig. 4.
Prognostic analysis of PNPSA gene family members based on the GEPIA2 database. (A–C) Associations of PNPSA gene family with tumor stages of all TCGA cancers. (D–F) Differential mRNA expression analysis of ADAMTS2, ADAMTS3, and ADAMTS14 between tumors and normal tissues in pan-cancer. Red represents significantly high expression in tumors and green represents significantly low expression in tumors than in corresponding normal tissues. (G–H) Survival prognosis correlation analysis of PNPSA gene family members. Red represents a risk factor and blue represents a protective factor. The border of a square represents a significant statistical level. (I,J) Survival curves based on the whole PNPSA gene family signature in all cancers. The survival curves are based on the 3-signatures enrichment expression as a whole which was derived from the ADAMTS2, ADAMTS3, and ADAMTS14. All patients were divided into low-risk and high-risk groups according to the median enrichment expression of the whole PNPSA gene family. (K–R) Overall survival curves of eight prognostic tumors. Enrichment expression of the whole PNPSA gene family was significantly or nearly significantly correlated with survival prognosis only in these eight tumors. CESC, Cervical squamous cell carcinoma and endocervical adenocarcinoma; COAD, Colon adenocarcinoma; GBM, Glioblastoma multiforme; KIRC, Kidney renal clear cell carcinoma; LGG, Brain Lower Grade Glioma; MESO, Mesothelioma; UCEC, Uterine Corpus Endometrial Carcinoma; UVM, Uveal Melanoma.
The GEPIA2.0 database is based on the TCGA and GTEx datasets. Analysis of differential expression in this database showed that ADAMTS2 expression was significantly increased in ESCA, HNSC, KIRC, PAAD, and STAD compared with corresponding normal tissue, but significantly reduced in Adrenocortical carcinoma (ACC), CESC, LIHC, Lung adenocarcinoma (LUAD), LUSC, Ovarian serous cystadenocarcinoma (OV), Prostate adenocarcinoma (PRAD), THCA, UCEC, and Uterine Carcinosarcoma (UCS) (Fig. 4D). The expression of ADAMTS3 was significantly downregulated in Acute Myeloid Leukemia (LAML), OV, and UCEC compared with normal samples (Fig. 4E). The expression of ADAMTS14 was significantly increased in PAAD and UCS, but lower in LAML (Fig. 4F). Overall, PNPSA members appear to have a dual role for tumorigenesis in pan-cancer.
To explore associations between the PNPSA gene family and clinical prognosis, survival analysis was performed for 33 tumor types based on the GEPIA2.0 database. The association between mRNA expression of each PNPSA gene family member and patient survival is shown in Fig. 4G,H. High expression levels of ADAMTS2 and ADAMTS14 were strongly associated with poor prognosis in UVM, suggesting they had more clinical impact in this cancer type than in other tumors. Importantly, higher expression of the entire PNPSA gene family was significantly associated with shorter overall survival (OS) and disease-free survival (DFS) in all pan-cancer samples (Fig. 4I,J). Next, we analyzed the influence of the entire PNPSA gene family on patient outcome for individual tumor types. The OS of CESC, COAD, GBM, KIRC, LGG, MESO, UCEC, and UVM patients showed significant or near significant associations with the activity of the entire PNPSA gene family (Fig. 4K–R). The DFS of ACC, CESC, COAD, GBM, KICH, KIRC, LGG, MESO, and UVM patients also showed significant or near significant associations with expression of the entire PNPSA gene family (Supplementary Fig. 2A–I).
We selected ten representative immune cell types and analyzed their tumor infiltration levels in relation to ADAMTS2, ADAMTS3, and ADAMTS14 gene expression based on the TIMER2.0 database. In most cancer types, ADAMTS2 expression was found to be positively correlated with the infiltration levels of macrophages, DC cells, and Tregs, but negatively correlated with the infiltration levels of B cells, Th1 cells, and NK cells. This result suggests that ADAMTS2 may promote antigen presentation and have anti-tumor immune suppression functions in pan-cancer (Fig. 5A). ADAMTS3 expression showed different associations with these immune cell types in specific tumor types, except for Th1 cells (Fig. 5B). ADAMTS3 expression showed a significant negative correlation with infiltrating Th1 cells in nearly all cancer types, suggested a potential suppressive impact on cellular immunity. ADAMTS14 expression showed positive correlations with M1 macrophage and DC infiltration levels, and negative correlations with Th1 cells in most pan-cancers. This result indicates that ADAMTS14 promotes antigen presentation and has cellular immune suppressive functions in cancer (Fig. 5C).
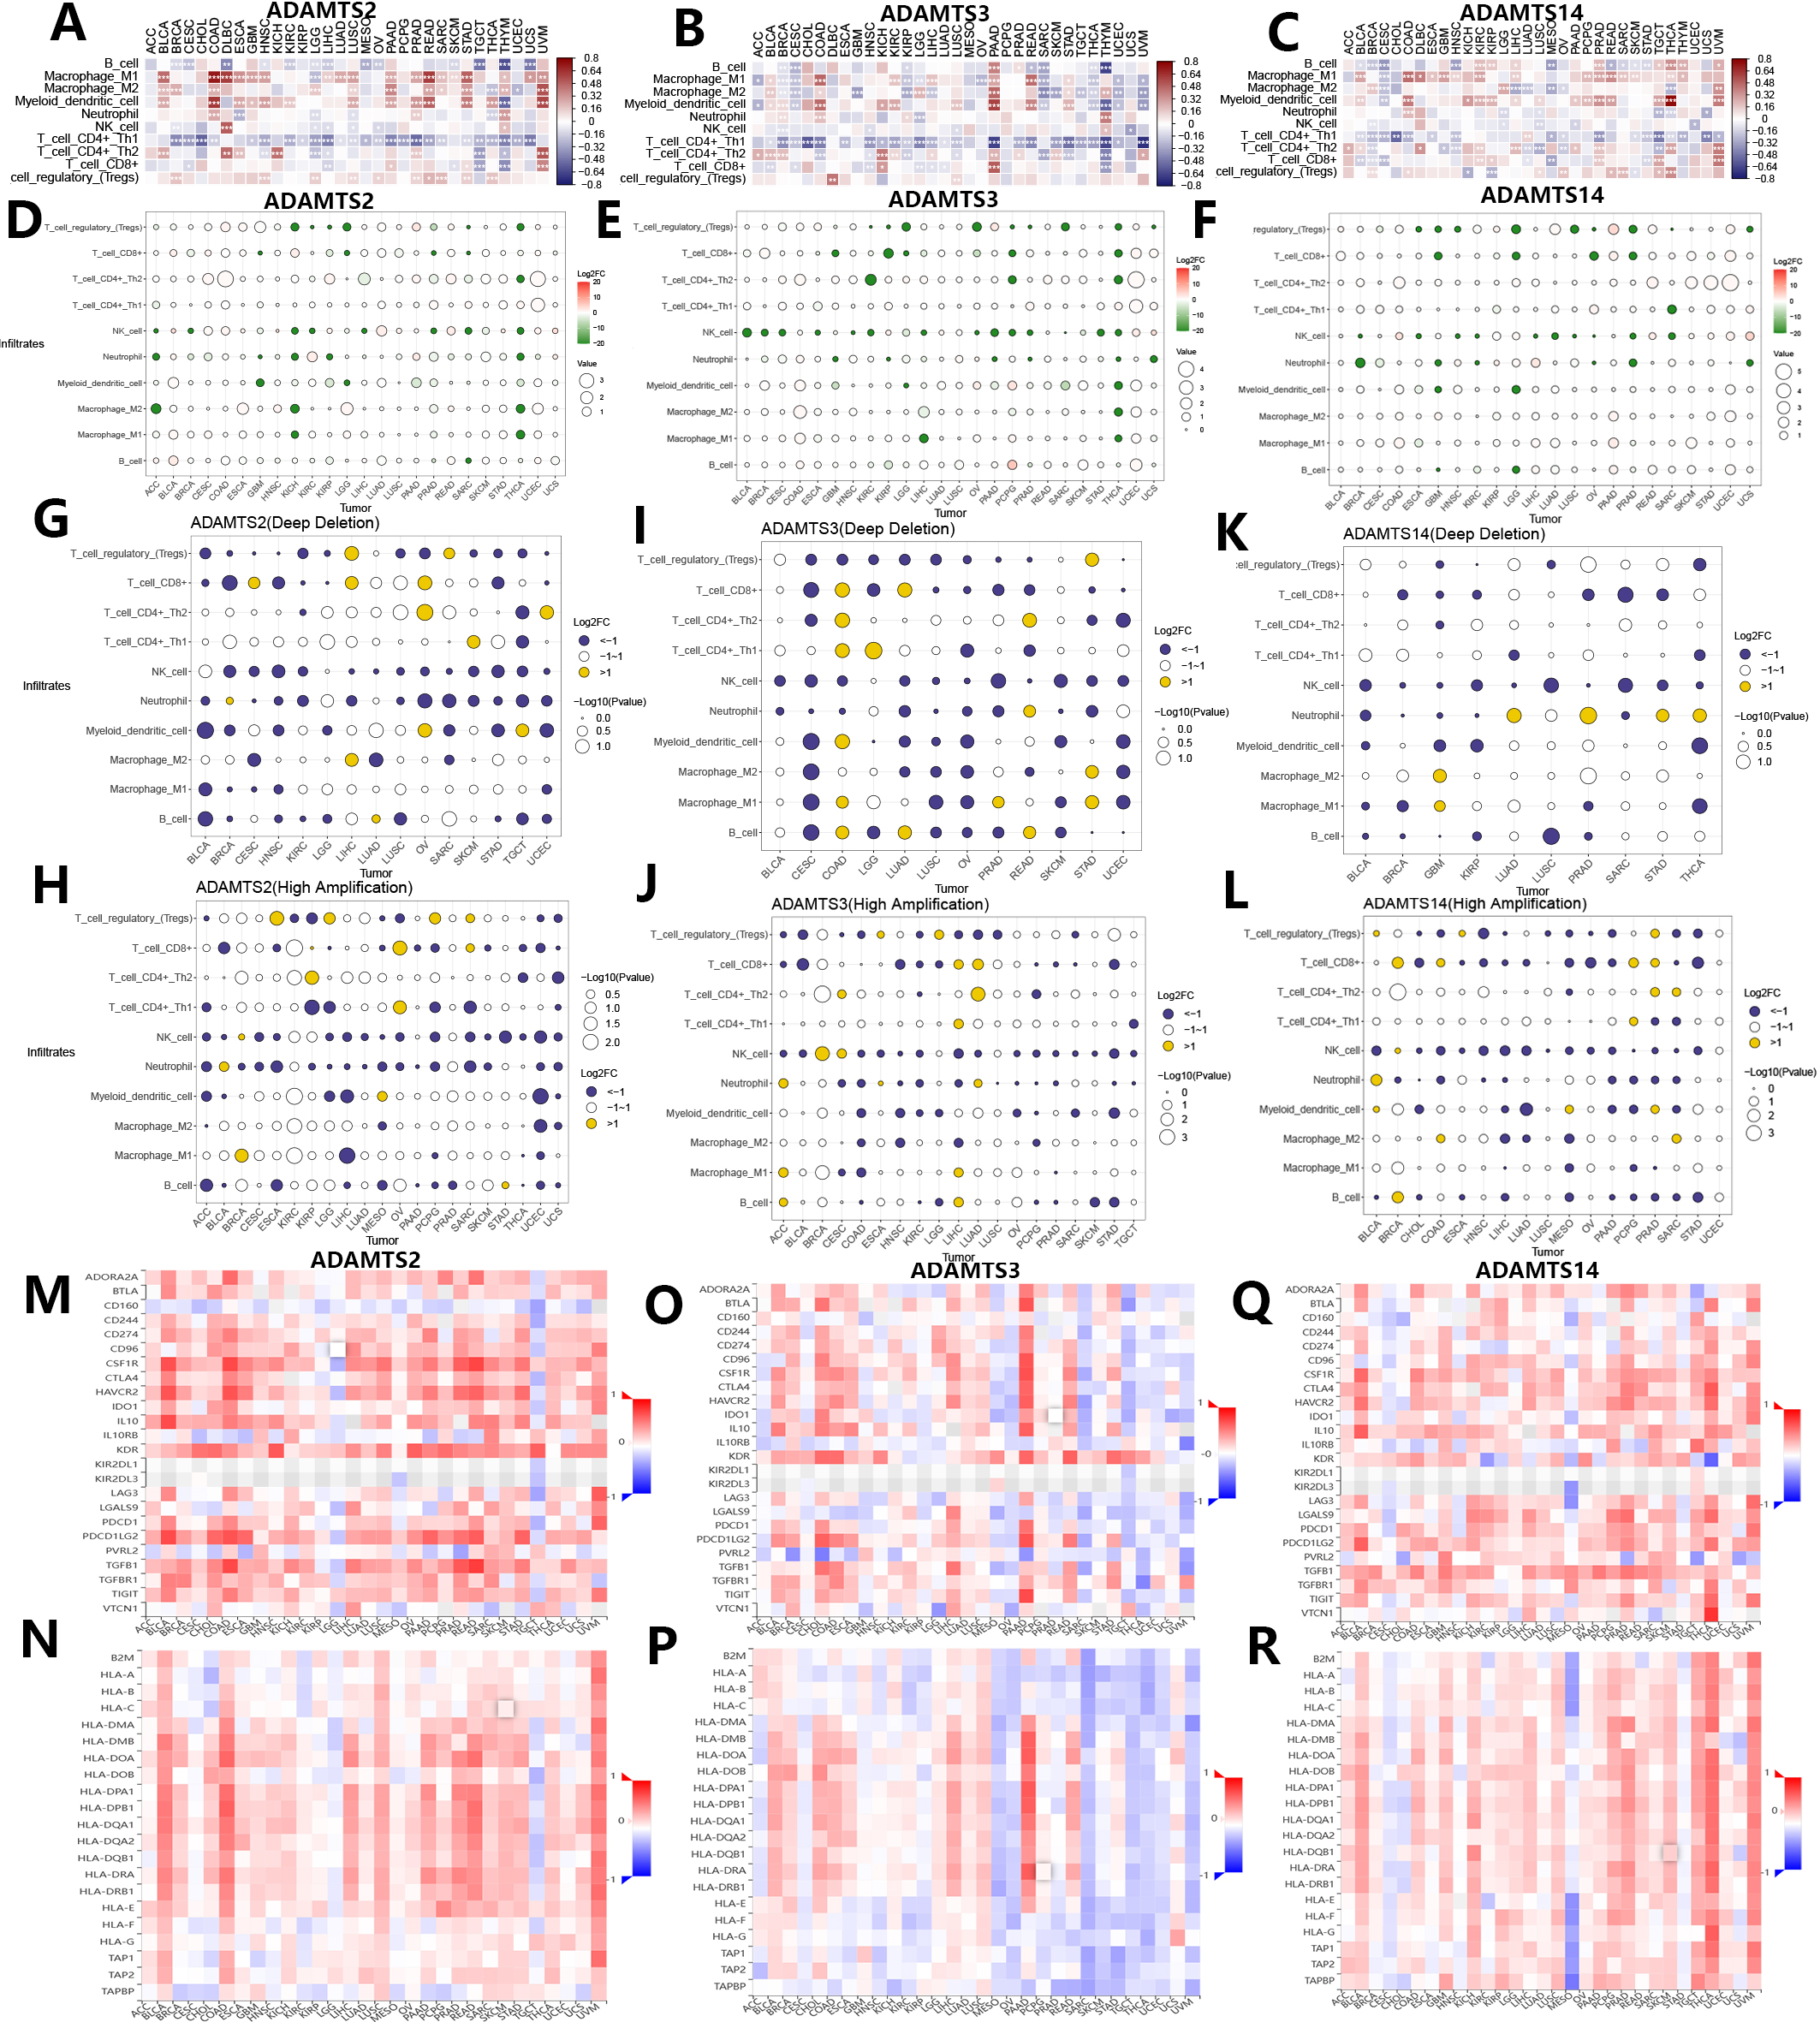 Fig. 5.
Associations of mRNA expression and genomic variations of PNPSA gene family members with tumor immune microenvironment and immune-related molecules. (A–C) Associations of PNPSA gene family members expressions with immune cell infiltration levels. (D–F) Impacts of PNPSA gene family members mutations on immune cell infiltration levels. (G–L) Associations of PNPSA gene family members’ genomic variations with immune cell infiltration levels. (M–R) Associations of PNPSA gene family members with immune checkpoint expressions and Major histocompatibility complex (MHC) molecules.
As described above, genomic variations in the PNPSA gene family are common in pan-cancer. Therefore, we also analyzed correlations between these genomic variations in PNPSA gene family members and TIME. Correlations between mutations in ADAMTS2, ADAMTS3, and ADAMTS14 and the infiltration levels of 10 common immune cell types are shown in Fig. 5D–F. In several tumor types, mutations in PNPSA gene family members were significantly associated with TIME landscapes. Immune cell infiltration levels were also influenced by CNVs in PNPSA gene family members. CNVs of ADAMTS2 and ADAMTS3 were associated with less neutrophil infiltration in the TIME of most cancer types (Fig. 5G–J). Moreover, the CNVs of all PNPSA gene family members were negatively correlated with NK cell infiltration levels in most cancer types (Fig. 5G–L), suggesting that PNPSA members may have an anti-tumor immune suppression function when overexpressed. Overall, the results of immune cell infiltration analysis suggest that expression and genomic variations in PNPSA gene family members are significantly associated with TIME in pan-cancer.
The TISIDB database was used in this study to explore associations between the PNPSA gene family and immune-related molecules. ADAMTS2 expression was found to be positively correlated with the expression of most immune checkpoints in the majority of cancer types, with the exception of LGG and TGCT. Therefore, cancer patients with high ADAMTS2 expression might benefit from immunotherapy (Fig. 5M). In addition, ADAMTS2 was negatively correlated with CD160 expression in almost all cancer types (Fig. 5M). As shown in Fig. 5N, strong positive correlations were found between ADAMTS2 and the Major histocompatibility complex (MHC) molecules in BLCA, COAD, LIHC, LUSC, PAAD, PRAD, READ, and UVM. This suggests that ADAMTS2 may promote antigen presentation in these cancer types. ADAMTS3 expression was found to have different correlations with the expression of immune checkpoints and MHC molecules depending on the tumor type (Fig. 5O,P), although the associations were particularly strong in PAAD. For ADAMTS14, its expression was also found to be associated with different immune checkpoint expressions (Fig. 5Q). ADAMTS14 was strongly and positively correlated with most MHC molecules in THCA and UVM, but showed a strong negative association with MESO (Fig. 5R). In summary, the analysis of TIME and immune-related molecules revealed that expression of ADAMTS2 and ADAMTS14 can promote antigen presentation in some cancer types, but also suppress anti-tumor immune cells. ADAMTS3 appears to have a dual role in TIME.
The GeneMANIA database was used to identify genes co-expressed with the PNPSA gene family and potential connections at the protein expression level (Fig. 6A). As reported above, the expression of each member of the PNPSA gene family was found to be associated with patient OS in specific tumor types (Fig. 4G). We next performed single-cell sequencing analysis based on the scTIME database in order to identify the cell subgroups in these tumors that express PNPSA gene family members. The unified cell classifying method was used with this database to identify accurate cell clusters in 5 specific tumors. Single-cell landscape and expression characteristics of the PNPSA gene family are shown in Fig. 6B–M. ADAMTS2 in UVM was expressed mainly in some immune cells and fibroblasts (Fig. 6B,C). ADAMTS3 in gliomas was expressed in macrophages, fibroblasts, tumor cells, endothelial cells, and oligodendrocytes (Fig. 6E,F). ADAMTS3 in STAD was expressed in fibroblasts and enterocytes (Fig. 6H,I). ADAMTS14 expression in gliomas was expressed in tumor cells and oligodendrocytes (Fig. 6E,G), and in UVM it was expressed in immune cells, fibroblasts and tumor cells (Fig. 6B,D). In kidney cancer, ADAMTS14 was expressed in many cell types including CD8+ T cells, CD4+ Tregs, macrophages, and DCs, with the highest level of expression observed in a macrophage subtype (Fig. 6J,K). In LIHC, ADAMTS14 was expressed in many immune cell subtypes, with the highest expression level found in a CD8+ T cell subtype (Fig. 6L,M). Overall, these results show that PNPSA members are expressed not only in fibroblasts but also in some immune cells, tumor cells, and endothelial cells. This suggests that accumulation of ECM collagen fibers may result from multiple cells working synergistically.
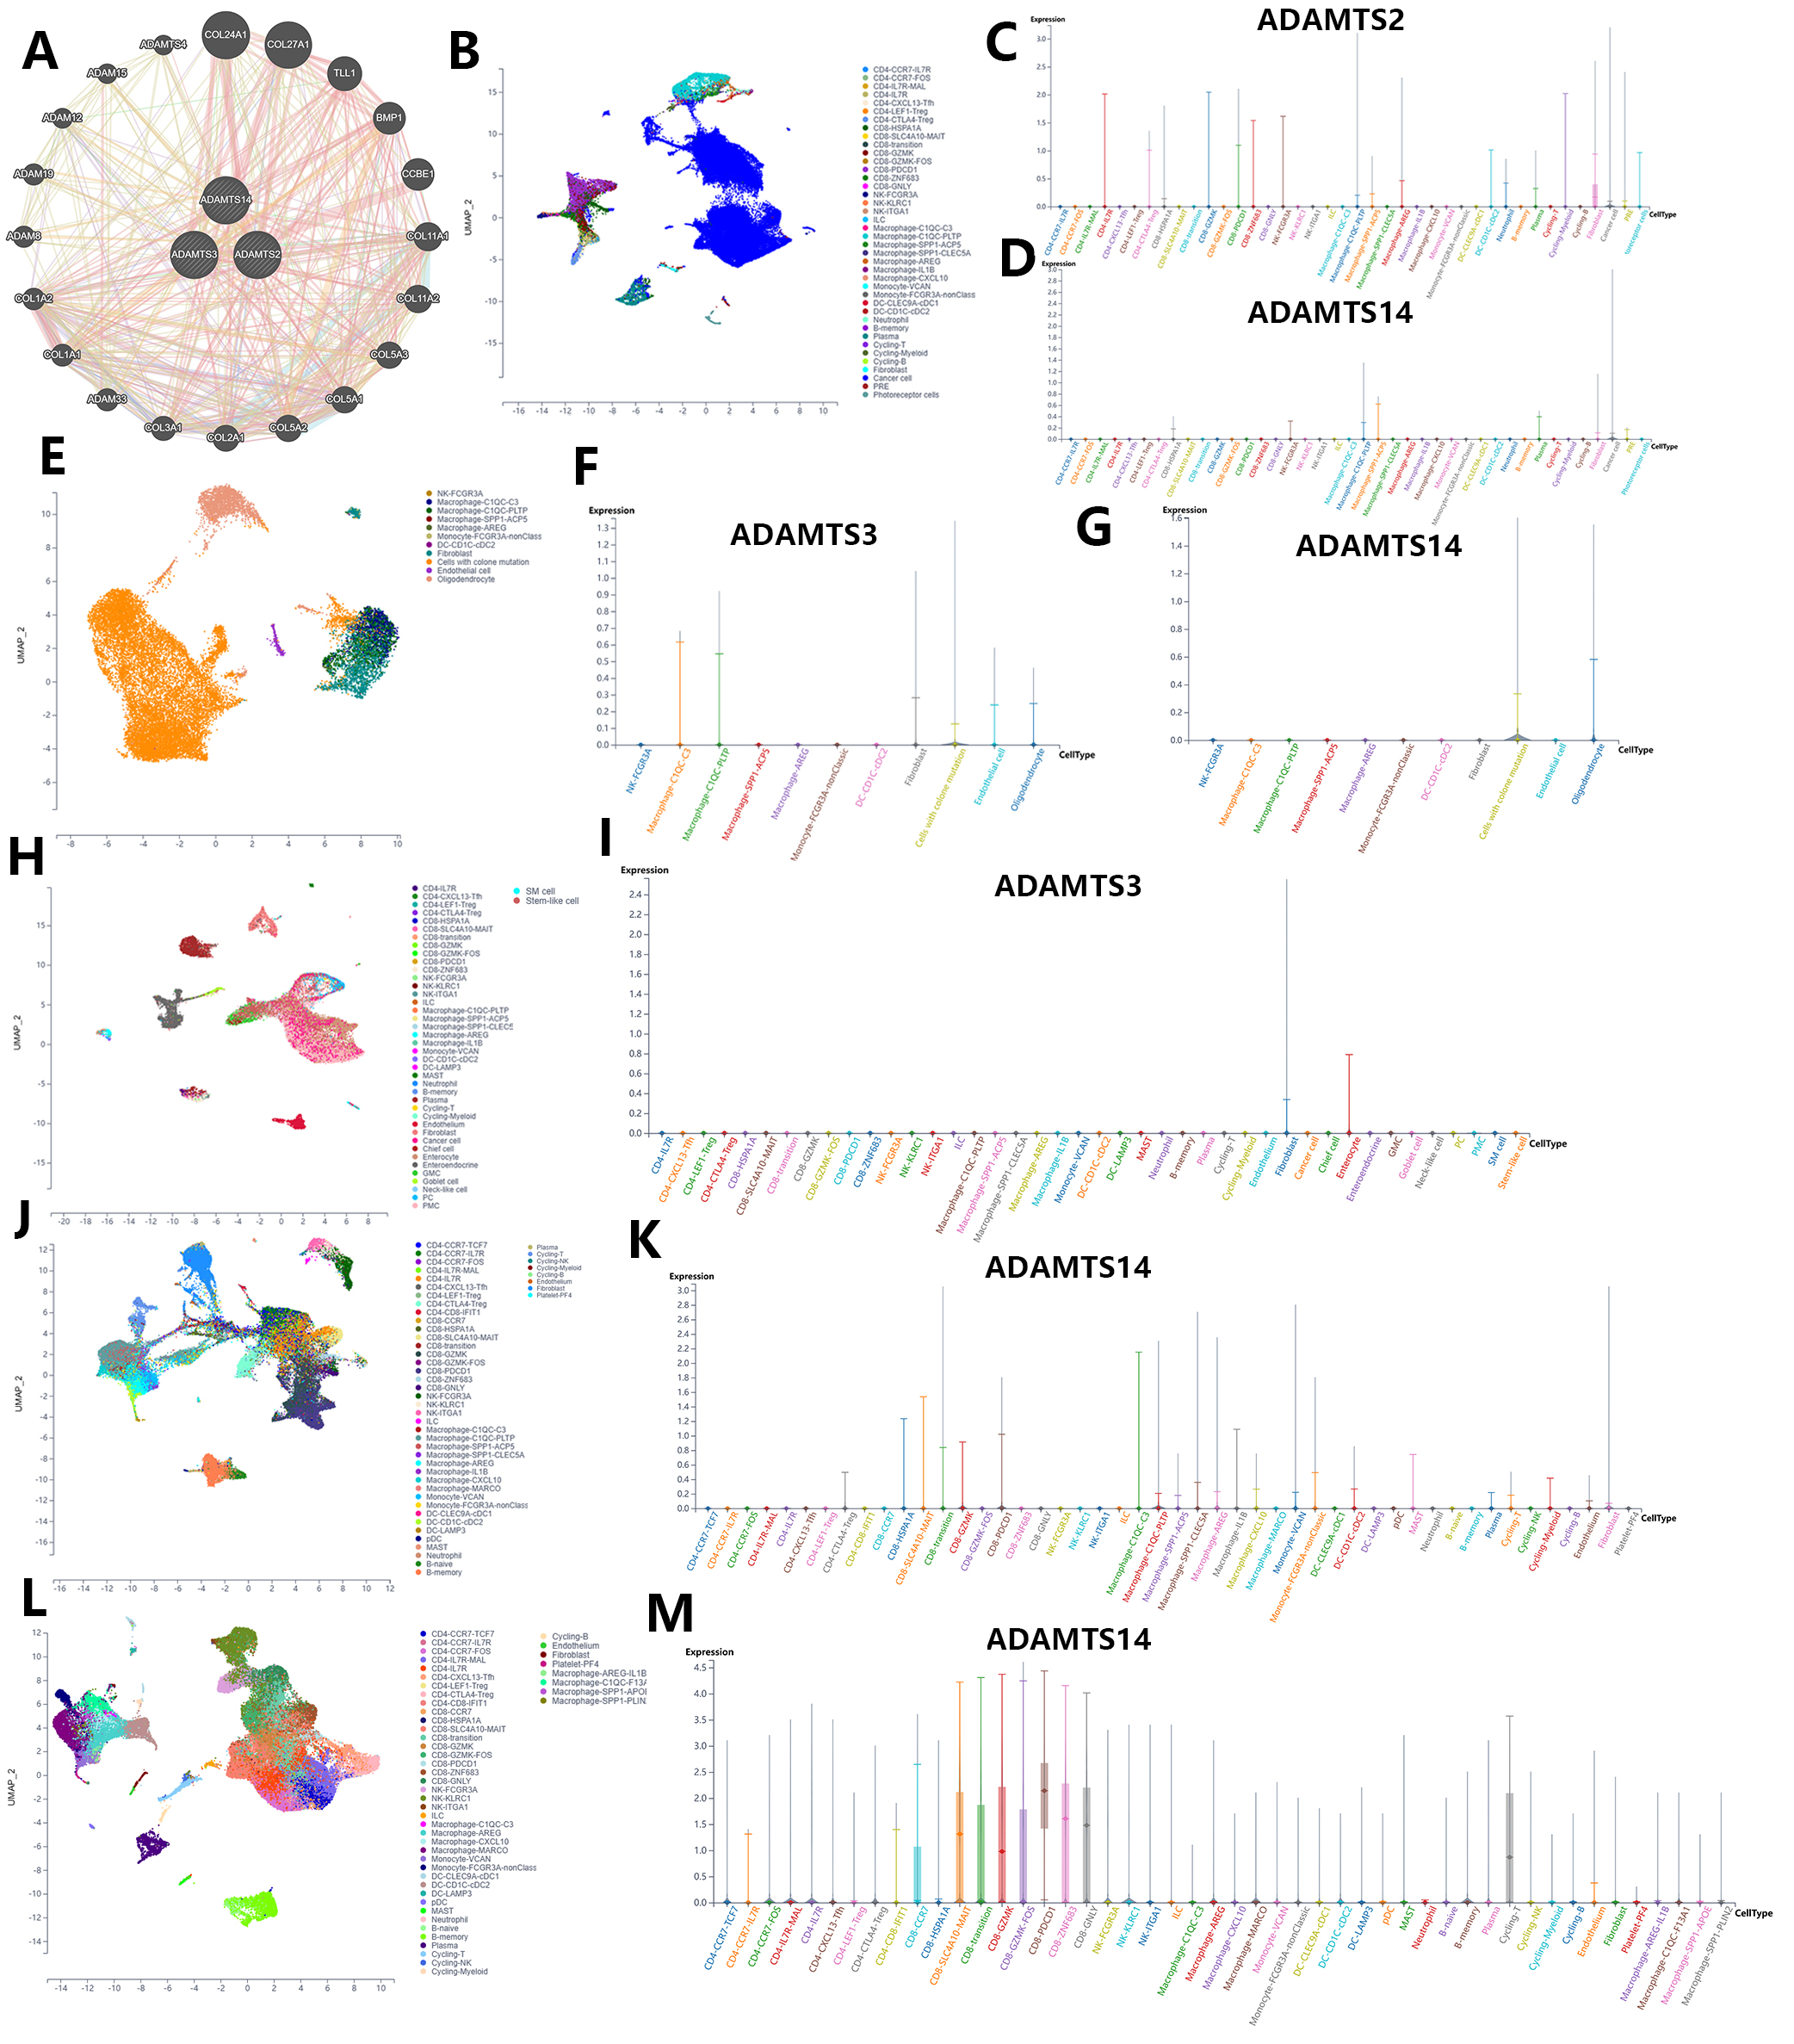 Fig. 6.
Single-cell sequencing analysis of PNPSA gene family members based on the scTIME portal database. (A) Co-expressed genes interaction network of PNPSA gene family. (B–D) Single-cell landscape and cell expression cluster of ADAMTS2 and ADAMTS14 in UVM. (E–G) Single-cell landscape and cell expression cluster of ADAMTS3 and ADAMTS14 in glioma. (H,I) Single-cell landscape and cell expression cluster of ADAMTS3 in STAD. (J,K) Single-cell landscape and cell expression cluster of ADAMTS14 in kidney cancer. (L,M) Single-cell landscape and cell expression cluster of ADAMTS14 in LIHC.
As shown earlier, the entire PNPSA gene family showed significant or near significant association with the OS of CESC, COAD, GBM, KIRC, LGG, MESO, UCEC, and UVM patients (Fig. 4K–R). PNSPA-related biological signatures were further explored in these 8 33cancer types with the long-term goal of improving OS by targeting the PNPSA gene family. Therefore, we calculated the GSVA scores of PNPSA gene sets, including ADAMTS2, ADAMTS3, and ADAMTS14, as gene family signatures in the 8 tumor types. ROC curves for these signatures are shown in Fig. 7A–H. The GSVA signature for the PNPSA gene family exhibited some discrimination ability and predictive value for the OS of LGG, MESO, and UVM patients.
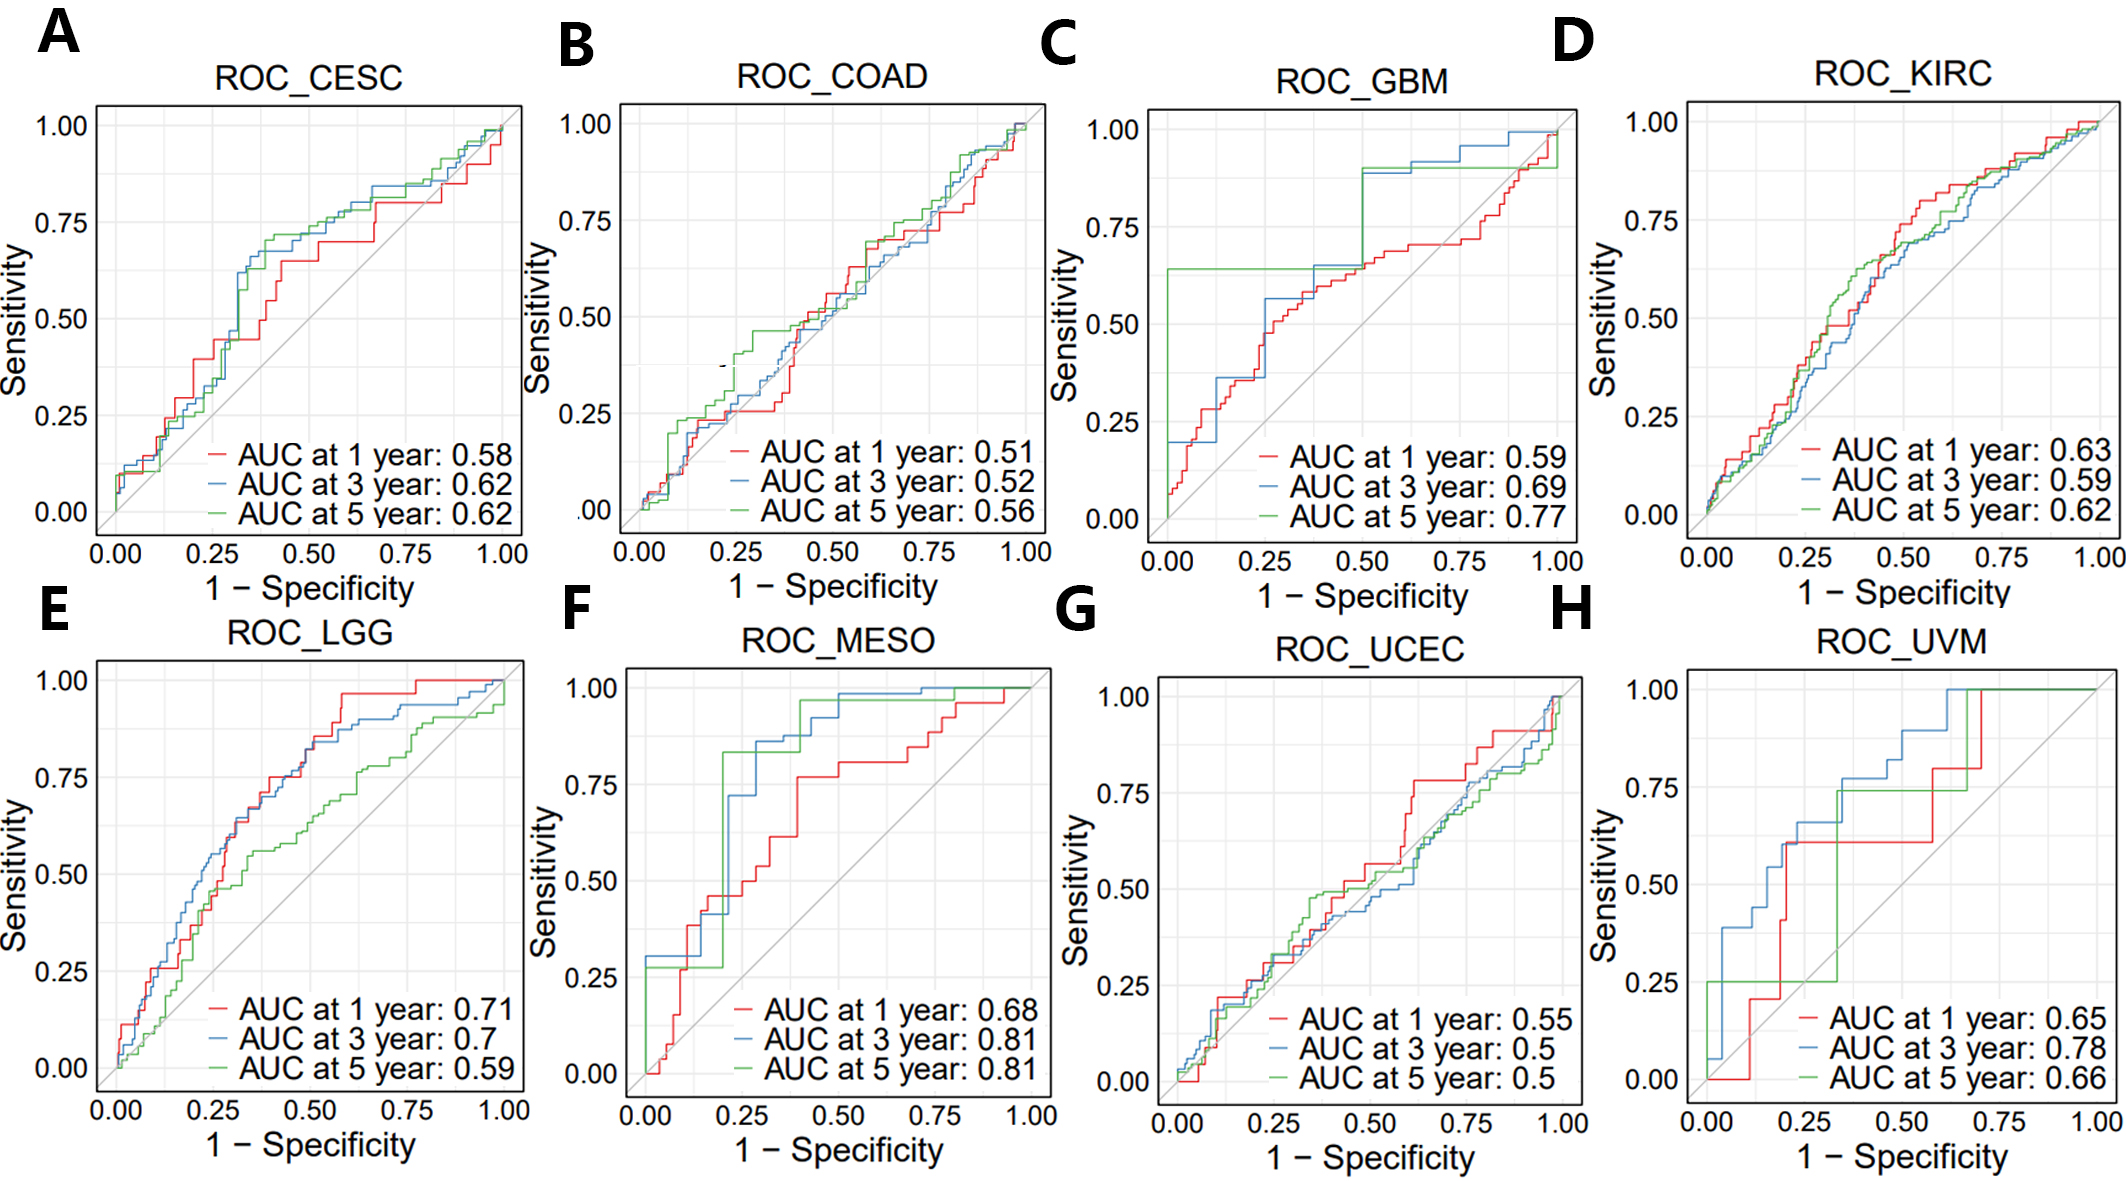 Fig. 7.
ROC curves of GSVA score in eight prognostic tumors. (A) CESC, (B) COAD, (C) GBM, (D) KIRC, (E) LGG, (F) MESO, (G) UCEC, and (H) UVM.
We also performed KEGG analysis of co-expressed genes with the PNPSA gene family in order to explore PNPSA-related signaling pathways (Fig. 8A–H). Some pathways associated with the original functions of the PNPSA gene family were enriched in the 8 cancer types, including protein digestion and absorption, ECM-receptor interaction, and focal adhesion. In addition, some pathways related to tumorigenesis were also found to be enriched, such as the PI3K-Akt signaling pathway, the AGE-RAGE signaling pathway, and the NF-kappa B signaling pathway. It is worth noting that the PNPSA gene family was also correlated with metabolic pathways in LGG.
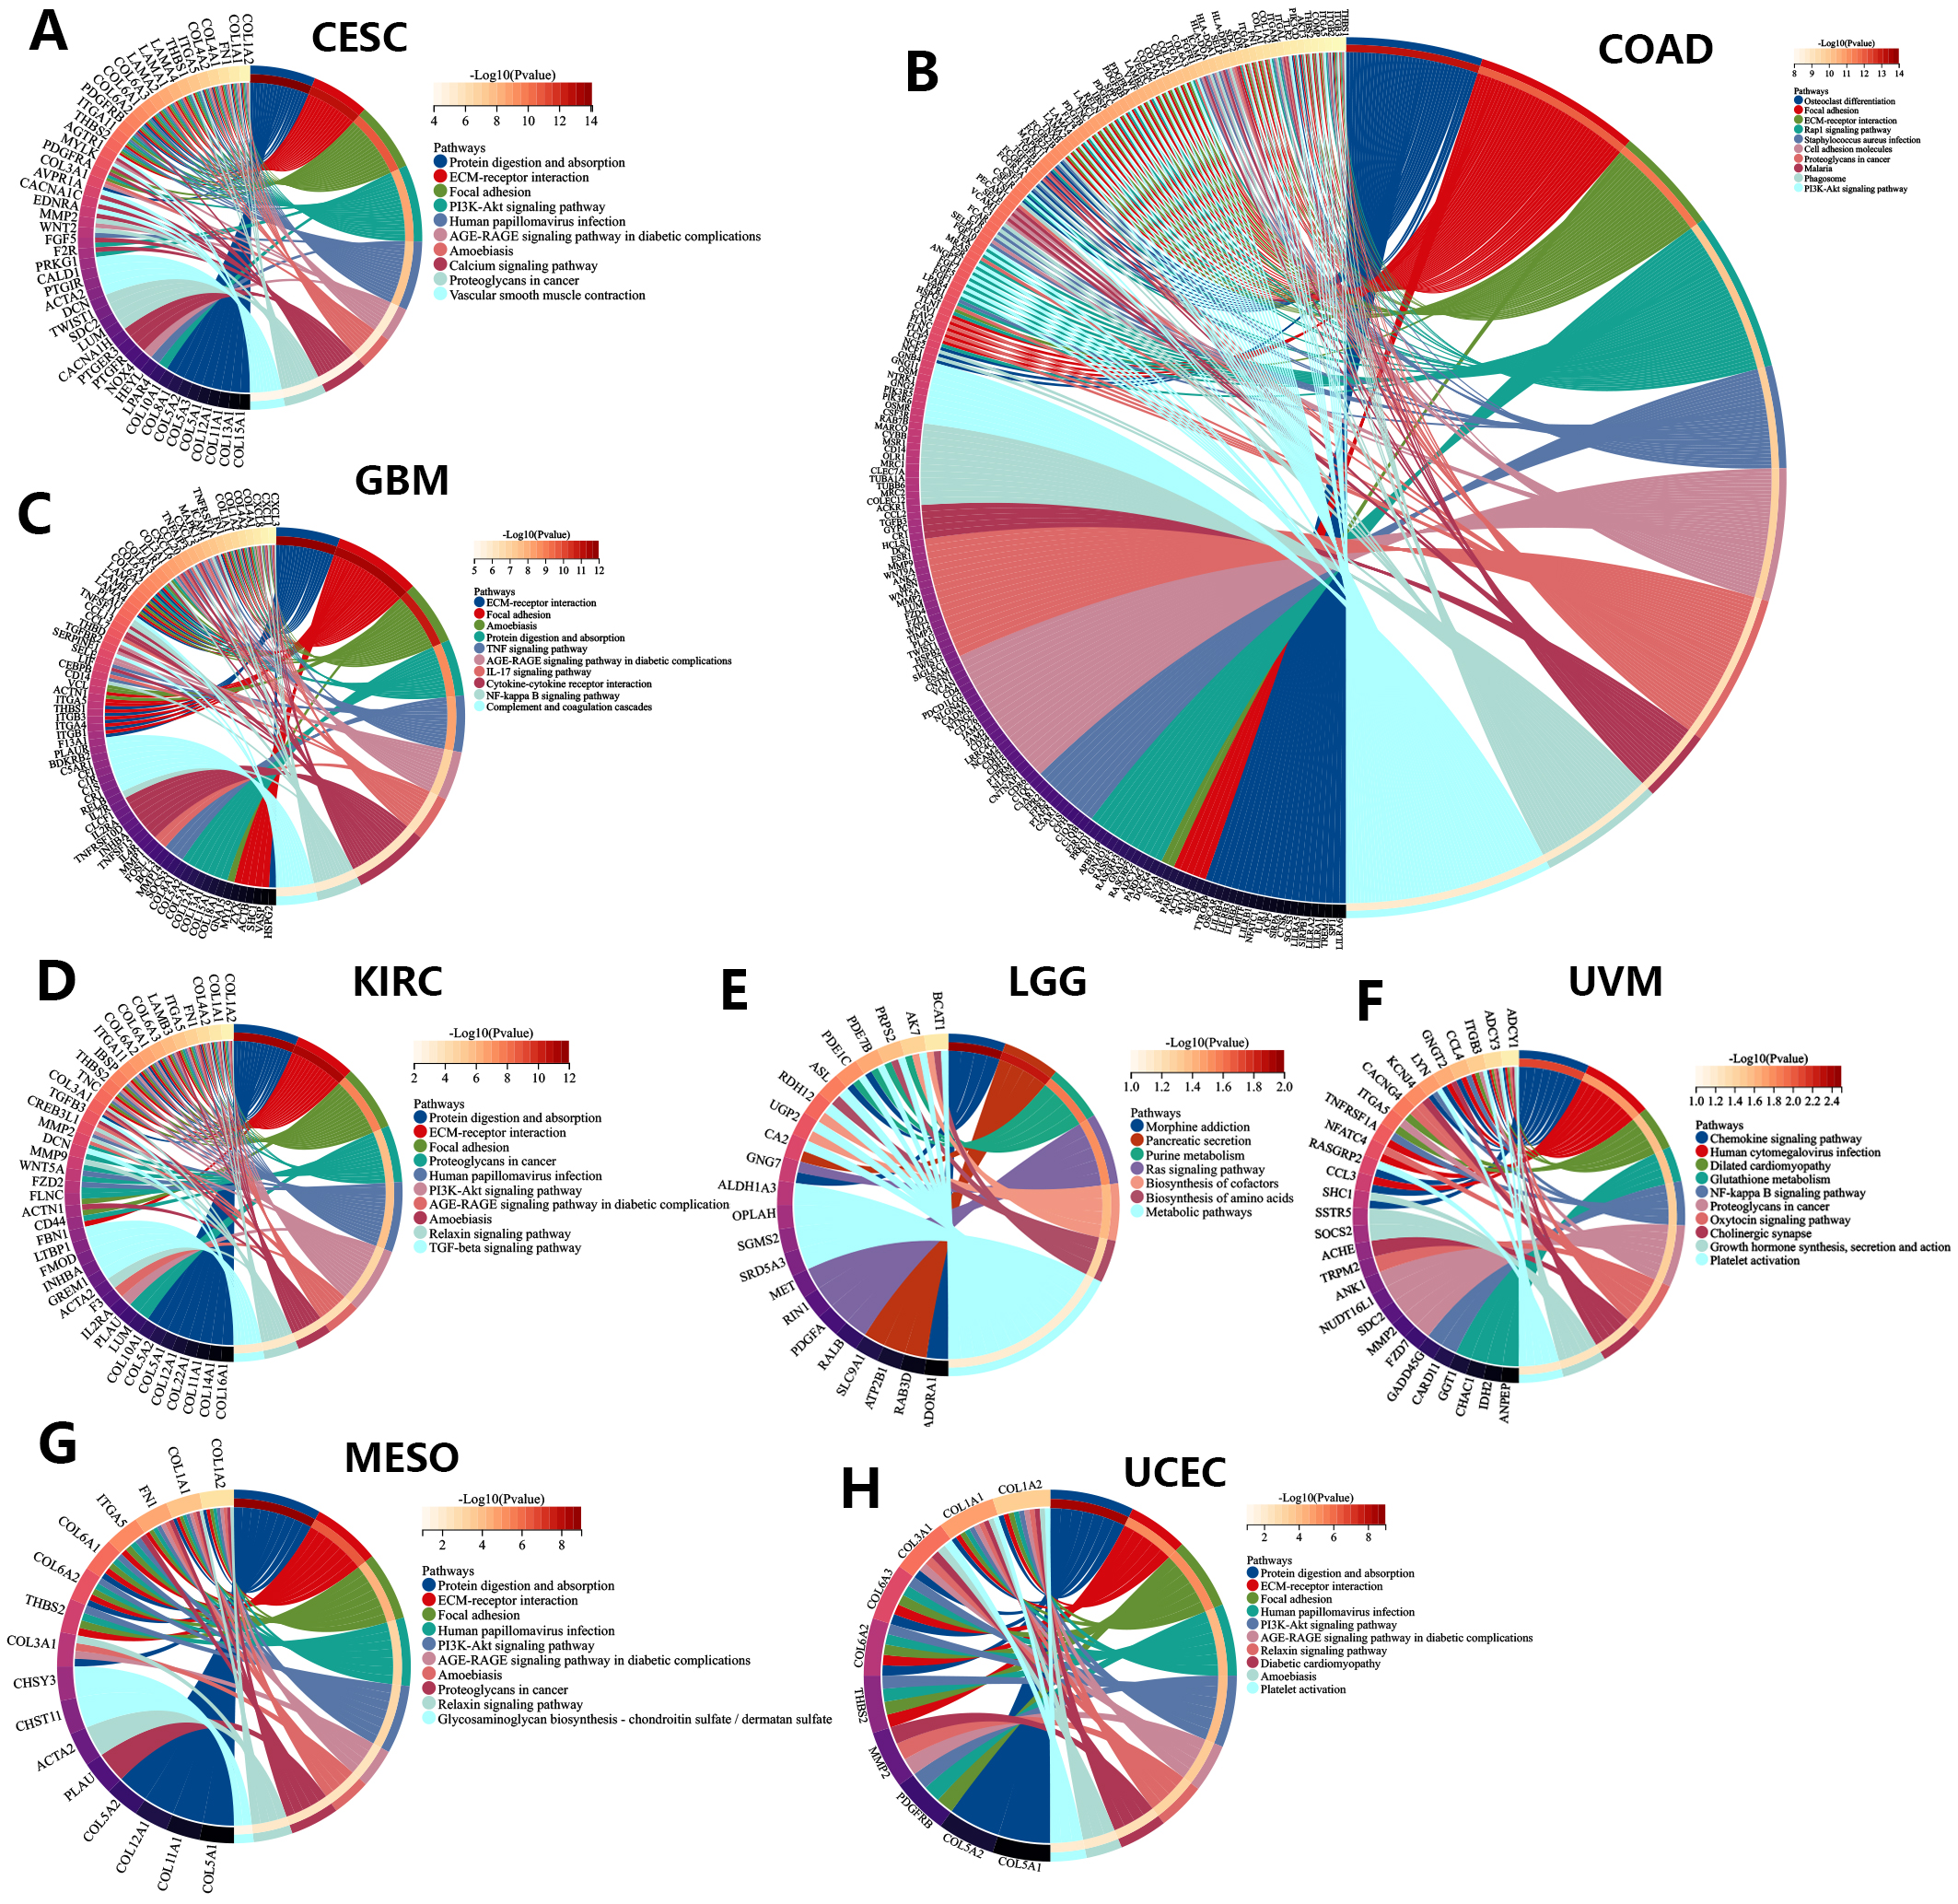 Fig. 8.
KEGG analysis of the PNPSA gene family in eight prognostic tumors ((A)CESC, (B) COAD, (C) GBM, (D) KIRC, (E) LGG, (F) UVM, (G) MESO, (H) UCEC).
Based on the estimate algorithm, we next analyzed the predictive value of the GSVA signature for stromal and immune scores in the 8 cancer types of interest (Fig. 9A). As expected, GSVA scores were positively correlated with the stromal scores in all 8 tumor types. Moreover, GSVA signatures were positively correlated with immune scores in UVM, KIRC, COAD, and GBM. Subsequently, immune infiltration analysis was performed using the CIBERSORTx database to explore the association of GSVA signatures with specific immune cell types (Fig. 9B). GSVA signatures showed different correlations with TIME in the 8 cancer types. In UVM, the signature strong negative correlations with monocytes, resting mast cells and eosinophils, but strong positive correlations with activated memory CD4+ T cells and CD8+ T cells. The GSVA signature showed stronger remodeling effects on the TIME of UVM than any of the other cancer types investigated. In contrast, it showed barely any association with the TIME of UCEC.
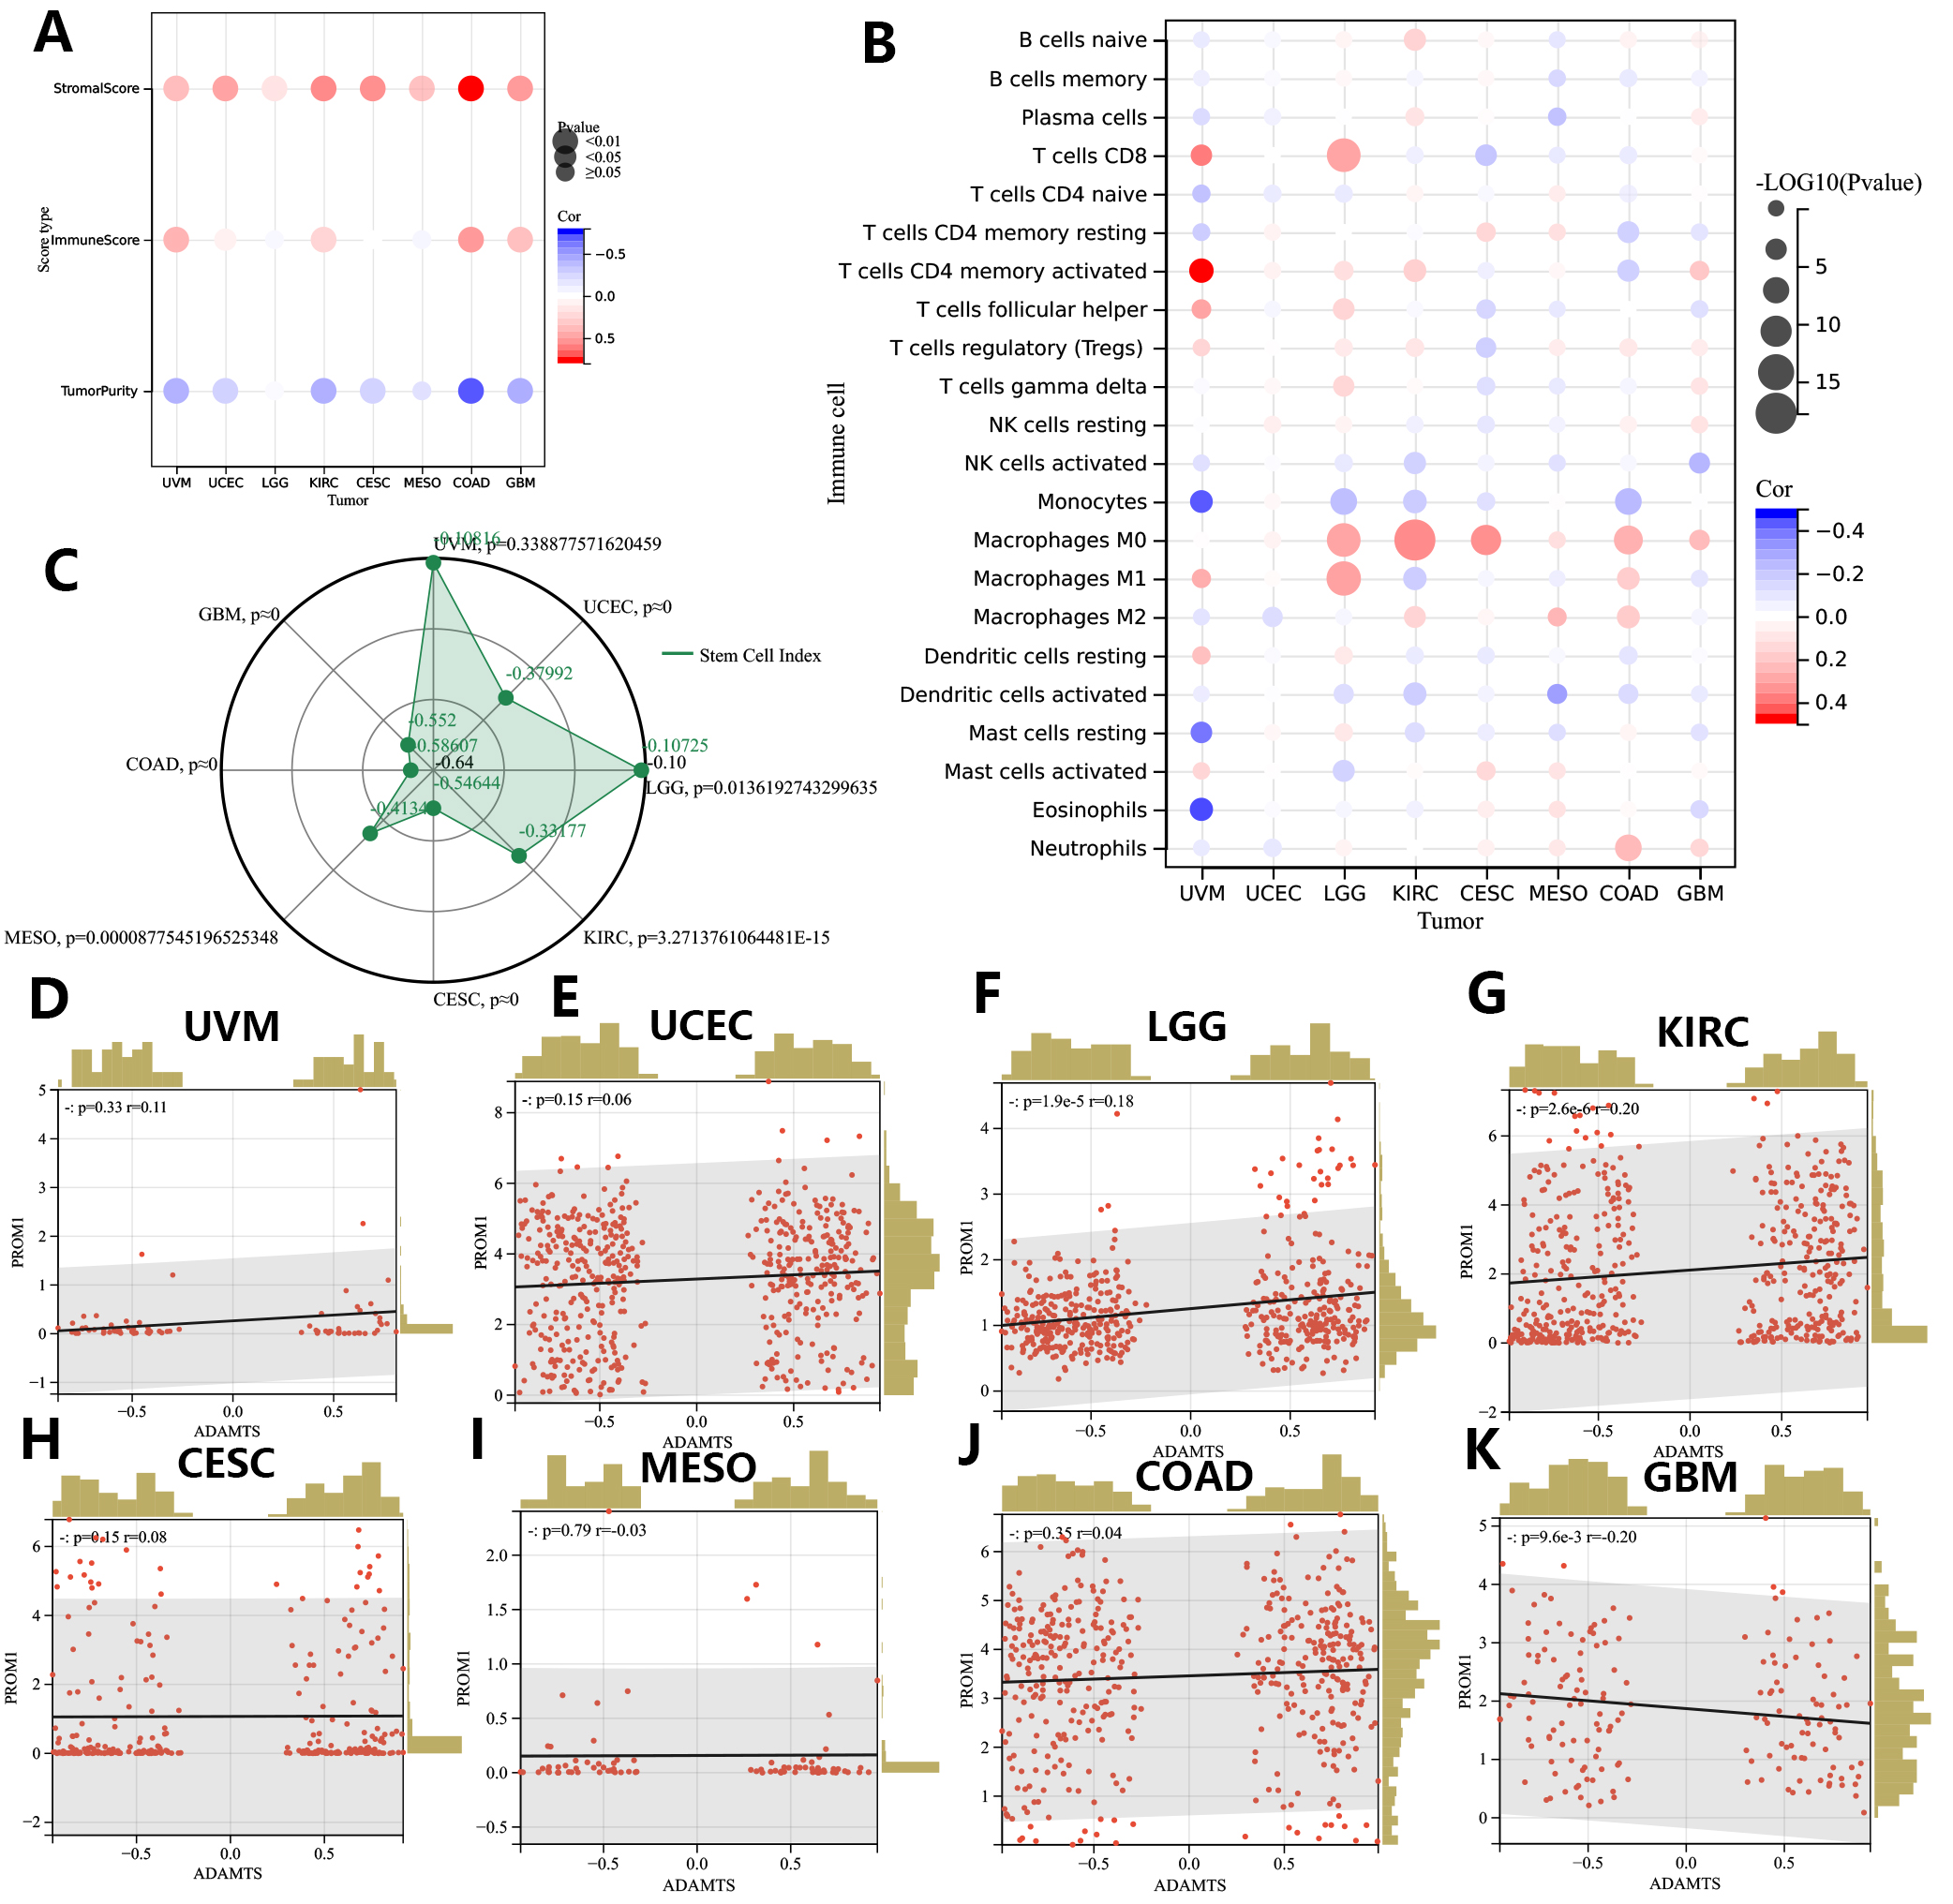 Fig. 9.
Associations of GSVA score with TIME and tumor cell stemness in eight prognostic tumors (CESC, COAD, GBM, KIRC, LGG, MESO, UCEC, UVM). (A,B) TIME correlation analysis of GSVA score in eight prognostic tumors. (C) Associations of GSVA score with mRNAsi. (D–K). Associations of GSVA score with Tumor stem cell marker PROM1 (CD133). CESC, Cervical squamous cell carcinoma and endocervical adenocarcinoma; COAD, Colon adenocarcinoma; GBM, Glioblastoma multiforme; KIRC, Kidney renal clear cell carcinoma; LGG, Brain Lower Grade Glioma; MESO, Mesothelioma; UCEC, Uterine Corpus Endometrial Carcinoma; UVM, Uveal Melanoma.
The mRNA expression-based stemness index (mRNAsi) score was used to represent the tumor cell stemness index in this study and was calculated for all samples from the 8 cancer types. Interestingly, this index was found to be negatively correlated with the GSVA scores in all 8 tumor types (Fig. 9C). The strongest negative correlation between the GSVA score and the tumor cell stemness index was observed in COAD. We further analyzed for associations between the GSVA score and expression of the tumor cell stemness marker PROM1 (CD133) (Fig. 9D–K). The GSVA score showed a significant positive correlation with PROM1 expression in LGG, UCEC, KIRC, and a strong trend in UVM (p = 0.06). However, the results of the PROM1 expression analysis were not consistent with those of the mRNAsi score analysis (reviewed in the Discussion).
We next evaluated the PNPSA gene family in relation to the sensitivity of different cancer types to chemotherapy drugs. The IC50s for 6 common chemotherapy drugs were predicted with the oncoPredict R package, and Spearman correlation analysis was then conducted between the GSVA score and IC50s (Fig. 10A). A higher GSVA score was found to be associated with lower sensitivity to common chemotherapy drugs in UCEC, LGG, and CESC. The GSVA scores showed positive correlations with the sensitivity of KIRC and COAD to cisplatin, irinotecan, and gemcitabine. The GSVA score was also positively correlated with the sensitivity of GBM to 5-fluorouracil and gemcitabine. Therefore, although high expression of the PNPSA gene family is often associated with poor prognosis in the 8 cancer types, it may increase the sensitivity of KIRC, COAD, and GBM to some chemotherapy drugs.
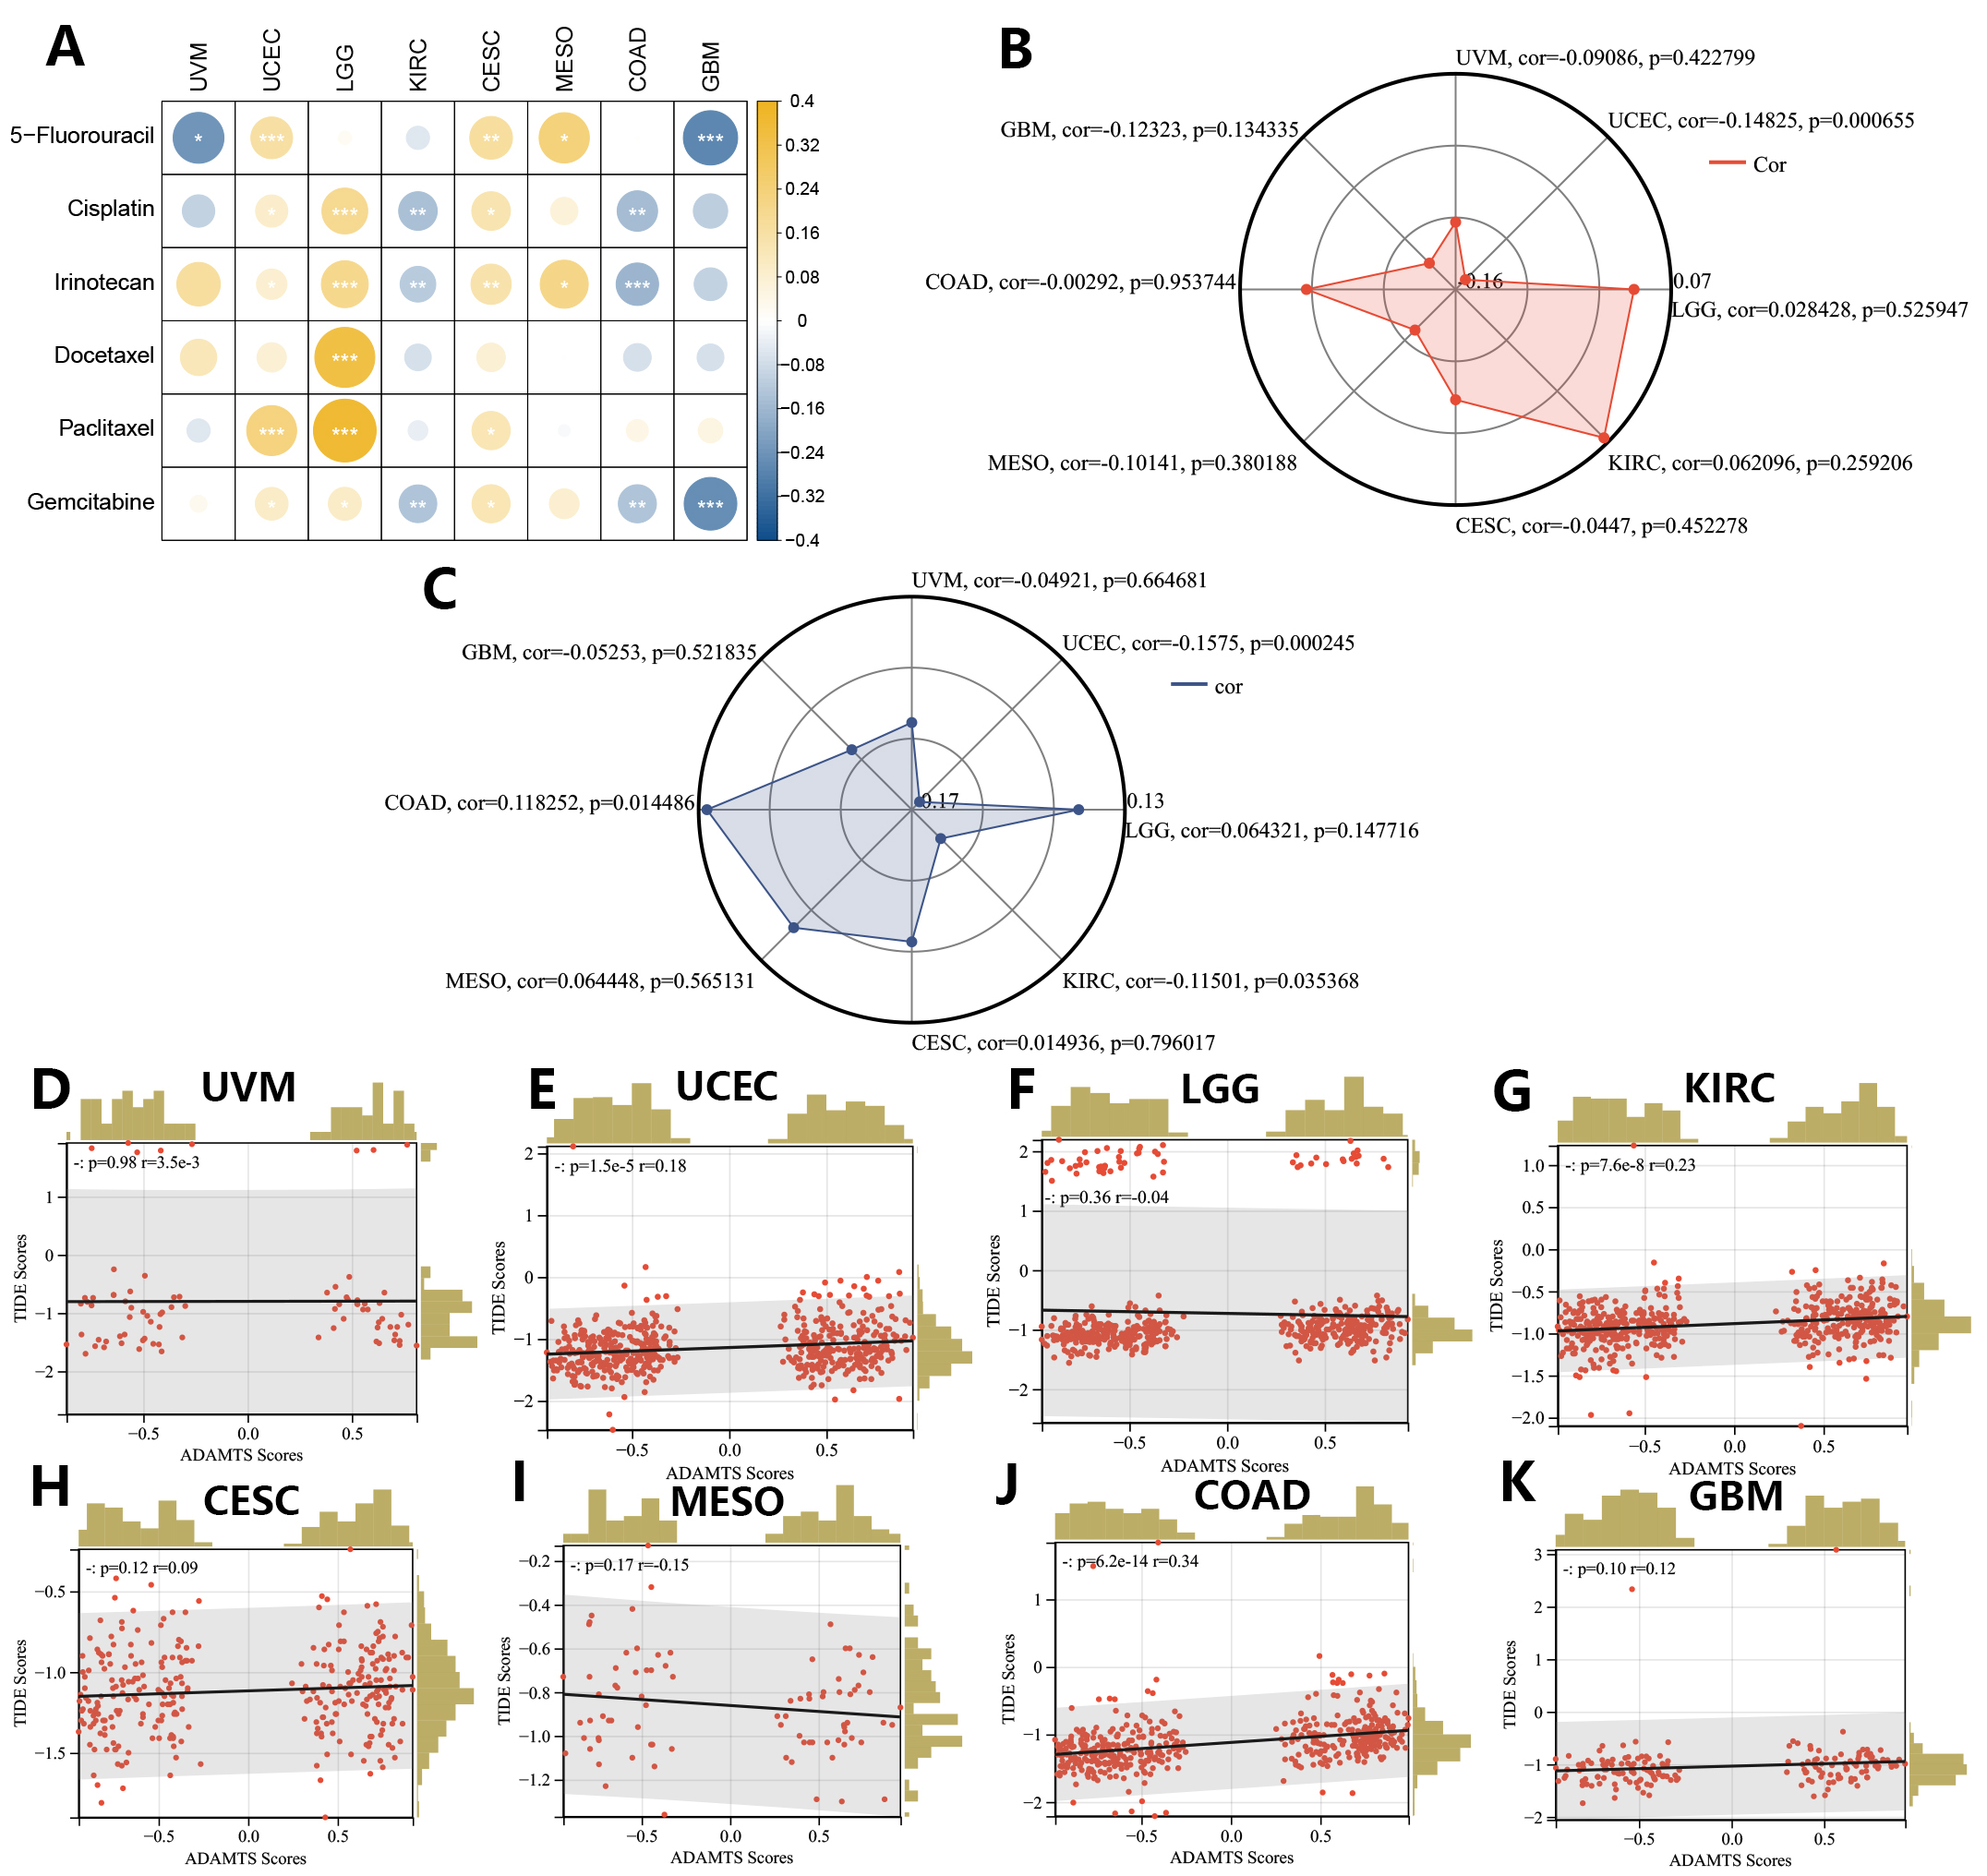 Fig. 10.
Correlations between the GSVA score signature and drug sensitivities in eight prognostic tumors (CESC, COAD, GBM, KIRC, LGG, MESO, UCEC, UVM). (A) Correlation analysis between the GSVA score and predicted IC50s of 6 common chemotherapy drugs. (B) Correlation analysis between the GSVA score and TMB score. (C) Correlation analysis between the GSVA score and MSI score. (D–K) Correlation analysis between the GSVA score and TIDE score based on the TIDE database.
The maftools R package was used to calculate the TMB score, which is a common indicator for predicting the efficacy of immunotherapy. The GSVA score showed a significant negative correlation with the TMB score in UCEC, but no correlation was seen in any of the other tumor types (Fig. 10B). The MSI score is another predictive indicator of the efficacy of immunotherapy and was obtained from an earlier study [32]. A lower MSI score usually indicates poorer responsiveness to immunotherapy. GSVA scores showed significant negative correlations with MSI scores in UCEC and KIRC (Fig. 10C). To further evaluate the predictive value of the GSVA score for immunotherapy efficacy, TIDE score results were also obtained for the 8 cancer types and Pearson correlation analysis was performed (Fig. 10D–K). A higher TIDE score indicated poor responsiveness to immunotherapy. GSVA scores showed significant positive correlations with TIDE scores in COAD, KIRC, and UCEC. In summary, the GSVA score for the PNPSA gene family may have predictive value for immunotherapy responsiveness in UCEC, COAD, and KIRC. A higher GSVA score in these tumor types could indicate poorer responsiveness to immunotherapy.
We validated protein-level expression of the PNPSA gene family in several common solid tumor types (KIRC, ESCA, STAD, LIHC, CESC, and PAAD) using immunohistochemical staining. The results showed that ADAMTS2 protein expression was higher in KIRC, ESCA, STAD, and PAAD tumor tissue compared to corresponding paracancerous tissue (Fig. 11A–H). However, in LIHC and CESC the ADAMTS2 protein expression level was higher in the paracancerous tissue than in the tumor tissue (Fig. 11I–L). ADAMTS14 protein expression was higher in PAAD tumor tissue than in corresponding normal tissue (Fig. 11M,N). In conclusion, the immunohistochemical staining results for the PNPSA gene family were consistent with those of mRNA differential expression analysis.
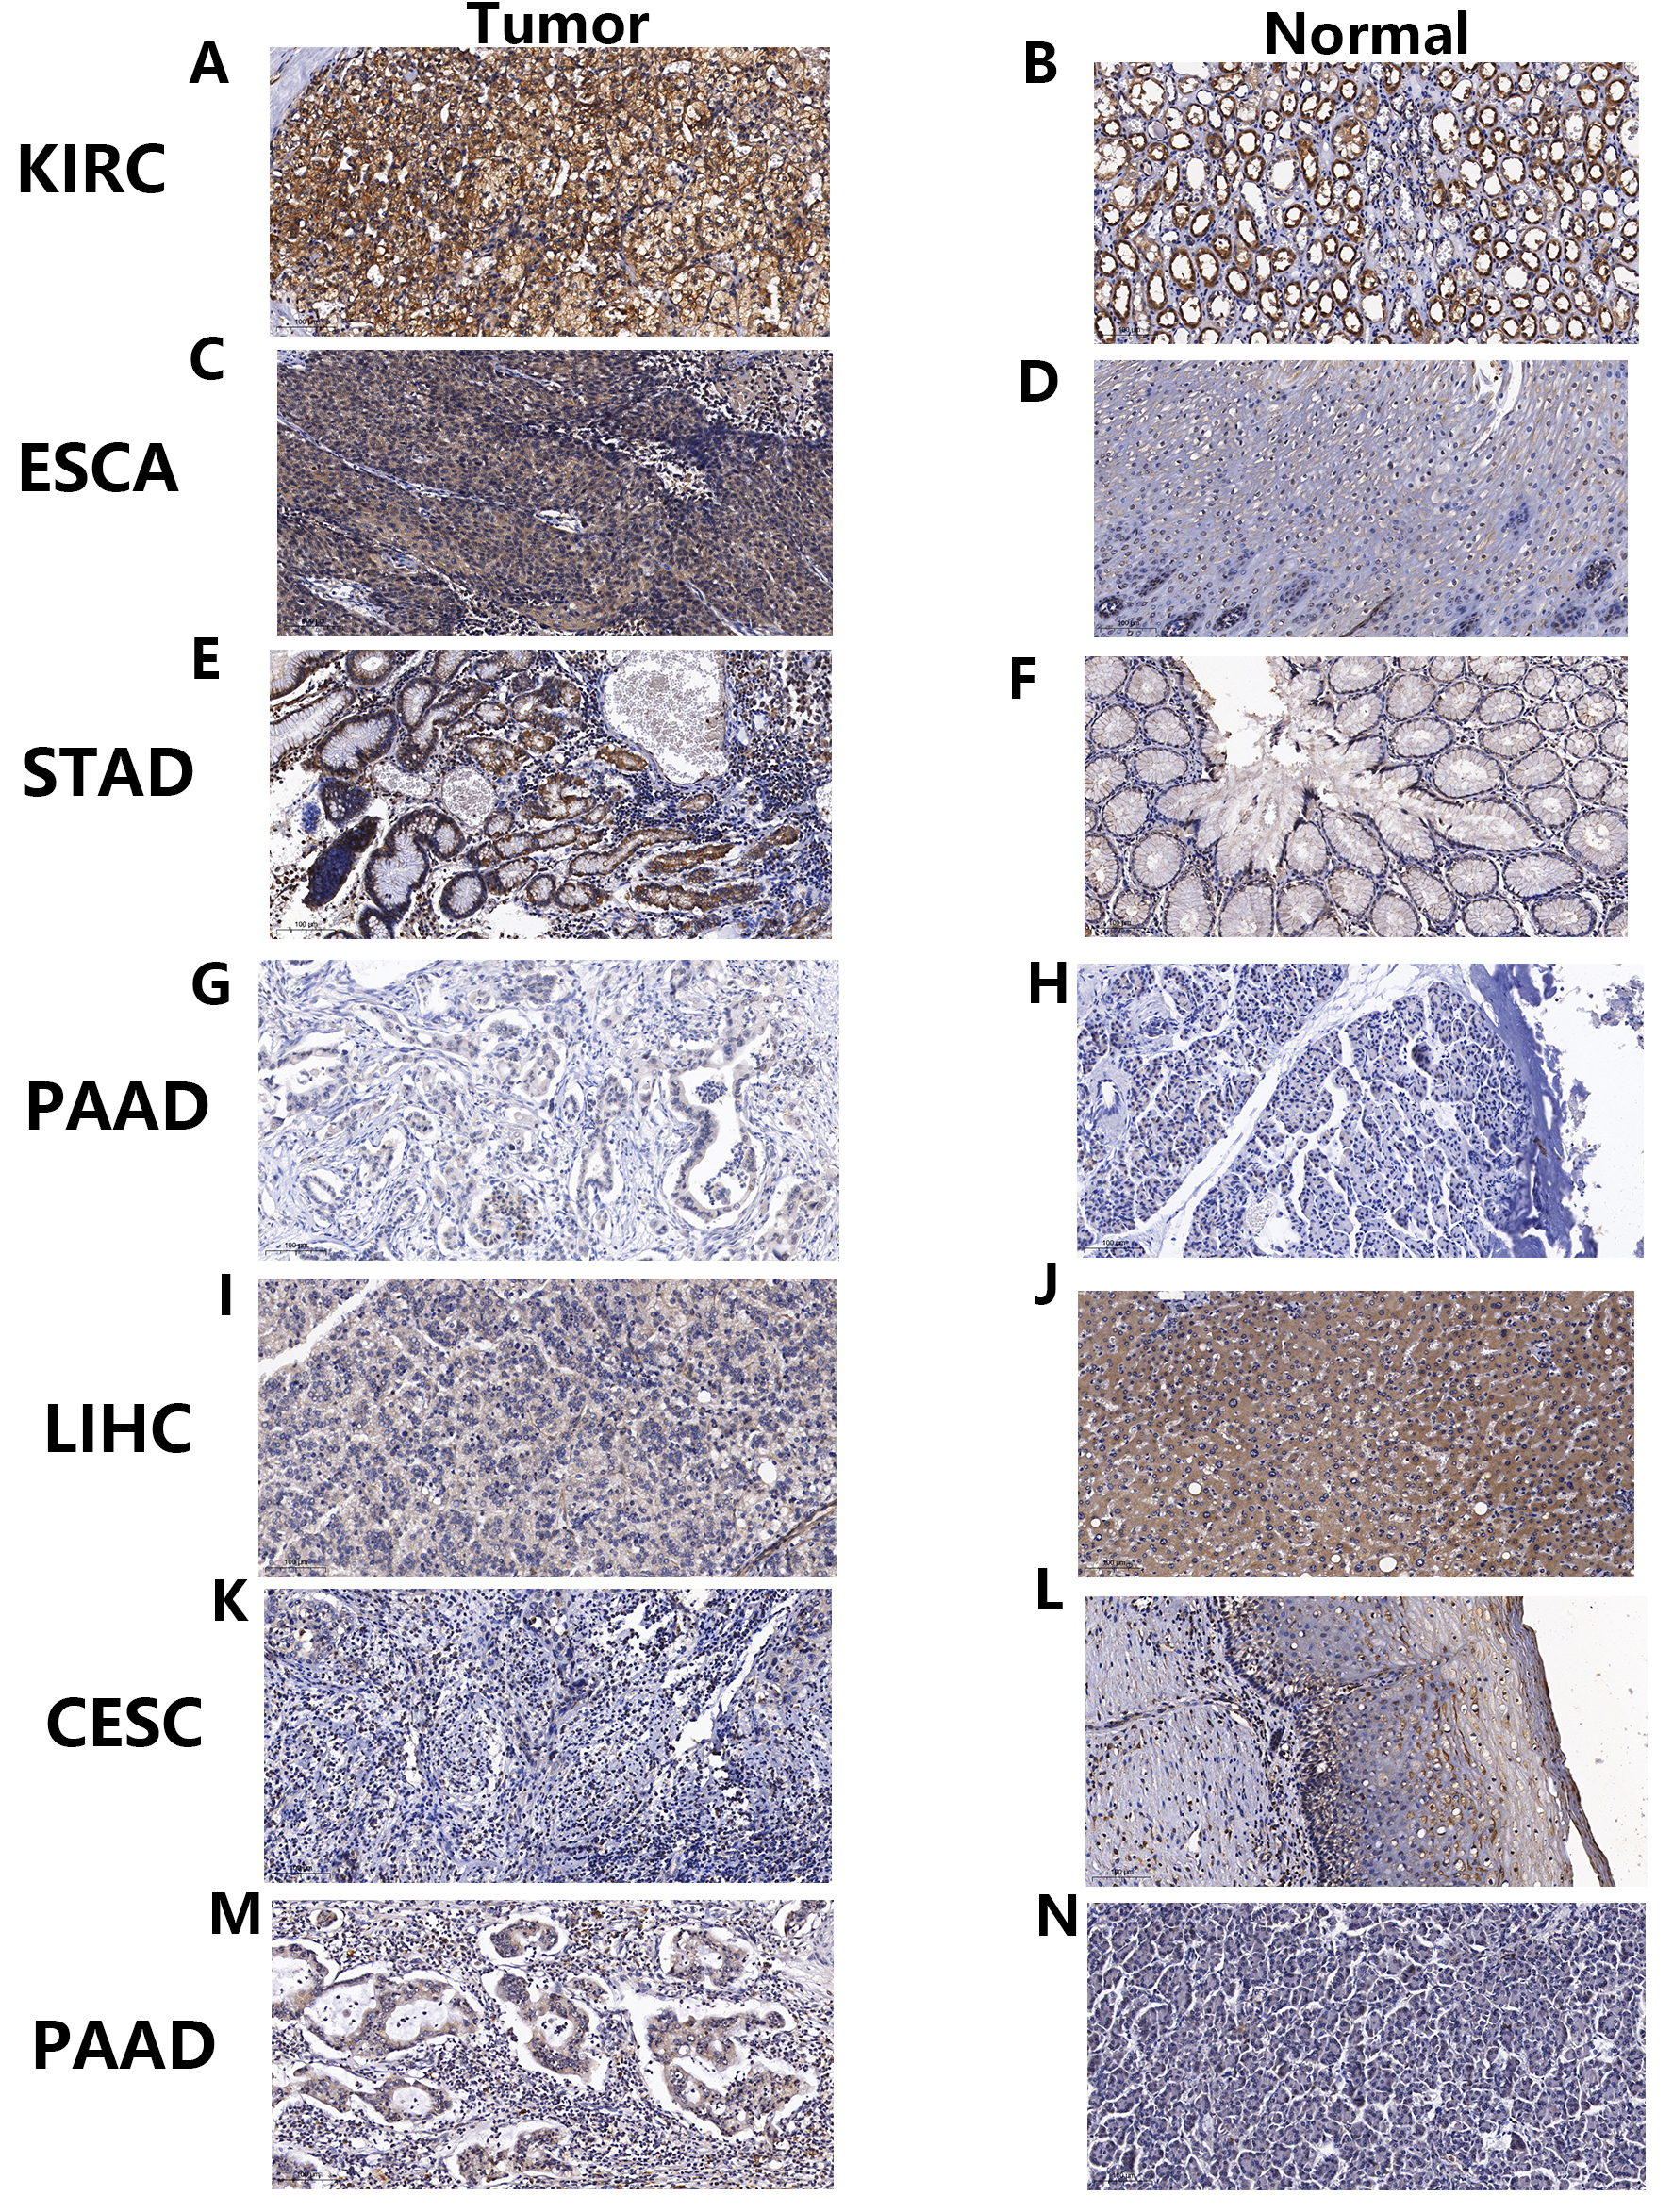 Fig. 11.
Immunohistochemical staining verification of differential mRNA expression analysis results. (A–L) Immunohistochemical staining of ADAMTS2 in tumors and corresponding paracancerous tissues of KIRC, ESCA, STAD, PAAD, LIHC, and CESC. (M,N) Immunohistochemical staining of ADAMTS14 in tumors and corresponding paracancerous tissues of PAAD. KIRC, Kidney renal clear cell carcinoma; ESCA, Esophageal carcinoma; STAD, Stomach adenocarcinoma; PAAD, Pancreatic adenocarcinoma; LIHC, Liver hepatocellular carcinoma; CESC, Cervical squamous cell carcinoma and endocervical adenocarcinoma.
Our initial screening found no chemical compounds that targeted the PNPSA
family. In view of the structural similarity between ADAMTS family members, we
then screened compounds targeting other ADAMTS family members and identified 515
and 1411 potential compounds for ADAMTS4 and ADAMTS5, respectively. From these,
two suitable compounds were selected for drug development based on their
drug-likeness characteristics (Fig. 12A,B). The screening criteria are shown in
Supplementary Table 2. A detailed explanation of each indicator was
obtained from the ADMETab 2.0 database. Molecular docking simulation with
AutoDock Vina was conducted to predict possible binding of PNPSA members to the
two compounds, with the results shown in Table 1. The binding energies of the two
compounds with PNPSA members were all
| Compounds | ||||||
| O=C(CCc1[nH]c(=O)[nH]c1O)N1CCN(C2CCCCC2)CC1 | Cc1ccccc1C1CCN(C(=O)CCc2[nH]c(=O)[nH]c2O)CC1 | |||||
| Targets | ADAMTS2 | ADAMTS3 | ADAMTS14 | ADAMTS2 | ADAMTS3 | ADAMTS14 |
| Active pocket (X,Y,Z) | –11.222 | –0.972 | 3.083 | –11.222 | –0.972 | 3.083 |
| 0.806 | 3.611 | 1.444 | 0.806 | 3.611 | 1.444 | |
| 5.583 | 4.417 | 0.139 | 5.583 | 4.417 | 0.139 | |
| Binding energy (kJ/mol) | –7.899 | –7.005 | –6.681 | –8.528 | –7.164 | –7.154 |
| RMSD/A | 0.769 | 3.383 | 3.325 | 2.107 | 1.904 | 1.954 |
RMSD, Root Mean Square Deviation.
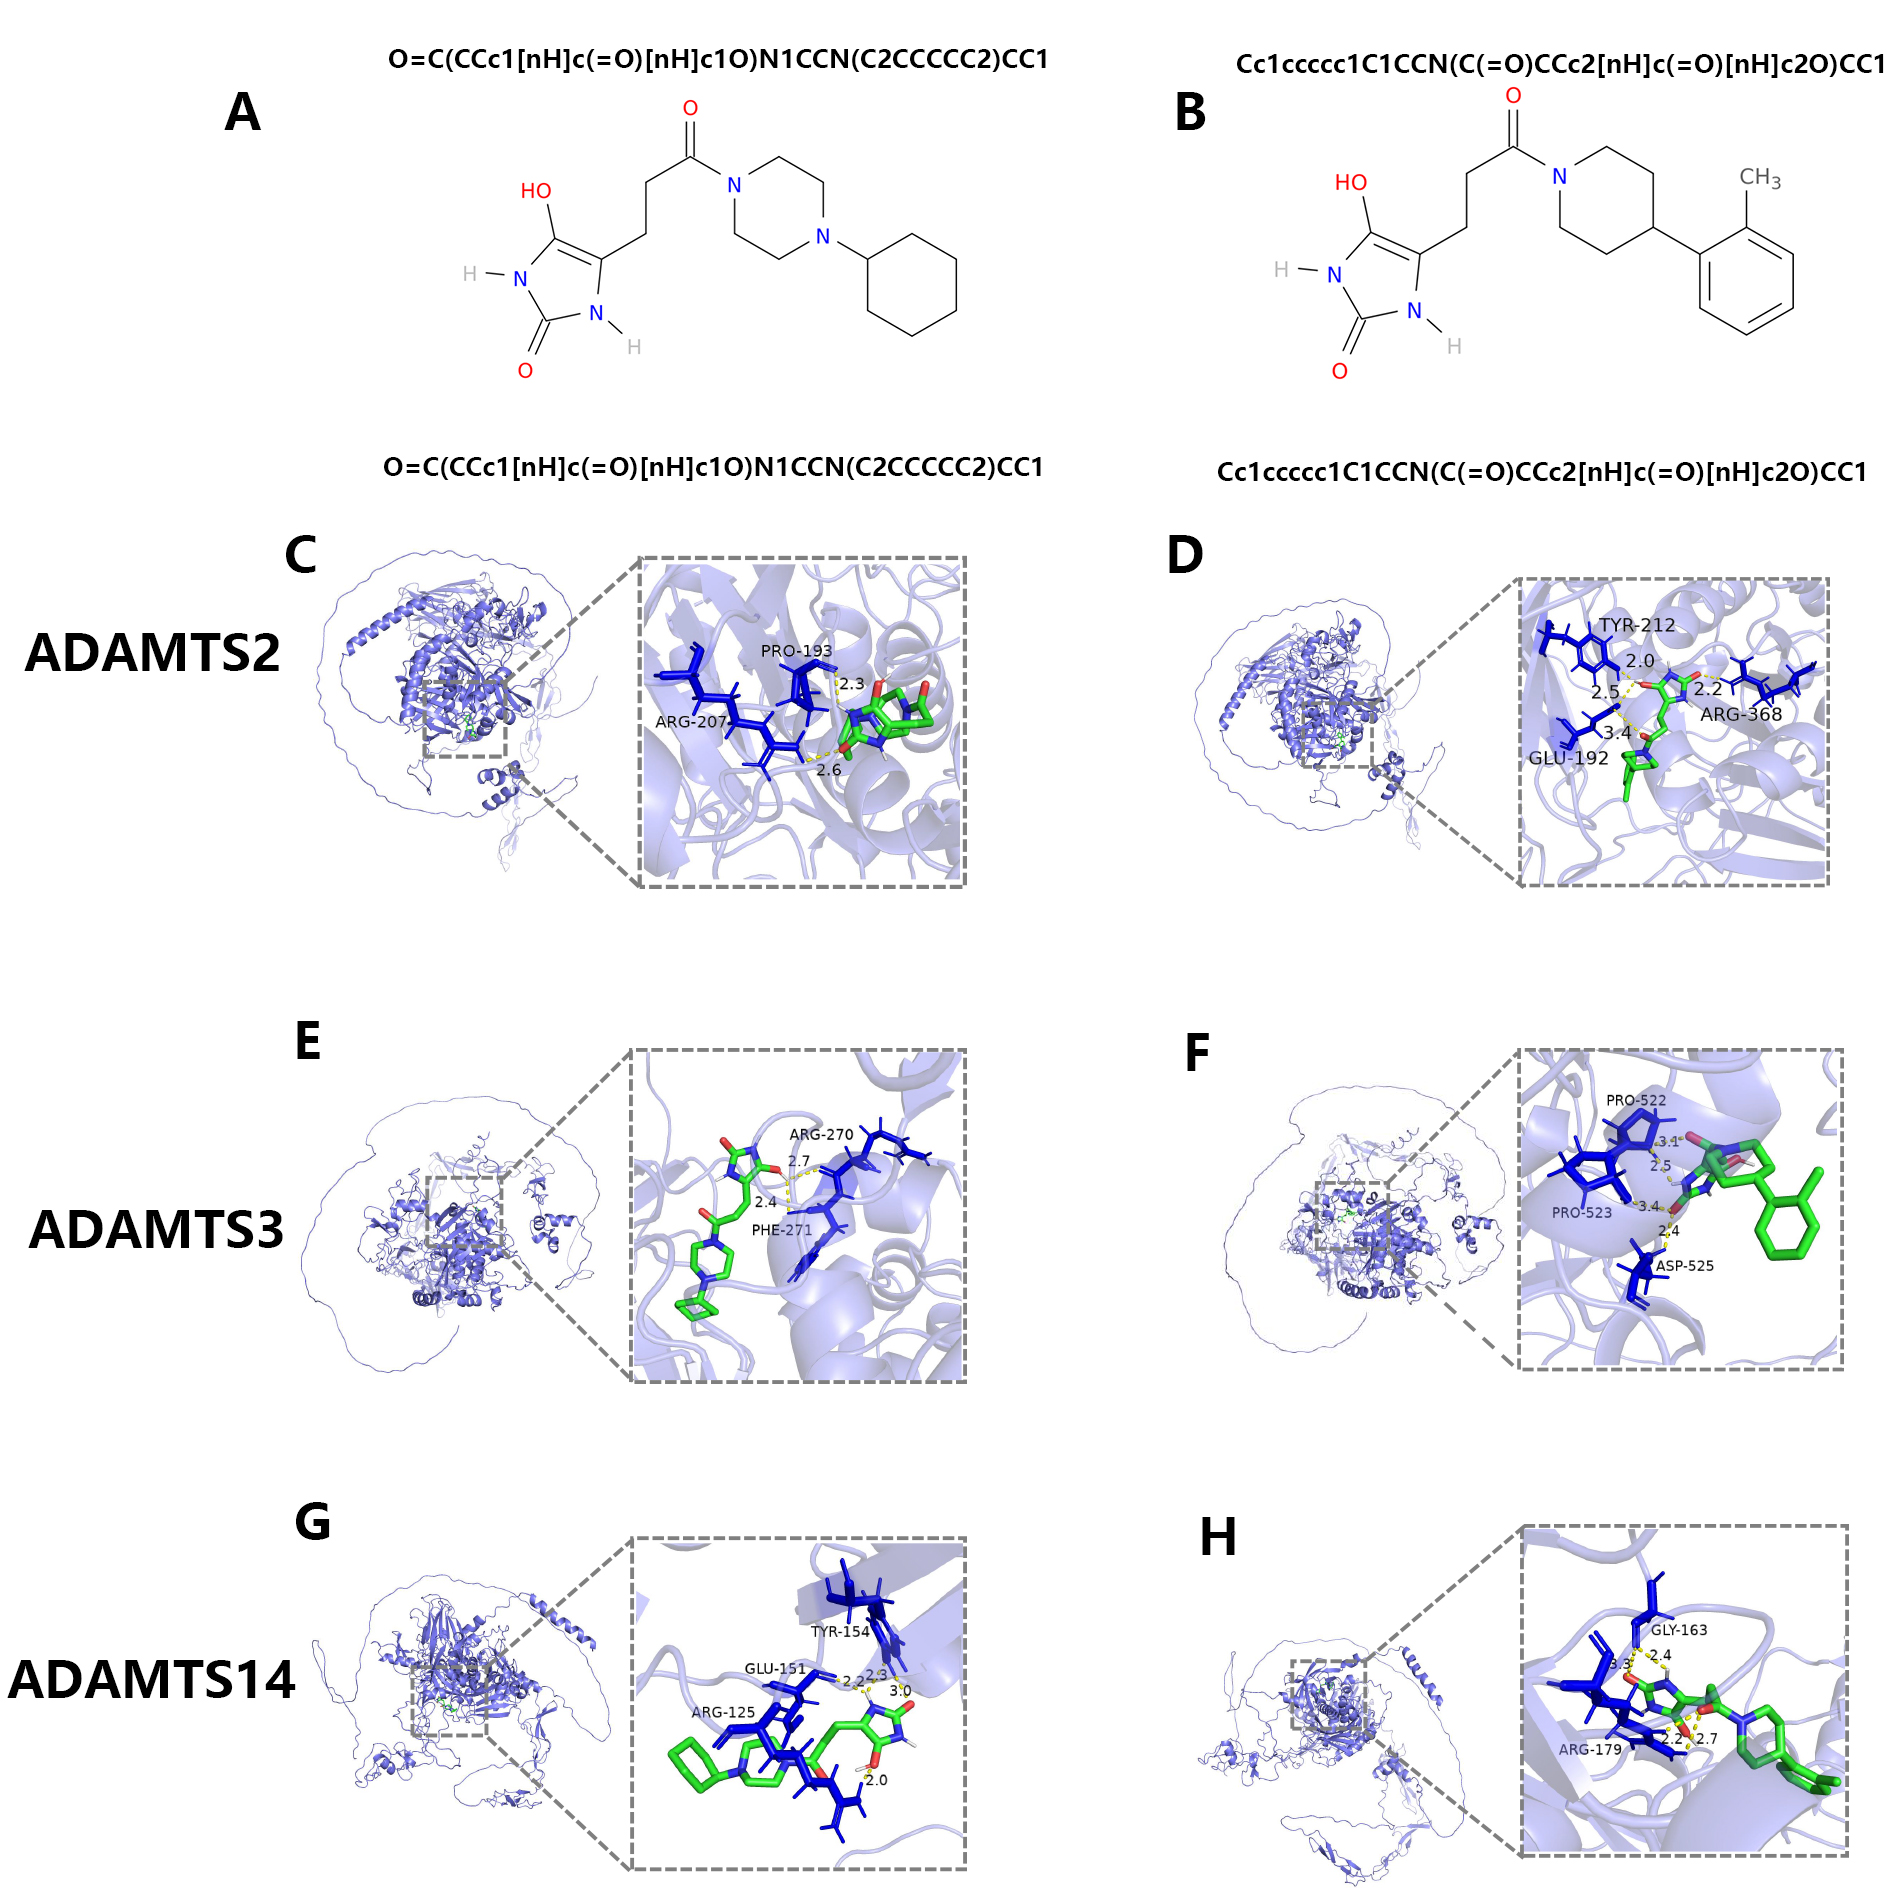 Fig. 12.
The screening of potential anti-tumor drugs targeting PNPSA family members. (A,B) The potential chemical compounds that might interact with PNPSA family members. (C,D) The molecular docking models of the two chemical compounds with ADAMTS2. (E,F) The molecular docking models of the two chemical compounds with ADAMTS3. (G,H) The molecular docking models of the two chemical compounds with ADAMTS14.
The ECM is the acellular component of all tissues and organs and plays a crucial role in tissue development and repair. Changes in homeostasis between the synthesis and degradation of ECM components are thought to correlate with tumorigenesis. Metalloproteinase is a vital proteinase that promotes the degradation of normal ECM components and facilitates its replacement with tumor ECM. This enzyme is known to cause ECM remodeling in tumors and is thus associated with tumorigenesis [1]. Most studies to date have focused on the roles of the MMP and ADAM metalloproteinase families in tumorigenesis, with studies on the ADAMTS family still lacking. Therefore, in the present work we systematically analyzed the prognostic value of the PNPSA gene family in pan-cancer. Different family members were found to play different roles in the various cancer types. Genomic variations in the PNPSA gene family were also found to be widespread in pan-cancer. Single-cell sequencing analysis indicated the PNPSA gene family was expressed not only in fibroblasts but also in tumor cells and some immune cell types. We subsequently developed a GSVA signature based on PNPSA gene sets (ADAMTS2, ADAMTS3, and ADAMTS14) and evaluated its predictive value for patient survival status, TIME landscape, stemness index, and drug sensitivity in 8 cancer types (CESC, COAD, GBM, KIRC, LGG, MESO, UCEC, and UVM). These results deepen our understanding of the PNPSA gene family in tumorigenesis, while also providing new directions for the investigation of novel tumor biomarkers.
ADAMTS2, ADAMTS3 and ADAMTS14 belong to the procollagen N-propeptidase subgroup of ADAMTS. Their main function is to cleave amino-propeptides from fibrillar collagens, thereby promoting collagen fiber production in ECM [41]. The carboxy-terminal region of ADAMTS is highly variable, giving these proteinases unique properties to interact with more substrates in the ECM and on the cell surface [42]. The PNPSA gene family could therefore influence tumor development by regulating angiogenesis, altering cell proliferation, adhesion, and migration, and remodeling the ECM [5]. Depending on the cancer type, ADAMTS may have pro- or anti-tumor roles. Dupont et al. [43] demonstrated that ADAMTS2 and ADAMTS14 are key players in pro-VEGFC processing, which is thought to be critical in lymphangiogenesis. ADAMTS2 and ADAMTS3 may also promote tumor metastasis. A previous study showed that ADAMTS2 expression was significantly increased in gastric cancer cells and tumor-associated fibroblasts compare to normal cells [44]. Moreover, multivariate analysis showed that elevated expression of ADAMTS2 in both the gastric cancer cells and fibroblasts was an independent prognostic factor. Kim et al. [45] reported that ADAMTS3 was involved in the maintenance of glioma cell stemness and was significantly correlated with prognosis. A previous study showed that lower expression of ADAMTS14 was associated with poor prognosis in oral squamous cell carcinoma [46]. In the present study, we also found higher expression of ADAMTS2 in gastric cancer cells than in normal cells. Moreover, ADAMTS2 expression was positively correlated with tumor stage in STAD, with a p-value that approached significance. ADAMTS2 was expressed at high levels in ESCA, HNSC, KIRC, and PAAD compared to corresponding normal tissues, but at low levels in ACC, CESC, LIHC, LUAD, LUSC, OV, PRAD, THCA, UCEC, and UCS. However, ADAMTS3 mRNA expression was not significantly altered in GBM and LGG, and ADAMTS14 mRNA expression was significantly downregulated in HNSC. In addition to changes in the mRNA expression of PNPSA gene family in tumors, we also found widespread genomic variations in pan-cancer. A previous study reported that ADAMTS14 mutations, in combination with environmental risks, strongly influenced the risk of oral cancer [47]. Therefore, genomic variations in the PNPSA gene family could also influence tumorigenesis in pan-cancer.
The TIME is the landscape of immune cells within and surrounding tumor cells [48]. Previous studies have shown that metalloproteinases can influence the activation and migration of immune cells in TIME by interacting with other ECM components [49]. Kang et al. [50] found that macrophages with MMP11 overexpression promoted the migration of HER2-positive breast cancer cells and the recruitment of monocytes. Hammad et al. [51] reported that expression of ADAM on the cell surface committed the differentiation of B cells into marginal zone B cells. Salti et al. [52] found that release of CD154 from the intracellular environment and T cell surface cleavage were highly dependent on ADAM10 or ADAM17, and correlated strongly with B cell proliferation. Similarly, ADAM10 and ADAM17 are involved in the cleavage of CD137 to produce soluble CD137, which may lead to increased T cell proliferation [53]. Wu et al. [54] found that ADAM17 may be a regulatory checkpoint for CD16A, while facilitating the detachment of NK cells from antibody-coated target cells. Metalloproteinases have also been shown to interact with other immune checkpoints, such as PD-L1, LAG3, and TIM3, thereby profoundly influencing the immune response and the efficacy of immunotherapy [55, 56]. New emerging technologies and methods have led to numerous studies focused on metalloproteinases in TIME. However, the involvement of the ADAMTS family in TIME has been much less studied compared to MMPs and ADAMs. Therefore, we systematically analyzed the associations between a vital subgroup of the ADAMTS family and TIME in pan-cancer. mRNA expression and genomic variations in PNPSA gene family members were found to significantly influence the infiltration of various immune cell types. Of note, the CNVs of all PNPSA gene family members were negatively correlated with the level of NK cell infiltration in most cancer types, which may lead to reduced anti-tumor immunity and immunotherapy response. The GSVA score is a signature of PNPSA gene family activity and was found to have some predictive value for both anti-tumor and pro-tumor TIMEs in pan-cancer. This observation indicates the PNPSA gene family can have different roles depending on the cancer type. The current study also evaluated the correlation of PNPSA gene family members with the expression of MHC molecules and immune checkpoints. The expression of ADAMTS2 and ADAMTS14 was found to promote antigen presentation but suppress anti-tumor immune cells in some cancer types. ADAMTS3 also showed a clear dual role in TIME. Overall, these results indicate that PNPSA gene family members have potential immunomodulatory effects.
Cancer stem cells (CSCs) have stem cell-like properties such as self-renewal ability and differentiation potential. CSCs are thought to be closely associated with tumor development and therapeutic resistance [57]. The ECM plays a crucial role in maintaining the plasticity of CSCs through integrin-related signaling pathways [58]. A previous study showed that type-1 collagen may be a vital component of the niche for glioblastoma stem cells (GSCs) by maintaining the adherence of these cells [59]. Kesh et al. [58] reported that type-1 collagen hinders CSC differentiation and promotes the expression of stem cell markers in colorectal cancer. Moreover, abnormal collagen forms crosslinks after ECM remodeling in tumorigenesis generates mechanical pressure that increases its stiffness. Tan et al. [60] suggested that stem cell marker expression in colorectal cancer was enhanced following the activation of YAP in response to greater ECM stiffness. You et al. [61] found that greater ECM stiffness increased the stemness and self-renewal abilities of CSCs, as well as their chemotherapy resistance. However, in the present study the GSVA score was found to be negatively correlated with the stemness index in all 8 cancer types. To further investigate this result, we performed Pearson correlation analysis between the GSVA score and the expression of PROM1 (CD133), which has been widely used as a CSC marker. We obtained different results between these two methods for CESC, COAD, LGG, MESO, UCEC, UVM, and KIRC. The most likely reason is that PNPSA gene family members are responsible for collagen formation, and thus high expression of these genes can increase the ratio of stromal components and decrease the tumor cell ratio. Therefore, the stem index used to represent the CSC ratio showed negative correlations with the GSVA score for the PNPSA gene family. We speculate that analysis of the stem index may not reflect the true association between tumor cell stemness and the GSVA score. Instead, the analysis of PROM1 expression may be more accurate.
The ECM is a complex, interconnected network of macromolecules that supports cells and tissues. It is therefore not surprising that it can also affect the response to cancer therapy [2]. Different mechanisms have been implicated in the anti-cancer drug resistance properties of the ECM. Rice et al. [62] showed that ECM stiffness in pancreatic cancer could induce EMT, leading to chemoresistance. Joyce et al. [63] reported that triple-negative breast carcinoma cells showed ECM stiffness-related resistance to doxorubicin due to the activation of YAP. It was also found that growth factors stored in the ECM were released, thus amplifying the circuitry between tumor cells and ECM and eventually contributing to treatment resistance [64]. In summary, the ECM can influence tumor chemoresistance through multiple pathways. However, the role of the ADAMTS family in regulating ECM remodeling and chemoresistance is not fully understood and relevant studies are still lacking. An observational study found that ADAMTS mutations in ovarian carcinoma were associated with longer patient survival and greater sensitivity to chemotherapy [65]. Arechederra et al. [66] found that ADAMTSL5 may act as a key regulator of tumorigenesis and drug resistance in hepatocellular carcinoma. Abdullah et al. [67] reported that increased methylation of ADAMTSL5 was associated with chemoresistance in lymphoblastic leukemia patients. In the current study, the IC50s for five common chemotherapy drugs were predicted using the oncoPredict R package and then correlated with the GSVA scores in 8 cancer types. As mentioned above, increased ECM stiffness caused by excessive accumulation of collagen fibers can lead to chemoresistance through various pathways. Therefore, GSVA scores could in theory be positively correlated with IC50s in these 8 cancer types. However, GSVA scores were found to have dual impacts on IC50s and on the resistance to five common chemotherapy drugs in the 8 cancer types. This result suggests the PNPSA gene family may influence chemoresistance through other mechanisms, such as by activating non-ECM stiffness-related signaling pathways, or by interacting with specific inflammatory factors without altering ECM stiffness. This finding and the possible associated mechanism require further experimental verification. Immunotherapy is another important treatment choice for cancer patients, especially those with late-stage disease. Unfortunately, only a minority of patients benefit from immunotherapy [68, 69] and novel biomarkers of efficacy are therefore urgently required. We analyzed the predictive value for immunotherapy response of the GSVA score for the PNPSA gene family in 8 cancer types. The TMB, MSI, and TIDE score algorithms indicated the GSVA score may have predictive value for immunotherapy response in UCEC, COAD, and KIRC. A higher GSVA score was associated with poorer responsiveness to immunotherapy in these cancer types. However, this result was obtained with public databases and additional clinical cohorts are needed for verification.
To more accurately identify the cell subgroups that express the PNPSA gene family, we also analyzed single-cell sequencing results in the scTIME portal database. Interestingly, members of the PNPSA gene family were expressed not only in fibroblasts but also in tumor cells, immune cells and endothelial cells. This observation suggests the accumulation of ECM collagen fibers might result from the synergistic action of multiple cell types. We also analyzed KEGG enrichment pathways in the 8 cancer types. Several pathways related to tumorigenesis were found to be enriched, including the PI3K-Akt, AGE-RAGE, and NF-kappa B signaling pathways. Therefore, experiments designed to investigate possible associations between the expression of key genes in these signaling pathways and the PNPSA gene family may be more meaningful.
Most of the results obtained in this study were based on data from earlier research or programs, and hence there may be potential biases. The accuracy of the data could obviously influence the reliability of the results. Tumor mRNA transcript data in the HPA database is derived mainly from the TCGA database, while the mRNA data for normal tissue is based on the GTEx database. The DNMIVD database is based on methylation data and clinical information from the TCGA. These data were normalized before analysis for differential expression, expression of methylated quantitative trait loci, etc. The GEPIA2.0 database integrates gene expression data from the TCGA and GTEx databases and performs some routine analysis. The cBioPortal database screens almost all types of data from the TCGA, including mRNA expression, gene mutation, CNVs, and even protein/phosphoprotein levels. The TISIDB database extracts immune-related data from the TCGA and performs correlation analysis. The data mentioned above are mainly from the TCGA and GTEx databases. The TCGA database was based on the cancer genome atlas project, with tumor samples collected from hospitals worldwide and with a large sample size. Therefore, gene-related data from the TCGA is likely to be representative. The GTEx database collected gene expression information from normal tissues. Integrated analysis based on the TCGA and GTEx databases helps to reduce statistical error. However, these data are all retrospective, as are the analyses from the online databases. Some of the common biases encountered in retrospective studies, such as confounding bias, were therefore unavoidable in the current study. Moreover, results obtained for several TCGA tumor types with small sample sizes may be due to chance, e.g., the results for CHOL compared to tumor types with a large sample size. Such results require verification in further studies with a larger sample size. The TIMER 2.0 database was used here to estimate immune cell ratios. A possible bias with this mRNA bulk sequence method is tumor purity. However, we minimized this bias by using the tumor purity adjustment tool in the TIMER 2.0 database. The scTIME database provides a single-cell atlas across different tumor types. It is based on data from the Gene Expression Omnibus (GEO), which performed standard single-cell transcriptome sequencing analysis. Considering the different sequencing platforms and data construction methods used, we obtained results from each single dataset.
The GSVA method requires synergistic input genes to decrease bias and errors.
ADAMTS2, ADAMTS3, and ADAMTS14 were used in the current study to perform GSVA
analysis. Because they are all members of the PNPSA family, these genes are
highly correlated, thus limiting the bias of GSVA. The GDSC database mainly
stores information on the drug sensitivities of cell lines grown in
vitro. However, the RNA-seq data was based on analysis of tumor tissue
in vivo. Hence there is undoubtedly some bias in predicting clinical
drug sensitivities with the oncoPredict R package based on the GDSC database,
since the properties of in vivo tumor cells are different to those of
in vitro tumor cells. The results are therefore an estimation only and
further studies are needed. The immune correlation and KEGG enrichment results
were not corrected statistically for multiple testing, which might increase the
risk of Type I error. Although correction for multiple tests can increase the
statistical power, we found that many significant results disappeared following
the correction. This study aimed to provide a comprehensive pan-cancer analysis
of the PNPSA gene family. As in previous studies [38, 39, 40], we set an uncorrected
p-value (
Data for the 8 cancer types were downloaded from UCSC Xena (https://xena.ucsc.edu) and a series of quality control measures and steps were performed to minimize the biases. First, the paracancerous tissue samples were deleted, thereby improving the reliability and stability of results. Second, duplicate gene symbols were deleted and the one with the highest average expression across all samples was kept to maximize the retention of gene expression information in the 8 cancer types. This measure decreased the calculation error in the later bioinformatics analyses caused by duplicate gene symbols. Third, the raw FPKM data was normalized by log2(FPKM+1) to avoid the influence of extreme expression values in the bioinformatics analysis.
Finally, we performed immunohistochemical verification of the expression of PNPSA gene family members in several common solid tumors. The experimental verification results were consistent with the results for differential mRNA expression analysis. However, the full experimental verification of PNPSA gene family expression is still incomplete and requires additional study. Importantly, the results of our analysis provide avenues for further experimentation, and this work is being continued by our group in additional research projects. Therefore, we anticipate the current results will be validated and extended by more experimental data in the near future.
We systematically analyzed the expression landscape, genomic variations, prognostic value, and cell expression subgroups of PNPSA gene family members in pan-cancer. Importantly, we also analyzed associations between the expression and genomic variations of PNPSA gene family members with TIME and immune-related molecules in pan-cancer. The prognosis for overall survival in 8 cancer types was found to be significantly associated with the activity of the PNPSA gene family. Subsequently, we calculated the GSVA score based on the PNPSA gene family and evaluated its predictive value for patient survival, TIME, and the drug sensitivities of 8 cancer types. The potential signaling pathways associated with the PNPSA gene family in these cancers were also revealed through KEGG analysis. As far as we are aware, research that focuses on the relationship between ADAMTS and cancers are still lacking. Therefore, our study provides a deeper understanding of the role of ADAMTS in tumorigenesis, as well as possible directions for further experiments to explore novel tumor biomarkers. The conclusions in this study require confirmation with more experiments and clinical cohorts.
Full names of TCGA tumor abbreviations are included in Supplementary Table 1; ECM, Extracellular matrix; MMPs, Matrix metalloproteinases; ADAMs, A disintegrin and metalloproteases; ADAMTS, ADAMs with thrombospondin motifs; PNPSA, Procollagen N-propeptidase subgroup of ADAMTS; TIME, Tumor immune microenvironment; GSVA, Gene Set Variation Analysis; KEGG, Kyoto Encyclopedia of Genes and Genomes; CNVs, Copy number variations; EMT, Epithelial-mesenchymal transition; HPA, Human Protein Atlas; GEPIA, Gene Expression Profiling Interactive Analysis; TCGA, The Cancer Genome Atlas; GTEx, Genotype-Tissue Expression Project; DNMIVD, DNA Methylation Interactive Visualization Database; TIMER, Tumor Immune Estimation Resource; scTIME, Single-cell tumor immune microenvironments; TIDE, Tumor Immune Dysfunction and Exclusion; ROC, Receiver operating characteristic; GDSC, Genomics of Drug Sensitivity in Cancer; CSCs, Cancer stem cells; OS, Overall survival; DFS, Disease-free survival; mRNAsi, MRNA expression-based stemness index; TMB, Tumor mutation burden; MSI, Microsatellite instability.
The datasets analyzed during the current study are available in the UCSC Xena (https://xena.ucsc.edu) and a previously published article [32].
All authors contributed to the study’s conception and design. YC, QF, CX, and YZ performed the analysis project of the software and finished the experiments. YZ, QH, QF, CX, and YO collected experimental materials and data. QF, YC, CX, and QH wrote and revised this article. YO, YZ, and QF provided funding support. All authors read and approved the final manuscript. All authors have participated sufficiently in the work and agreed to be accountable for all aspects of the work.
This study was approved by the Ethics Committee at the First Affiliated Hospital of Chongqing Medical University (approval No. 2020-049). All participants provided written informed consent.
We sincerely thank all the researchers who uploaded the data to the database and provided downloading.
This work was supported in part by the grants from The National Natural Science Foundation of China (No. 82172682), Chongqing Science and Technology Commission (No. CSTB2023NSCQ-MSX0472), Chongqing Graduate Research Innovation Project (CYB23197), First-class Discipline Construction Project of the First Affiliated Hospital of Chongqing Medical University (No. CYYY-BSYJSCXXM-202207, No. CYYY-BSYJSCXXM-202304).
The authors declare no conflict of interest.
Publisher’s Note: IMR Press stays neutral with regard to jurisdictional claims in published maps and institutional affiliations.