


1 All-Russia Research Institute of Agricultural Biotechnology, 127550 Moscow, Russia
2 Biological Department, M.V. Lomonosov Moscow State University, 119991 Moscow, Russia
Abstract
Background: Salt stress is a multicomponent phenomenon; it includes many processes that directly or indirectly affect the plant. Attempts have been made to comprehensively consider the processes of salt stress in plants Triticum aestivum (variety Orenburgskaya 22) and Triticum durum (variety Zolotaya). Methods: The study used methods of light and fluorescence microscopy, methods of immunofluorodetection, expression of DNA methyltransferase genes, genes of the ion transporter and superoxide dismutase families, as well as biochemical determination of total antioxidant activity using the 2,2-diphenyl-1-picrylhydrazyl (DPPH) reagent. Results: According to morphometric indicators, the Orenburgskaya 22 variety showed greater tolerance to the action of 150 mM NaCl than the Zolotaya variety. The level of expression of genes of the HKT ion transporter family in the Orenburgskaya 22 variety is higher than in the Zolotaya variety. It was found that the expression of the DNA methyltransferase gene DRM2.1, which post-translationally methylates cytosine residues, is 22.3 times higher in Zolotaya compared to Orenburg 22 when exposed to salt. The accumulation of toxic ions is accompanied by an increase in reactive oxygen species (ROS) and increased damage to root tissue, especially in the Zolotaya variety. Using fluorescence microscopy using the Carboxy-H2DFF marker in the Orenburgskaya 22 variety at high NaCl concentrations, the highest fluorescence intensity was determined in the cap zone; in the Zolotaya variety—in the zones of the cap and root meristem. Excess ROS is more successfully removed in the Orenburgskaya 22 variety, which has a higher level of antioxidant activity (AOA), as well as the level of expression of the Cu/ZnSOD and MnSOD superoxide dismutase genes. Using programmed cell death (PCD) markers based on the release of cytochrome c from mitochondria into the cytoplasm, DNA breakage and the release of phosphatidylserine from mitochondria, the degree of damage to root cells was assessed in both wheat varieties. It has been proven that wheat cell death occurs through the mitochondrial pathway. It was noted that the salt-sensitive variety Zolotaya had a significant number of necrotic cells. Conclusion: Based on the data obtained, it was concluded that the Orenburgskaya 22 variety exhibits greater resistance to salinity than the Zolotaya variety. These data may be of practical importance for enhancing protective mechanisms under abiotic stress.
Keywords
- salt stress
- apoptosis-like
- ROS
- AOS
- HKT
- DNA methyltransferases
- Triticum aestivum
- Triticum durum
Plants are organisms that lead a predominantly fixed lifestyle, so they have to develop mechanisms to deal with stress. One of the most common abiotic stresses is salt stress. Salt stress, like other abiotic stresses, significantly affects the yield and quality of agricultural products [1, 2]. Under climate change conditions, there is a tendency to increase arable land with excess salinity as a result of secondary salinization processes, which impedes the effective use of areas for crops.
Plants have the ability to respond to environmental changes and overcome abiotic stress by activating various defense mechanisms [3]. Salt stress is a complex phenomenon, the main consequences of which are disruption of the osmotic and ionic balance of the cell. In addition to the disturbance of osmotic stress, oxidative and intoxication stress occurs, which aggravates the situation of the plant. These stress factors are accompanied by various disturbances in physiological functions, which leads to impaired plant growth, and with stronger and longer exposure to an abiotic stressor, to plant death. The concept of “salt tolerance” includes many mechanisms and factors. Plants of even the same family can have different mechanisms: some are highly resistant to osmotic stress and neutralize toxic ions, others have a powerful antioxidant system that eliminates reactive oxygen species (ROS), the excess of which can lead to oxidative stress [4]. The above effects lead to decreased plant growth, which may be associated with impaired metabolic and physiological functions. These include decreased ability to absorb water and nutrients, membrane dysfunction, and disruption of vital processes such as photosynthesis, respiration, and protein synthesis [5].
Abiotic stress causes chromatin remodeling, leading to marked changes in the transcriptome. Changes in chromatin compaction may correlate with the intensity and duration of the negative effect [6]. The nature and extent of possible damage depends on the type of plant; in susceptible species, severe chromatin condensation and margination may occur upon severe exposure. One of the most important epigenetic markers is DNA methylation. DNA modifications during abiotic stress can be reversible and most often involve gene inactivation. Chronic exposure to an abiotic stressor can lead to irreversible DNA methylation and become a heritable epigenetic mark, which will be manifested in plant resistance to this stressor. Demethylation of functionally inactive genes due to exposure to abiotic stresses can initiate their expression [7].
The negative impact of stress factors on a plant is determined by the strength of the influence of this factor, the duration of the impact, and also depends on the stage of plant development [8]. Plants show the greatest sensitivity to the effects of any stress at the stage of seed pecking, during initial development and during budding. Plant tolerance to the negative effects of abiotic stress is determined by its ability to quickly acclimatize and adapt. Plant resistance to salinity is formed through a combination of specific and general protective mechanisms aimed at ensuring stable metabolism in ontogenesis. If a plant lacks certain mechanisms of tolerance to a stressor, serious cell damage occurs in it, which ultimately leads to the death of the plant.
Under salt stress, intoxication is observed as a result of the accumulation of
sodium Na
In plants, several important Na
A characteristic picture of a stress event in a plant is the accumulation of
reactive oxygen species (ROS). While low levels of ROS function as signaling
molecules, higher levels of ROS, called oxidative stress, can cause damage to
macromolecules and can have harmful effects on the cell. The formation of excess
ROS can be caused by the release of electrons through the mechanisms of
catabolism and anabolism, for example, from the photon trap during
photosynthesis, as well as changes in transpiration [4]. Thus, clearance of these
damaged macromolecules is essential for cell survival [19]. To combat radicals in
the plant, the antioxidant system (AOS) is activated, which is a complex of
enzymatic and non-enzymatic components aimed at maintaining cellular homeostasis,
which is so necessary for the growth and development of the plant. Superoxide
dismutase (SOD), which catalyzes the decomposition of O
In the absence or damage of one or another protective mechanism, as a result of the negative effects of salt stress, a significant number of cells die, which can ultimately lead to the death of the entire plant. Programmed cell death (PCD) is a necessary process of the cell cycle [24, 25]. Plants use PCD both during the development of the organism (for example, during xylem formation, seed germination, prevention of self-pollination, and aging) and in response to stress. The main indicators of PCD are DNA fragmentation, release of cytochrome c from mitochondria, cell compression, generation of reactive oxygen species, and exposure to phosphatidylserine [26, 27]. According to the PCD classification, there are two main types of cell death: vacuolar cell death, which includes the process of autophagy and takes place in vacuoles, and necrotic cell death, which is carried out by rapid rupture of the plasma membrane and disruption of mitochondrial functioning [28]. When exposed to abiotic stressors in sensitive plants, cell death predominantly occurs through the necrotic pathway. However, there are a number of examples of PCD in plants when a combination of signs of both vacuolar and necrotic death is observed.
In recent years, many researchers have pointed out the importance of the regulation of oxidative stress and the role of local and systemic ROS signaling in response to an abiotic stressor [27, 29]. However, despite these studies, many questions remain about the mutual activation of the two components (enzymatic and non-enzymatic) of the AOS in different plants in response to various abiotic stresses. The accumulation of ROS in plants causes oxidative damage to cells, which leads to various types of PCD. The study of the molecular mechanisms of PCD in plants has not been as thoroughly studied as in animals and requires a more comprehensive study. The study of the mechanisms of resistance to salt stress will be carried out in different wheat varieties, Triticum aestivum and, Triticum durum. An attempt will also be made to elucidate the role of methylation of HKT family genes in the process of salt stress tolerance in different wheat genotypes [30].
Abiotic stress also induces chromatin remodulation, leading to marked changes in the transcriptome. Changes in chromatin compaction may correlate with the intensity and duration of the negative effect [31, 32]. The nature and extent of possible damage depends on the plant species; in susceptible species, severe condensation and marginalization of chromatin may occur under extreme exposure. Another epigenomic event during abiotic stress is the modification of histones and nucleic acids themselves; such modifications can be reversible and can be associated with the inactivation and activation of genes. Demethylation of functionally inactive genes due to exposure to abiotic stresses can initiate their expression, but methylation more often leads to the loss of a trait than to the emergence of resistance.
The purpose of this study is a comparative study of the mechanisms of resistance to salt stress in different varieties of wheat. Triticum aestivum and Triticum durum. An attempt will be made to elucidate the role of methylation of genes of the HKT family in the process of resistance to salt stress in different wheat genotypes.
In this study we used two varieties of wheat, Triticum durum
Desf. Zolotaya (2n = 28) and Triticum aestivum L.
Orenburgskaya 22 (2n = 42), both of them originate in the Orenburgskaya 22
Research Institute of Agriculture of the steppe ecological group (FSBIS
Scientific Center of the Russian Academy of Sciences, Orenburg, Russia). Plants
were grown in paper rolls in the presence of 150 mM NaCl, conditions of growth:
osmotic pressure of 6 atm, temperature 24 °C, 10-h light/14-h dark
photoperiod, fluorescent lamps (500 lux). Seedlings were analyzed after
6 days of growth, and assessed plant biomass, root, and shoot (Fig. 1). Data are
presented as standard deviation (SD; n = 50), confidence level p
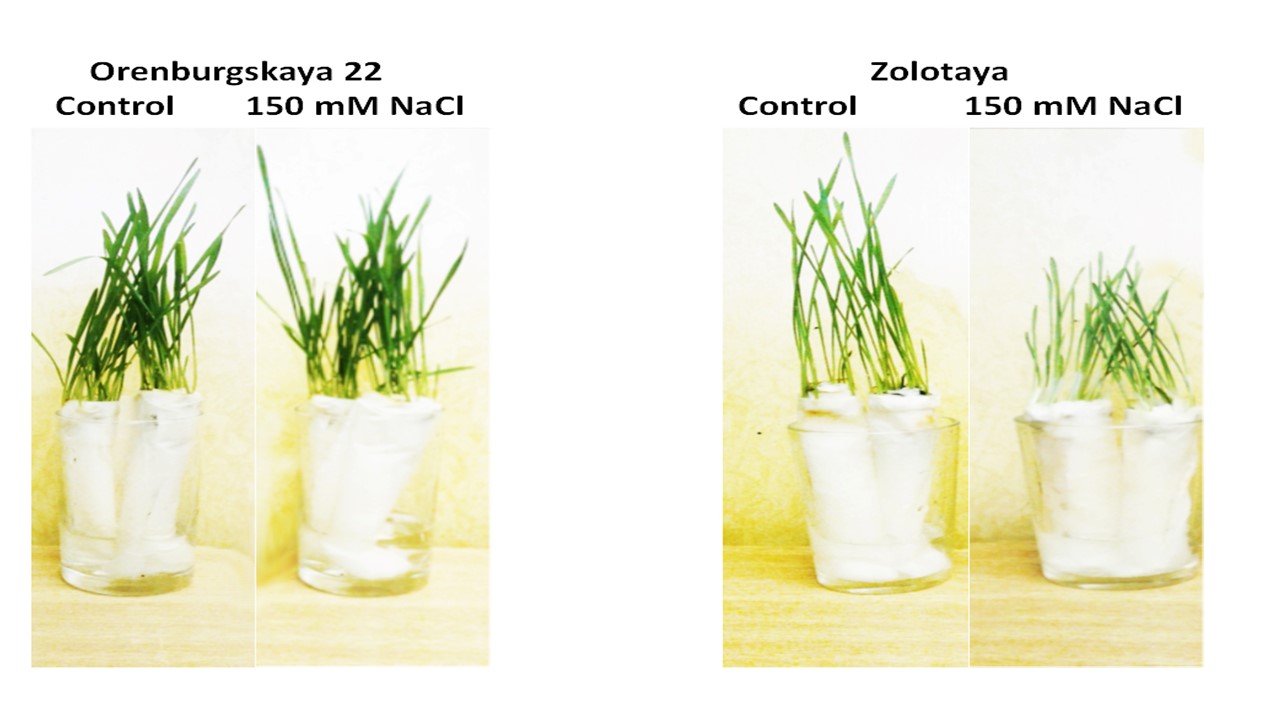 Fig. 1.
Roll culture of wheat.
Trypan Blue staining for 6-day-old seedlings, exposure to 0.5% trypan blue was
5 minutes and washed three times. Microscopy was carried out using Olympus BX5
(10
Root tips of young seedlings, the length of which reached approximately 4–5 mm, were taken for microscopy. Five samples were placed in a drop of water on a glass slide. For analysis of ROS, exposure was 30 minutes in 25–50 nM carboxy-H2DFFDA (Thermo Fisher Scientific, Waltham, MA, USA), followed by washing with triple distilled water. For microscopy, an Olympus BX51 fluorescent microscope, lens x10, wavelength 490 nm was used. Photos taken by Color View (Germany).
In this experiment, the root apex segments of 6-day-old seedlings measuring 15 mm were fixed in a solution containing 4% paraformaldehyde in PHEM buffer with a pH of 6.9. The fixation process took place for approximately 2 hours at room temperature, after which the fixative was washed off using PHEM buffer. To prepare macerated cell preparations, the fixed root tips were then incubated in a solution of 0.4 M mannitol containing 1% cellulase and 5 mM EGTA for 10–15 minutes. Subsequently, they were washed twice for 10 minutes each in PBS buffer. The root tips were then transferred to a drop of buffer on a coverslip and separated into individual cells using metal needles. The resulting preparations were dried at +4 °C for 24 hours.
To identify cells undergoing programmed cell death (PCD) in the root tissue under salinity conditions, phosphatidylserine was detected using the Xpert Annexin V-FITC Apoptosis Detection Assay (Grisp, Porto, Portugal). The cells were washed three times for 5 minutes each and transferred to drops of propidium iodide solution. After washing twice for 5 minutes, the cells were mounted in Mowiol U-44 supplemented with DAPI (4,6-diamidino-2-phenylindole).
The TUNEL (terminal deoxynucleotidyl transferase dUTP nick end labeling) method
has been used to detect nuclear DNA breaks. Samples with macerated cells were
permeabilized in a 0.5% Triton
To detect cytochrome c, the preparations were first placed in a PHEM buffer for
5 minutes. Then, they were transferred to a solution of 0.5% Triton x-100 in
PHEM buffer containing 5% dimethyl sulfoxide (DMSO) for 30 minutes. After that,
the preparations were washed with PBS, pH 7.4, and incubated for 18 hours with
rabbit polyclonal. Following incubation, the preparations were washed and
incubated with goat anti-rabbit immunoglobulin (IgG) antibodies conjugated with
Texas Red (Sigma, Livonia, MI, USA) at a dilution of 1:25 for 45 minutes at 37
°C. After further washing, the preparations were stained with DAPI and
enclosed in Mowiol U-88 (Hoechst). The analysis of all prepared samples
was performed using an Axiovert 200M microscope (Zeiss, Jena, Germany) equipped with
epifluorescent illumination and a Neofluar
DNA was isolated from roots and coleoptiles according to the DNA-Extran protocol (Synthol, Moscow, Russia) and visualized using electrophoresis in a 1.2% agarose gel.
Total RNA was isolated from individual shoots and roots using RNA-Extran reagent kits (Syntol) following the provided instructions. Subsequently, cDNA was synthesized from the isolated RNA using a standard reverse transcription method (Synthol, Russia).
Gene expression analysis was conducted by amplifying the cDNA through real-time polymerase chain reaction (RT-PCR) using SYBR Green I as the fluorescent dye (Syntol) on a CFX 96 Real-Time System Thermal Cycler (BioRad, Hercules, CA, USA). Information regarding the structure of Triticum aestivum genes was obtained from the National Center for Biotechnology Information (NCBI). Gene-specific primers were designed using NCBI Primer-BLAST and synthesized by Synthol. The RT-PCR reaction conditions comprised an initial denaturation step at 95 °C for 5 minutes, followed by 34 cycles of denaturation at 94 °C for 30 seconds, annealing at 60 °C for 1 minutes, and extension at 72 °C for 3 minutes. Each RT-PCR reaction was performed in triplicate.
Antioxidant activity (AOA) was determined by measuring the decrease in
coloration of a 5
To calculate the main statistical indicators, programs for statistical data
processing Statistica 6.0 and STATAN were used. The values used for analysis were
the mean values
NaCl-mediated salinity causes many specific responses in germinating seeds. Salt stress inhibits seed swelling, interferes with seed pecking, and, at a later stage, causes changes in both the root system and the aboveground portion of the plant. It also causes changes in both root system and shoot growth at later stages. Despite the varying degrees of stress effects on various growth processes and the varying tolerance of particular varieties, the end result in any case is that root and shoot growth is inhibited [8]. The strength of expression of these indicators can be used to determine the effect of salt toxicity on plant development.
In our experiments, we examined the effect of 150 mM NaCl on two wheat varieties, Zolotaya (Triticum durum) and Orenburgskaya 22 (Triticum aestivum). Salt stress reduced shoot growth 1.15-fold in Orenburgskaya 22 and 1.91-fold in Zolotaya. Changes in the root system under salt stress were less drastic: root length decreased 1.06-fold in Orenburgskaya 22 and 1.24-fold in Zolotaya (Table 1).
| Wheat variety | Orenburgskaya 22 | Zolotaya | ||
| Control | 150 mM NaCl | Control | 150 mM NaCl | |
| Shoot height (cm) | 17.64 |
15.31 |
16.46 |
8.62 |
| Seedling length (cm) | 29.38 |
26.4 |
27.91 |
17.4 |
| Root length (cm) | 11.74 |
11.09 |
11.45 |
9.26 |
Data were obtained from three repetitions. Data are expressed as means
The HKT family of ion transporter proteins have a common characteristic structure consisting of three units: transmembrane domain-pore domain-transmembrane domain. It is customary to distinguish two classes of HKT — HKT1 and HKT2; the division into two groups is due to both functional and structural differences. Structurally, they differ in the presence of either a serine residue or a glycine residue in the first loop of the pore, which determines specific ionic conductance.
Proteins of the HKT family have a high percentage of
The expression of genes of the first class is associated with salt tolerance,
while the second class facilitates the absorption of Na
We found that the expression profile of HKT1.3 in Orenburgskaya-22 is higher than in Zolotaya, while HKT2.1, on the contrary, is expressed higher in Zolotaya (Fig. 2).
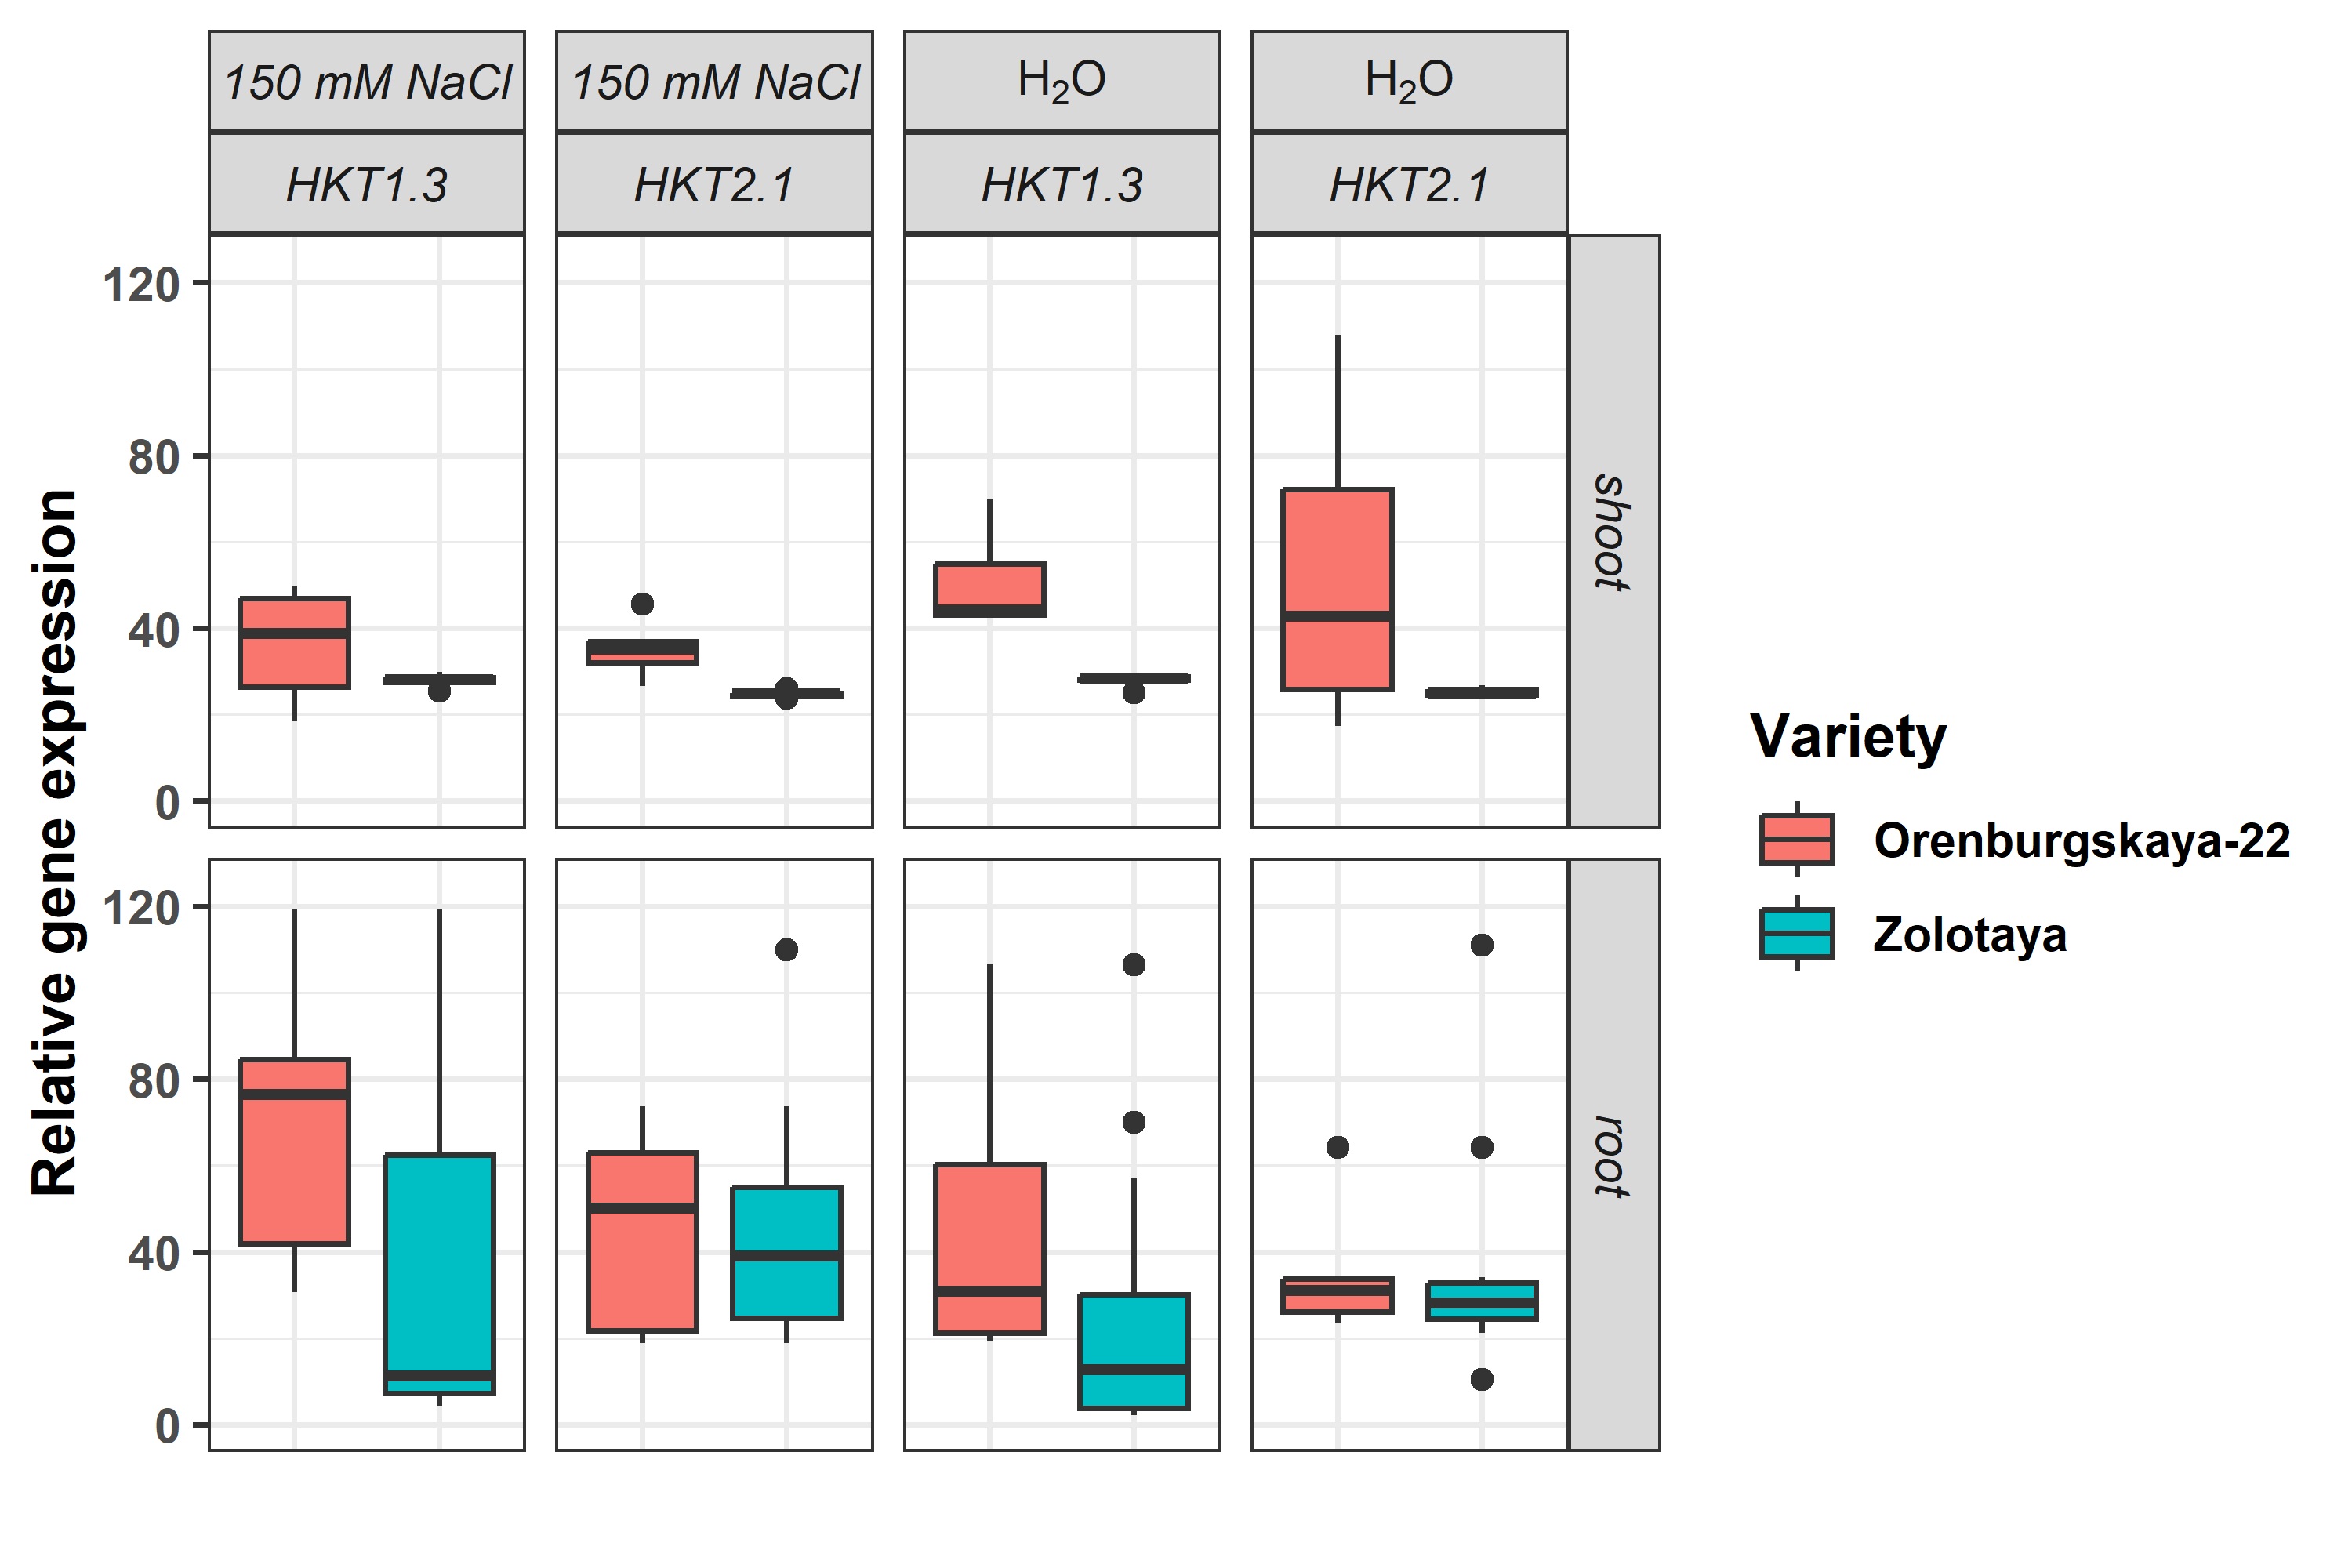 Fig. 2.
Relative expression of genes HKT1.3 and HKT2.1 in root and shoot of Orenburgskaya 22 and Zolotaya.
The level of expression of the HKT1.3 gene in the Orenburgskaya 22
variety in both roots and shoots is higher than in the Zolotaya variety (1.8
times and 1.6 times, respectively). An increase in the concentration of NaCl in
the nutrient medium leads to a change in the level of expression of the
unitrasporter ionic gene. Na
The level of expression of the HKT2.1 gene, which belongs to another family of ion transporters, in the roots of the Orenburgskaya 22 variety is 2.05 times higher than in the Zolotaya variety however, in the shoots, this ratio is significantly lower, only 1.16 times. It should be noted that the activity of the HKT 2.1 gene in the shoots exceeds the activity in the roots in the Orenburgskaya 22 variety by 1.88 times and in the Zolotaya variety by 3.35 times. Under salt stress, a decrease in the activity of the HKT 2.1 gene is observed in all cases except in the roots of the Zolotaya variety, where the expression level remains unchanged.
Thus, based on the expression of the HKT1.3 and HKT2.1 genes in wheat, one can judge both the salt tolerance and the sensitivity of the variety to the action of high salt concentrations. Based on the data presented, it can be assumed that the Orenburgskaya 22 variety has a higher tolerance to salt than the Zolotaya variety.
One of the ways of resistance to unfavorable environmental factors in plants is the use of gene regulation through epigenetic modifications. These modifications are reversible and include gene inactivation and activation. Demethylation of functionally inactive genes in response to abiotic stresses can trigger their expression. In plants, DNA methylation occurs in all three cytosine sequence contexts: CG, CHG, and CHH (where H = A, T, or C). The major classes of plant DNA methyltransferases include DRM, MET, and CMT. De novo methylation is initiated by rearranged DNA methyltransferase 2 (DRM2) through the RNA-directed DNA methylation pathway and maintained by DNA methyltransferase 1 (MET1) and chromomethylase 3 (CMT3) for CG and CHG contexts, respectively [37].
Were conducted a comparison of the expression patterns of the key DNA methyltransferases in two types of wheat varieties: those susceptible and those tolerant to salt. Throughout the experiment, we successfully amplified the genes responsible for DNA methylation, namely DRM2, MET1, CMT1, CMT2, and CMT3. Subsequently, we normalized and statistically analyzed the relative expression data obtained from reverse transcription-polymerase chain reaction (RT-PCR). Interestingly, our results indicated a significant discrepancy in the expression levels of DRM2.1, CMT3.2, and CMT1.2.
There was no evidence of a significant impact on the expression of methyltransferase genes in both durum and soft wheat based on the plant part from which they were selected. There is a notable variation in the expressivity of the DRM2.1, CMT3.2, and CMT1.2 genes across different varieties (Fig. 3). In the case of the Zolotaya variety, the overall expression level of the target sequences is higher compared to others. Furthermore, both varieties show an inclination towards increased expression of methyltransferases under favorable growth conditions. DRM2.1 in Zolotaya shows a 22.3-fold higher expression compared to Orenburgskaya-22 when grown in saline conditions. Similarly, under control conditions, the difference in expression is already 5.7-fold. These findings suggest that the transcription of specific methyltransferases DRM2.1 is suppressed in plants that exhibit tolerance to stress (Fig. 4).
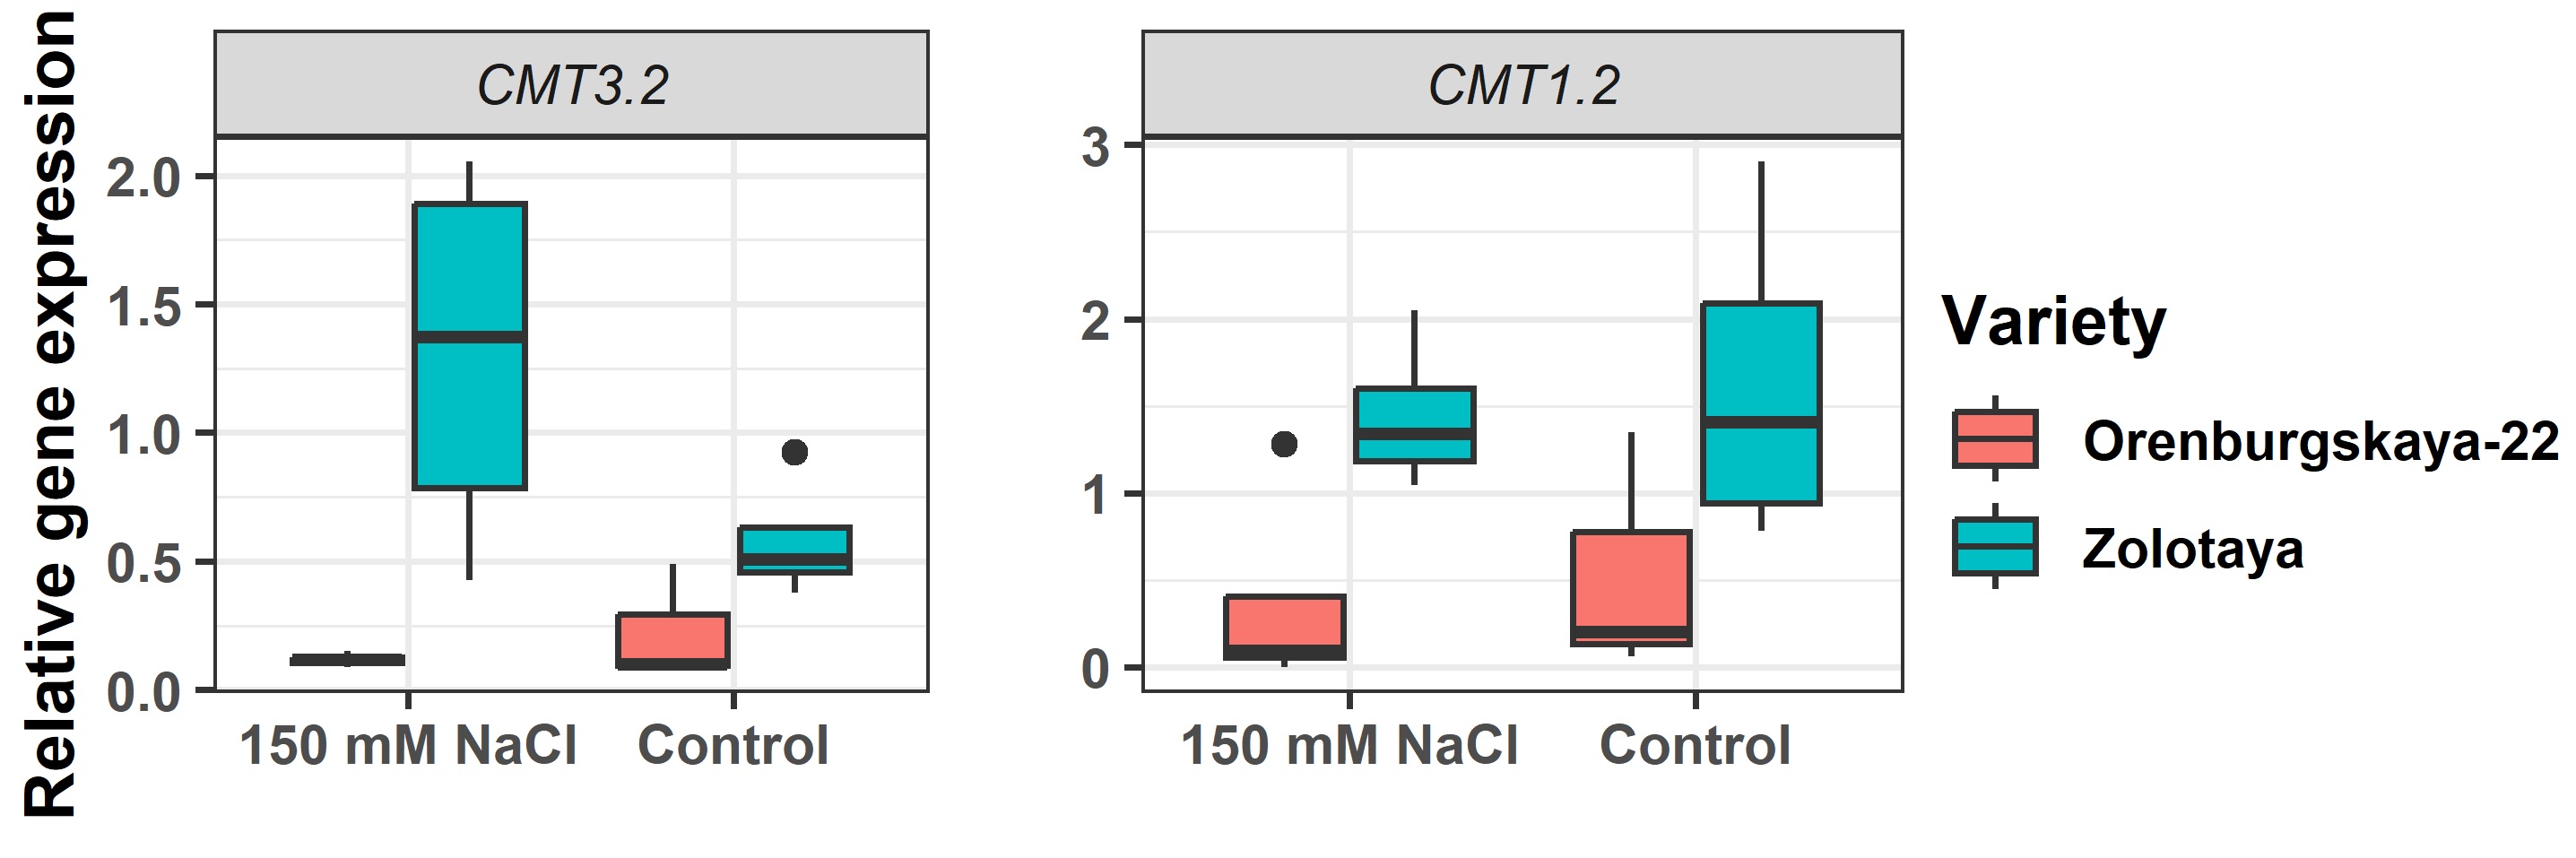 Fig. 3.
Relative expression of genes chromomethylase CMT3.2 and CMT1.2.
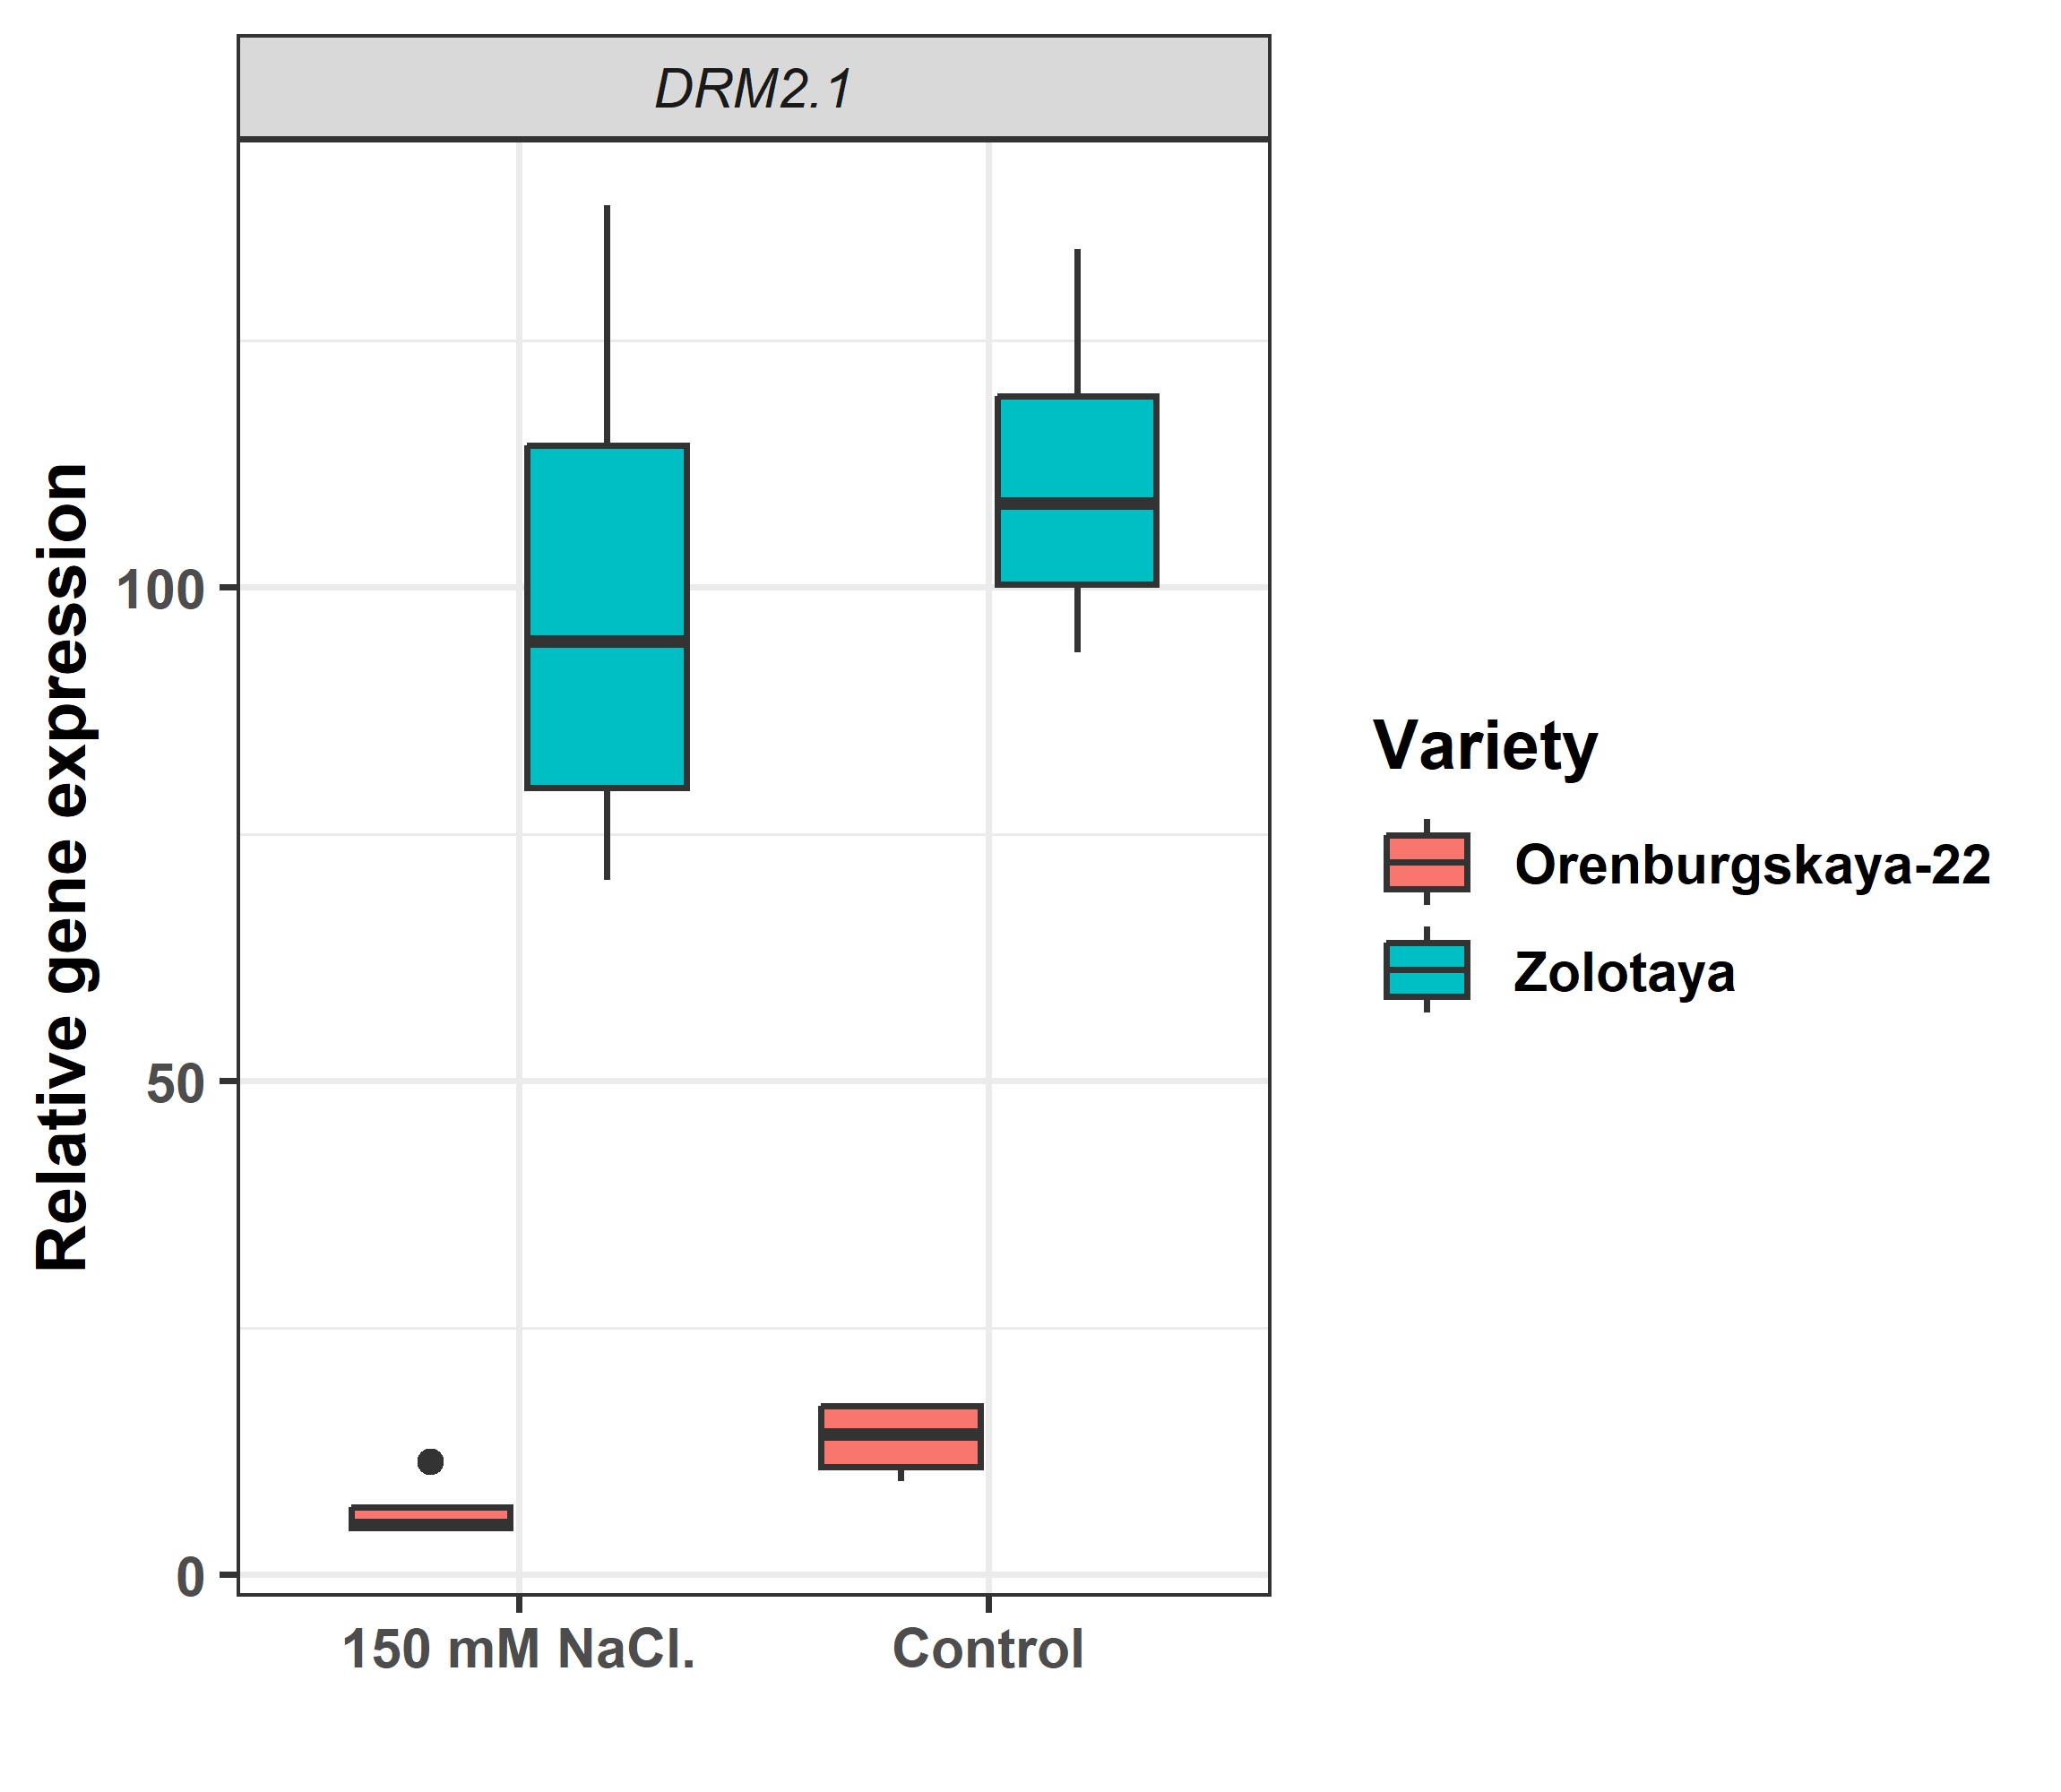 Fig. 4.
Relative expression of gene DNA methyltransferase DRM2.1.
Using the ROS marker Carboxy-H2DFF, it was found that ROS under saline conditions was visible in all root tissues, but the intensity of staining varied depending on the root zone and wheat variety. Phase contrast and fluorescence microscopy images were combined to assess the distribution of cells with elevated ROS levels in different root zones (Figs. 5,6).
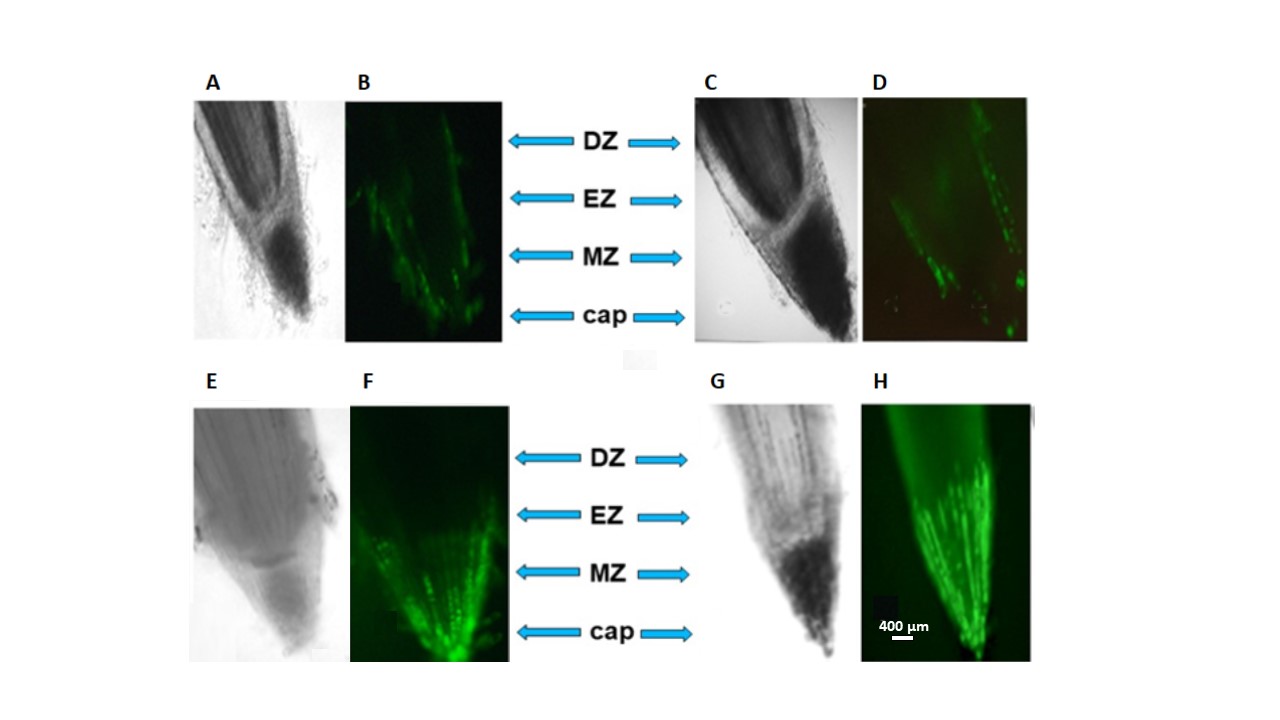 Fig. 5.
Distribution of ROS
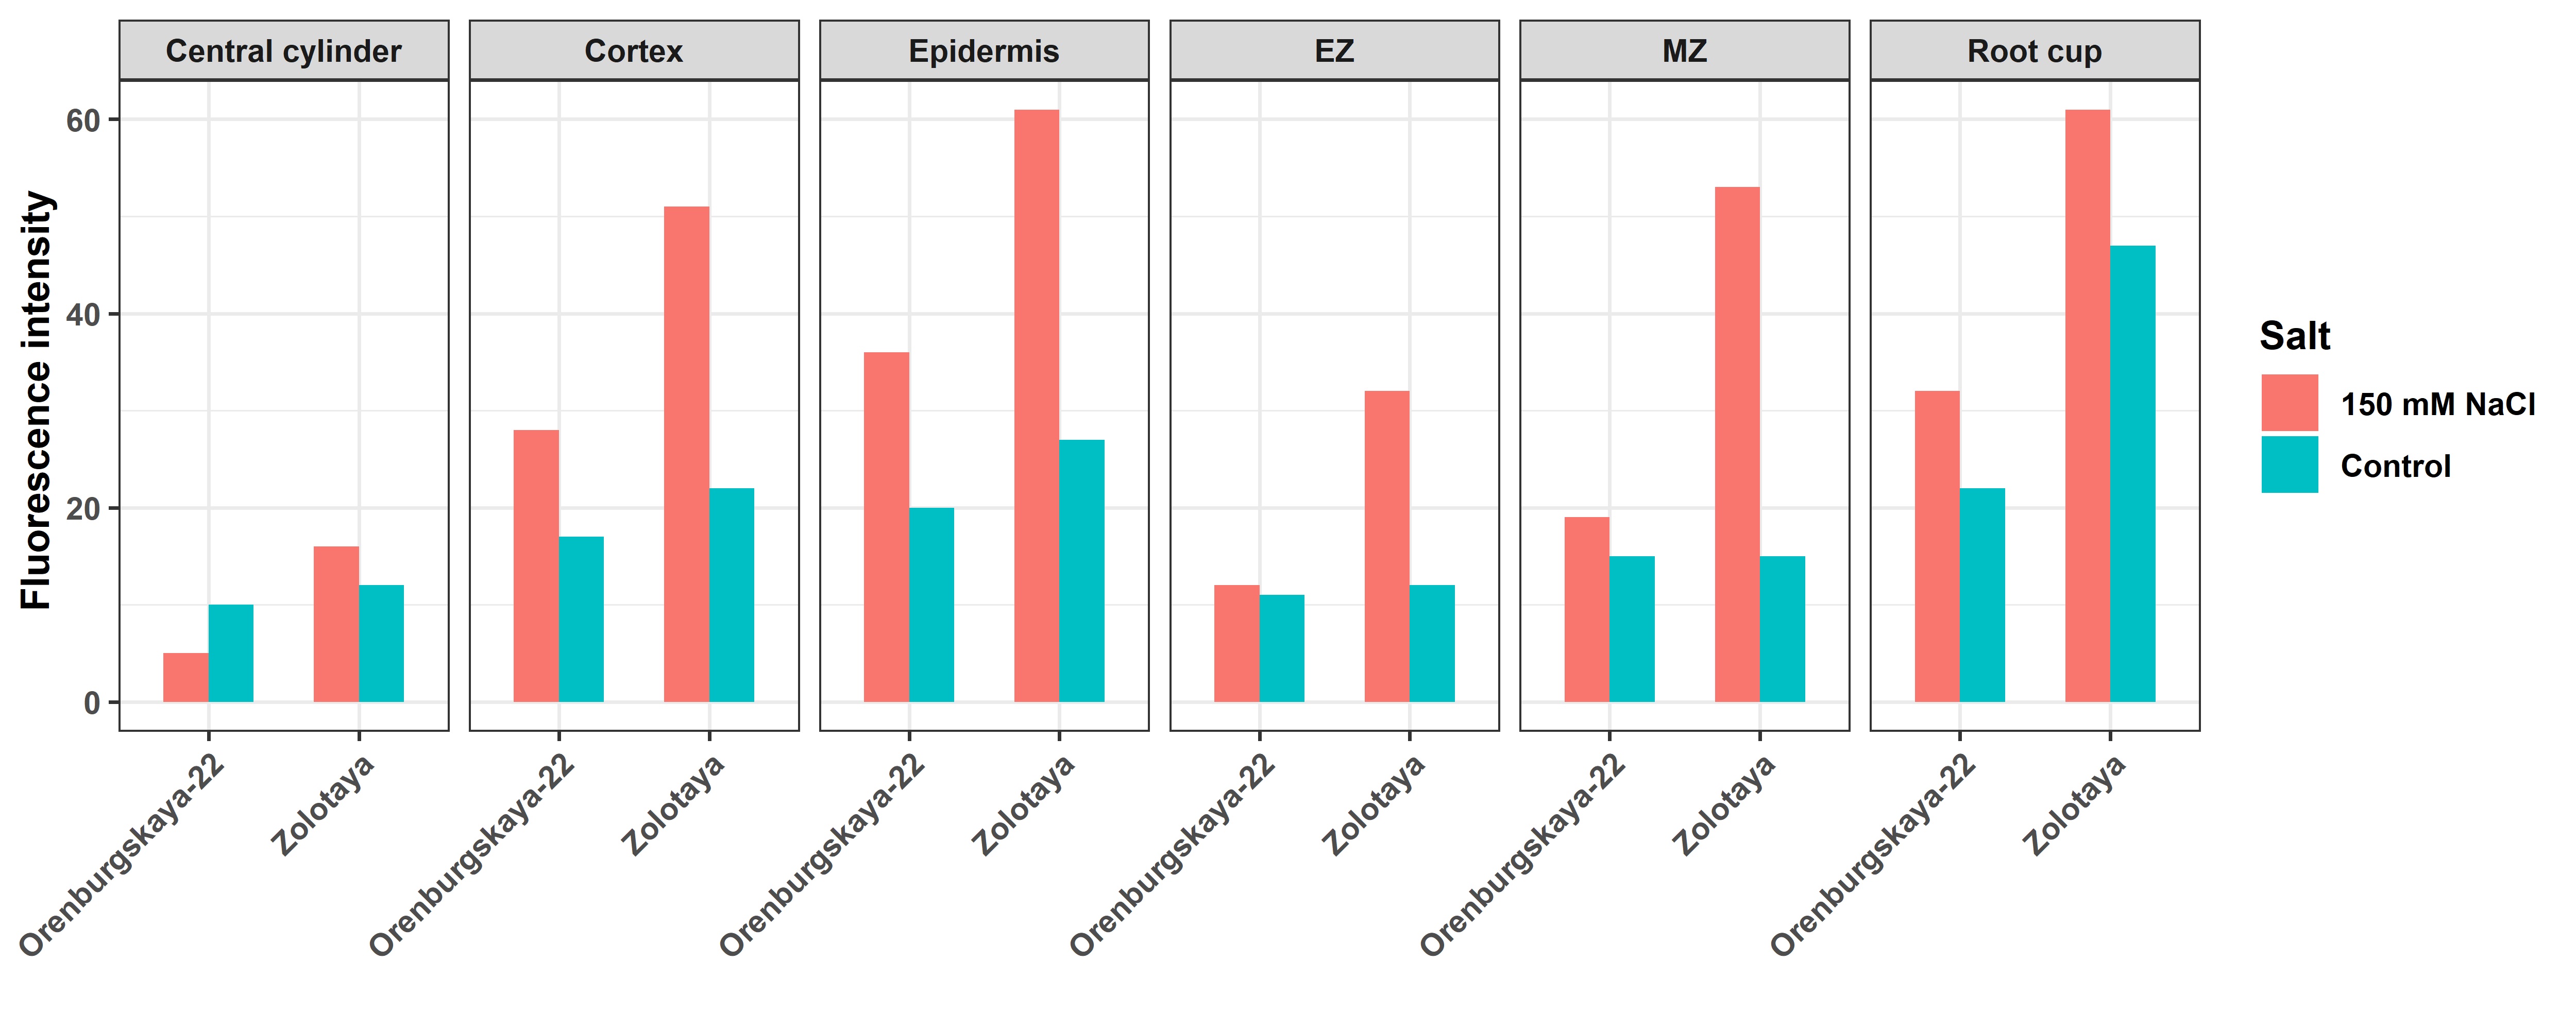 Fig. 6.
Fluorescence intensity in different zones and tissue cells of a wheat root. EZ, elongation zone; MZ, meristem zone.
Detection of ROS production using the Carboxy-H2DFF marker and the ImageJ program made it possible to establish different fluorescence intensities in the root zones and tissues of wheat. In the Orenburgskaya 22 variety, at high NaCl concentrations, the most intense fluorescence is observed in the cap zone; in the Zolotaya variety, in the zones of the cap and root meristem. Moreover, compared to the control, in both varieties, the increase in ROS at the tissue level occurs to a greater extent in the cells of the epidermis and cortex. Therefore, to study the effect of oxidative stress caused by salinity, it is preferable to use epidermal and cortical cells from the cap and elongation zones.
The antioxidant system protects the plant from oxidative stress. Free radical oxidation is a series of branched reactions that are triggered by different types of ROS and lead to the formation of various molecular breakdown products [38, 39, 40]. The AOA value of both wheat varieties showed the same trend with only slight differences. In particular, for the roots of the Orenburgskaya 22 variety it was 1.05 times higher than for the Zolotaya variety. Similarly, in shoots of the Zolotaya variety, the AOA value was 1.05 times higher than in Orenburgskaya 22 (Table 2). The presence of abiotic stress led to a decrease in the level of AOA compared to control variants.
| Wheat variety | Orenburgskaya 22 | Zolotaya | ||
| Roots | Shoots | Roots | Shoots | |
| Control | 58.28 |
51.43 |
55.44 |
53.82 |
| 150 mM NaCl | 53.42 |
47.5 |
34.32 |
35.18 |
Data were obtained from three repetitions. Data are expressed as means
From the indicators presented in Table 2, it follows that the AOA values in the Orenburgskaya 22 variety after exposure to salt stress fell slightly: in the roots by 1.09 times, in the shoots by 1.08 times. In the Zolotaya variety, changes in AOA are more significant. The drop in AOA in the roots was 1.61 times, and in the shoots –1.53 times.
ROS regulates the expression of many genes, which in turn regulates a wide range of biological activities, including development, defense against pathogens, responses to abiotic stress, growth, cell cycle, and PCD. Salt stress has been demonstrated to increase SOD activity, suggesting a link between higher ROS production and a defense mechanism that reduces stress-induced oxidative damage [19]. Depending on the metal interacting with the active site, enzymes can be divided into three types: FeSOD, MnSOD, and Cu/ZnSOD. Cu/ZnSOD, which are mainly located in chloroplasts, cytoplasm, and/or extracellular space, are present in some bacteria and all eukaryotic species, while MnSODs are mainly found in plant mitochondria. FeSOD is common in prokaryotes and protozoa, usually localized in chloroplasts and plant cytoplasm.
The response of the enzymatic antioxidant system to abiotic stresses in plants can be considered both as a change in the level of enzymatic activity and a change in the level of expression of genes encoding enzymes of the antioxidant system. In our study, we studied the expression of the MnSOD and Cu/ZnSOD genes. The level of expression of the MnSOD and Cu/ZnSOD genes in the Orenburgskaya 22 is dramatically higher than in the Zolotaya variety (Fig. 7).
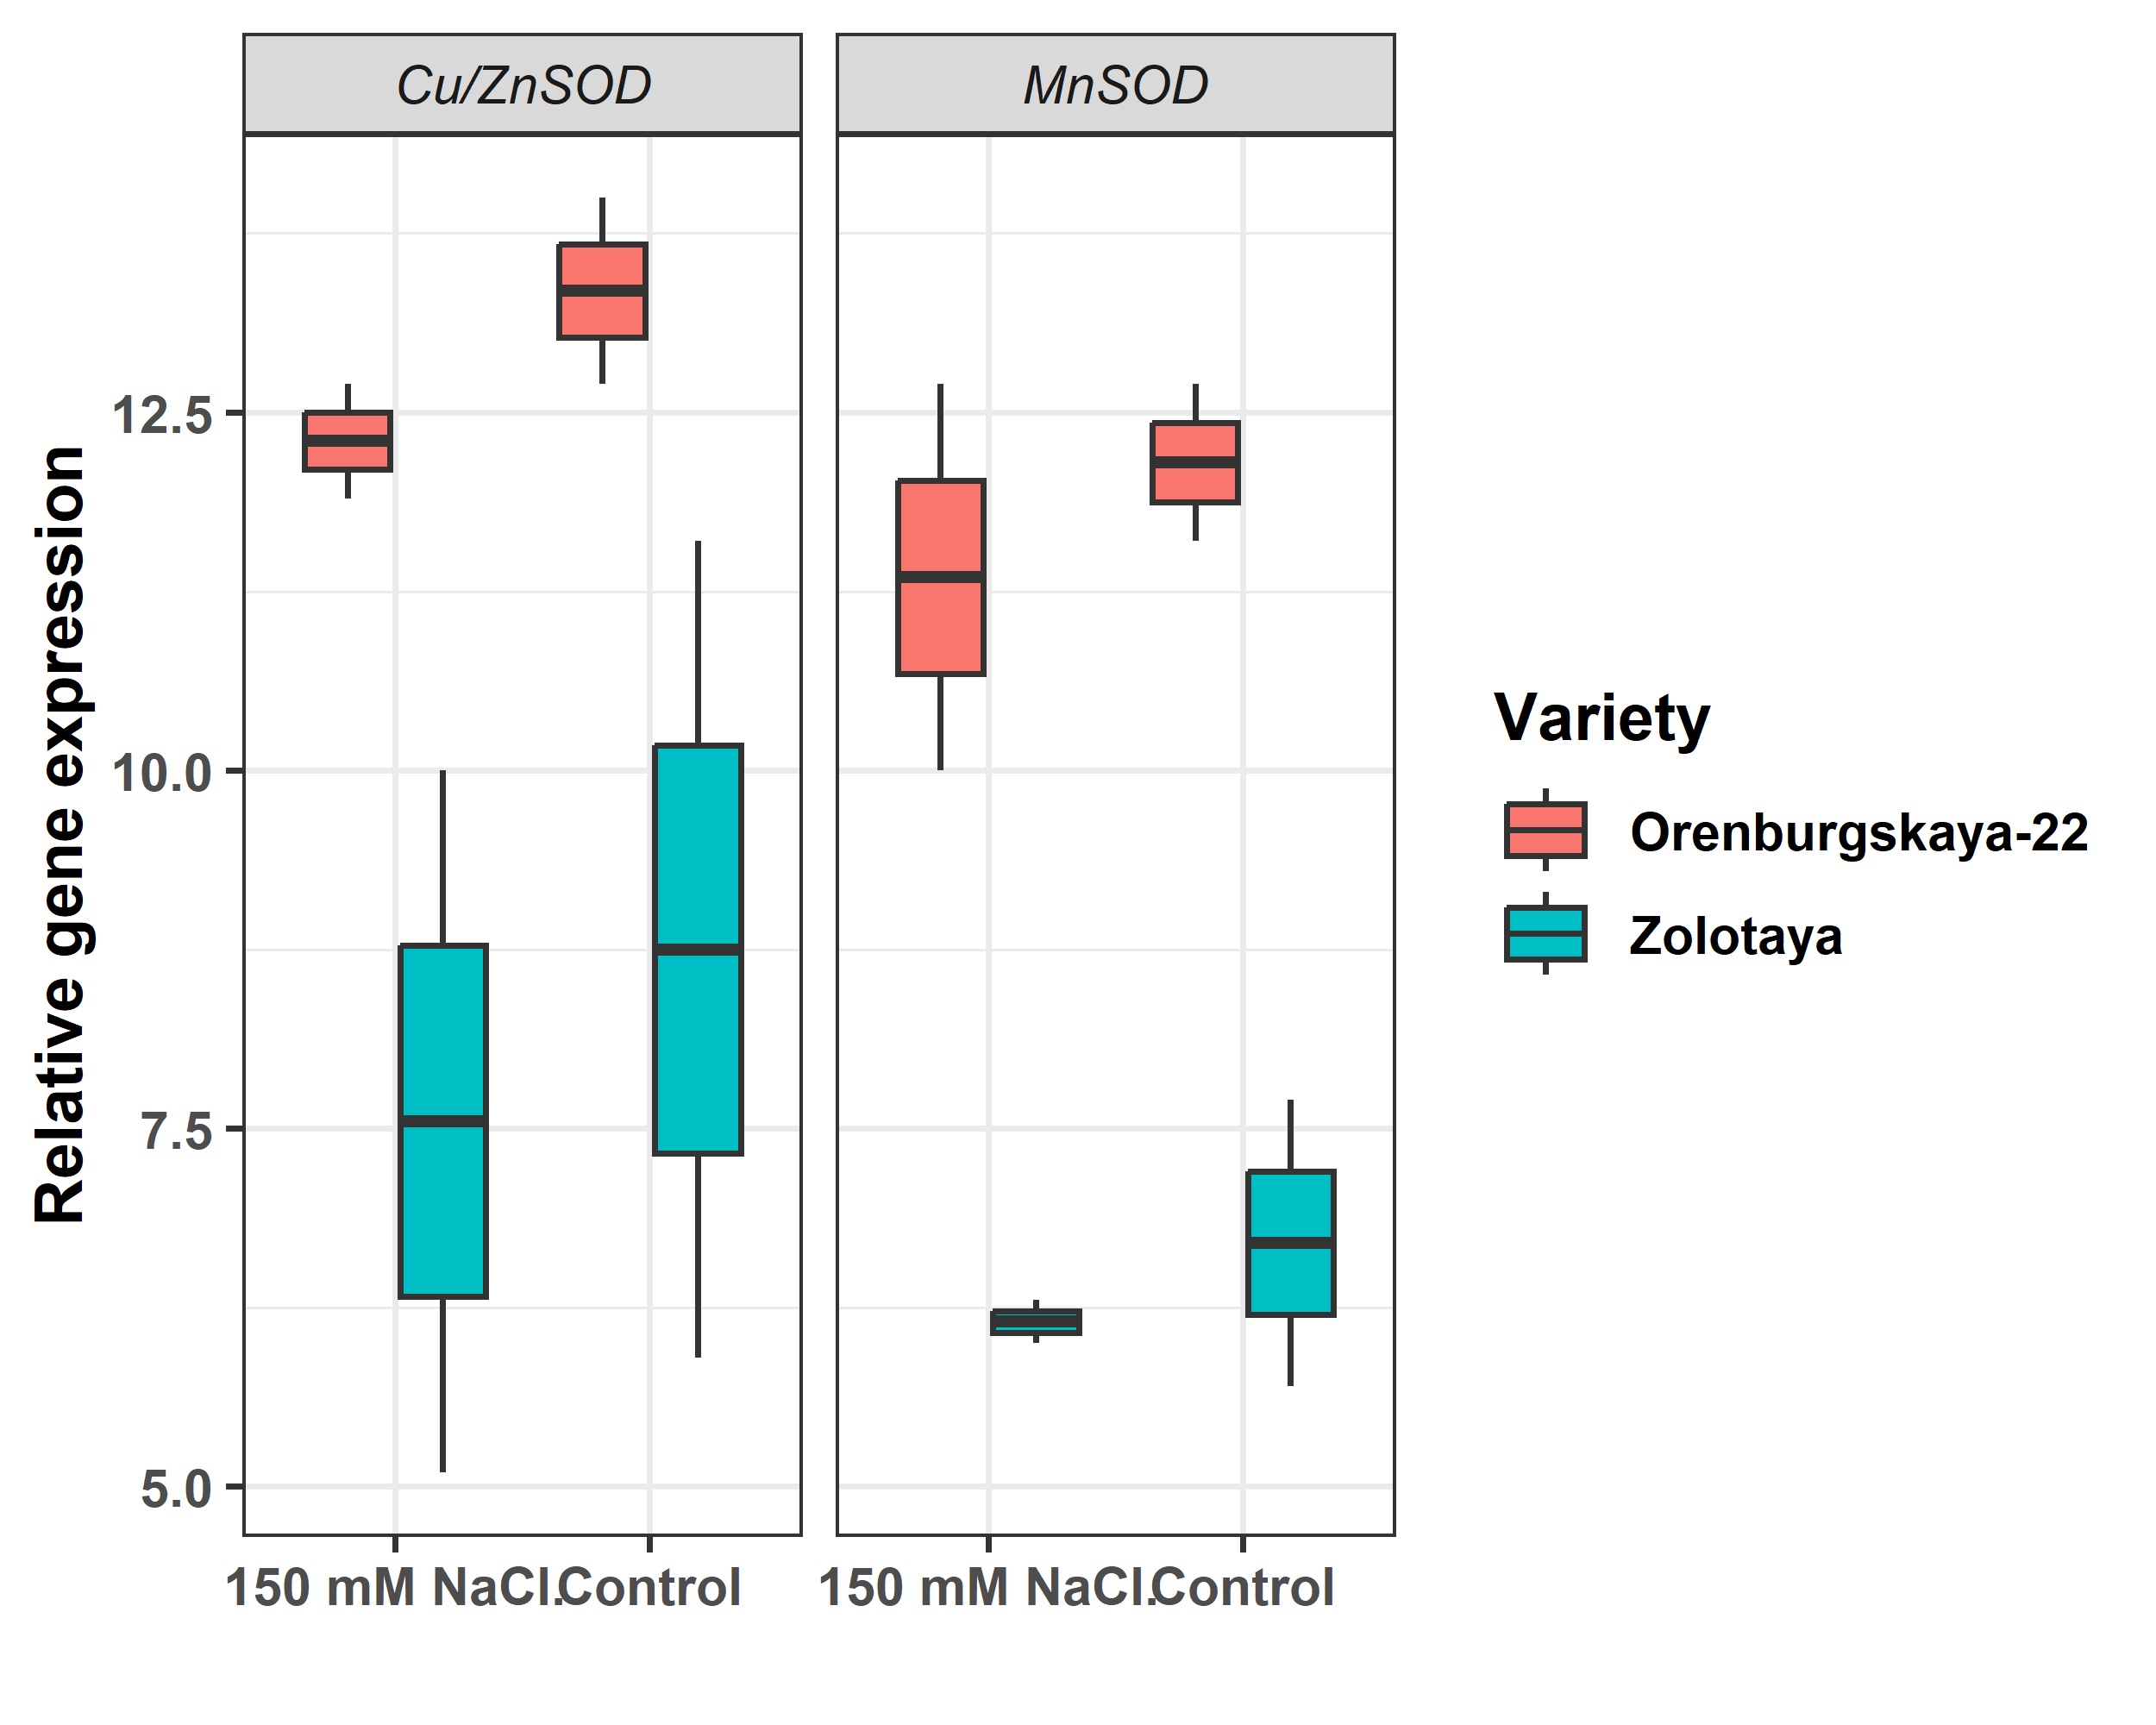 Fig. 7.
Relative expression of genes Cu/ZnSOD and MnSOD in root.
The expression level of the MnSOD and Cu/ZnSOD genes in the Orenburgskaya 22 variety is sharply higher than in the Zolotaya variety by 1.54 and 1.85 times, respectively (Fig. 7). The presence of NaCl in the external environment leads to a decrease in the expression level of the mitochondrial gene MnSOD in the Orenburgskaya 22 wheat varieties by 9% in the roots. There is also a slight decrease in the level of expression of the chloroplast gene Cu/ZnSOD (by 7%) in the roots of the Orenburgskaya 22 variety in the presence of NaCl. The decrease in the expression level of the MnSOD gene in the roots of the Zolotaya variety is almost similar to the Orenburgskaya 22 variety (by ~10%). However, the decrease in the expression level of the Cu/ZnSOD gene in the Zolotaya variety under the influence of NaCl is more significant (by ~17%). Based on these indicators, it can be concluded that more ROS can be accumulated in the Zolotaya variety under the action of NaCl as a result of less ROS detoxification from root cells.
Plants have developed complex defenses against abiotic stresses. However, the mechanisms of this protection can vary greatly not only between developing plant species, but also within the same species. Depending on the type of stress, its intensity and duration of exposure, plants either adapt to it or die. This study examined different methods for controlling dying cells in wheat of different genotypes.
The characterization of viability under salt stress in two varieties of wheat was conducted through Trypan blue staining of coleoptiles. Trypan blue specifically infiltrates the membranes of deceased cells, aiding in the determination of tissue damage caused by salinization and the count of lifeless cells (Fig. 8). The coleoptiles exhibited nearly no visible alterations in the control group, whereas the presence of sodium chloride resulted in significant tissue damage, which varied according to the wheat variety. Consequently, in the Zolotaya variety, when exposed to NaCl, 4 times more dead cells were recorded compared to the Orenburgskaya 22 variety. The sensitivity of the Zolotaya wheat variety is further supported by the Trypan Blue staining analysis performed on the coleoptile. In the face of high concentrations of NaCl, the Orenburgskaya 22 variety demonstrates higher cell viability within the wheat coleoptile compared to the Zolotaya variety.
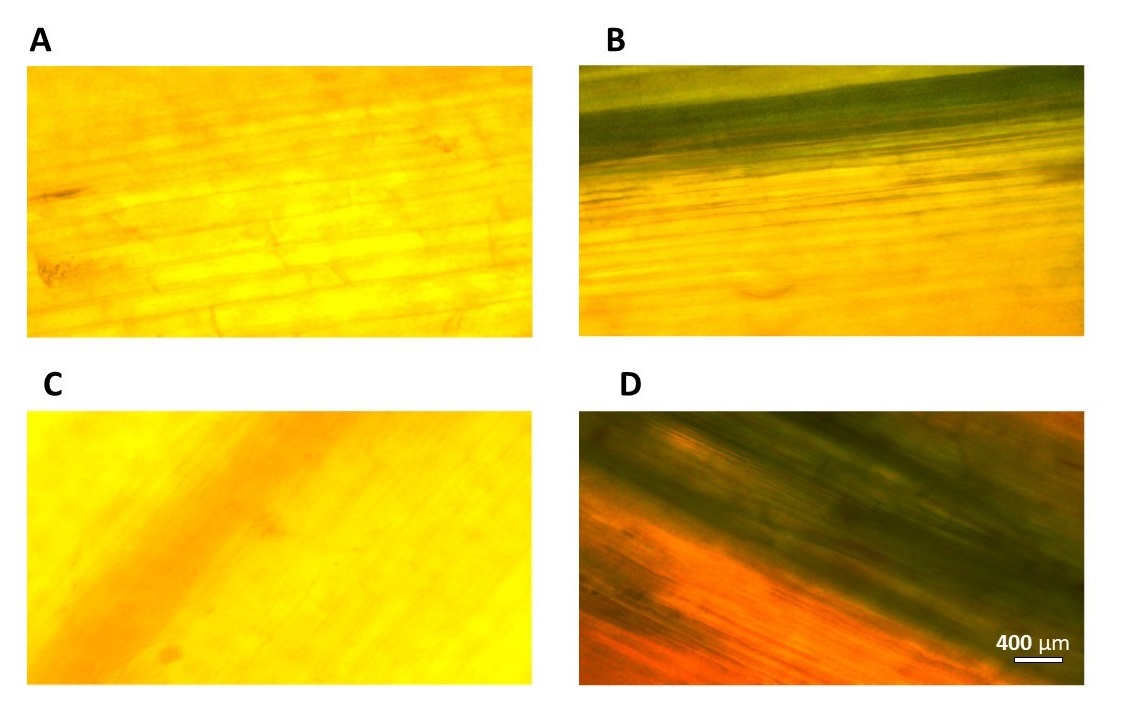 Fig. 8.
Staining of 6-day-old seedlings with coleoptile trypan blue, differing in the number of dead cells. (A,B)—Orenburgskaya 22; (C,D)—Zolotaya; (A,C)—control; (B,D)—150 mM NaCl. Bar 400 microns.
There are two known pathways of PCD: the “apoptosis-like” pathway, characterized by DNA breaks, release of cytochrome c from mitochondria and transfer of phosphatidylserine to the outer layer of the membrane, and the “vacuolar death” pathway, characterized by the formation of large vacuoles and autophagosomes [28].
Apoptosis analysis was carried out on enzymatically macerated preparations of root cells of seedlings of the resistant and saline wheat variety Zolotaya. Phosphatidylserine was detected using Annexin V-FITC (Fig. 9A,B); propidium iodide did not stain the DNA of these nuclei. Phosphatidylserine was found on the surface of 8% of root cells of 6-day-old Zolotaya seedlings.
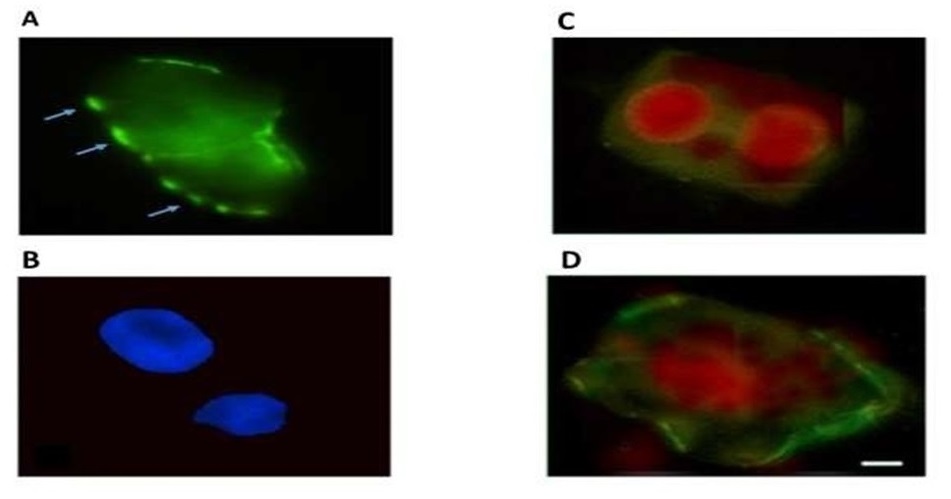 Fig. 9.
Localization of phosphatidylserine on the surface of plasma membranes of root cells of 6-day-old seedlings of Triticum durum variety Zolotaya in the presence of 150 mM NaCl. (A)—Clusters of phosphatidylserines on surface plasmatic membranes (Annexin V-FITC), blue arrows; (B)—nuclei of cells (4,6-diamidino-2-phenylindole (DAPI)), (C,D)—Localization of phosphatidylserine (green) on the surface of plasma membranes and propidium iodide into nuclei (red) of root cells of 6-day-old seedlings of Triticum aestivum variety Orenburgskaya 22 (C) and Triticum durum variety Zolotaya (D) after exposure of 150 mM NaCl. Bar 200 µm.
Under the influence of salt stress, phosphatidylserine is detected on the outer layer of the plasma membrane in 8% of the cells of variety Zolotaya, while the cell nuclei are stained with propidium iodide, which indicates their necrotic death (Fig. 9C,D).
TUNEL method for a detection of double stranded breaks in DNA [41] of susceptible and resistant wheat variety was performed as well (Fig. 10). In the salt-tolerant variety Orenburgskaya 22, DNA breaks were observed in 0.4% of control cells and in 19% of cells in the presence of NaCl. Cleavages were observed in mid-mitotic chromosomes and micronuclei. In the salt-tolerant variety Zolotaya, DNA breaks were observed in 0.5% of control cells and in 32% of cells in the presence of NaCl.
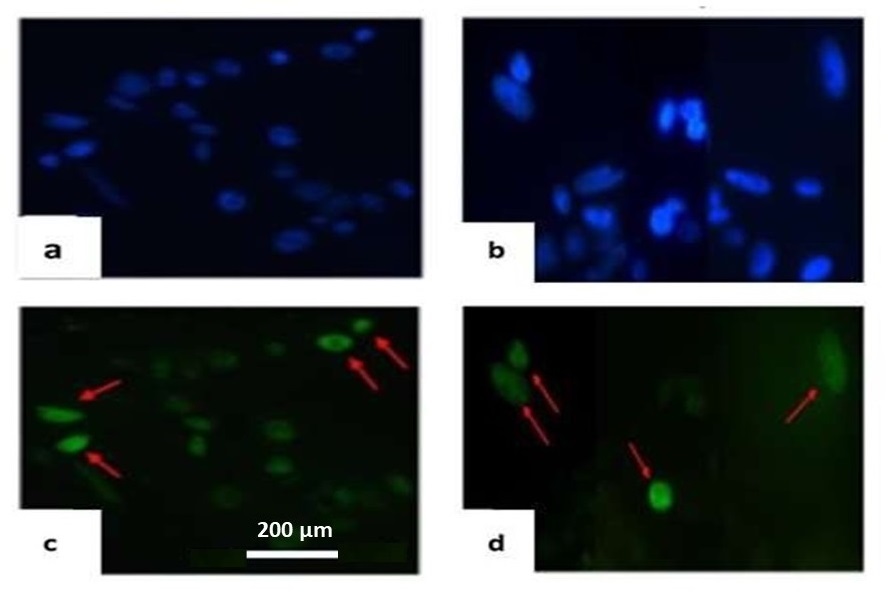 Fig. 10.
DNA breaks in the nuclei of cell tissues of the roots of 6-day-old seedlings of Triticum aestivum variety Orenburgskaya 22 (a,c) and Triticum durum variety Zolotaya (b,d) in the presence of 150 mM NaCl, detected by the TUNEL method. (a,b)—root cell nuclei (DAPI); (c,d)—chromosomes with DNA breaks (arrows—red). Bar 200 µm.
In the salt-tolerant variety Orenburgskaya 22, DNA cleavage was observed in 0.4% of control cells and in 8% of cells in the presence of NaCl. In the salt-sensitive variety Zolotaya, DNA breaks were observed in 0.5% of control cells nuclei and in 15% of cells in the presence of NaCl.
An increased concentration of NaCl leads to disruption of the permeability of the mitochondrial membrane and the release of cytochrome c from the mitochondrion into the cytoplasm is observed. Immunodetection of cytochrome c was carried out in the cytoplasm of root cells (Fig. 11). Cytochrome c was detected in the cytoplasm of 29% of Orenburgskaya 22 cells after exposure to NaCl, whereas in sodium chloride-sensitive Zolotaya it was found in the cytoplasm of 41% of cells.
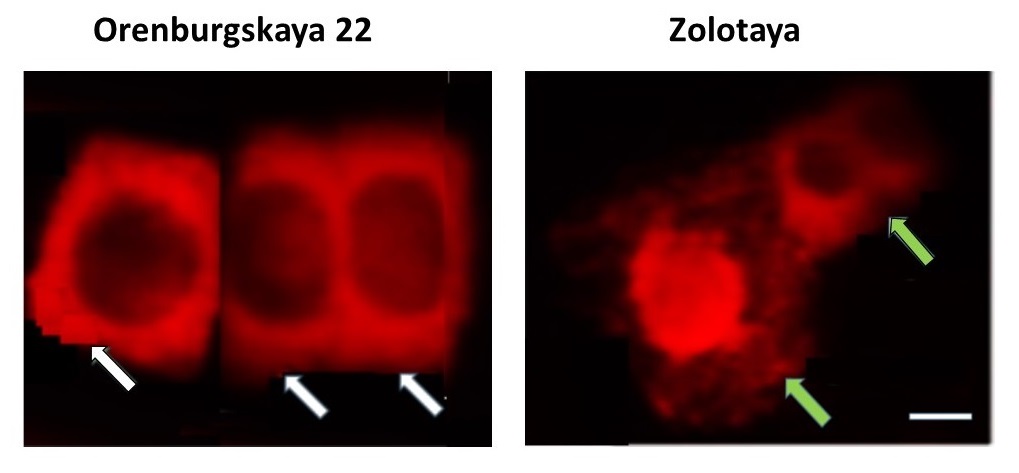 Fig. 11.
Cytochrome c in mitochondria and in the cytoplasm of root tissue cells of 6-day wheat seedlings Orenburgslaya 22 and Zolotaya. Mitochondria in living cells (green arrows) and cytochrome c in the cytoplasm (white arrows) at the stage of death in the presence of 150 mM NaCl, Bar 200 µm.
The use of PCD markers in stable Orenburgskaya 22 and unstable Zolotaya cells did not lead to the transfer of phosphatidylserine to the cell surface. However, DNA fragments were identified in the nuclei and metaphase chromosomes, as well as the release of cytochrome c into the cytoplasm, suggesting a mitochondrial pathway responsible for the death of some root cells under salinity [42, 43]. We found such death markers in a larger number of cells only in the salt-tolerant variety Zolotaya, where cells with surface phosphatidylserine were also found.
Thus, based on the data obtained using cell death markers, a conclusion can be drawn: the two wheat varieties, Orenburgskaya 22 and Zolotaya, with different genotypes, have different tolerance to salt effects. The maximum number of DNA breaks was formed in the salt-sensitive Zolotaya variety; it was 2 times greater than in the Orenburgskaya 22 variety. Salt exposure also caused damage to the outer membrane of mitochondria and the release of cytochrome c, which indicates the mitochondrial pathway of cell death under stress [44]. However, some cells die along the necrotic path. It was noted that there were more necrotic cells under the influence of NaCl in the Zolotaya variety than in the salt-tolerant Orenburgskaya 22 variety.
Plants are constantly exposed to various environmental influences. These impacts can be both long-term and short-term and vary in intensity. Depending on the mechanisms triggered by plants in response to stress, it is possible to determine their tolerance to stress, rapid acclimatization, and, finally, adaptation to the stress factor. One of the most common abiotic factors affecting the growth and productivity of agricultural crops is salt stress. Salinity causes ion toxicity, leads to osmotic stress, and ultimately causes oxidative stress [3, 5].
High concentrations of sodium chloride have a negative impact on the development of both wheat varieties, Orenburgskaya 22 and Zolotaya. According to morphometric indicators, the soft wheat variety Orenburgskaya 22 shows greater resistance to salt stress than the durum wheat variety Zolotaya (Table 3).
| Orenburgskaya 22 | Zolotaya | ||
| Shoot | Root | Shoot | Root |
| Morphometric parameters | |||
| Decrease by 1.15 times | Decrease by 1.06 times | Decrease by 1.91 times | Decrease by 1.24 times |
| Expression of HKT genes | |||
| HKT1.3 | |||
| Increase by 1.95 times | Decrease by 1.6 times | Increase by 1.68 times | Without change |
| HKT2.1 | |||
| Decrease by 1.7 times | Decrease by 1.48 times | Decrease by 1.67 times | Without change |
| Expression of genes of DRM2.1 | |||
| Decrease by 3.75 times | Decrease by 1.97 times | ||
| ROS, total fluorescence intensity, rel. units | |||
| Increase by 1.41 times | Increase by 2.28 times | ||
| AOA | |||
| Decrease by 1.08 times | Decrease by 1.09 times | Decrease by 1.53 times | Decrease by 1.61 times |
| Expression of SOD genes | |||
| MnSOD | |||
| Increase by 0.9 times | Decrease by 1.04 times | ||
| Cu/ZnSOD | |||
| Decrease by 1.16 times | Decrease by 1.16 times | ||
| % Dead cell | |||
| 15% | 59% | ||
| Release of phosphatidylserine from mitochondria | |||
| 0% | 8% | ||
| % DNA break | |||
| 19% | 32% | ||
| Release cytochrome c from mitochondria | |||
| 29% | 41% | ||
One of the most important consequences of salt stress is the accumulation of
Na
An increase in salt content leads to changes in chromatin structure, sometimes dramatic ones. The processes of restructuring the chromatin structure lead to changes in the regulation of the expression of a number of genes. Chromatin condensation is regulated primarily by DNA methylation-demethylation. The unique DNA methyltransferase DRM2, which is found only in plant objects, is responsible for post-translational methylation of cytosine DNA residues. As a result of the effect of NaCl on the roots of seedlings of both wheat varieties, a decrease in the expression of the DRM2.1 gene is observed, especially in the Orenburgskaya 22 variety. It is believed that methylation of cytosine residues leads to gene silencing. It can be assumed that a decrease in the activity of the DRM2.1 gene in wheat of both varieties leads to an increase in the activity of genes involved in protection against the negative effects of NaCl.
ROS are a necessary component of normal cellular metabolism and important signaling molecules involved in the regulation of many physiological processes associated with plant growth and development [46]. Under abiotic stress in plants, changes occur in various biochemical and physiological processes, leading to an excess of ROS production. To protect against the negative effects of excess ROS in plants, a number of reactions are launched that are involved in their neutralization of excess ROS [47, 48].
ROS localization in two wheat varieties under abiotic stress conditions was visualized using the ROS marker Carboxy-H2DFF. ROS production was visualized in all root tissues but with different staining intensities. In the presence of 150 mM NaCl, an excess of ROS was formed in the roots of both wheat genotypes. The accumulation of ROS in the cells and tissues of the roots of wheat seedlings under the influence of oxidative stress indicates a disruption of ROS homeostasis. The total amount of ROS, according to fluorescence microscopy, in the roots of the Orenburgskaya 22 variety in the presence of 150 mM NaCl increases by 1.41 times and in the roots of the Zolotaya variety by 2.28 times.
Higher expression levels of both mitochondrial MnSOD and chloroplast Cu/ZnSOD in the Orenburgskaya 22 variety compared to the Zolotaya variety may indicate that MnSOD and Cu/ZnSOD in Orenburgskaya 22 are more involved in the process of converting superoxide ions into peroxide than in the variety Golden. Since mitochondria are involved in the respiratory process, and the formation of ROS mainly occurs in mitochondria, the contribution of MnSOD, which is localized mainly in mitochondria, to the process of neutralizing ROS is higher than that of Cu/ZnSOD, which is localized in chloroplasts and is more significant. Under salt stress, there is a slight decrease in the expression level of SOD genes in both wheat varieties. Only the drop in the level of expression of chloroplast Cu/ZnSOD in the Zolotaya variety is more significant than in the Orenburgskaya 22 variety.
Comparing these data, it can be assumed that the effect of NaCl for the Zolotaya variety is more dramatic; it leads to an increase in excess ROS, while the AOS enzymatic system cannot cope with the process of neutralizing ROS. Although the expression level of MnSOD and Cu/ZnSOD decreases slightly, the decrease in total AOA is more dramatic compared to the Orenburgskaya 22 variety. It is likely that in the Orenburgskaya 22 variety, non-enzymatic AOS is activated during NaCl toxicity.
Low molecular weight non-enzymatic antioxidants, including glutathione,
When determining total AOA using the DPPH reagent, alcohol extraction is used, as a result of which low molecular weight compounds, including low molecular weight antioxidants, are extracted. Inhibition (%) of the oxidation process has similar values, with a slight advantage in the roots of the Orenburgskaya 22 variety and a slight advantage in the leaves of the Zolotaya variety. However, under salt stress, there is a more significant decrease in AOA in the roots of the Zolotaya variety by 1.61 times and only by 1.09 times in the Orenburgskaya 22 variety.
Kiani R and co-authors [51] showed that total phenolic compounds and flavonoids increased in response to salt stress in wheat. It was found that there is a genotypic difference in AOA. These results are also consistent with those obtained by Kumar and co-authors [52], who found genotypic variation in wheat seedling shoots in response to salt stress.
When exposed to stress factors, plants either acclimatize or adapt to them. Depending on the mechanisms triggered by plants in response to stress, it is possible to determine their tolerance to stress, rapid acclimatization, and, finally, adaptation to the stress factor. Light stress can activate the plant’s adaptation mechanisms to this stress factor and is beneficial for the plant. More intense and prolonged stress is negative for the plant and is accompanied by slower growth and significant morphological changes and often leads to the death of the plant.
Using PCD markers in cells of the resistant variety Orenburgskaya 22, in comparison with the unstable variety Zolotaya, no transfer of phosphatidylserine to the cell surface was observed. However, DNA breaks were detected in the nuclei and metaphase chromosomes, as well as the release of cytochrome c into the cytoplasm, which indicates the mitochondrial pathway of death of some root cells during salinity. We observed similar death markers only in a larger number of cells in the salt-sensitive variety Zolotaya, where cells with surface phosphatidylserine were also found. In addition, necrotic cells were identified in the roots of the Zolotaya variety. Thus, a comprehensive study of tolerance to salt stress in different wheat genotypes makes it possible to identify the characteristics of protective mechanisms and recommend the use of a highly tolerant variety for agricultural cultivation
Thus, it was revealed that the accumulation of toxic ions under salt stress is accompanied by the accumulation of ROS. Excess ROS triggers the PCD process. The two different wheat genotypes have different mechanisms of protection against the negative effects of sodium chloride. A comprehensive study of resistance to salt stress in different wheat genotypes makes it possible to identify the characteristics of protective mechanisms and recommend the use of a highly tolerant variety for agricultural cultivation.
Data are contained within the article.
MPV performed PCR, designed and prepared figures, evaluated the data, and wrote; NIB performed PCR, designed and prepared figures, evaluated the data, and wrote; NVK performed light and fluorescent microscopy, evaluated the data, and wrote; EML performed light and fluorescent microscopy, evaluated the data, and wrote; LIF designed and performed biochemical experiment, and wrote and finalized the manuscript. All authors have read and agreed to the published version of the manuscript. All authors have participated sufficiently in the work and agreed to be accountable for all aspects of the work.
Triticum durum Desf Zolotaya and Triticum aestivum L. Orenburgskaya 22 originate in the Orenburgskaya 22 Research Institute of Agriculture of the steppe ecological group (FSBIS Scientific Center of the Russian Academy of Sciences, Orenburg, Russia).
Not applicable
The reported study was supported by FGUM-2022-0003 of the Ministry of Science and Higher Education of the Russian Federation.
The authors declare no conflict of interest.
References
Publisher’s Note: IMR Press stays neutral with regard to jurisdictional claims in published maps and institutional affiliations.